
Wake Up, America: China Is Overtaking the United States in Innovation Capacity

Based on key indicators of innovation and advanced-industry performance, China has surpassed the United States in total innovation output and is getting close on a proportional basis. To regain its leadership, the United States must respond more strategically and forcefully.
KEY TAKEAWAYS
Key Takeaways
Contents
China’s Innovation Policy History 6
2006–2010: Indigenous Innovation, Thousand Talents, and Strategic Emerging Industries 6
China’s Ability to Innovate. 10
A Common Misconception: China Cannot Innovate. 10
The Reality: China Can Innovate. 11
Undergraduate Degrees Awarded. 24
Doctoral Degrees Awarded per Capita. 28
Summary of Innovation Inputs 31
Science and Engineering Articles 32
Top-Cited Science and Engineering Articles 36
International Patent Families 38
Summary of Innovation Outputs 46
Production in High-R&D Industries 46
Value Added in Advanced Industries 48
Exports in Advanced Industries 52
Mobile Cellular and Fixed Broadband Subscriptions 57
Summary of Innovation Outcomes 61
China’s Challenges Going Forward. 64
Proportional and Gross-Output Indices 69
University Weighted Scoring Method. 71
E-Government Development Index 74
Introduction
The last decade was marked by dramatic evolution in China’s innovation capabilities and strategies, much of which was driven by the transition of Chinese Communist Party (CCP) and state leadership from Hu Jintao and Xi Jinping and the introduction of China’s latest major innovation policy framework: Made in China 2025 (MIC). This report updates an earlier ITIF report, applying more recent data to assess the progress China made during the previous decade with respect to the United States across a series of innovation indicators.[1]
Innovation means different things to different people, in part because there are so many different kinds of innovation. One kind is catch-up or copying innovation, wherein China has performed superbly. Another is new-to-the-world or frontier innovation. China’s capacity for the latter is one of the most important unknowns in the global economy. Many countries have tried and failed to make the transition from “imitator” to “innovator,” and China’s ability or inability to fully make that transition will largely define global geopolitical development in the decades to come. If China can surpass the United States in innovation—both catch-up and frontier—the global value chain (GVC) for the highest-value-added products stands to undergo a tremendous change. This would represent a serious economic and geopolitical challenge to the United States and its allies, particularly because of China’s predatory trade and innovation policy practices.
The Goal of This Report
This report looks back on the previous decade and gauges the progress China made relative to the United States in a series of innovation indicators. The indicators are grouped into three categories: innovation inputs, innovation outputs, and innovation outcomes. By reviewing a range of indicators, one can develop a better understanding of where China is or is not making progress, specifically relative to the United States.
Furthermore, many analyses of innovation focus on a collection of indicators that is too narrow. Specifically, many analyses devote too much attention to traditional measures of innovation such as research and development (R&D) intensity and patent output. While the accumulation of knowledge and inventiveness are certainly necessary for innovation, commercialization in the marketplace is an equally consequential part of the innovation process. Innovation is not just about who invents a technology but who can use it to deliver the best products or services to potential users. It is with this in mind that this report’s analysis of innovation indicators expands beyond just reviewing traditional innovation inputs and outputs and attempts to also gauge the outcomes that these inputs and outputs bring about in markets and society.
This report is structured as follows: The section on “China’s Innovation Policy History” describes the goals of China’s major innovation policy developments and the methods to achieve them. This is followed by a section on “China’s Ability to Innovate,” including a summary of the arguments for why China is not capable of innovation at the frontier—at least in the way developed economies are—and why these arguments hold less and less water by the year. Two indices are constructed—one considering indicators that account for the size of each economy and one only considering indicators that do not—and China’s scores relative to the United States’ at the beginning and end of the decade are reported to provide an overall measure of China’s progress. The individual innovation indicators and China’s performance in them relative to the United States over the previous decade follow, accompanied by brief analyses. Lastly, the general results, the message they convey, and what can be expected in terms of future developments are discussed, followed by a brief summary and conclusion of the report.
Why This Matters
The consequences of losing the competitive edge in advanced, high-value-added industries are different than those of losing that edge in low-skill industries for three primary reasons: barriers to re-entry, loss of good-paying jobs, and national security risks.
If its unitary cost of labor (the ratio of wages to productivity) were to fall enough, the United States could re-enter low-skill industries quite easily. Relatively little know-how and machinery are required to start producing in these industries, so market entrants could simply purchase the equipment and hire the labor necessary with few obstacles. However, this is not the case in advanced industries such as semiconductor or aerospace manufacturing. Entry into these industries requires high-skill labor, massive investments in specialized equipment, and, in many cases, the ability to tread water until enough know-how is acquired to take advantage of economies of scale. Take semiconductor manufacturing as an example. The process of manufacturing one dynamic random access memory (DRAM) chip consists of over 1,000 steps. Entering the DRAM market and gaining market share requires the procurement of specialized, complex machinery capable of carrying out these tasks, a tacit understanding of the manufacturing process by the firm’s workers (from the factory floor to the research laboratory), and the right innovation ecosystem (universities to train talent, a sufficient network of suppliers, etc.) to foster the industry. The firm may have to operate at a loss for some time until it has acquired enough know-how and become productive enough to capture the advantages of economies of scale required to become competitive in the international market. Thus, re-entering advanced, technology-intensive industries is far more difficult than re-entering lower-skill industries.
Beyond extensive barriers to re-entry, the loss of market share in advanced, high-value-added industries means a loss of jobs in these industries, which are typically much higher paying than those in other sectors. For example, the average salary of a worker in information technology (IT) sectors in the United States is approximately 75 percent higher than the average U.S. salary in general.[2] Therefore, lost jobs in these industries mean not only temporary unemployment for affected workers but a long-term overall decrease in aggregate well-being.
Lastly, remaining competitive in advanced, technology-intensive industries is crucial for national security. The superiority of the U.S. military rests largely on its technological superiority. This extends beyond technology for the physical battlefield and now crucially includes areas such as cybersecurity and intelligence gathering. A loss of competitiveness in the production of technologies crucial to national defense and an increase in dependence on other nations to produce them means two things. First—and obviously—it means the United States becomes more dependent on other countries to supply its military. While this may be less concerning (though not unconcerning) if the production is shifted to an ally country, this dynamic would be incredibly concerning if the production were shifted to a country such as China, which, if not an outright adversary, is a at least a geopolitical rival. Second, even if the United States could reliably count on other countries to provide it with military technologies and supplies, its superiority would be diminished by definition. If the United States must rely on others for the development and production of defense technologies, then its military can only be as technologically advanced as its suppliers’. Again, this may be less concerning if those developing and producing the technologies are allies, but it would be unsettling if the developer were a country such as China.
Related to the issue of national security is that of economic security. The globalization of supply chains has yielded amazing benefits in efficiency and cost reduction as economies specialize in the activities in which they have a comparative advantage. However, as supply chain disruptions triggered by the COVID-19 pandemic have shown, globalization introduces economic fragility. This was especially evident for semiconductors, the shortage of which drove up prices in everything from automobiles to home appliances. The effect of the semiconductor shortage was so widespread because of its prevalence as an intermediate good and the lack of relatively close substitutes. Per a recent blog by the Federal Reserve Bank of St. Louis, one-quarter of U.S. manufacturing industries, accounting for 39 percent of total U.S. manufacturing output, use semiconductors as a direct input.[3] It is therefore important to a country’s economic security to be active in these strategically important industries by remaining or becoming a competitively efficient producer (rather than through processes such as import substitution that will jeopardize efficiency and innovativeness).
General Results
Overall, China made notable progress relative to the United States. This progress was strongest and most widespread in innovation outputs and—unsurprisingly—in indicators not accounting for size, where it surpassed the United States. However, China made progress relative to the United States in all three innovation types, both when accounting for size and when not. In summary, China is beginning to make use of its massive economic and demographic endowments to eclipse the United States in gross output of innovation indicators (e.g., number of science and engineering articles published, number of doctoral degrees awarded, advanced-industry output, etc.). This has translated into slower but still significant progress in indicators accounting for the size of each country’s economy or population, where China still lags behind the United States.
China’s Innovation Policy History
2006–2010: Indigenous Innovation, Thousand Talents, and Strategic Emerging Industries
China’s modern innovation policies started in earnest with the “indigenous innovation” movement in the Medium- to Long-Term Program (MLP) for the Development of Science and Technology released in 2006. MLP defined indigenous innovation as “enhancing original innovation through co-innovation and re-innovation based on the assimilation of imported technologies.”[4] Specifically, MLP and indigenous innovation constituted a strategy to address six key issues:
1. China’s weak capacity for commercial innovation
2. Insufficient technological capabilities in strategic economic and public areas such as resource utilization and public health
3. Overreliance on foreign technology in areas of financial, civil, and national security
4. The exodus of China’s top science and engineering talents
5. “Expropriation” by foreign firms in the form of royalties and licensing fees charged to Chinese producers
6. An increasing realization that appropriation of foreign technologies would not lead to sustained long-term economic growth[5]
To address these issues and to make China more technologically independent and innovative, MLP cited key economic sectors, technologies, and megaprojects that would receive the focus of China’s government. The sectors cited were energy, water, and mineral resources; the environment; agriculture; manufacturing; transportation; information and services; population and health; urbanization; and public and national security. The technologies cited were biotechnology, IT, advanced materials, advanced manufacturing, advanced energy technology, marine technology, laser technology, and space technology. And the megaprojects to be funded by the state focused on protein science, nanotechnology, quantum physics, and developmental and reproductive science.[6]
MLP also laid out explicit goals to be achieved by 2020. The Chinese government sought for the nation’s R&D intensity (R&D expenditures as a share of gross domestic product [GDP]) to reach 2.5 percent and for basic research to comprise 15 percent of such expenditures. Additionally, the government sought to become first in the world with respect to patents filed and academic articles published.[7]
To achieve these goals, China’s government implemented and promoted a range of protectionist and filching policies, most of which fly in the face of the World Trade Organization’s (WTO’s) rules. The first of these policies was an expansion of the now-infamous forced technology transfers and intellectual property (IP) theft by Chinese companies. Among the primary measures undertaken to achieve MLP’s goals was “[adjusting and improving] national policies on industrial technology so as to reinforce the assimilation and absorption of imported technologies and re-innovation.”[8] The second of these policies directed the raising of implicit trade barriers such as stricter quality and assurance testing and industrial and technology standards for foreign companies than those faced by domestic firms. The third policy embraced enhanced subsidies to state-owned enterprises (SOEs), specifically those in the sectors producing the technologies listed above. The final major policy used to achieve MLP’s goals was the introduction of a “Buy China” requirement for government procurement of the following technologies: computers and applications equipment, communications products, modern office equipment, software, new energy and related devices, and high-efficiency and energy-saving products. This “Buy China” provision required that all procured goods and services in these technologies be produced using Chinese-owned IP and a commercial trademark registered in China.[9]
Three of China’s policies—forced technology transfers and IP theft, implicit barriers on would-be imports, and subsidies to exporting SOEs—are explicitly against WTO laws. Since the Chinese government had not (and still has not) signed WTO’s Agreement on Government Procurement (GPA), this final policy is not technically in conflict with China’s WTO commitments. That said, China’s representative in WTO-accession negotiations made clear that the country intended to become a GPA member soon after attaining WTO membership and would submit an offer to do so “as soon as possible” upon accession.[10] So here, too, China flouted its WTO promises.
As such, multinational corporations seeking to expand their business in China voiced their opposition to MLP, and “indigenous innovation” was seen as a thinly disguised pretense to introduce mercantilist policies. Affected parties took particular issue with the inclusion of the terms “co-innovation” and “re-innovation” in the government’s definition of indigenous innovation, fretting over the technical and implied definitions and (often correctly) fearing that they referred to forced transfers of technologies and trade secrets in return for access to the Chinese market. Additionally, Chinese-national scientists and engineers abroad expressed concern about the government’s planned megaprojects, arguing that such massive, state-run undertakings would diminish competition among involved scientists, increase bureaucratic inefficiencies, and bias results toward the preferences of China’s Ministry of Science and Technology.[11]
Two years following the release of MLP, the Chinese government announced its Thousand Talents Program to address China’s inability to retain and attract science and engineering talent. The program was launched first to attract top ex-patriot professors and scientists in the West to return to China and, starting in 2010, to attract foreign nationals as well. The benefits offered as part of the program include a starting bonus of over $150,000 and the ability to apply for a $450,000 to $800,000 research grant. Foreign nationals accepted as part of the program receive additional benefits such as housing subsidies, paid-for trips home, and a job or stipend for their spouse. [12] As of 2018, the program had attracted over 7,000 professors and scientists.
The Decision on Accelerating the Cultivation and Development of Strategic Emerging Industries—or, more simply, the Strategic Emerging Industries (SEI) strategy—updated MLP by announcing seven key sectors in which China hoped to become a world leader: energy efficiency and environmental technology, next-generation IT, biotechnology, high-end equipment manufacturing, new energy, new materials, and new-energy vehicles. Funding and administrative support for these technologies were primarily shouldered by the country’s local and provincial governments rather than the central government in Beijing.
2015: Made in China 2025
The next and most-recent major milestone in China’s innovation policy timeline was the announcement of MIC. Rather than a simple extension or update of MLP or SEI, MIC shifts the focus of innovation policy toward putatively market outcomes and enhancing the entire manufacturing process, places more emphasis on measurable goals, and carves out a greater role for market mechanisms (at least for Chinese firms).[13] The broad goals laid out in MIC are to introduce innovation-driven “smart” manufacturing through the implementation of industrial robots and advanced IT (specifically the Internet of Things); to attract and nurture human capital; to gain market share in high-value-added parts of the GVC; to strengthen IP rights and protections for small and medium-sized enterprises (SMEs) and to make more strategic use of IP; the harmonization of Chinese companies’ technology standards with those of the international community to increase exports; and increased international brand recognition of national champion firms.[14] As Scott Kennedy of the Center for Strategic and International Studies (CSIS) points out, MIC is more like Germany’s “Industry 4.0” than it is MLP, at least in its intent to modernize manufacturing.[15]
Figure 1: Semi-official targets for domestic market share of Chinese products under Made in China 2025[16]
Like MLP, MIC enumerates specific priority sectors. It also introduced benchmarks to hit in these industries by 2020 or 2025. The priority sectors mentioned are new advanced IT; automated machine tools and robotics; aerospace and aeronautical equipment; maritime equipment and high-tech shipping; modern rail transport and related equipment; new-energy vehicles and related equipment; power equipment; agricultural equipment; new materials; and biopharmaceuticals and advanced medical products.[17] The specific goals in MIC are (or were) that the domestic content of core components and materials reach 40 percent by 2020 and 70 percent by 2025; to establish 15 innovation centers by 2020 and 40 by 2025; for corporate R&D intensity to reach 1.68 percent by 2025; for labor productivity to increase by 7.5 percent per year between 2015 and 2020; and for energy and water consumption per unit of value added to decrease by 35 percent by 2025.[18]
MIC represents an insightful shift in focus for China’s innovation policy. Innovation is about much more than just the number of academic publications or patents a society produces (although these are important), especially if such activity is more of a response to government incentives than to market incentives. Rather, the oft-forgotten aspect of the innovation process is bringing the invention to market, or the implementation, both in general and, importantly for China, at scale. Thus, this shift in focus toward market outcomes and commercialization rather than pure invention indicates China’s ability to see the whole picture.
China’s innovation policies are centered not necessarily on increasing productivity and technical know-how to move up the value chain, but to supplant foreign competitors and substitute imports in the industries it deems necessary.
Many outsiders fear that MIC reiterates China’s commitment to protectionism to achieve its economic goals. While MIC places more emphasis on market mechanisms by strengthening IP protections for SMEs and liberalizing firms’ setting of technology standards, the enhanced IP protections appear to only serve domestic enterprises, and the liberalized technology standards were implemented to increase domestic firms’ exports. Moreover, the government’s explicit desire to establish national champion firms and support SOEs in internationally important sectors indicates both that the government will still very much play a commanding role in the Chinese economy and the extent to which multinational firms are allowed to participate in it.
China is well within its right to develop and implement a strategy to boost its competitiveness and innovativeness, and ITIF would advise all nations to do so.[19] However, China appears determined to subsidize its national champions and restrict market access to foreign competitors in advanced industries where it cannot achieve a comparative advantage. First and foremost, China’s innovation policies are centered not necessarily on increasing productivity and technical know-how to move up the value chain, but to supplant foreign competitors and substitute imports in the industries it deems necessary. This fundamental goal is encapsulated in MIC, prompting the United States Trade Representative to describe the strategy as follows:
While ostensibly intended simply to raise industrial productivity through more advanced and flexible manufacturing techniques, Made in China 2025 is emblematic of China’s evolving and increasingly sophisticated approach to “indigenous innovation,” which is evident in numerous supporting and related industrial plans. Their common, overriding aim is to replace foreign technologies, products, and services with Chinese technologies, products, and services in the China market through any means necessary to enable Chinese companies to dominate international markets [emphasis added].[20]
China’s Ability to Innovate
A Common Misconception: China Cannot Innovate
There exists a widespread view that China is incapable of “true” innovation, at least at the frontier. In general, the primary reasons given in support of this view are an education system that encourages rote memorization and represses creative expression, a risk-averse culture centered around a reverence for authority that is not conducive to disruption or drastic change, weak IP protections, and inefficient state involvement in markets. Proponents of these arguments believe that while China’s economic rise is impressive, it is bound to be a copier of innovations from the West, at least for the foreseeable future.
Examples of such arguments being used to dismiss the potential of China’s innovation capacity abound. In a 2014 article for The Diplomat, Kings College London Professor of Chinese Studies Kerry Brown wrote:
The Chinese government under Xi can pour all the money they want into vast research and development parks, churning out any number of world class engineers and computer programmers. Even with all of this effort, however, China is likely to produce few world class innovative companies. The fundamental structural problem is that the role of the state and government in China is still very strong…. The system that China currently has still rewards conformity.[21]
Former Hewlett Packard CEO Carly Fiorina claimed, “Although the Chinese are a gifted people, innovation and entrepreneurship are not their strong suits. Their society, as well as their education system, is too homogenized and controlled to encourage imagination and risk-taking.”[22] TechNode editor Jason Lim wrote, “Most Chinese start-ups are not founded by designers or artists, but by engineers who don’t have the creativity to think of new ideas or designs.”[23] And only four years ago, Michael Pettis, a professor at the Guanghua School of Management at Peking University, bluntly stated, “This is not a country we can expect major innovations from. In the west we don’t have enough confidence about this. How many governments in the world have decided they’re going to become major innovation centers? None of them have succeeded.”[24]
Scott Kennedy of CSIS is also skeptical of China’s ability to turn willpower and resource allocation into innovation. Citing the lack of growth in China’s output score relative to its input score in the World Intellectual Property Organization’s Global Innovation Index (GII) between 2009 and 2016, Kennedy dubbed China a “fat tech dragon,” since its apparent inability to turn inputs into outputs is analogous to a low metabolism.[25] Kennedy also points out that, while plentiful, Chinese patents are of relatively little practical use. Licensing revenues from the use of patents are still minuscule, and the surge in patents filed is a response to government rather than market incentives. Despite these issues, Kennedy acknowledges that China now graduates more scientists and engineers from its universities than does any other country (more than 1.8 million undergraduates in 2018), a higher percentage of bank loans are going to private businesses rather than SOEs, and IP protections are steadily expanding.[26] Nevertheless, Kennedy argues, innovation appears to be a secondary goal to market expansion overseen by the state.
The Reality: China Can Innovate
Are these arguments correct? In short, no—but as with most points of debate, the truth is more nuanced. To understand why these arguments are at best incomplete, it is helpful to first talk about what innovation is. Innovation is often used interchangeably with invention, specifically ground-breaking invention. This is evident both from the quotes previously provided and from the importance placed on R&D intensity and patent output as traditional measures of innovation. However, this view of innovation misses the forest for the trees. While the development of novel products and processes is obviously an important aspect of innovation, effective commercialization is at least as important.
A helpful example is that of the smartphone. Nokia invented the first touchscreen smartphone, the Nokia 7710, a full two years before Apple released the iPhone, and it was the first to offer a connected gaming-oriented app store, which Apple used as its prototype for the App Store. According to those arguments, of the two companies in this anecdote, only Nokia was actually innovative. Apple was simply a copier, not a creator. However, this view of innovation ignores the vital aspects that made Apple and its iPhone more successful than its competitor. Namely, Apple offered a better product by providing an ecosystem that integrated the iPhone with other Apple products such as iTunes and the App Store (or, more specifically, the operating system on which third-party developers built their apps).[27] Apple’s marketing and knowledge of its customers’ preferences also helped Apple turn the iPhone and subsequent products into fashion and status symbols. Now iPhones make up 62 percent of the premium smartphone market (defined as devices costing at least $400) while the Nokia 7710 exists only as a collectible.[28]
In effect, Apple leveraged an innovative technology to create superior customer experiences it then monetized through a superior business model to supplant the technology’s original creator. It could do so because innovation is not just about who is first; it is more importantly about who can deliver a superior product (a function of the actual good or service, the customer experience, the price, etc.), which manifests itself in market outcomes.
While the development of novel products and processes is obviously an important aspect of innovation, effective commercialization is at least as important.
A better understanding of innovation is provided by the McKinsey Global Institute’s (MGI’s) The China Effect on Global Innovation, which separates innovations into four categories: efficiency-driven, customer-focused, engineering-based, and science-based.[29] The report concludes that with its proven ability to produce goods at scale, adapt products to the Chinese market, and develop and adopt digital infrastructures such as mobile payment systems and e-commerce (sometimes even before more-developed economies), China has demonstrated that it is capable of efficiency-driven and customer-focused innovations. The challenge before it, the authors argue, is to catch up in the areas of engineering- and science-based innovations.
However, recent developments indicate China is doing just that. For example, China became the world’s largest automobile producer in 2009, thanks to government support after designating it a priority industry, and is now also the world’s largest producer and exporter of electric vehicles.[30] China landed the first probe on the dark side of the moon in 2019, it began launching the components of its Tiangong space station in 2021, and current NASA Administrator Bill Nelson recently stated that China may land astronauts on the moon before the United States is itself able to return.[31] China has recently added to the pantheon of tech giants by producing companies such as Alibaba, Baidu, Huawei, and Tencent, and eight of the ten fastest companies to reach a $1 billion valuation are Chinese.[32] As recently as 2017, China possessed the most powerful supercomputer in the world, and it currently boasts two of the top 10 most powerful, although the true extent of China’s supercomputing capabilities is now unknown.[33]
An additional example of Chinese frontier innovativeness, notably in an area in which China transitioned from a copier to a leader, is high-speed rail (HSR). China first developed its HSR network with the help of imports and technology transfers from European and Japanese companies. It opened its first railway—between Beijing and Tianjin—in the summer of 2008 in time to show it off to the world as it hosted that year’s Summer Olympics. Since then, China’s HSR network has ballooned and is by far the largest in the world with over 23,500 miles of rail.[34] It has also developed the world’s fastest autonomous train, capable of speeds up to 217 miles per hour, and one of China’s rail-producing SOEs, CRRC, has become the world’s largest producer of railway vehicles and related technologies. China has recently developed a prototype for a “mag-lev” train—a train suspended above its tracks via a magnetic field—that it claims is capable of speeds up to 385 miles per hour.[35] In the coming years, China’s HSR network will expand both to its western regions and its regional neighbors’ lands to further integrate markets and ingrain the country’s less-developed western half into its supply network.
China became the world’s largest automobile producer in 2009 and is now also the world’s largest producer and exporter of electric vehicles.
Beyond just these specific examples, China’s progress is demonstrating itself through broader measures of innovation, such as the aforementioned GII. While Kennedy dubbed China the “fat tech dragon” because of the alleged imbalance in growth between its innovation input score and its innovation output score, this analysis neglects the fact that in the 2016 edition of the GII, China’s output score was higher than at any other point between 2009 and 2016 (the years Kennedy considers). Furthermore, China’s “efficiency” score, defined as the ratio of a nation’s output score to its input score (or, put another way, a nation’s innovation metabolism), ranked seventh among all nations.[36] For reference, Switzerland, which ranked first overall, had the 5th highest efficiency score, Germany had the 9th highest, the United States had the 25th highest, and Japan had the 65th highest.
In the recently released 2022 edition of the GII, China ranks 11th overall (and Hong Kong ranks 14th overall), ahead of countries such as Japan (13th) and Canada (15th).[37] Moreover, China ranks just 21st in input score and 8th in output score, and its output score was well above the 2016 level. China’s GII-defined strengths are “Trade, diversification, & market share” (an innovation input for which China ranks third) and “Intangible assets” (an innovation output for which China ranks second).
However, these high marks deserve a qualification. China is bound to score well in “Trade, diversification, & market share” since one of the three indicators in that category is purchasing power parity (PPP)-adjusted GDP (China has the largest)—though it also ranks second in domestic industry diversification. Additionally, China’s score in “Intangible assets” is largely propped up by its trademark output. Kennedy’s point remains valid (at least for now) that China’s IP is currently of little value and patent and trademark output is largely a response to government rather than market incentives. This is further evidenced by the fact that China ranks only 35th in IP receipts as a percentage of total trade (whereas the United States ranks 4th). Nevertheless, China still scores remarkably well in market-outcome indicators, ranking 4th in high-tech exports as a percentage of total trade and, contrary to arguments about its lack of creativeness, notching the top spot in creative goods exports as a percentage of total trade. China scores 14th in “Creative outputs” as a general category.[38]
This is not to say that China is now among the most fundamentally innovative economies in the world or that there are no further obstacles in its way to getting there. Its R&D expenditures and patent outputs are still largely a reflection of the government’s objectives rather than the economy’s inventive capabilities (more on this later). Although financing has expanded to private as well as SOEs, and IP protections are being strengthened (at least for domestic enterprises), state involvement in the Chinese economy will almost certainly hinder productivity growth, and a trade-off between scale and efficiency in priority sectors will likely persist. This may be further exacerbated by Xi Jinping’s ongoing crusade to consolidate the state’s power and strengthen its influence in both economic and social matters. This crusade will now face fewer internal obstacles after Xi’s consolidation of power at the recent 20th National Congress of the CCP.
But it is naïve to ignore recent developments simply because they run contrary to preconceived notions of Chinese culture and capabilities. A nation that competes with—and in some cases beats—world leaders in areas such as advanced computing technology, space exploration, and e-commerce despite having a real GDP per capita roughly 30 percent less than that of the United States in 1947 cannot be written off.[39] Rather, China’s progress toward frontier innovation and whatever challenges that poses to the United States and its allies must be carefully and seriously considered. To that end, China’s progress relative to the United States across a series of innovation indicators that attempt to capture the entirety of innovation (inputs, outputs, and outcomes) during the previous decade is measured and discussed below.
Innovation Indicators
The indicators considered are sorted into three categories. The first is innovation inputs, which consist of the resources and the quality of the institutions designed to bring about increases in an economy’s stock of knowledge. The second is innovation outputs, or the discovered knowledge the inputs produced. The third is innovation outcomes, which are the effects from the implementation of the discovered knowledge that manifest themselves in production and in adoption of new technologies.
Overall Scores
ITIF created two indices to quantify China’s overall progress across the indicators considered: one measuring China’s progress relative to the United States on a proportional basis (accounting for the size of its economy, population, etc.) and another measuring China’s progress relative to the United States in terms of gross output. In cases where there was significant overlap among the indicators in a category (e.g., the number of undergraduate degrees awarded overall and in specific fields of study), only the indicator deemed to be most important was included in composite index calculations (e.g., science and engineering degrees were included instead of the total number of degrees). For both the proportional and gross output indices, scores were computed for each of the indicator types (inputs, outputs, and outcomes), and the overall index score was computed by giving inputs and outputs a weight of 25 percent each and outcomes a weight of 50 percent. The appendix contains a full list of the indicators used and their respective weights.
Figure 2 shows China’s progress in proportional indicators. The contributions of the indicator types are calculated as the weighted average of China’s scores relative to the United States across the considered indicators multiplied by that indicator type’s weight. China’s score in this index was 57.6 percent that of the United States in 2010. By 2020, this increased by almost one-third to 75 percent, thanks mostly to progress in innovation outputs. In other words, on a proportional basis, China is now roughly 75 percent as advanced in innovation and advanced-industry production as the United States. If this relative growth continues apace, China will surpass the United States by 2035.
Figure 2: China’s indicator index score relative to the United States on a proportional basis
The contribution of the output indicators to China’s proportional index score more than tripled over the decade, thanks to rapid increases in China’s output of science and engineering articles and patents, the influence of China’s research, and China’s international IP receipts relative to GDP. This is especially notable when considering China’s score in outputs relative to the United States is only given a weight of 25 percent. While China also made progress in proportional innovation inputs and outcomes, this contributed much less to the increase in China’s score relative to the United States.
Similarly, figure 3 shows China’s relative progress in gross-output indicators. As these indicators do not account for China’s rapid growth in GDP in the last decade, China’s progress relative to the United States here is more pronounced. In 2010, China’s score in this index was 77.8 percent that of the United States. By 2020, this had grown by approximately four-fifths to 139.2 percent. In other words, China’s gross innovation capabilities (e.g., R&D expenditures, venture capital (VC) investments, advanced-industry output, patent output, etc.) are now almost 40 percent greater than those of the United States.
Figure 3: China’s indicator index score relative to the United States in gross output
As with the proportional index, innovation outputs are the biggest contributors to this increase—again, with the innovation type’s contribution almost tripling—and now innovation outcomes contribute significantly as well (though it should again be noted that innovation outcomes’ weight is twice that of innovation inputs’ and innovation outputs’). The growth in the contribution of outputs to China’s score relative to the United States in the gross-output index is very similar to that in the proportional index, since the proportional innovation outputs account for population and China’s population was virtually unchanged relative to the United States’ during the past decade (with China maintaining approximately 4.3 times the population of the United States). Innovation outcomes contribute much more in this index, since the growth in China’s value added and exports in advanced industries relative to the United States’ is not mitigated by China’s rapid overall economic growth over the last decade. Again, while China made progress in gross innovation inputs relative to the United States, that progress was much more muted than that made in gross outputs and outcomes.
Though the two indices measure different (but highly related) things, they both convey that China’s biggest progress relative to the United States was in the category of innovation outputs. With respect to innovation inputs and innovation outcomes, this depends on which group of indicators one considers. With respect to proportional indicators, China made slightly more progress in innovation inputs than outcomes, but with respect to gross-output indicators, China made much more progress in innovation outcomes.
Innovation Inputs
R&D
R&D is necessary to discover and adapt the knowledge necessary for future innovations and to create new products and processes.
R&D Expenditures
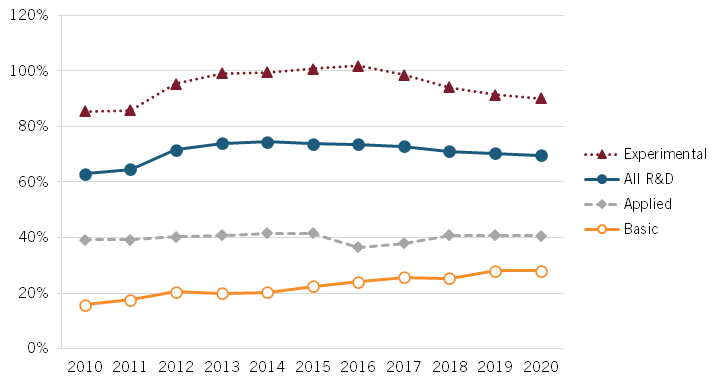
Figure 4 shows China’s R&D expenditures relative to the United States’ along with the relative expenditures of R&D’s components: basic research, applied research, and experimental development. Between 2010 and 2020, China’s R&D expenditures increased from $104.3 billion to $352.9 billion, and from 25 percent to 49 percent of U.S. levels, respectively. China’s growth relative to the United States’ was faster in the first half of the decade than in the second as growth in China’s R&D expenditures slowed from 16.9 percent per year in 2010–2015 to 9.2 percent per year in 2015–2020; the United States’ increased from 4.4 percent per year to 7.3 percent per year.
Figure 4: China’s gross R&D and components expenditures relative to the United States’[40]
Basic research involves the discovery of foundational scientific knowledge upon which to build technologies. Unlike with total R&D expenditures, China’s basic research expenditures relative to the United States’ increased steadily throughout the decade, from 6.4 percent to 19.7 percent of the U.S. level ($4.8 billion to $21.2 billion) between 2010 and 2020. Although it made steady progress, basic research made up only 6 percent of China’s total R&D expenditures in 2020, well below its MLP goal of 15 percent.[41]
Applied research involves the generation of knowledge with specific, practical objectives. China’s applied research expenditures increased from 15.9 percent to 28.6 percent of the U.S. level and $13.2 billion to $39.9 billion over the course of the decade.
Experimental development is the use of existing knowledge to create or improve products and processes. China’s experimental development expenditures increased from $86.3 billion and 34.5 percent of the U.S. level in 2010 to $291.8 billion and 63.4 percent in 2020. Experimental development accounts for the majority of R&D expenditures for both China and the United States, though it accounted on average for 84 percent of R&D expenditures in China between 2010 and 2020 compared with 63 percent for the United States. As such, a slowdown in the growth of experimental development expenditures in China was responsible for the slowdown in overall R&D expenditures growth. These expenditures grew at an average rate of 17.3 percent per year in China between 2010 and 2015; this dropped to 8.8 percent in the second half of the decade.
R&D Intensity
Perhaps the most widely used indicator of a nation’s innovativeness, R&D intensity measures the extent to which a nation invests in R&D relative to its output.
Between 2010 and 2020, China’s R&D intensity increased from 1.7 percent to 2.4 percent, while the United States’ increased from 2.7 percent to 3.5 percent (figure 5). The two R&D intensities were converging in the first half of the decade but started to diverge after 2014 due to both increases in U.S. R&D intensity and a decrease in the growth rate of China’s.
Figure 5: R&D intensity in China and the United States[42]
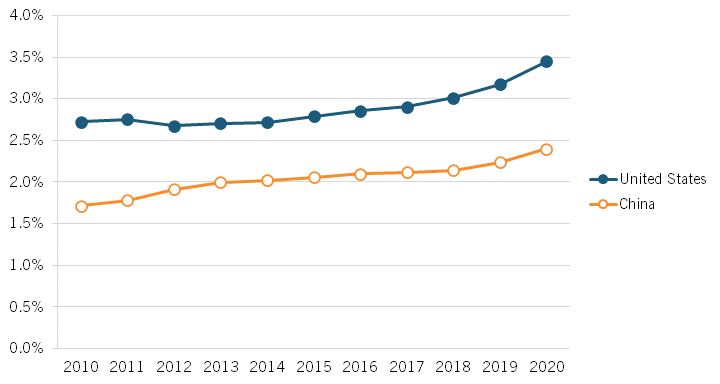
Figure 6 shows China’s R&D components’ intensity relative to the United States’. At its relative peak in 2014, China’s R&D intensity was 74.4 percent of the U.S. level (2.0 percent in China and 2.7 percent in the United States).
China’s basic research intensity relative to the United States was much lower than its general R&D intensity at just 28 percent of the U.S. level in 2020. However, unlike general R&D intensity, China’s basic R&D intensity grew relative to the United States throughout the previous decade, increasing from 15.8 percent of the U.S. level in 2010.
In contrast to basic research intensity, China’s 2020 applied research and experimental development intensities relative to the United States were little changed from their 2010 figures. China’s applied research intensity was approximately 40 percent of the U.S. level in both 2010 and 2020, and its experimental development intensity increased from 85.4 percent of the U.S. level in 2010 to 90.1 percent in 2020. However, China’s experimental development intensity relative to the United States’ fell from its decade-high of 101.9 percent of the U.S. level in 2016 due primarily to faster growth in U.S. experimental development intensity. China’s relative applied research intensity remained roughly constant throughout the decade.
Figure 6: China’s R&D and components intensities relative to the United States’[43]
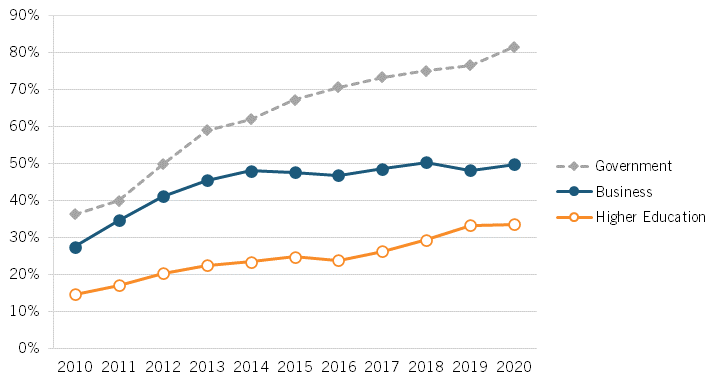
R&D Expenditures by Performing Sector
Another way to categorize R&D expenditures is by the sector performing the activity: business, government, or higher education. As can be seen in figure 7, China’s expenditures on R&D activities performed by the government or higher education institutions increased steadily relative to the United States’. China’s expenditures on business R&D relative to the United States’ was stagnant over the second half of the decade. China’s business-performed R&D expenditures increased from $76.6 billion in 2010 to $270.2 billion in 2020, which represented 27.5 percent and 49.8 percent of the U.S. levels, respectively. However, the average annual growth of such expenditures in China slowed from 17.9 percent per year in the first half of the decade to 9.1 percent in the second (and increased from 5.7 percent to 8.1 percent in the United States). China’s expenditures on R&D performed by the government approached U.S. levels by the end of the decade. Such expenditures in China increased from $18.9 billion (36.3 percent of the U.S. level) to $55.5 billion (81.5 percent of the U.S. level). Lastly, China’s expenditures on R&D performed by higher education institutions increased from $8.8 billion in 2010 to $27.2 billion in 2020; these figures represented 14.6 percent and 33.6 percent of the U.S. level, respectively.
Figure 7: China’s gross R&D expenditures relative to the United States’, by performing sector[44]
R&D Intensity by Performing Sector
China’s R&D intensity relative to the United States’ varies significantly depending on which performing sector is being examined, as can be seen in figure 8. As with general R&D, China’s business-performed R&D intensity relative to the United States’ increased over the previous decade—from 67.9 percent to 70.7 percent of the U.S. level—but was also subject to a decrease from its mid-decade peak (of 80.5 percent in 2014). China’s government- and higher-education-performed R&D intensities relative to the United States’ increased throughout the previous decade from 89.7 percent to 115.8 percent and from 36.1 percent to 47.7 percent of U.S. levels, respectively. China’s government-performed R&D intensity increased from 0.31 percent of GDP in 2010 to 0.38 percent in 2020 (compared with 0.35 percent and 0.33 percent, respectively, in the United States), and its higher-education-performed R&D intensity increased from 0.14 percent of GDP to 0.19 percent (compared with 0.4 percent and 0.39 percent, respectively, in the United States). Given the scope and involvement of the Chinese government in economic and social affairs—especially the government’s promotion of “indigenous innovation”—it is unsurprising that government-performed R&D intensity is now approximately 16 percent greater in China than in the United States, although this relative growth stalled in the second half of the decade.
Figure 8: China’s R&D intensity relative to the United States’, by performing sector[45]
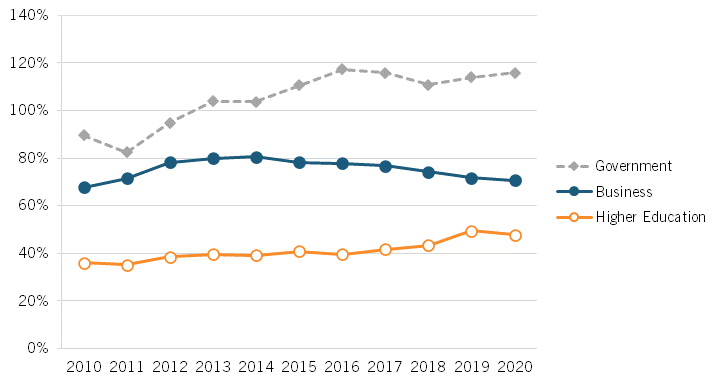
It may at first seem surprising that China’s basic research intensity is so low relative to the United States given its greater government-performed R&D intensity and attention government R&D places on basic research. However, business-performed R&D expenditures make up the greatest share of total R&D expenditures by far, accounting for 77 percent of China’s R&D expenditures and 75 percent of the United States’ R&D expenditures in 2020.[46] Moreover, applied research expenditures make up a much larger share of business-performed R&D expenditures in the United States than in China, accounting for 6.4 percent of business-performed R&D expenditures in the United States in 2020, compared with only 0.5 percent in China.[47] Lastly, while China’s government-performed R&D intensity is greater than the United States’, the U.S. government actually supplies a greater amount of R&D funding, both in absolute terms and relative to GDP.[48]
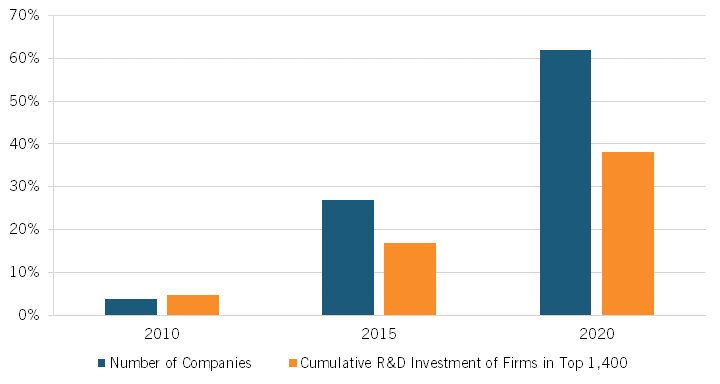
Top Firms Globally by R&D Investment
The EU Industrial R&D Investment Scoreboard lists the 2,000 companies with the greatest R&D investments globally (although it was only 1,400 in 2010 and 2011 and 1,500 in 2012). While the United States’ large companies maintained footholds at the top of the list throughout the decade, China made significant advancements both in terms of the number of companies in the top 1,400 and in the cumulative R&D investments of those companies.
In 2010, China had just 19 companies ranked in the top 1,400, which was 3.9 percent of the United States’ 487 (figure 9). China’s highest-ranking company was Huawei Technologies at 56. By 2020, China had 278 companies in the top 1,400, 61.9 percent of the United States’ 449. Huawei remained China’s highest-ranking company and jumped to second, behind the United States’ Alphabet. The cumulative R&D investment of China’s companies in the top 1,400 increased from 4.8 percent of U.S. levels in 2010, to 16.9 percent in 2015, and then to 38.1 percent in 2020.
Figure 9: Chinese firms among the world’s top R&D investors relative to the United States[49]
Venture Capital
VC involves private investors financing small, risky business ventures (typically related to technology) in exchange for equity in the company. VC played a large role in the tech boom in the United States, helping now-household names such as Alphabet and Apple establish themselves as corporate giants and providing the funds needed to innovate in their early stages. VC has long been a more common source of financing in the United States than elsewhere in the world, but it is gaining traction worldwide—especially in China—and developing a relevant VC industry was a point of emphasis in MLP.[50]
Total VC Investments
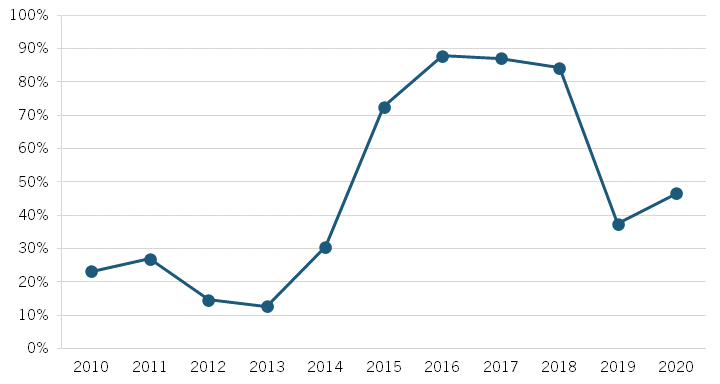
China’s VC investments relative to the United States’ doubled over the previous decade from 23.2 percent to 46.6 percent of U.S. levels (figure 10), with China’s VC investments totaling $60.2 billion in 2020. However, this is down from its absolute peak of $74.8 billion in 2018 and its relative peak of 87.9 percent of U.S. levels in 2016. Nonetheless, China was still the second-largest VC market in the world in 2020, and VC continues to become a more instrumental part of China’s financial framework.[51]
Figure 10: China’s gross VC investment relative to the United States’[52]
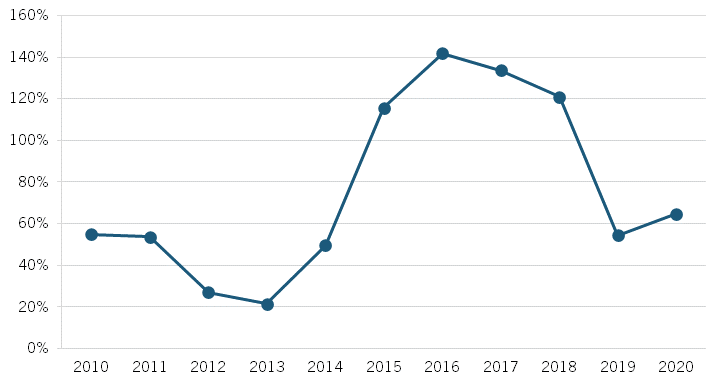
VC Investments as a Share of GDP
Figure 11 shows China’s VC investments as share of GDP relative to the United States’. In 2010, China’s VC investments were 0.02 percent of its GDP, half of the United States’ 0.04 percent. By 2020, China’s VC investments increased to 0.4 percent of its GDP, while the United States’ VC investments increased to 0.62 percent of GDP. The mid-decade surge in China’s VC ecosystem relative to the United States’ is even more pronounced. Between 2013 and 2016, VC as a share of China’s GDP increased from 0.02 percent to 0.26 percent, while the United States’ only increased from 0.07 percent to 0.18 percent.
Figure 11: China’s VC investment as a share of GDP relative to the United States[53]
Researchers
While R&D intensity is a measure of the share of an economy’s resources it devotes to the creation of knowledge and novel products and processes, the number of researchers as a share of total workers measures the relative amount of human capital devoted to these activities. In this regard, China lags much further behind the United States, although it made steady progress throughout the decade.
Total Researchers
Figure 12 shows China’s number of total researchers relative to the United States’. China entered the decade with over 9 percent more researchers than did the United States (1.21 million compared with 1.11 million). This increased throughout the decade, and in 2019, China employed 2.17 million researchers, which was 44.5 percent more than the United States’ 1.5 million.
Figure 12: Number of researchers in China relative to the number in the United States[54]
Researchers as a Share of Total Employees
Measuring researchers as a share of total employed workers reveals the relative amount of human capital devoted to core R&D activities. In this regard, China performs much more poorly than the United States. In 2010, there were 1.6 researchers per 1,000 employees in China compared with 8.5 in the United States. By 2019, this increased to 2.8 for China and 9.9 for the United States. While China’s concentration of researchers increased relative to the United States’ throughout the decade, increasing from 18.8 percent to 28.2 percent of the U.S. level (figure 13), China’s researchers as a share of total employees relative to the United States was still far below its R&D intensity relative to the United States at the end of the decade. A potential reason for this is that R&D incentives from the Chinese government (financial, political, etc.) cause labs and businesses to inflate their reported R&D expenditures. Another reason is that China’s R&D personnel are much more concentrated in non-research roles such as technician or administrator. In 2020, researchers made up just 44 percent of China’s R&D personnel.[55] While comparative figures are not available for the United States, researchers make up 70–80 percent of R&D personnel in countries such as Canada, Japan, and South Korea.
Figure 13: China’s researchers as a share of total employment relative to the United States[56]
Undergraduate Degrees Awarded
Degrees awarded measures the extent to which students with advanced skills for an innovation-driven and modern economy are added to the workforce. This measure is likely less representative for China than for the United States given the rate at which students from the former country travel abroad (often to the latter country) for their university educations, with approximately four-fifths of them returning to China after graduation.[57] However, it is still useful for gauging the education and skill attainment of the populations.
Total Undergraduate Degrees Awarded
Figure 14 shows the number of both total and science and engineering undergraduate degrees awarded in China relative to the United States. China already awarded 56.8 percent more total degrees and 106.5 percent more science and engineering degrees than did the United States in 2010. These both increased throughout the decade, and although both finished slightly below their decade highs, by 2018, China awarded 94.7 percent more total undergraduate degrees and 124.6 percent more science and engineering undergraduate degrees than did the United States. Specifically, China awarded 3.87 million total undergraduate degrees to the United States’ 1.99 million and 1.82 million science and engineering undergraduate degrees to the United States’ 0.81 million.
Figure 14: Total undergraduate degrees awarded in China relative to the United States[58]
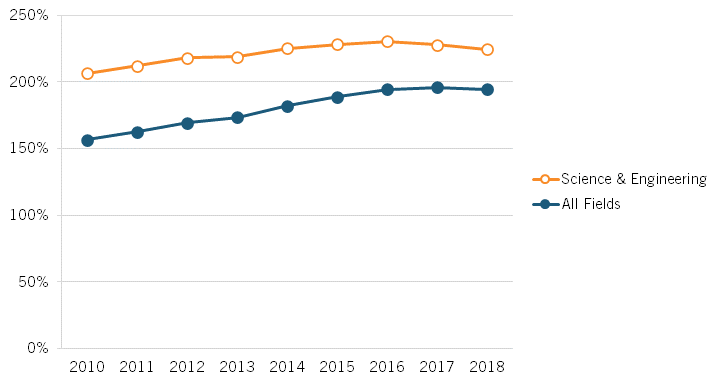
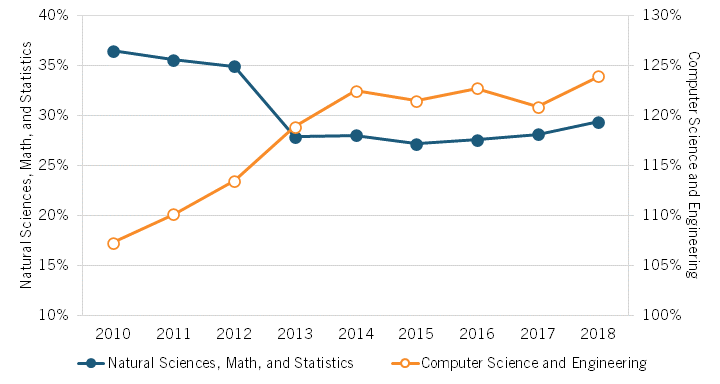
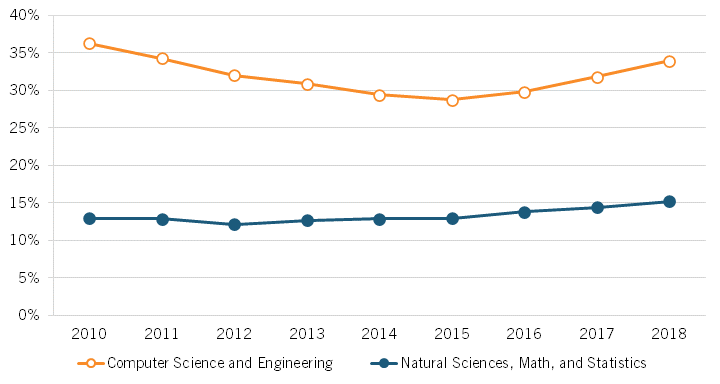
Figure 15 considers individual subject groups: natural sciences, mathematics, and statistics as one group and computer science and engineering as another. China entered the decade awarding almost twice as many undergraduate degrees in natural sciences, mathematics, and statistics as did the United States (194.4 percent as many). However, by 2018, this dropped to only 29 percent more, and China awarded 13,500 fewer such degrees than it did in 2010. The largest relative drop was between 2012 and 2013, when China’s number of such degrees awarded fell by over 15 percent.
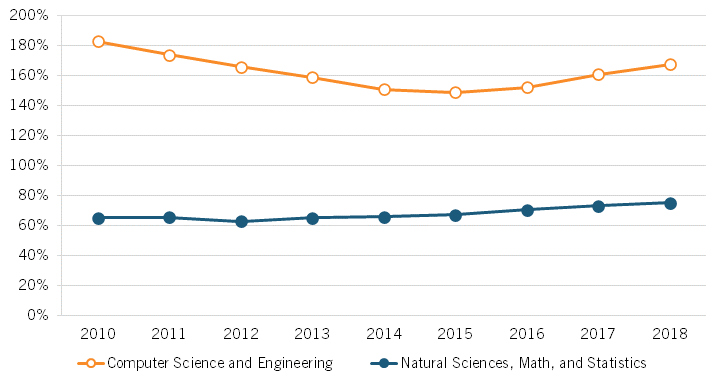
China awarded 469.9 percent more computer science and engineering undergraduate degrees than did the United States in 2010. By 2014, this increased to 538.5 percent more. However, the United States started catching up to China after 2014, and by 2018, China awarded “only” 444.9 percent more such degrees than did the United States. This drop was the result of a slowdown in the growth of such degrees in China (from 8.6 percent per year in 2010–2014 to 2.9 percent in 2014–2018) while the United States’ growth rate increased (from 5.6 percent per year in 2010–2014 to 7.1 percent in 2014–2018).
Figure 15: Undergraduate degrees awarded in China relative to the United States[59]
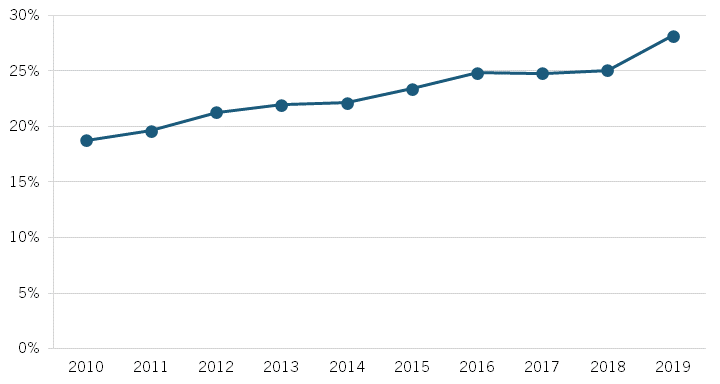
Undergraduate Degrees Awarded per Capita
It is also helpful to account for the size of the populations being considered. Only a narrow age range accounts for the vast majority of undergraduate university students. Thus, the number of undergraduate degrees awarded per capita of each country’s 20–29-year-old population is considered. Although China’s age distribution is more skewed toward the older end of the distribution than is the United States’ in general, the 20–29 age group makes up a larger share of its population.[60] While this was true throughout the decade, that share fell quite rapidly. The age group’s share of the population in China fell from about 17 percent in 2010 to 14 percent in 2018.[61] In the United States, the share remained constant at approximately 14 percent.[62] Disregarding these dynamics therefore understates China’s progress, as can be seen by comparing figure 14 and figure 15 with figure 16 and figure 17.
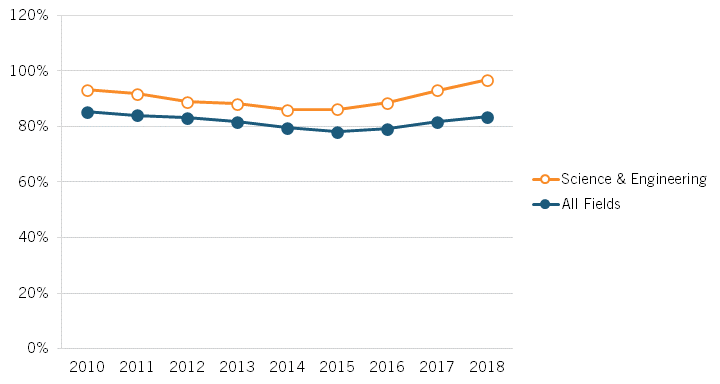
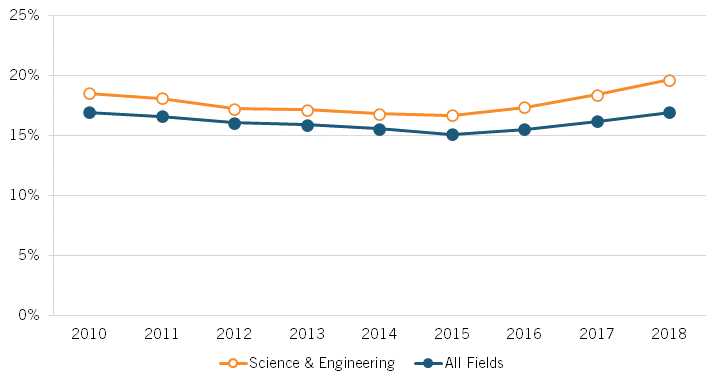
Total undergraduate degrees awarded per capita in China increased from 29.5 percent of U.S. levels in 2010 to 44.3 percent in 2018 when it awarded 195 such degrees for every 10,000 residents in the age group (figure 16). For science and engineering fields specifically, the increase was from 38.9 percent to 51.1 percent of U.S. levels over that period, with China awarding 92 such degrees per 10,000 residents in the age group in 2018.
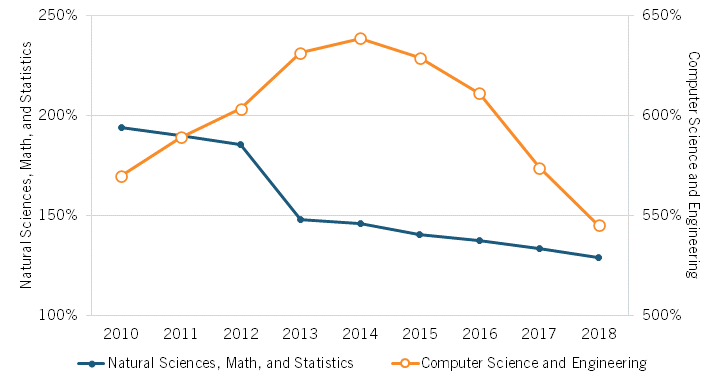
Relative growth was negative over the decade for China when looking specifically at natural sciences, mathematics, and statistics degrees, falling from 36.5 percent of the U.S. level in 2010 to 29.3 percent in 2018 (figure 17). These represent approximately 12 and 13 such degrees being awarded per 10,000 residents in the age group in China those years.
Entering the decade, China already awarded 35 computer science and engineering undergraduate degrees per 10,000 residents in the age group, which amounted to 7.3 percent more than the United States. China added to this lead throughout the decade, awarding 64 degrees per 10,000 in 2018, 23.9 percent more than the United States’ 52. Relative growth slowed in the second half of the decade, but 123.9 percent of the U.S. level marked China’s decade high.
Figure 16: Undergraduate degrees awarded per capita in China relative to the United States (20- to 29-year-old populations)[63]
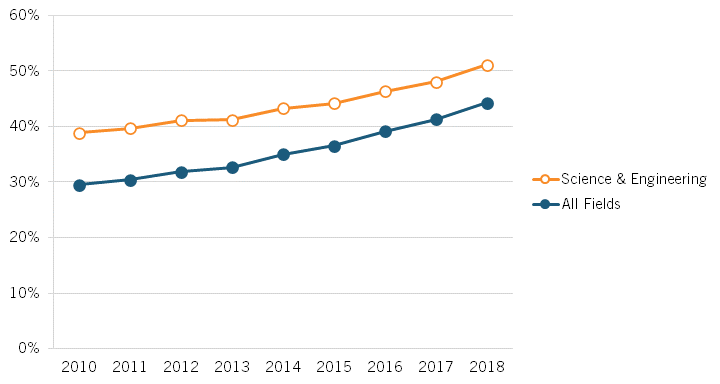
Figure 17: Science and engineering undergraduate degrees awarded per capita in China relative to the United States (20- to 29-year-old populations)[64]
Doctoral Degrees Awarded per Capita
Considering doctoral degrees rather than undergraduate degrees shifts the focus to students with advanced education and skills in their respective fields who have demonstrated the ability to conduct research at a high level. Again, many Chinese nationals go abroad for their advanced education. To the extent a nonnegligible proportion of these students return to China after receiving their degrees, this indicator understates the number of new PhDs entering China’s workforce each year. However, there is reason to believe that this is much less understated than undergraduate degrees. Despite progress in developing and retaining researching talent, a Center for Security and Emerging Technology study from earlier this year found that 90 percent of Chinese nationals who received a STEM PhD in the United States between 2000 and 2015 remained in the country as of February 2017.[65]
Total Doctoral Degrees Awarded
Unlike with undergraduate degrees, China did not award more doctoral degrees than did the United States entering the decade or at any time between 2010 and 2018 (figure 18). This is also true for science and engineering doctoral degrees. In 2010, China awarded 85.3 percent as many total doctoral degrees as did the United States. By 2015, this had fallen to 78 percent as the United States’ growth rate of such degrees outpaced China’s. However, this trend reversed, and China awarded 83.5 percent as many total doctoral degrees as did the United States in 2018. That same year, China awarded 60,700 doctoral degrees to the United States’ 72,700.
A similar dynamic played out for science and engineering degrees. China awarded 93.3 percent as many such degrees as did the United States in 2010. By 2014, this fell to 85.9 percent. As with total degrees, this trend reversed, and by 2018, China produced 96.8 percent as many science and engineering doctoral degrees as the United States (39,800 to 41,100).
Figure 18: Number of science and engineering doctoral degrees awarded in China relative to the United States[66]
In contrast to undergraduate degrees, total doctoral degrees, and science and engineering doctoral degrees in general, China’s number of doctoral degrees awarded in the natural sciences, mathematics, and statistics relative to the United States’ increased steadily throughout the decade, from 65.2 percent to 75.1 percent of the U.S. level (figure 19). During the decade, China’s growth rate of such degrees was twice that of the United States (3.6 percent per year versus 1.8 percent per year).
China entered the decade awarding over 80 percent more computer science and engineering doctoral degrees than did the United States. The relative dynamics for these degrees were much more like those for total doctoral degrees and science and engineering doctoral degrees in general. From 2010 to 2015, China’s awarding of such degrees dropped from 182.8 percent to 148.8 percent of the U.S. level. However, again, China’s growth rate of such degrees picked up while the United States’ slowed down. In 2018, China awarded 67.3 percent more computer science and engineering doctoral degrees than did the United States, which was still below its 2010 level.
Figure 19: Number of science and engineering doctoral degrees awarded by subject group in China relative to the United States[67]
Doctoral Degrees Awarded per capita
For analysis of doctoral degrees per capita, the countries’ 25–39-year-old populations were considered. Among doctoral recipients in the United States, 88 percent are 40 years old or younger—and this concentration is greater for science and engineering fields.[68] Again, this age group accounted for a larger share of the population in China than in the United States throughout the decade (over 23 percent in China and under 21 percent in the United States in 2018).[69] However, changes in the groups’ population shares in the two countries were very similar, so only comparing total degrees does not have the same progress-understating effect that it does for undergraduate degrees.
China’s doctoral degrees awarded per capita relative to the United States are much lower than for undergraduate degrees in all categories. In 2010, China awarded 16.9 percent as many doctoral degrees per 25–39-year-old resident as did the United States (figure 20). In 2018, this was unchanged, although it was up from the decade low of 15.1 percent in 2015. The story of China’s science and engineering degrees per capita relative to the United States is similar. In 2010, China awarded 18.5 percent as many such degrees per age-group resident as did the United States. By 2018, this increased slightly to 19.7 percent. Here, too, China reversed a negative trend that defined the first half of the decade.
Figure 20: Number of doctoral degrees awarded per capita (25–39-year-old population) relative to the United States, 2010–2018[70]
As with science and engineering fields as a whole, China’s natural sciences, mathematics, and statistics doctorates awarded per 25–39-year-old relative to the United States rose only slightly throughout the decade, from 12.9 percent of the U.S. level in 2010 to 15.3 percent in 2018 (figure 21). However, China’s progress in this subject group was much steadier. The dynamics for computer science and engineering doctorates per capita are much more like those for total degrees and science and engineering degrees as a whole. Between 2010 and 2015, China’s computer science and engineering doctorates awarded per capita fell from 36.3 percent of the U.S. level to 28.8 percent. By 2018, this recovered somewhat to 33.9 percent.
Figure 21: Science and engineering doctoral degrees awarded per capita in China by subject group relative to the United States (25- to 39-year-old population)[71]
Top Universities Globally
As the institutions that train future high-skill workers and researchers—and among the primary contributors to the accumulation of foundational knowledge—the number and quality of top universities in a country are useful indicators of its innovative capacity.
Per the annual Shanghai Academic Ranking of World Universities, China had 27 universities in the top 500 in 2010 compared with the United States’ 154 (including all of the top four). By 2020, China’s number of universities in the top 500 jumped to 76, whereas the United States’ number dropped to 133 (although it now held all top five spots). Moreover, China caught up to the United States at a faster pace in the second half of the decade.
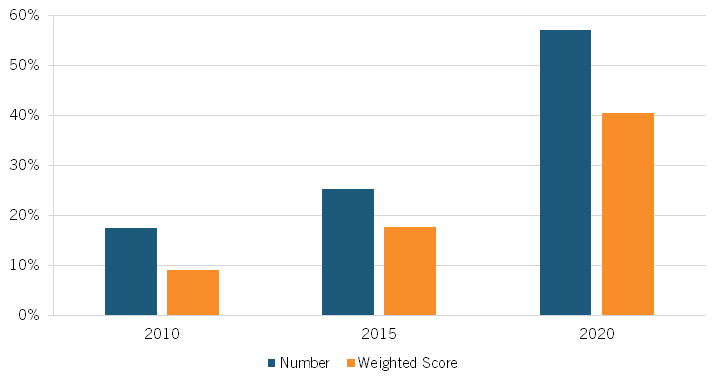
Weighted scores were given to universities based on their standings in the rankings to account for both the number and relative quality of the universities in the top 500. The appendix in this report provides an explanation of this scoring method. The cumulative value of the weighted scores of China’s universities in the top 500 was only 9 percent that of the United States’ universities (figure 22). In 2020, China’s cumulative score was 40.5 percent that of the U.S. score. As figure 22 shows, China’s progress in both the number of universities and their cumulative weighted score relative to the United States was exponential.
Figure 22: Top-ranked universities in China relative to the United States[72]
Summary of Innovation Inputs
In the last decade, China gained ground relative to the United States in almost every input indicator reviewed. However, it still lags behind the United States in all indicators accounting for size. China made significant strides with respect to its top R&D-investing companies and the number and quality of its top universities; progress relative to the United States was exponential for both. While still far behind U.S. levels, China made steady progress in basic R&D intensity and researchers as a share of its employed workforce. China briefly caught up to the United States in terms of VC investment in the middle of the decade (and surpassed the United States when accounting for the size of the economy) but fell back down to about half of U.S. VC investment in 2020. Nevertheless, VC is becoming an increasingly integral part of the Chinese financial sector. While China now produces the most university graduates of any country, its number of graduates per capitaremains well below the comparative U.S. figures in almost all fields reviewed.[73] For both undergraduate and doctoral degrees per capita in the natural sciences, mathematics, and statistics, China is still far behind the United States and struggling to make progress.
Innovation Outputs
Science and Engineering Articles
A nation’s science and engineering research articles measures the extent to which that nation contributes to the building of knowledge in these innovation-related subjects. The following figures show China’s output of science and engineering articles, both as a whole and by subject, relative to the United States.
Total Science and Engineering Articles
Over the last decade, China went from publishing 68.7 percent as many science and engineering articles as did the United States in 2010 to 123.7 percent in 2020, publishing over 742,000 articles compared with the United States’ 600,000 (figure 23). Moreover, China caught up (and then pulled away) at an increasing rate throughout the decade. In 2010–2015, China’s science and engineering publications grew at an annual rate of 6 percent compared with the United States’ 1.9 percent. In 2015–2020, China’s rate increased to 10.7 percent per year while the United States’ only increased to 2.3 percent.
Figure 23: Number of science and engineering articles in China relative to the United States[74]
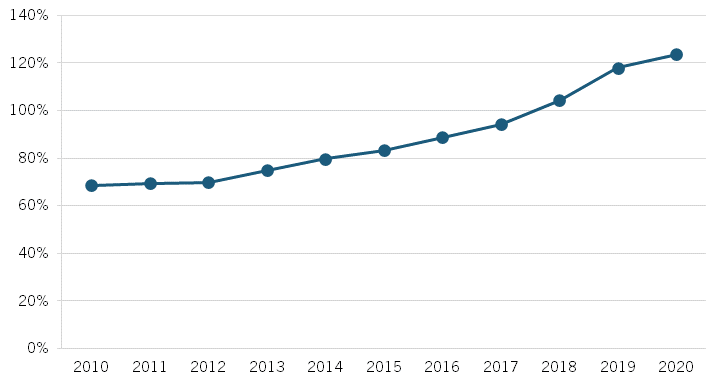
Figure 24 shows China’s technical sciences (computer and information sciences, engineering, and mathematics and statistics) publications relative to the United States. For computer and information sciences and engineering, China entered the decade already publishing more articles per year than the United States. In the first half of the decade, China’s computer and information sciences publications fell at an annual rate of 9.1 percent and its engineering publications increased at an annual rate of 5.8 percent. In the second half of the decade, these rates increased to (positive) 14.4 percent and 8.7 percent, respectively. The comparative increases for the United States were much smaller: 0.6 percent to 1.8 percent for computer and information sciences and 0.4 percent to 0.5 percent for engineering. China’s second-half progress in mathematics and statistics publications was more muted. China’s publications in these subjects increased at an annual rate of 10.1 percent in the first half of the decade while the United States’ increased at 2.6 percent. In the second half of the decade, China’s annual growth rate fell slightly to 8.8 precent while the United States’ rose to 3.3 percent.
Figure 24: Number of technical sciences articles in China relative to the United States, by subject[75]
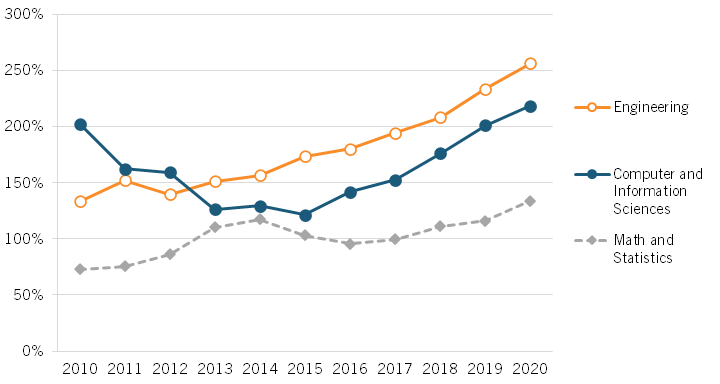
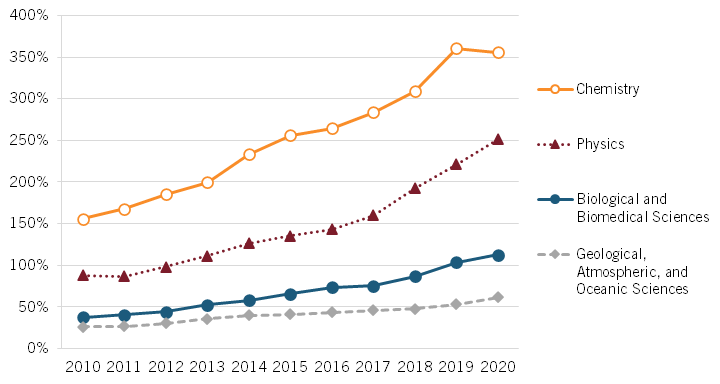
Figure 25 focuses on the natural sciences. China entered the decade out-publishing the United States in only chemistry, though by the end of the decade, it published 3.5 times as many articles as the United States in chemistry, 2.5 times as many in physics, and 12.8 percent more in biological and biomedical sciences. In contrast to the technical sciences, China’s annual growth rate in publication output increased from the first to the second half of the decade in only physics (7.1 percent to 10 percent). This was true for the United States for only geological, atmospheric, and oceanic sciences (2.1 percent to 3 percent), but the decreases in the United States’ annual growth rates in biological and biomedical sciences (1.2 percent to 0.5 percent) and chemistry (0.9 percent to -0.21 percent) were smaller than China’s (13.3 percent to 11.9 percent and 11.4 percent to 6.6 percent, respectively). Hence, while China still made progress relative to the United States in biological and biomedical sciences, chemistry, and geological, atmospheric, and oceanic sciences in the second half of the decade, it did so at a slower pace.
Figure 25: Number of natural sciences articles in China relative to the United States, by subject[76]
Science and Engineering Articles per Capita
Again, accounting for the size of China’s population provides a clearer picture. Because China’s population was approximately 4.3 times larger than that of the United States throughout the decade, per capita progress closely matched progress when considering total measures. Over the last decade, China went from publishing 15.9 percent of the United States’ science and engineering articles per capita in 2010 to 29.1 percent in 2020 (figure 26), when it published 523.2 science and engineering articles per million residents compared with the United States’ 1,810.1.
Figure 26: Number of science and engineering articles per capita in China relative to the United States[77]
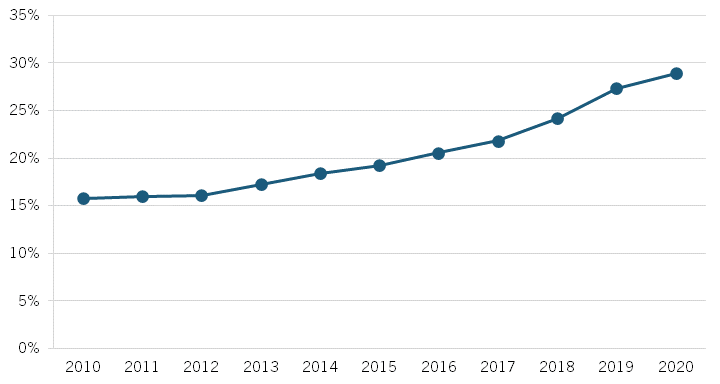
Figure 27 shows China’s number of articles per capita in the technical sciences relative to the United States by subject. China produced fewer than half as many articles per capita than did the United States in each of the three categories in 2010 (and less than 20 percent as many in mathematics and statistics). This increased for each subject, though China only produced 59.9 percent as many engineering articles, 51.1 percent as many computer and information sciences articles, and 31.1 percent as many mathematics and statistics articles per capita than did the United States in 2020. China produced 122.7, 62.5, and 12.6 articles in these subjects per million residents, respectively, in 2020.
Figure 27: Number of technical sciences articles per capita in China relative to the United States, by subject[78]
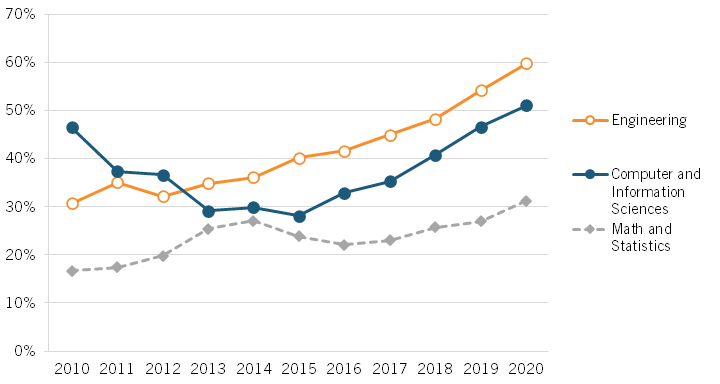
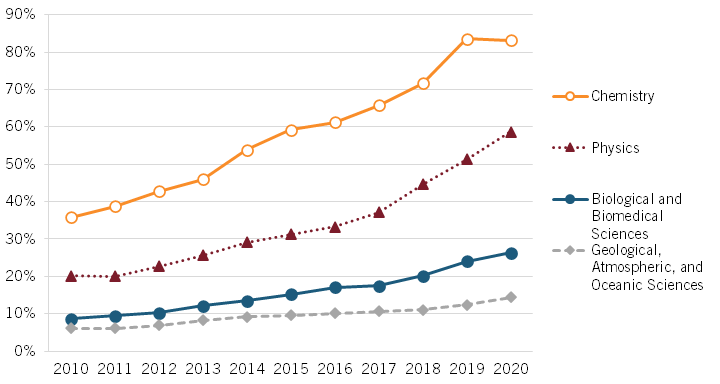
Figure 28 shows the relative per capita figures for the natural sciences. Again, China produced fewer than half as many articles per capita as did the United States in each subject entering the decade (and less than 10 percent as many in the biological and biomedical sciences and the geological, atmospheric, and oceanic sciences). China experienced consistent growth relative to the United States in each of the subjects throughout the decade, and China’s per capita output of chemistry articles approached the U.S. level by the end of that period. In 2020, China produced 83.1 percent as many articles per capita as did the United States in chemistry; 58.7 percent as many in physics; 26.4 percent as many in the biological and biomedical sciences; and 14.4 percent as many in the geological, atmospheric, and oceanic sciences. China produced 39.2, 47.6, 51.8, and 72.7 articles per million residents in these subjects, respectively, in 2020.
Figure 28: Number of natural sciences articles per capita in China relative to the United States, by subject[79]
Top-Cited Science and Engineering Articles
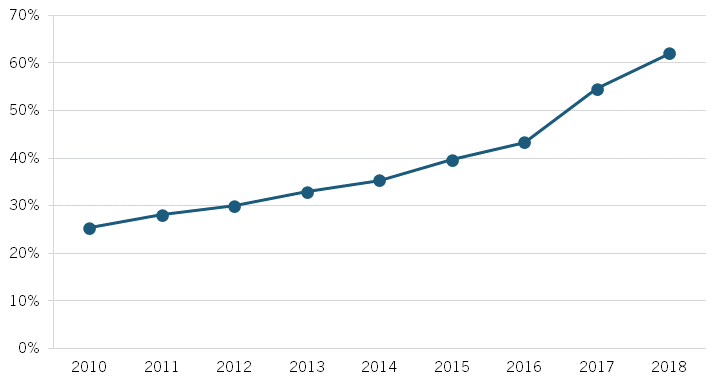
Beyond the sheer volume of a nation’s science and engineering articles published, it is useful to gauge the quality of those articles. One way to do this is by measuring what share of that nation’s articles are among the most cited in their fields. The following figures compare what shares of China’s science and engineering articles are among the top 1 percent in citations in the two years following their publications. By definition, the global (weighted) average is 1 percent. In 2010, only 0.5 percent of China’s science and engineering articles were among the most cited, compared with 1.9 percent for the United States (figure 29). By 2018, however, China attained the global average of 1 percent while the share of the United States’ science and engineering articles among the most published dropped to 1.6 percent. This means China’s science and engineering articles were approximately 60 percent as likely to be among the top 1 percent in citations as were U.S. articles in 2018.
Figure 29: Share of Chinese science and engineering articles ranking among the top 1 percent globally in citations relative to the United States[80]
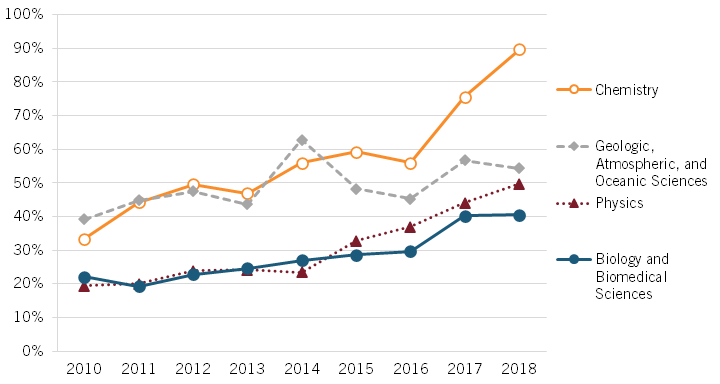
Looking at individual science and engineering subjects, we see that the gains in influence relative to U.S. articles were universal (figure 30 and figure 31). The biggest relative gains made were in mathematics and statistics (where Chinese articles were 68 percent more likely to be among the top 1 percent in citations than their American counterparts in 2018) and chemistry (where Chinese articles were only 11.3 percent less likely to be among the most cited in 2018). China came close to U.S. levels of influence in engineering research, as China’s engineering publications were 74.6 percent as likely as their American counterparts to be among the most cited in 2018.
Figure 30: Share of Chinese technical sciences articles ranking among the top 1 percent globally in citations relative to the United States, by subject[81]
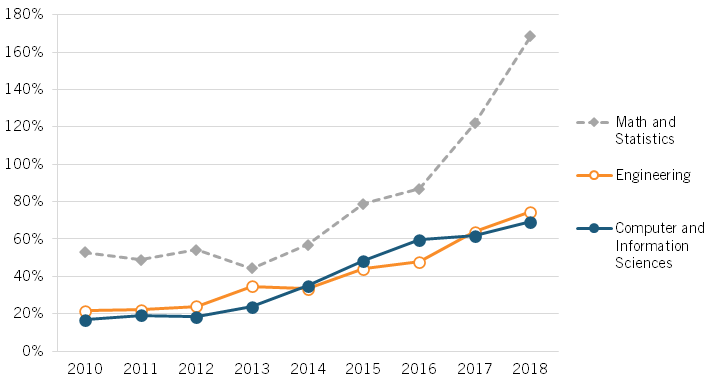
Figure 31: Share of Chinese natural sciences articles ranking among the top 1 percent globally in citations relative to the United States, by subject[82]
International Patent Families
An international patent family (IPF) is the collection of all patents covering the same or very similar inventions in multiple countries. As mentioned previously, patent activity in China can be somewhat misleading in the years following MLP in 2006, since the government’s encouragement of patent applications likely triggered an increase in applications for inventions that were not practical or economical.[83] However, data regarding international patent families considers inventions for which patents were granted in several countries, which avoids counting patents for which there is no noteworthy difference between inventions as multiple patents and counting the likely less-valuable patents only filed in the inventor’s home country. While this does not completely erase the issue of China’s high proportion of relatively worthless patents (a Chinese patentholder can file a patent in another country with a cheap and easy patent process—and this measure does not differentiate between less-useful design and utility patents and more-useful invention patents), it does mitigate it and is preferable to a measure of patents filed with just the Chinese patent office or some other specific nation’s patent office.
Total IPFs
China entered the decade already receiving 9.4 percent more total IPFs per year than did the United States, and by 2020, it was awarded 378.4 percent more (figure 32). Over the course of the decade, China’s IPFs granted increased from 80,556 to 456,088 while the United States’ increased from 73,622 to 95,347. From 2010 to 2015, China’s IPFs granted increased at a staggering annual rate of 26 percent compared with the United States’ 4.3 percent. Growth slowed for both countries in the second half of the decade: China’s annual growth rate more than halved to 12.3 percent while the United States’ fell to 1 percent.
Figure 32: Number of international patent families granted to Chinese entities relative to the United States[84]
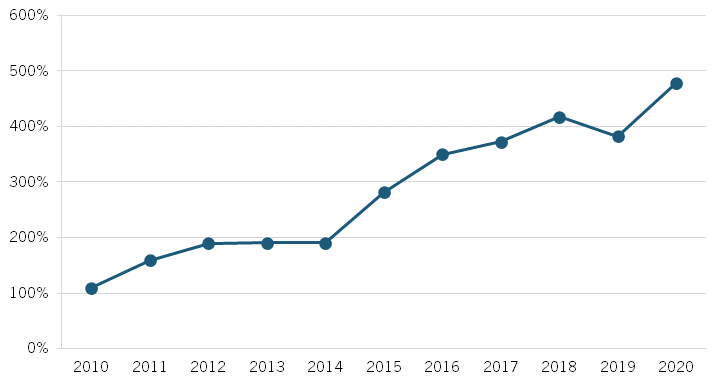
As shown in figure 33, China’s IPFs granted were fewer than those of the United States entering the decade in three of the four ICTs considered: telecommunications (77.7 percent of the U.S. level), computer technology (33.7 percent), and semiconductors (79 percent). By 2016, China surpassed the United States in all four ICTs. By the end of the decade, it received more than three times as many IPFs in each technology than did the United States. Moreover, China pulled away from the United States in the second half of the decade at a faster rate than it caught up in the first half for each ICT. In each technology except for semiconductors, this was a result of IPF growth rates increasing for China and falling for the United States. For semiconductors, IPF growth fell for both countries. However, for China, it only fell from 18.8 percent per year in 2010–2015 to 14.4 percent per year in 2015–2020. In the United States, the annual growth rate in semiconductor IFPs granted fell from 3.3 percent to -3.5 percent.
Figure 33: Number of ICT international patent families granted to Chinese entities relative to the United States, by field[85]
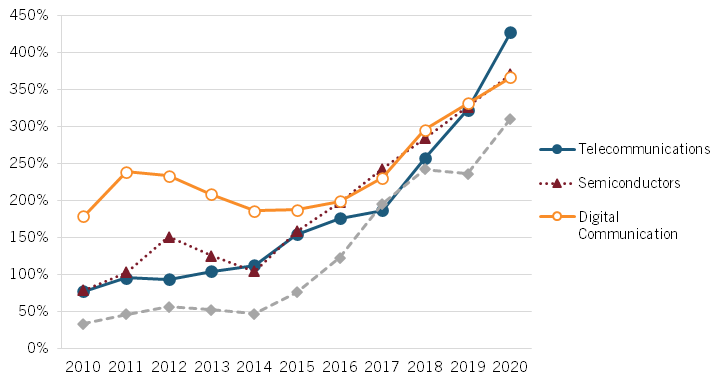
As with ICTs, MIC cites biopharmaceuticals/biotechnologies as an industry in which China aims to be a self-sufficient world leader and innovator. China entered the decade receiving more IPFs than did the United States in biotechnology (54.3 percent more) and pharmaceuticals (228.2 percent more), and it received only 38.5 percent as many medical technology IPFs, as seen in figure 34. China’s growth in medical technology IPFs relative to the United States was steady throughout the decade, and China was granted 74.6 percent more such IPFs than was the United States in 2020. Relative growth in biotechnology and pharmaceuticals was much more sporadic. In both technologies, China ceded ground to the United States during the middle of the decade due to significant decreases in China’s IPFs received per year. From 2013 to 2017, China’s IPFs awarded in biotechnology and pharmaceuticals dropped 24.8 percent and 33 percent, respectively. However, this quickly and significantly reversed. Between 2017 and 2020, China’s IPFs granted increased by 135.5 percent and 42.2 percent, respectively. Meanwhile, the United States’ biotechnology IPFs granted fell by 16.1 percent during that span. In 2020, China received approximately seven times as many biotechnology IPFs and over four times as many pharmaceuticals IPFs as did the United States.
Figure 34: Number of life sciences international patent families granted to Chinese entities relative to the United States, by field[86]
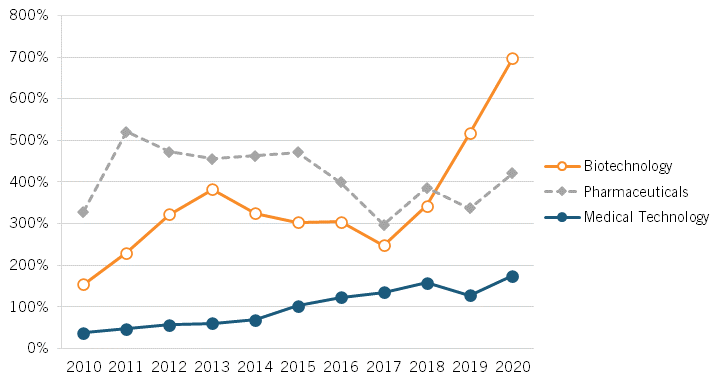
Environmental technologies (ETs), especially low-emission power-generating technologies, are paramount in a world that must rein in carbon emissions to confront global warming. These technologies are consistently included in China’s many lists of priority technologies. Specifically, MIC singles out new-energy motor vehicles as a technology in which China hopes to become a global leader. In 2010, China was already awarded twice as many ET IPFs as was the United States (figure 35). By 2020, this ballooned to 11.4 times as many despite two separate periods of little to no growth relative to the United States that account for half the decade (2012–2014 and 2016–2019). Between 2010 and 2015, China’s ET IPFs grew at a staggering 32.5 percent per year, compared with the United States’ 2.6 percent. These figures dropped to 8.8 percent per year and -0.7 percent per year for the two countries, respectively.
In the United States, the annual growth rate in semiconductor IPFs granted fell from 3.3 percent in the first half of the decade to -3.5 percent in the second half of the decade.
Figure 35: Number of enviro-tech international patent families granted to Chinese entities relative to the United States, 2010–2020[87]
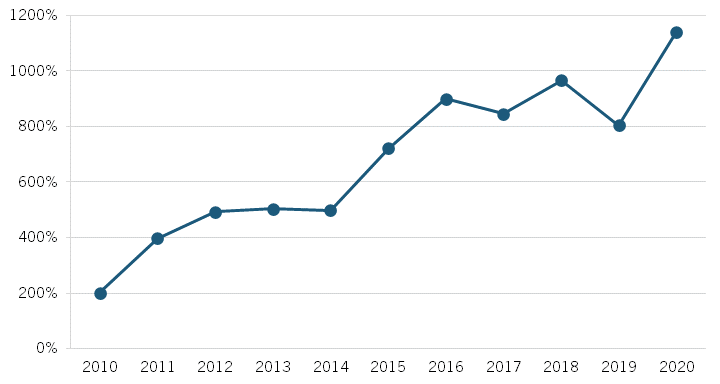
IPFs per Capita
Figure 36 shows China’s IPFs per capita relative to the United States’. China entered the decade only receiving one-quarter of the IPFs per capita the United States received (59.9 IPFs per million residents versus 238). However, by the end of the decade, China surpassed the United States in IPFs per capita: China received 321.4 IPFs per million residents in 2020, which was 11.7 percent more than the United States’ 287.6.
Figure 36: Number of international patent families granted to Chinese entities per capita relative to the United States[88]
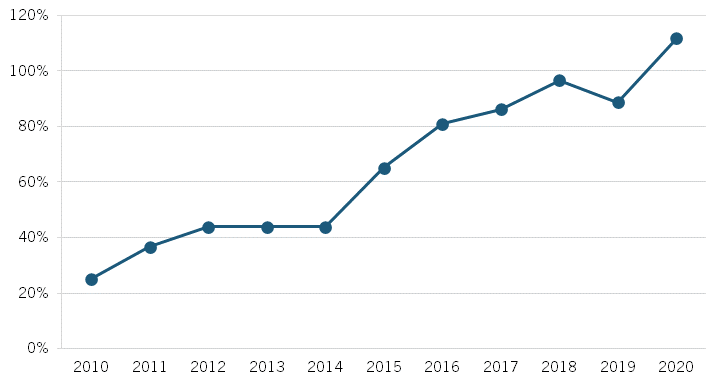
Figure 37 shows China’s ICT IPFs per capita relative to the United States’ broken down by field of technology. Again, China made significant progress in each technology. By 2020, China received more than 75 percent as many IPFs per capita as did the United States in each field and surpassed the United States with regard to telecommunications IPFs. Relative growth was faster in the second half of the decade than in the first for each of the four technologies.
Figure 37: Number of ICT international patent families granted to Chinese entities per capita relative to the United States, by field[89]
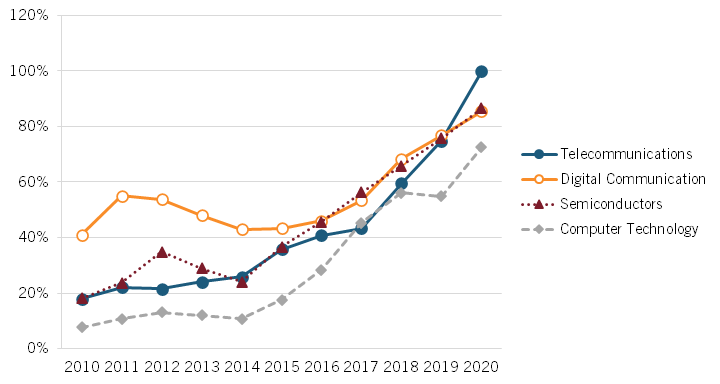
Figure 38 shows China’s life sciences IPFs per capita relative to the United States’ broken down by technology area. China’s progress was most significant in biotechnology, in which it received 62.8 percent more IPFs per capita than did the United States by the end of the decade. Though China made progress in each of the three areas, China’s pharmaceutical IPFs per capita relative to the United States finished the decade well below its peak of 119.8 percent of the U.S. level in 2011.
Figure 38: Number of life sciences international patent families granted to Chinese entities per capita relative to the United States, by field[90]
Figure 39 shows China’s ET IPFs per capita relative to the United States. China entered the decade producing fewer than half as many ET IPFs per capita as the United States. However, this quickly changed, as China surpassed the United States in 2012. China’s progress continued, and by the end of the decade, China produced 166.6 percent more ET IPFs per capita than did the United States.
Figure 39: Number of enviro-tech international patent families granted to Chinese entities per capita relative to the United States[91]
International IP Receipts
One way to measure the worth of patents granted is to measure the international licensing receipts Chinese patent and trademark holders receive. Cross-border receipts provide a measure of how valuable foreign entities view China’s IP relative to those of other countries.
Total International IP Receipts
As seen in figure 40, China receives very little in cross-border IP receipts compared with the United States, supporting the argument that China’s surge in patent filing is rather hollow. China’s $1.2 billion in international IP receipts in 2010 was only 1.3 percent of the United States’ $95 billion. For much of the decade, this remained the case. However, starting in 2016–2017, China’s international IP receipts increased at breakneck pace. Between 2016 and 2017 alone, China’s international IP receipts tripled from $1.8 billion to $5.4 billion, and by 2020, they were $9.3 billion. While this was still only 7.5 percent of the U.S. level ($113.8 billion), China’s progress—both in absolute and relative terms—is quite staggering.
Figure 40: Value of cross-border IP licensing receipts by Chinese entities relative to the United States[92]
International IP Receipts as a Share of GDP
Taking these receipts as a share of GDP, as shown in figure 41, accounts for the size of each economy and measures the extent to which they specialize in producing IP for the competitive international market. In 2010, China’s international IP receipts accounted for only 0.02 percent of its GDP, compared with 0.63 percent for the United States. Again, China’s international IP receipts as a share of GDP remained miniscule relative to the United States’ before ballooning in 2017. By 2020, China’s receipts accounted for 0.06 percent of its GDP, which was 11.3 percent of the U.S. level.
Figure 41: Value of cross-border IP licensing receipts by Chinese entities as a share of GDP relative to the United States[93]
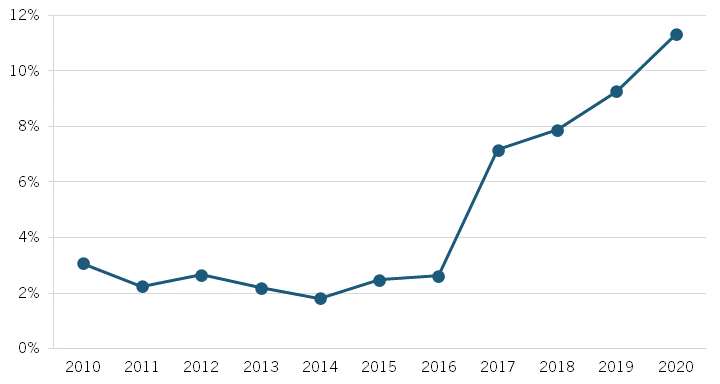
Summary of Innovation Outputs
Innovation outputs are where China made the most progress relative to the United States and where it ended the decade with the largest advantage—and China appears to have shaken off the “fat tech dragon” moniker. By the end of the decade, China published more scientific articles in all fields reviewed except for the geological, atmospheric, and oceanic sciences, but citations data shows that its research is still less influential than the United States’ in all fields except mathematics and statistics. China surpassed the United States in IPFs granted in every field, and it caught up to or surpassed the United States on a per capita basis in telecommunications, pharmaceuticals, biotechnology, and ETs. Incredibly, China received 11.4 times as many ET IPFs in total and more than 2.5 times as many on a per capita basis than did the United States in 2020. Cross-border IP receipts suggest China’s IP is still far less valuable than the United States’. However, China made rapid progress in this regard starting in 2016–2017. Between 2016 and 2020, China’s cross-border IP receipts increased by over 400 percent and its IP receipts as a share of its GDP quadrupled.
Innovation Outcomes
Production in High-R&D Industries
One important innovation market outcome is increased production in high-R&D industries. The industries included are 1) aircraft manufacturing; 2) computer, electronics, and optical products manufacturing; 3) pharmaceuticals manufacturing; 4) scientific R&D services; and 5) publishing (including software).
Total Production
China’s value added in high-R&D industries amounted to only 34.4 percent of the U.S. level in 2010 (figure 42). China’s progress slowed in the middle of the decade, which corresponds with a slowdown in the broader Chinese economy. But overall, China gained ground steadily, and by 2018, its value added in these industries was 64.1 percent that of the United States. China entered the decade already well ahead of the United States in exports in high-R&D industries, exporting more than twice as much as the United States did in 2010, thanks to its computer, electronics, and optical products exports. Again, China’s progress reversed temporarily in the middle of the decade, but by 2018, China’s exports were almost three times that of U.S. exports in these industries.
Figure 42: Chinese production in high-R&D industries relative to the United States[94]
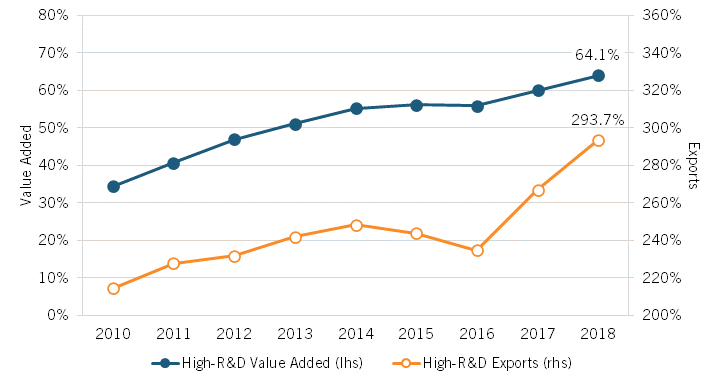
Production as a Share of GDP and Exports
However, these figures, while useful, do not account for the size of China’s economy or its overall economic growth during the decade. Considering value added as a share of GDP shows the extent to which an economy specializes in that industry. The same is true for industry exports as a share of total exports, though the specialization is then focused on the goods and services the country produces for the competitive international market.
Rather than considering their absolute values, figure 43 considers each country’s value added and exports in high-R&D industries as shares of their GDPs and total gross exports, respectively. Value added in these industries accounted for 4.1 percent of China’s GDP and 5.1 percent of the United States’ in 2010. By 2018, value added in these industries accounted for 4.7 percent of China’s GDP while the United States’ share was unchanged. Thus, while the United States’ degree of specialization remained essentially unchanged in these industries throughout the decade, China’s increased (to 92.3 percent of the U.S. level).
In 2010, China’s high-R&D exports accounted for 27 percent of gross exports compared with 11.7 percent in the United States. Export specialization in these industries decreased for both countries in the first half of the decade. By 2015, high-R&D exports accounted for 22.6 percent of China’s gross exports and 10.5 percent of the United States’. However, after this point, China reversed course, while export share in the United States continued to decrease. By 2018, these industries accounted for 24.9 percent of China’s exports and 9.8 percent of the United States’.
Figure 43: China’s value added and export shares in R&D-intense industries relative to the United States’[95]
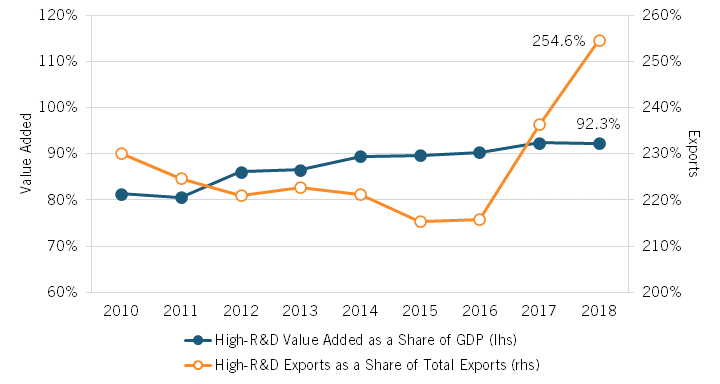
Value Added in Advanced Industries
Total Value Added
Figure 44 and figure 45 carry the value-added analysis further, focusing on seven advanced industries: 1) computer, electronic, and optical products manufacturing; 2) computer programming, consulting, and information services; 3) electrical equipment manufacturing; 4) motor vehicle manufacturing; 5) other transport equipment manufacturing; 6) pharmaceuticals manufacturing; and 7) professional, scientific, and technical activities.
China’s value-added growth in all industries slowed from the first half of the decade to the second, both relative to the United States and in absolute terms. This again corresponds to China’s broader economic slowdown. Nonetheless, China’s value added in each industry relative to the United States was higher in 2018 than in 2010. China’s largest absolute gain was in electrical equipment manufacturing, where its value added increased from 231 percent to 314.2 percent of the U.S. level. China’s largest relative gain was in professional, scientific, and technical activities, which saw its value added relative to the United States double from 2010 to 2018, although this was only from 8.5 to 19.8 percent of the U.S. level. Progress in pharmaceuticals manufacturing was also notable, increasing from 42.2 percent to 73.1 percent of the U.S. level.
Figure 44: China’s value added in advanced industries relative to the United States’[96]
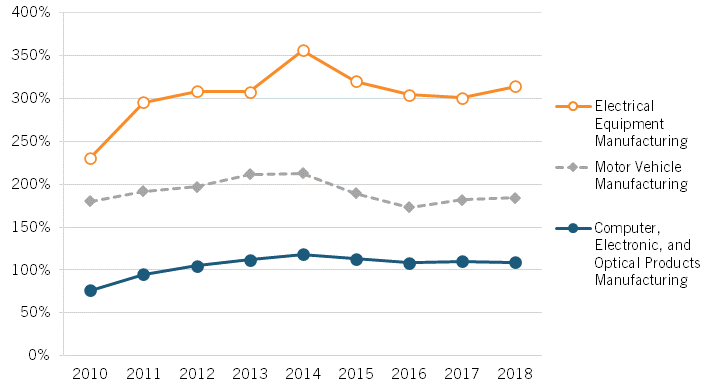
China’s fastest individual growth was in the four industries—computer programming, consulting, and information services; other transport equipment manufacturing; pharmaceuticals manufacturing; and professional, scientific, and technical activities—in which China’s value added had not reached U.S. levels. Despite the mid-decade slowdown, these four industries averaged an annual growth rate of 12.2 percent in China from 2010 to 2018, compared with 5 percent for the United States. What’s more, China’s value-added growth was fastest in the two service industries: computer programming, consulting, and information services; and professional, scientific, and technical activities. This suggests that China is transitioning from a manufacturing-based economy to one more dependent on high-value-added services.
Figure 45: China’s value added in advanced industries relative to the United States’ (continued)
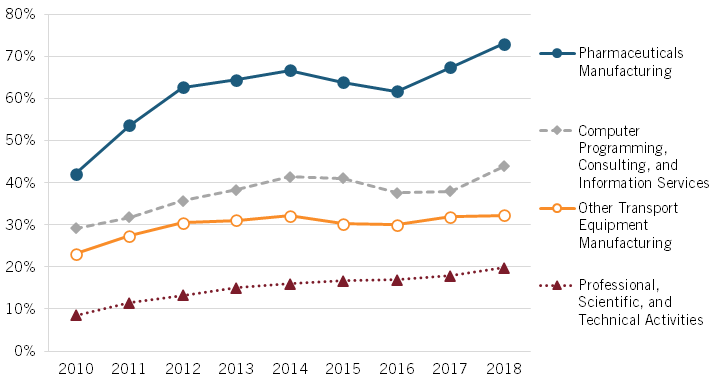
Value Added as a Share of GDP
Figure 46 and figure 47 consider value added as a share of GDP. In all industries except pharmaceuticals manufacturing and professional, scientific, and technical activities, China’s specialization relative to the United States decreased. However, for pharmaceuticals manufacturing, this was because value added in the industry as a share of GDP fell slightly for the United States (rather than China becoming more specialized in the industry). In 2010, value added in the industry accounted for 0.9 percent of GDP for both countries. By 2018, this fell to 0.8 percent for the United States. In contrast, both countries became more specialized in professional, scientific, and technical activities, but China did so at a faster pace. In 2010, value added in the industry accounted for 1.5 percent of China’s GDP and 7.5 percent of the United States’. By 2018, these figures increased to 2.2 percent and 7.7 percent, respectively.
In four of the five industries for which China’s specialization relative to the United States decreased, China’s individual degree of specialization decreased. For example, value added in the electrical equipment manufacturing industry accounted for 1.9 percent of China’s GDP in 2010 but only 1.4 percent in 2018. The exception was computer programming, consulting, and information services. Both countries became more specialized in the industry, but the United States did so at a faster pace. In 2010, value added in the industry accounted for 1.4 percent of China’s GDP and 2 percent of the United States’. By 2018, those numbers increased to 1.8 percent and 2.9 percent, respectively.
Figure 46: China’s value added in advanced industries as a share of GDP relative to the United States’[97]
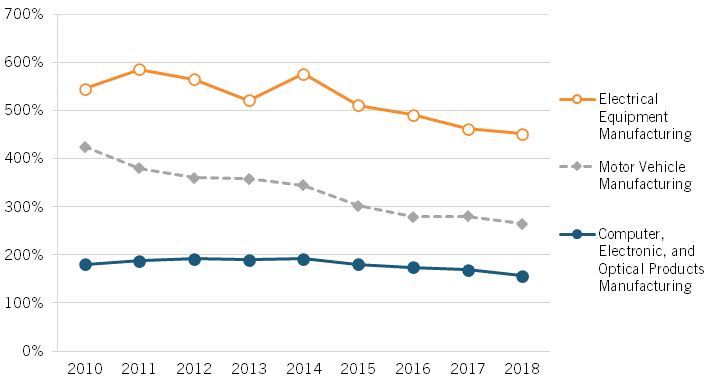
Figure 47: China’s value added in advanced industries as a share of GDP relative to the United States’ (continued)
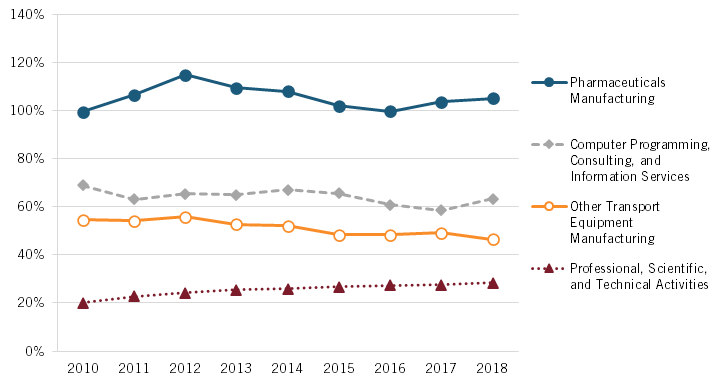
Exports in Advanced Industries
Gross Industry Exports
Figure 48 and figure 49 consider each country’s exports in the advanced industries. China’s exports relative to the United States increased in the following industries: computer, electronic, and optical products manufacturing (from 307.1 percent to 482.3 percent of the U.S. level); computer programming, consulting, and information services (from 89.2 percent to 99.6 percent); electrical equipment manufacturing (from 464.6 percent to 672.4 percent); motor vehicles manufacturing (from 33.8 percent to 43.6 percent); and pharmaceuticals manufacturing (from 27.1 percent to 54.7 percent). China’s exports relative to the United States’ fell for only other transport equipment manufacturing (from 48.6 percent to 37.5 percent of the U.S. level) and professional, technical, and scientific activities (from 27.9 percent to 24.7 percent).
Figure 48: China’s exports in advanced industries relative to the United States’[98]
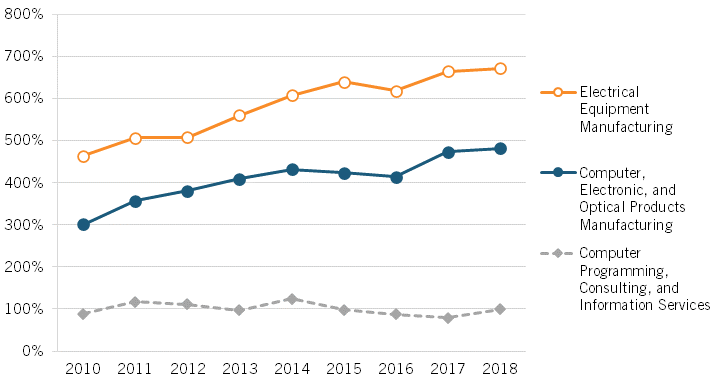
China’s progress relative to the United States was more meager in computer programming, consulting, and information services than in some of the other industries because this is the industry in which each country saw the largest increase in exports. Between 2010 and 2018, China’s exports in the industry grew at an annual rate of 17 percent, while the United States’ grew at an annual rate of 15.4 percent. China also saw significant growth in its pharmaceuticals exports, which increased at an annual rate of 12.8 percent, although the value of these exports fluctuated significantly.
Figure 49: China’s exports in advanced industries relative to the United States’ (continued)
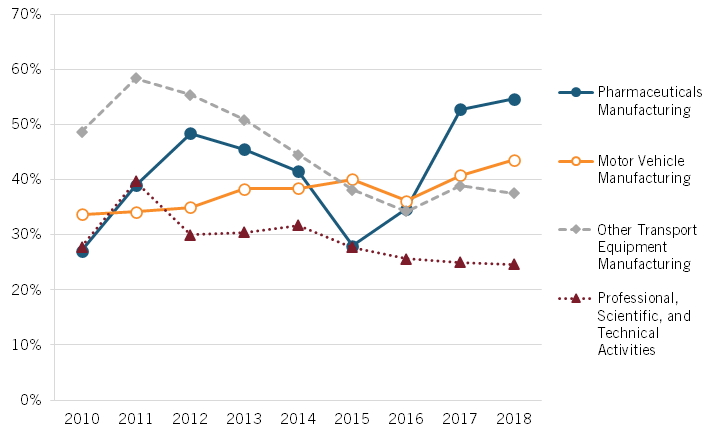
Gross Industry Exports as a Share of Total Gross Exports
As with value added, figure 50 and figure 51 show each advanced industry’s export share in China relative to the United States. Since the two countries’ gross exports dynamics were quite similar between 2010 and 2018, China’s progress here is very similar to its progress for absolute exports. China became relatively more export-specialized in the following industries: computer, electronic, and optical products manufacturing; electrical equipment manufacturing; motor vehicle manufacturing; and pharmaceuticals manufacturing. However, China became individually less export-specialized in computer, electronic, and optical products manufacturing and motor vehicles manufacturing, albeit at a slower pace than the United States.
Note that contrary to absolute exports, the export share of China’s computer programming, consulting, and information services industry relative to that of the United States fell slightly. However, again, this is the industry in which each country’s export-specialization increased the most individually. In 2010, the industry made up 0.9 percent of each country’s exports. By 2018, it made up 1.9 percent of China’s exports and 2.1 percent of U.S. exports.
Figure 50: China’s exports in advanced industries as a share of its total exports relative to the United States’[99]
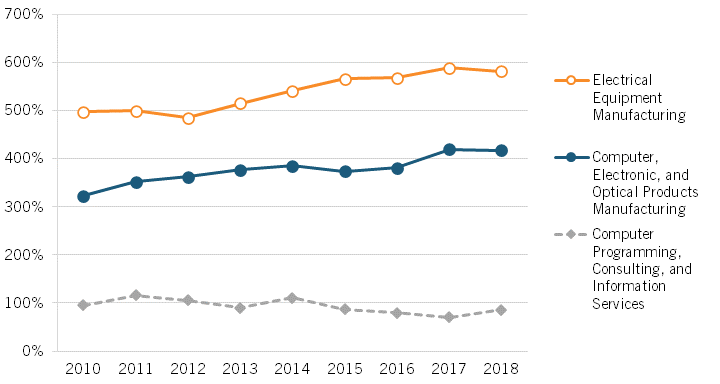
Figure 51: China’s exports in advanced industries as a share of its total exports relative to the United States’ (continued)
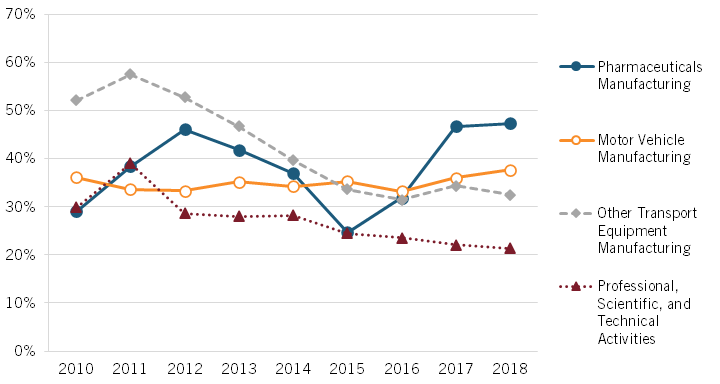
Economic Complexity
Harvard Growth Lab’s Atlas of Economic Complexity created the Economic Complexity Index (ECI) to measure how complex a country’s economy is based on what it exports, what it could easily start exporting, how many other countries export its products, and how easily other countries could start exporting its products. It provides index scores for each country going back to 2000. In 2010, China was given an ECI score of 1.05, which was 67 percent of the United States’ score of 1.56 (figure 52). For reference, this ranked the two countries 24th and 12th, respectively (the appendix provides global heat maps of 2020 scores for the indices used as indicators along with the top 10 highest-scoring countries). In 2020, China’s score jumped to 1.3, while the United States’ score fell to 1.47 (17th and 12th, respectively). China’s decade-high score was 1.38 in 2018, while the United States’ was 1.72 in 2015.
Figure 52: China’s ECI score relative to the United States’[100]
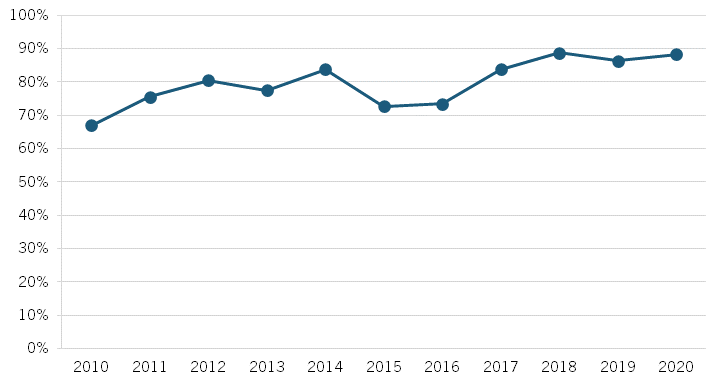
Supercomputers
A useful indicator of a country’s standing in terms of frontier, emerging technologies is the number and quality of its supercomputers (or “high-performance computers”). Supercomputers are amazing technological feats in their own right but are also used in firms’ operation maximization and to conduct research where processing massive amounts of data quickly is required (e.g., COVID-19 epidemiological and vaccine-related research).[101] The U.S. government uses and funds the use of supercomputers in fields such as homeland security, weather prediction, and the monitoring of financial markets.[102] The development of world-class supercomputing systems is an explicit goal for both countries.
The performance of a computing system is measured by the number of operations it can perform per second (FLOPS) or, more commonly, the number of billions of operations it can perform per second (GFLOPS). Intel’s 11th-generation Core processors, widely used in personal computers, can perform up to 211 GFLOPS.[103] The United States’ “Frontier” supercomputer at Oak Ridge National Laboratory, officially the most powerful supercomputer in the world as of June 2022, reached the treasured level of “exascale,” meaning it can perform at least one EXAFLOPS, or 1,000,000,000 GFLOPS, or 1018 FLOPS. Specifically, Frontier is capable of 1,102,000,000 GFLOPS.[104]
In 2010, China had only 41 of the world’s 500 most powerful supercomputers compared with the United States’ 276. By the end of the decade, China had 89 percent more of the world’s top 500 supercomputers than did the United States, possessing 214 to the United States’ 113 (figure 53). However, as Figure 49 also shows, the cumulative realized performance of these supercomputers is still behind that of the United States. While China’s top supercomputers made gains against the top U.S. supercomputers, they still only possessed 85 percent of the cumulative computing power in 2020, and part of China’s gains were reversed starting in 2018. From 2017 to 2018, the cumulative computing power of the United States’ top supercomputers more than doubled while China’s “only” increased by 46.6 percent. Nevertheless, China’s relative growth in cumulative supercomputer performance was impressive across the decade as a whole, increasing from 25.3 percent of the United States’ cumulative computing power in 2010 to 84.7 percent in 2020.
However, as mentioned previously, China has recently become much more secretive about its major breakthroughs in high-performance computing. A report by The Next Platform’s Nicole Hemsoth from October of last year suggests that China had already achieved exascale performance on two separate systems.[105] Therefore, China’s progress is likely understated by the available data, and the plateauing of its progress relative to the United States in both number of systems and cumulative performance in the latter half of the decade may simply be a result of China’s keeping its cards close to its chest.
Figure 53: Chinese supercomputers among the top 500 relative to the United States[106]
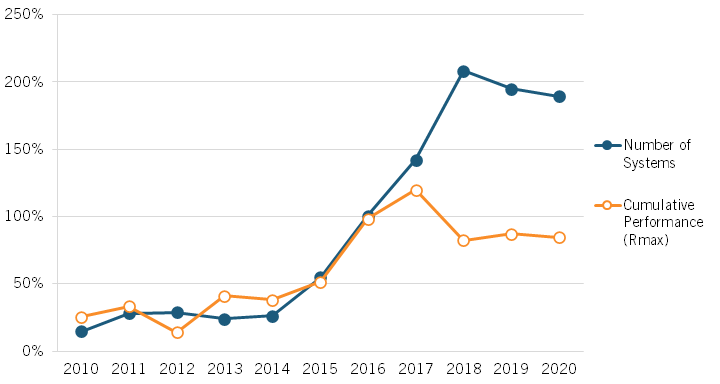
Industrial Robot Usage
Increased automation in the manufacturing sector is an indication of an economy’s productive efficiency and a stated goal of MIC. This is especially important for China, which will face a demographic challenge earlier in its development than do most countries, presenting it with the task of providing for a surge in elderly retirees with a declining working-age population.
Industrial Robot Density
As shown in Figure 54, China’s industrial robot density, the number of robots employed in industry relative to the number of human workers, increased dramatically over the previous decade. In 2010, China employed only 11.5 percent as many industrial robots per worker as did the United States (15 and 130 robots per 10,000 workers, respectively). By 2015, this number increased to 29.1 percent, and by 2020, China almost completely closed the gap and employed 96.5 percent as many industrial robots per worker as did the United States (246 and 255 robots per 10,000 workers, respectively). Not only have China’s relative (and absolute) gains been significant, but the rate of increase rose throughout the decade. China’s industrial robot density relative to the United States’ grew at an annual rate of 20.4 percent in 2010–2015 and 27.1 percent in 2015–2020.
Figure 54: Industrial robot density in China relative to the United States[107]
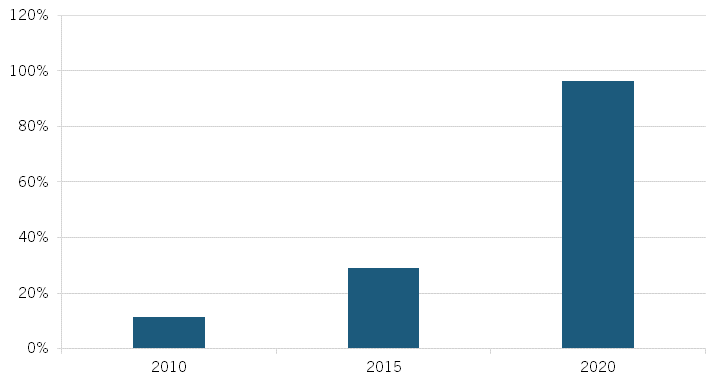
Mobile Cellular and Fixed Broadband Subscriptions
Access to the Internet and the ability to communicate with others remotely is increasingly necessary in the modern economy, especially with the rise in e-commerce and mobile payment systems. Internet access also means access to a dearth of information from around the world and, increasingly, to educational and government resources.
Total Subscriptions
Figure 55 shows China’s total number of mobile cellular and fixed broadband subscriptions relative to the United States’. Entering the decade, China had 206.5 percent more mobile cellular subscriptions and 52 percent more fixed broadband subscriptions than did the United States. While China’s number of mobile cellular subscriptions relative to the United States’ decreased between 2013 and 2016, China finished the decade with just under five times as many mobile cellular subscriptions as did the United States (1,743.1 million versus 351.5 million). China’s progress relative to the United States was steadier for fixed broadband subscriptions, and in 2020, China had four times as many such subscriptions as did the United States (486.6 million versus121.4 million).
Figure 55: Number of mobile cellular and fixed broadband subscriptions in China relative to the United States[108]
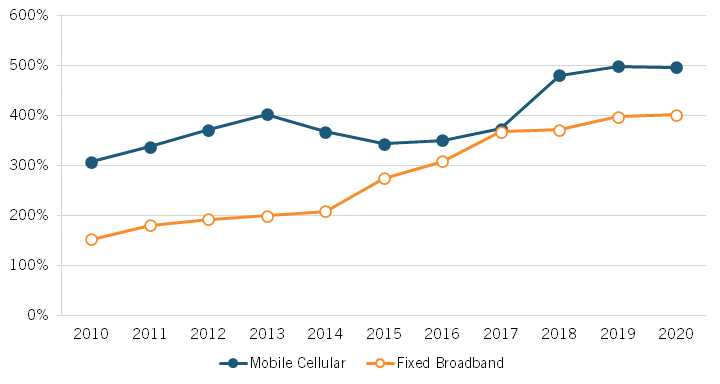
Developing during the transition from fixed to mobile Internet connections made China more adaptable to a digital economy and society. For example, the Chinese economy has fully embraced the rise of digital innovations such as e-commerce and digital payment platforms: China accounted for approximately 60 percent of global e-commerce sales in 2020 and half of all digital payments made in 2017.[109]
Subscriptions per Capita/Household
In terms of mobile phone subscriptions per capita, China has surpassed the United States, going from 70.5 percent as many subscriptions per capita in 2010 to 15.9 percent more in 2020 (figure 56). China’s relative gains in the second half of the decade were greater than in the first half, but this is primarily due to a decline in the United States’ mobile phone subscriptions per capita between 2015 and 2020. In terms of fixed broadband subscriptions per household, China still lagged behind the United States in 2020, but it had almost completely caught up (98 percent as many subscriptions per household) and actually had more fixed broadband subscriptions per household than did the United States in 2017–2019.
Figure 56: Number of mobile phone subscriptions per capita and fixed broadband subscriptions per household in China relative to the United States[110]
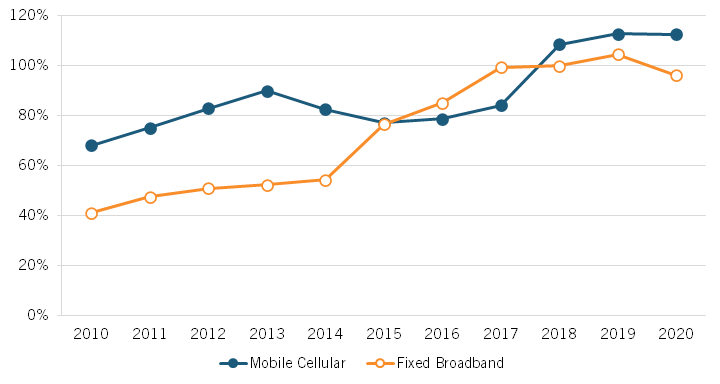
Mobile Connectivity
GSMA’s Mobile Connectivity Index (MCI) measures the extent to which mobile Internet adoption is enabled in a country. It does so by considering a series of indicators in areas such as coverage, performance, customer readiness, and content and services. Unfortunately, results and the data used to calculate them only go back to 2014. China made some progress in this metric relative to the United States in the second half of the decade. China’s MCI score in 2014 was 62.3, which was 83.2 percent of the United States’ score of 74.8 (figure 57). By 2020, China’s score increased to 79.2 while the United States’ increased to 87.6. These scores match the 2014–2020 high for both countries.
Figure 57: China’s MCI score relative to the United States’[111]
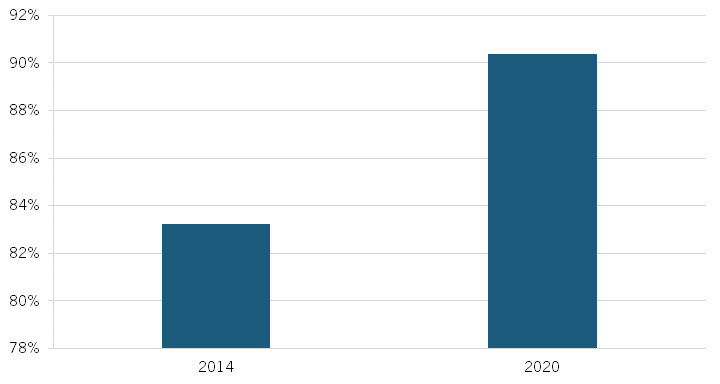
E-Government
E-government refers to the use of digital applications to expand or enhance government services. With society becoming more digitized and connected, use of ICTs to make government services more accessible and efficient is crucial. The United Nation’s E-Government Development Index (EGDI) measures the extent to which governments are succeeding in accommodating digitized societies. EGDI scores are calculated based on a government’s quality and scope of its online services, telecommunications infrastructure, and the society’s human capital. Between 2010 and 2020, China’s EDGI score increased from 55.2 percent of the U.S. score to 85.5 percent (Figure 54). China’s score in 2010 was 47.0, which ranked just 72nd in the world and slightly below the world average. The United States’ score of 85.1 ranked it second overall. By 2020, China’s score increased to 79.5, and its rank increased to 45th; the United States’ score increased to 93.0, but its rank fell to 9th.
Figure 58: China’s EGDI score relative to the United States[112]
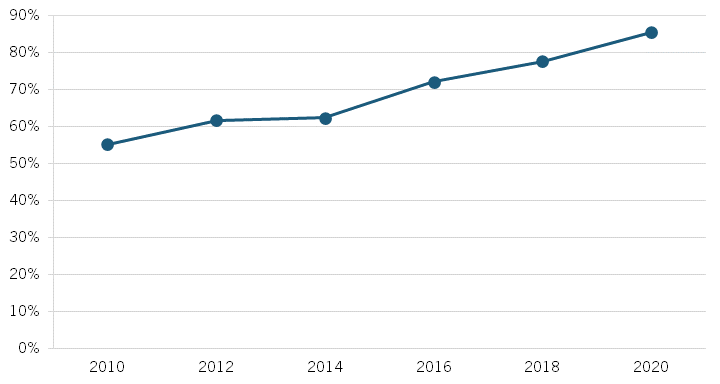
Cybersecurity
Cyberattacks are becoming more common and are increasingly carried out by sophisticated organizations rather than just individual actors.[113] As digital data and connections become more integral to economies and societies, it is paramount that they are properly protected. The Global Cybersecurity Index (GCI) published by the United Nations’ International Telecommunication Union measures each nation’s cybersecurity capabilities. In 2014, China’s GCI score of 44.1 was 53.5 percent of the United States’ score (figure 59). By 2020, China essentially caught up to the United States despite the latter scoring a perfect 100. China’s score of 92.5 was tied for 40th in the world.[114]
However, given cybersecurity’s importance for national and economic security, one should not place too much trust in this assessment. As with its supercomputing developments, it is plausible that China would choose to keep the true extent of its cybersecurity capabilities secret. A ranking of 40th in the world may therefore be underselling China’s true capabilities and its potential to build on them. In fact, in an International Institute for Strategic Studies report from last year, China was described as a “second-tier cyber power” but that “given its growing industrial base in digital technology, it is the state best placed to join the US in the first tier.”[115]
Figure 59: China’s GCI score relative to the United States’[116]

Summary of Innovation Outcomes
China became more specialized in high-R&D industries relative to the United States during the previous decade. It nearly reached the United States’ degree of overall specialization in these industries (as measured by value added as a share of GDP) and built on its lead in export specialization—though individually both countries became less export-specialized in these industries. China’s absolute value added in each advanced industry considered rose relative to the United States’, but this was largely a result of China’s faster overall economic growth. Considering each country’s value added in the advanced industries as a share of GDP shows that China became relatively more specialized in only pharmaceuticals manufacturing and professional, scientific, and technical activities. China built on its exports and export-specialization leads in computer, electronic, and optical products manufacturing and electrical equipment manufacturing—the two industries in which it was already well ahead of the United States entering the decade—and made notable progress in pharmaceuticals manufacturing. Although China became less export-specialized relative to the United States in computer programming, consulting, and information services, this was the industry in which China’s individual exports and export-specialization increased the most.
China’s ECI scores show that China’s basket of exports is becoming more complex, particularly relative to the United States’. In terms of the development and adoption of high-performance computers and industrial robots, China made extremely fast-paced progress, both individually and compared with the United States. While available data shows that the United States regained its lead in terms of the number and performance of top-performing supercomputers, recent reports suggest that this deserves a healthy dose of skepticism. China is now on par with the United States in terms of digital connectivity as measured by mobile and fixed broadband subscriptions and by MCI and EGDI scores. Furthermore, data suggests that China makes much more economic and social use of its digital infrastructure than does the United States. Per the GCI scores, China has nearly caught up with the United States in terms of cybersecurity capabilities, yet it still ranks just 40th in the world. However, these results, too, should be met with some skepticism, and evidence suggests China is best poised to join the United States as a true global leader in cybersecurity.
Discussion
Innovation Inputs
With respect to innovation inputs, China made tremendous progress in terms of the quality of its universities and the R&D investments made by its largest innovative companies such as Alibaba and Huawei. It also made steady progress in basic R&D intensity and its number of researchers as a share of the employed workforce—two indicators that are important as China tries to become more advanced in basic scientific research—as well as undergraduate degrees awarded per capita (considering the 20–29-year-old populations) in all fields and in science and engineering fields, specifically. Despite this progress, however, China still lags behind the United States by quite a bit across these indicators.
Where China continues to struggle relative to the United States and where it made little to no progress (and in some cases even ceded ground to the United States) is in doctoral degrees awarded per capita (considering the 25–39-year-old populations). However, this is likely to lag behind any progress made with respect to undergraduate degrees, and it is again important to realize where China is in its development process. Mainland China still only ranks 77th in the world in terms of GDP per capita.[117] While China’s reform and post-reform eras have facilitated the largest migration from rural to urban areas the world has ever seen, 37 percent of China’s population still lives in rural areas.[118] For reference, the last time the United States’ share of the population living in rural areas was that high was the 1940s.[119] As living standards rise and China’s population continues to urbanize, a greater proportion of it is sure to attend China’s universities as undergraduates and, for some, as doctorate students. As this transpires, China’s progress in foundational scientific research and engineering- and science-based innovations will likely pick up pace.
China’s high scores—both in absolute terms and relative to the United States’—in areas such as industrial robot usage, mobile Internet access, and cybersecurity show that China is already a world leader in the implementation of cutting-edge technologies.
Innovation Outputs
Innovation outputs are where China made its greatest progress, as China’s science and engineering research publications relative to the United States more than doubled; this was also true on average for the individual subjects reviewed. Although the influence of China’s research publications still lags behind that of the United States in all subjects reviewed except mathematics and statistics, China made significant and steady progress, suggesting that China’s quality of research is not being outpaced by its quantity. However, this deserves a caveat. The metric used does not differentiate between domestic and international citations. It would not be uncharacteristic for the CCP to encourage intranational citations, and it would not be out of the question for this to skew results somewhat given the sheer number of Chinese research articles and the Chinese government’s involvement in the country’s research network. In fact, a 2015 study by Li Tang, Philip Shapira, and Jan Youtie suggests that “clubbing”—the forming of a closed research network whose members largely only cite each other’s work—is prevalent in Chinese research.[120] Looking specifically at highly cited nanotechnology papers, the authors concluded that “a larger proportion of Chinese nanotechnology research citations are localized within individual, institutional, and national networks within China.”
In contrast to its research publications, data on China’s cross-border receipts for the use of its IP is further evidence that the country’s rapid increase in patent output is rather hollow, at least at first glance. As noted, China’s patent statistics, more than anything, reflect government incentives to file. As Georges Haour and Max von Zedtwitz have explained:
[M]onetary incentives are given to academics, granting them bonuses for every patent application. Professors with patents to their name are also more likely to get tenure. Student researchers with a patent have a better chance to gain (or retain) hukou, or local residence permit. But not only academics can benefit: the government of Guanxi announced that it allocated $3 million to subsidise the filing of patents in the province in 2015. These subsidies can come in many forms: reduce[d] application fees, cash rewards, expansion of legal support, etc. Corporate income tax may be reduced from 25% to 15% for companies with a high number of patent applications. Some companies offer rewards to employees who file patents.[121]
However, China made some surprising progress here, too, in the second half of the decade. Between 2016 and 2020, China’s cross-border IP receipts increased more than 400 percent in total and almost 300 percent as a share of GDP. While China finished the decade still far behind the U.S level of cross-border IP receipts, this increase was incredibly sudden. Counter to what many of those skeptical of China’s creative abilities believe, this may actually signal the start of a larger wave in the international importance of China’s IP. As Haour and von Zedtwitz also noted, there can be quite some time between the filing of a patent and its use by others, even if it is not an impractical invention. They cite Japan as an example, which did not start to reap the benefits of its patent output until the 2000s.[122] The two authors suggested, “A good measure of the evolution of China will be the speed with which it reduces [its] deficit in licensing fees.”[123] China’s IP payment deficit increased throughout the decade due to the rapid expansion of the international IP market as a whole, but its cross-border IP receipts went from 4.9 percent of its payments in 2015 to 25.1 percent in 2021.[124] The rise in the importance of Chinese IP may be a notable development in the ensuing decade.
Innovation Outcomes
Results were mixed when analyzing China’s value added and exports relative to the United States’ in the seven advanced industries considered. However, data for high-R&D industries as a group shows that China’s production and exports in these industries as a whole are increasing relative to the United States, as is its degree of specialization. China’s production in all industries considered expanded relative to the United States, though it only became relatively more specialized in pharmaceutical manufacturing and professional, scientific, and technical activities. While it became slightly less relatively specialized in computer programming, consulting, and information services, this was actually the industry in which China’s individual growth was the fastest, with an average annual value-added growth rate of 16 percent between 2010 and 2018, followed by professional, scientific, and technical activities at an annual rate of 14.5 percent. Thus, while not entirely evident in a direct comparison with the United States, China is becoming more specialized in high-value-added services—something it must continue to do to successfully develop and shift toward a more consumption-based economic framework.
China spent much of the past decade as a leader in high-performance computing and is sure to continue to do so. What is noteworthy of supercomputers is their massive utility in research, particularly where large volumes of data need to be processed and numerous calculations must be performed.[125] Therefore, not only will China’s supercomputer advancements aid the country in areas such as national security and commercial applications of AI, but they will also greatly increase the productivity of China’s researchers and result in much larger returns on R&D investments.
China’s cross-border IP receipts went from 4.9 percent of its payments in 2015 to 25.1 percent in 2021.
Again, while the United States has regained a slight lead in high-performance computing according to the Top500 list, China has allegedly ceased making its major breakthroughs public and may still hold the lead regarding the most powerful supercomputers in the world. It is unclear exactly why China should turn clandestine about this now, but it should be noted that supercomputers require highly advanced electronic equipment (specifically, extremely advanced semiconductors) for which China remains reliant on U.S. technology and production. Given that both countries have explicitly emphasized high-performance computing and AI as matters of not just economic but national security importance, it is not implausible that China would keep its major developments secret, lest it spook the United States and jeopardize its supply of the advanced technology and equipment needed for future breakthroughs. Access to critical technologies has in fact become a relevant point of emphasis following Russia’s invasion of Ukraine. At a Bureau of Industry and Security conference in June of this year, U.S. Commerce Secretary Gina Raimondo asked:
What if SMIC [China’s major semiconductor manufacturer] or other Chinese-based semiconductor companies are found supplying chips to Russia? We will shut them down and we can, because almost every chip in the world and in China is made using U.S. equipment and software and I intend to make good on that commitment if it’s necessary.[126]
In fact, at the end of August of this year, the U.S. government announced a restriction of sales of Nvidia’s A100 and H100 graphics processing units to China over fears that they could be used for military purposes.[127] These chips are used specifically for AI and high-performance-computing units.[128] Shortly thereafter, the Biden administration introduced much broader restrictions on exports of advanced computer chips and the equipment needed to manufacture them to hinder China’s technological development, particularly where military applications may exist.[129]
China’s Challenges Going Forward
While this report shows that China is making steady progress across a series of innovation indicators relative to the United States, it is still confronted with challenges it must overcome to continue its long-run economic growth. The first is its demographic problem. As stated previously, China is still a middle-income country and is already starting to face an imbalance between its elderly and the working-age population. In 2020, only 44 percent of mainland China’s population was younger than 40-years-old.[130] In the United States, the share was 52 percent.[131] While population growth was a government concern in the latter half of the last century, China’s population growth has essentially ground to a halt, coming in at only 0.1 percent between 2020 and 2021.[132] The world’s largest Confucian nation must therefore figure out a way to provide for an incredibly large elderly population with a shrinking labor pool.[133] This brings us to the second and primary issue.
China’s efficiency gains were nothing short of dismal during the last decade. Total factor productivity (TFP) growth is the growth in output that cannot be explained by labor or capital inputs (or the human capital of labor). In this sense, TFP growth is a “measure of our ignorance” about economic growth.[134] However, TFP is still a useful measurement of how efficiently an economy makes use of the resources it employs. Per the Penn World Table 10.0 (PWT 10.0), China’s TFP grew at an average annual rate of 2.7 percent between 2000 and 2009; between 2010 and 2019, this dropped to -0.6 percent, meaning China became less efficient at using the resources it employed during the previous decade.[135] It should be noted that PWT records economic growth rates much lower than those reported by the Chinese government. In a 2020 report by the World Bank titled “China’s Productivity Slowdown and Future Growth Potential,” the authors noted that PWT 9.1 (a precursor to the dataset used here) understated China’s annual GDP growth by an average of 2.1 percentage points for the years 1953–2017 relative to government statistics.[136] As a result, the levels of TFP and labor productivity growth reported are lower than what would be calculated using government statistics. However, any decreases in these growth rates would still be found. For example, the correlation coefficient between PWT 9.1’s and the 2020 World Bank report’s estimates for China’s TFP was 0.8, and the correlation coefficient for TFP growth was 0.7.[137] The World Bank report estimates that China’s average annual TFP growth rate was approximately 3 percent for 1999–2008 but dropped to only 0.7 percent for 2009–2018.[138]
This results in lower labor productivity (defined as output per hour of labor) and real GDP growth rates. However, China’s high rate of capital deepening (the capital stock employed per unit of labor)—thanks to what is still an incredibly high investment share of GDP—and a slight increase in the growth rate of its human capital have kept China’s labor productivity growth rates quite high. Figure 60 shows China’s labor productivity growth rates for the years 2001–2019 broken down by the contributions of its components, per PWT 10.0 data. As can be seen, China’s capital deepening is below its peak in 2009 but is still equal to its early-2000s level. China’s human capital growth was actually higher in the previous decade than in the 2000s. Lastly, China’s TFP growth stalled at the beginning of the last decade and turned negative for each year between 2015 and 2019. As a result, China’s labor productivity growth fell from its peak of 10.4 percent in 2007 to 3.7 percent in 2019—though, again, these levels are lower than what would be calculated using government statistics. In total, China’s TFP growth accounted for roughly one-third of its labor productivity growth between 2000 and 2009 and -14 percent of its labor productivity growth between 2010 and 2019 (meaning China’s labor productivity growth would have been 14 percent greater had its TFP been unchanged over that period).[139]
Figure 60: China’s labor productivity growth and its components[140]
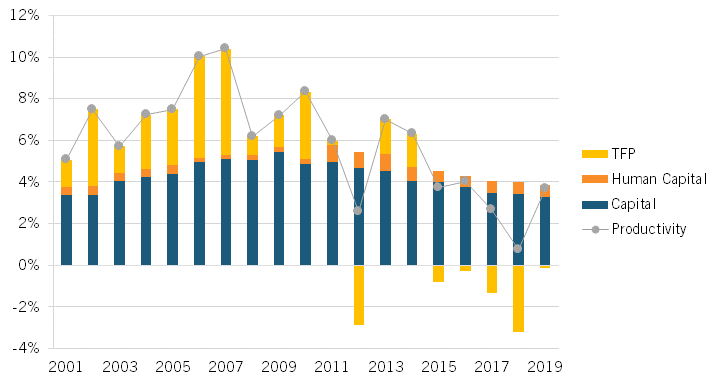
China’s falling efficiency has manifested itself in other measures as well. The 2020 World Bank report finds that China’s return on assets (ROA) fell between 2010 and 2018 for both private and foreign-owned firms (from over 11 percent to approximately 7 percent) as well as SOEs (from 4 percent to under 3 percent).[141] And from 2007 to 2018, China’s incremental capital-output ratio tripled from three to nine.[142] That is, three times as much investment was needed in 2018 to induce the same increase in output as in 2007.
This lower (and possibly negative) efficiency growth is especially worrying for China if it continues to rely on expanded investment for economic growth. Between 1978 (the beginning of China’s reform era) and 2010, investment as a share of China’s GDP increased from 29 to 44 percent.[143] Much of this increased investment was financed by debt. This is not necessarily a bad thing. For example, South Korea borrowed heavily and at high interest rates to make physical and human capital investments during its development. However, these investments resulted in sustained growth rates of labor productivity and TFP, which made the debt financing manageable.[144] China’s declines in TFP and ROA suggest that its investments are being more poorly allocated. GDP growth driven by inefficient debt-financed investments is simply unsustainable, and debt financing is becoming a bigger burden on the Chinese economy. From 2010 to 2020, China’s debt servicing payments as a share of gross national income more than doubled from 0.9 percent to 1.9 percent.[145] Granted, this is still low, especially compared with other middle-income countries—for example, the comparative 2020 figures for Thailand and Vietnam were 3.4 percent and 5 percent, respectively.[146] However, China’s debt statistics are notoriously opaque, and the rapid increase in debt servicing obligations, declining efficiency, and pressures to continue to deliver high growth rates make China’s investment and debt dynamics something to keep a close eye on.
Lastly, the increasing involvement of China’s government in markets and resource allocation is likely to deter future efficiency gains. All the Asian Tigers, once capable enough in their targeted advanced industries, ceded at least some control over to market forces and private actors. While China was moving in this direction (starting with Deng Xiaoping’s reforms), Xi Jinping has reinvigorated state control in everything from economics to culture. Greater state control of investment decisions threatens to handicap China’s ability to fix its investment misallocation problem. This is evidenced by the fact that China’s SOEs are less efficient than its private and foreign-owned enterprises. As mentioned, the 2020 World Bank report estimated that the ROA of China’s private and foreign-owned enterprises was approximately 7 percent in 2018 while that of its SOEs was approximately 3 percent.[147] Increased political and economic support for SOE production, especially in key industries, will further reduce the economy’s efficiency.
All this said, China may actually be well-positioned to overcome its productivity issues. Its investments in industrial robots will be critical to maintaining manufacturing output while its labor force not only shrinks but is reallocated to professional and consumer services as living standards rise and domestic consumption becomes a more integral part of its economy. Not only is China’s industrial robot density increasing, but it is doing so at an exponential rate. Furthermore, advances in supercomputing (particularly supercomputing-as-a-service) and AI will provide a boost to China’s efficiency not just in R&D laboratories but all the way down the value chain as supply chains are better organized, inventories are better managed, and customer preferences are better understood and met. China’s apparent success in retention of talent and the increasing share of its population attending universities means that while the labor pool may be decreasing, human capital is increasing. In fact, not only is human capital increasing, but as Figure 60 shows, it is doing so at a (slightly) faster rate than in the 2000s. Greater gains in human capital are likely to lead to higher TFP growth as more advanced technologies can be more widely adopted and as domestic production of new technologies increases.
Additionally, data from the previous decade suggests that China is becoming less reliant on high investment rates to achieve sustained economic growth. From 2010 to 2020, China’s investment as a share of GDP fell from 47 percent to 43 percent.[148] At the same time, China’s consumption as a share of GDP rose from 49 percent to 55 percent, and Chinese labor’s share of income increased from 55 percent to 59 percent between 2010 and 2019.[149] These numbers are still extreme global outliers. For comparison, investment and consumption accounted for 22 percent and 73 percent of GDP, respectively, in Germany in 2020.[150] However, Singapore and South Korea recorded peak investment shares of GDP of 47 percent and 41 percent, respectively, during their high-growth periods. There is therefore precedent for a successful rebalancing from overreliance on investment-led growth. However, while China’s GDP growth is still high—at least according to official government statistics—its rebalancing to date has come with slower growth rates. China therefore faces the problem of continuing the rebalance (especially with investments becoming less productive) without letting economic growth slow too much.
Conclusion
Many U.S. elites comfort themselves with the narrative that China, at least under the leadership of Xi Jinping, cannot truly innovate and that the U.S. therefore has little to worry about. But this view is premised on too-narrow a view of innovation, largely one referring to the development of science-based, new-to-the-world products. Not only is this definition too narrow for assessing advanced-industry strength, but it is also not clear that this still even rings true given China’s recent gains in areas such as space exploration, genomics, AI, and quantum computing.
Much of the discussion of China’s capabilities is on a proportional basis, which is surely important for determining how innovation-based an economy is. Indeed, if only total capabilities mattered, nations such as Taiwan, Israel, and Singapore could be ignored when it comes to innovation. But even here, China is performing well, not having yet caught up to the United States but being poised to do so within the next decade or so. This is especially true if the United States remains tethered to the status quo of laissez faire ideology on the right and anti-corporate populism on the left.
However, to the extent the two nations engage in geopolitical conflict—military or civilian—it is total, not proportional, innovation that is likely the determining factor. On this factor, it is clear: China significantly leads the United States. Of course, much of that is because China has 4.3 times the population of the United States. But it is also because China’s economy has gained in market share in advanced industries, while the United States has been losing it.
Furthermore, even in areas where China still lags behind the United States by a wide margin, such as with researchers as a share of the workforce and cross-border IP receipts as a share of total exports, progress was consistent and/or rapid. And in areas where China appears to have made little to no progress, such as doctorate degrees awarded per capita, some added context paints China’s position relative to the United States in a more positive light. China is not without its challenges: Its demographic problem and historic reliance on debt-financed investments coupled with its falling productivity growth are not to be written off. However, China is investing in and developing technologies such as industrial robots and high-performance computers that stand to help it face these issues.
Overall, the previous decade was a success for China with respect to innovation and technological catch-up with the United States. The key question for U.S. policymakers is not whether China will continue to make gains relative to the United States when it comes to innovation and advanced production (that depends in large part on U.S. actions) but whether policymakers will make this challenge the central organizing principle for U.S. economic and technology policy. Doing so requires the kinds of national organization and commitment America has been able to muster in the past, from Hamilton’s efforts to become technologically independent from England to Roosevelt’s “arsenal of democracy” to the multi-administration effort to defeat the Soviet Union. In each case, leaders agreed on the challenge and, albeit sometimes with difficulty, mobilized political will and societal and economic resources to respond and win. That is once again America’s challenge. In the next decade, America must decide whether it will meet this challenge or shrink from it.
Appendix
This section provides a list of the indicators used to construct the proportional and gross-output indices, their weights, and an explanation of how the indices are calculated. It also provides an explanation of the method used to “score” Chinese and U.S. universities in the top 500 in the Shanghai Academic Ranking of World Universities as well as information about the scores achieved by other countries in the indices used as indicators. For the index indicators, global heat maps based on 2020 scores are shown followed by a list of the ten highest-scoring countries in 2020 (with China and the United States also included in the case that they are not in the top 10) along with their ranks and scores for the earliest year considered (either 2010 or 2014).
Proportional and Gross-Output Indices
Proportional and gross-output indices were calculated by taking the weighted average of the indicators included for each indicator type to derive a weighted-average score for that type, where the included indicators and their weights are those listed in table 1 and table 2. The overall proportional and gross-output index scores are then the weighted average of the weighted-average scores of the three types. Innovation inputs and outputs received a weight of 0.25, and innovation outcomes receives a weight of 0.5. Note that in table 1 and table 2, the weights are rounded to the second decimal place, so the weights (as listed) may not sum to one.
For the indicators for which data in 2010 or 2020 is not available, values for these years were estimated by assuming they follow the linear trend defined by the five closest years for which data was available (e.g., 2014 values were estimated based on the 2015–2019 trend).
Table 1: Indicators and weights used for proportional index calculation
|
Innovation Inputs |
Innovation Outputs |
Innovation Outcomes |
|||
|
Indicator |
Weight |
Indicator |
Weight |
Indicator |
Weight |
|
R&D intensity |
0.38 |
Science and Engineering articles per capita |
0.25 |
Value added in advanced industries (combined) as a share of GDP |
0.34 |
|
VC as a share of GDP |
0.21 |
Share of Science and Engineering articles in top 1% of citations |
0.25 |
Exports in advanced industries (combined) as a share of GDP |
0.29 |
|
Researchers per 1,000 workers |
0.17 |
IPFs granted per capita |
0.25 |
Industrial robot density |
0.07 |
|
Undergraduate degrees awarded per capita in Science and Engineering fields (among the 20–29-year-old population) |
0.08 |
International IP receipts as a share of GDP |
0.25 |
Mobile cellular subscriptions per capita |
0.05 |
|
Doctoral degrees awarded per capita in Science and Engineering fields (among the 25–39-year-old population) |
0.17 |
Fixed broadband subscriptions per household |
0.05 |
||
|
Economic complexity score |
0.09 |
||||
|
UN E-government score |
0.07 |
||||
|
Global Cybersecurity Index score |
0.05 |
||||
Table 2: Indicators and weights used for gross-output index calculation
|
Innovation Inputs |
Innovation Outputs |
Innovation Outcomes |
|||
|
Indicator |
Weight |
Indicator |
Weight |
Indicator |
Weight |
|
R&D expenditures |
0.30 |
Science and Engineering articles |
0.50 |
Value added in advanced industries (combined) |
0.43 |
|
Cumulative investment of top R&D-investing firms |
0.10 |
IPFs granted |
0.25 |
Exports in advanced industries (combined) |
0.35 |
|
VC investment |
0.14 |
International IP receipts |
0.25 |
Cumulative performance of top supercomputer systems |
0.07 |
|
Researchers |
0.12 |
Mobile cellular subscriptions |
0.08 |
||
|
Undergraduate degrees awarded in Science and Engineering fields |
0.09 |
Fixed broadband subscriptions |
0.08 |
||
|
Doctoral degrees awarded in Science and Engineering fields |
0.14 |
||||
|
Cumulative weighted score of top-500 universities |
0.11 |
||||
University Weighted Scoring Method
Scores were assigned to each of the Chinese and U.S. universities in the top 500 of the Shanghai Academic Ranking of World Universities based on their positions in the list. These scores were then added together to give the cumulative weighted score of the universities. A description of the scoring system is provided in table 3. Because the list does not provide specific rankings outside the top 100, all universities that fall into a range are assumed to be in the middle of that range (e.g., a university in the 101–150 range is assumed to be ranked 125.5). The same equation as was used for the top 100 universities is then applied.
Table 3: University scoring methodology
|
Range |
Equation |
Score |
|
1–100 |
500 - Rank + 1 |
E.g., 500 - 15 + 1 = 486 |
|
101–150 |
500 - Average(101, 150) + 1 |
375.5 |
|
151–200 |
500 - Average(151, 200) + 1 |
325.5 |
|
201–300 |
500 - Average(201, 300) + 1 |
250.5 |
|
301–400 |
500 - Average(301, 400) + 1 |
150.5 |
|
401–500 |
500 - Average(401, 500) + 1 |
50.5 |
Economic Complexity Index
Figure 61: 2020 ECI scores[151]
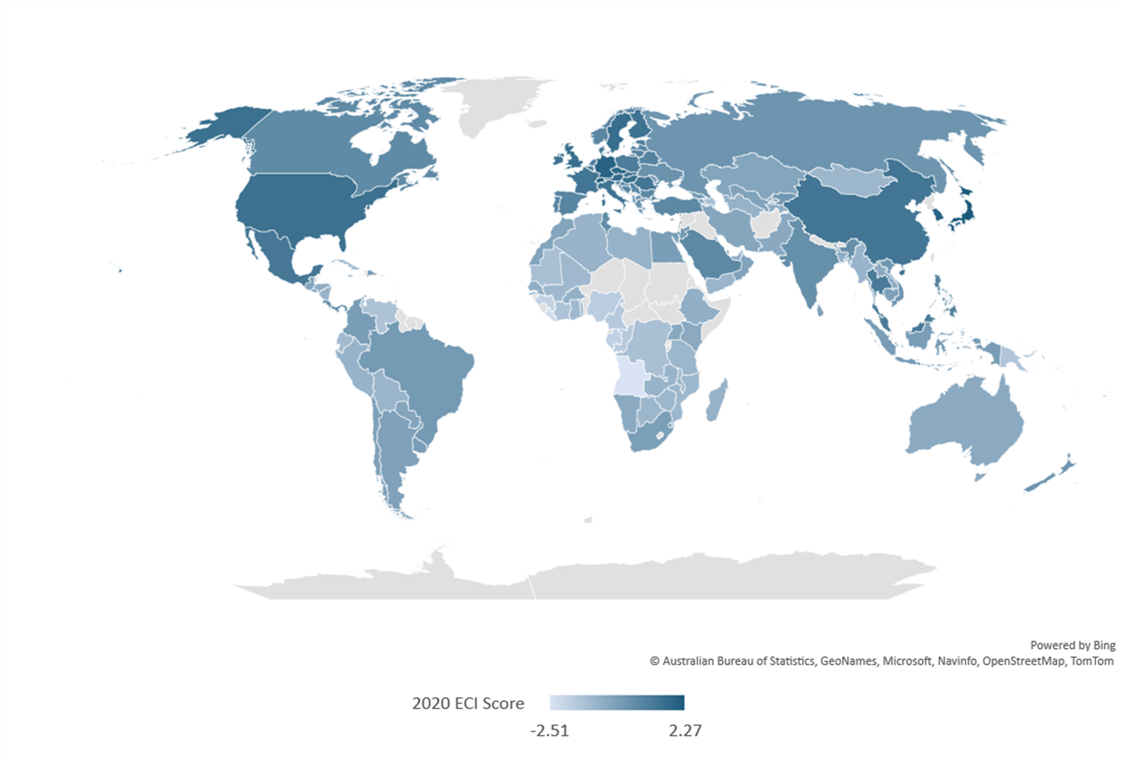
Table 4: 2020 ECI top 10 (including China and the United States)[152]
|
2020 Rank |
Country |
2020 Score |
2010 Rank |
2010 Score |
|
1 |
Japan |
2.27 |
1 |
2.44 |
|
2 |
Switzerland |
2.14 |
2 |
2.14 |
|
3 |
Germany |
1.96 |
3 |
2.12 |
|
4 |
South Korea |
1.95 |
8 |
1.75 |
|
5 |
Singapore |
1.87 |
4 |
2.01 |
|
6 |
Czechia |
1.78 |
7 |
1.77 |
|
7 |
Austria |
1.70 |
5 |
1.82 |
|
8 |
Sweden |
1.59 |
6 |
1.82 |
|
9 |
Hungary |
1.54 |
10 |
1.65 |
|
10 |
United Kingdom |
1.54 |
11 |
1.60 |
|
12 |
United States |
1.47 |
12 |
1.56 |
|
17 |
China |
1.30 |
24 |
1.05 |
Mobile Connectivity Index
Figure 62: 2020 MCI scores[153]
Table 5: 2020 MCI top 10 (including China)[154]
|
2020 Rank |
Country |
2020 Score |
2014 Rank |
2014 Score |
|
1 |
Australia |
91.26 |
1 |
83.05 |
|
2 |
Singapore |
90.65 |
5 |
78.28 |
|
3 |
Switzerland |
89.97 |
10 |
76.70 |
|
4 |
Finland |
89.15 |
3 |
79.58 |
|
5 |
Norway |
88.99 |
4 |
78.34 |
|
6 |
New Zealand |
88.86 |
2 |
80.40 |
|
7 |
Netherlands |
88.64 |
8 |
77.90 |
|
8 |
Austria |
87.83 |
13 |
75.86 |
|
9 |
United States |
87.60 |
15 |
74.80 |
|
10 |
Denmark |
87.58 |
9 |
77.36 |
|
37 |
China |
79.17 |
42 |
62.26 |
E-Government Development Index
Figure 63: 2020 EGDI scores[155]
Table 6: 2020 EGDI top 10 (including China)[156]
|
2020 Rank |
Country |
2020 Score |
2010 Rank |
2010 Score |
|
1 |
Denmark |
97.58 |
7 |
78.72 |
|
2 |
South Korea |
95.60 |
1 |
87.85 |
|
3 |
Estonia |
94.73 |
20 |
69.65 |
|
4 |
Finland |
94.52 |
19 |
69.67 |
|
5 |
Australia |
94.32 |
8 |
78.63 |
|
6 |
Sweden |
93.65 |
12 |
74.74 |
|
7 |
United Kingdom |
93.58 |
4 |
81.47 |
|
8 |
New Zealand |
93.39 |
14 |
73.11 |
|
9 |
United States |
92.97 |
2 |
85.10 |
|
10 |
Netherlands |
92.28 |
5 |
80.97 |
|
45 |
China |
79.48 |
72 |
47.00 |
Global Cybersecurity Index
Figure 64: 2020 GCI scores[157]

Table 7: 2020 GCI top 10 (including China)[158]
|
2020 Rank |
Country |
2020 Score |
2014 Rank |
2014 Score |
|
1 |
United States |
100.0 |
1 |
82.4 |
|
T-2 |
United Kingdom |
99.5 |
T-8 |
70.6 |
|
T-2 |
Saudi Arabia |
99.5 |
T-77 |
29.4 |
|
4 |
Estonia |
99.5 |
T-8 |
70.6 |
|
T-5 |
South Korea |
98.5 |
T-8 |
70.6 |
|
T-5 |
Singapore |
98.5 |
T-15 |
67.6 |
|
T-5 |
Spain |
98.5 |
T-28 |
58.8 |
|
T-8 |
Russia |
98.1 |
T-41 |
50.0 |
|
T-8 |
United Arab Emirates |
98.1 |
T-66 |
35.3 |
|
T-8 |
Malaysia |
98.1 |
T-3 |
76.5 |
|
T-40 |
China |
92.5 |
T-47 |
44.1 |
About the Authors
Ian Clay is an economic and technology policy research assistant for ITIF’s Global Innovaiton team. He holds a B.S. in mathematics and economics from the University of Iowa and an M.S. in economics from the University of St Andrews in the United Kingdom.
Robert D. Atkinson (@RobAtkinsonITIF) is the founder and president of ITIF. Atkinson’s books include Big Is Beautiful: Debunking the Myth of Small Business (MIT, 2018), Innovation Economics: The Race for Global Advantage (Yale, 2012), Supply-Side Follies: Why Conservative Economics Fails, Liberal Economics Falters, and Innovation Economics Is the Answer (Rowman Littlefield, 2007), and The Past and Future of America’s Economy: Long Waves of Innovation That Power Cycles of Growth (Edward Elgar, 2005). Atkinson holds a Ph.D. in city and regional planning from the University of North Carolina, Chapel Hill.
About ITIF
The Information Technology and Innovation Foundation (ITIF) is an independent, nonprofit, nonpartisan research and educational institute focusing on the intersection of technological innovation and public policy. Recognized by its peers in the think tank community as the global center of excellence for science and technology policy, ITIF’s mission is to formulate and promote policy solutions that accelerate innovation and boost productivity to spur growth, opportunity, and progress. For more information, visit us at itif.org.
Endnotes
[1]. Robert D. Atkinson and Caleb Foote, “Is China Catching Up to the United States in Innovation?” (ITIF, April 2019), https://itif.org/publications/2019/04/08/china-catching-united-states-innovation/.
[2]. Robert D. Atkinson and Luke A. Stewart, “Just the Facts: The Economic Benefits of Information and Communication Technologies” (ITIF, May 2013), https://www2.itif.org/2013-tech-economy-memo.pdf.
[3]. “Did the Computer Chip Shortage Affect Inflation?” Federal Reserve Bank of St. Louis, May 10, 2022, https://www.stlouisfed.org/on-the-economy/2022/may/did-computer-chip-shortage-affect-inflation.
[4]. James McGregor, “China’s Drive for ‘Indigenous Innovation’: A Web of Industrial Policies” (United States Chamber of Commerce, 2010), https://www.uschamber.com/assets/archived/images/documents/files/100728chinareport_0_0.pdf.
[5]. Cong Cao, Richard P. Suttmeier, and Denis Fred Simon, “China’s 15-Year Science and Technology Plan,” Physics Today, no. 59 (December 2006), 38-43. DOI: 10.1063/1.2435680; The State Council of the People’s Republic of China (SCPRC), “The National Medium- and Long-Term Program for Science and Technology Development (2006-2020): An Outline” (Beijing: SCPRC, 2006), https://www.itu.int/en/ITU-D/Cybersecurity/Documents/National_Strategies_Repository/China_2006.pdf.
[6]. McGregor, “China’s Drive for ‘Indigenous Innovation.’”
[7]. SCPRC, “The National Medium- and Long-Term Program for Science and Technology Development.”
[8]. Ibid.
[9]. McGregor, “China’s Drive for Indigenous Innovation.”
[10]. World Trade Organization (WTO), Report on the Working Party on the Accession of China (Geneva:
WTO, October 2001), https://docs.wto.org/dol2fe/Pages/SS/directdoc.aspx?filename=q:/WT/ACC/CHN49.pdf&Open=True.
[11]. Cao et al., “China’s 15-Year Science and Technology Plan.”
[12]. Hepeng Jia, “What is China’s Thousand Talents Program?” Nature, January 17, 2018, https://media.nature.com/original/magazine-assets/d41586-018-00538-z/d41586-018-00538-z.pdf.
[13]. Ibid.
[14]. Scott Kennedy, “Made in China 2025,” Center for Strategic & International Studies, June 1, 2015, https://www.csis.org/analysis/made-china-2025.
[15]. Ibid.
[16]. Jost Wübbeke et al., Made in China 2025: The Making of a High-Tech Superpower and Consequences for Industrial Countries (Mercator Institute for China Studies, December 2016), https://merics.org/en/report/made-china-2025.
[17]. Ibid.
[18]. Ibid.; “Made in China 2025,” Institute for Security & Development Policy, June 2018, https://isdp.eu/publication/made-china-2025/.
[19]. Stephen Ezell, Frank Spring, and Katarzyna Bitka, “The Global Flourishing of National Innovation Foundations” (ITIF, April 2015), https://itif.org/publications/2015/04/13/global-flourishing-national-innovation-foundations.
[20]. United States Trade Representative (USTR), “2020 Report to Congress on China’s WTO Compliance” (Washington DC, January 2021), https://ustr.gov/sites/default/files/files/reports/2020/2020USTRReportCongressChinaWTOCompliance.pdf.
[21]. Kerry Brown, “Why China Can’t Innovate,” The Diplomat, August 19, 2014, https://thediplomat.com/2014/08/why-china-cant-innovate.
[22]. Cited in Charlie Ang Hwa Leong, “Can China Innovate?” Al Jazeera, June 17, 2018, https://www.aljazeera.com/indepth/opinion/china-innovate-180610125508616.html.
[23]. Cited in Regina M. Abrami, William C. Kirby, and F. Warren McFarlan, “Why China Can’t Innovate,” Harvard Business Review, March 2014, https://hbr.org/2014/03/why-china-cant-innovate.
[24]. “U.S. Should Chill Out About High-Tech China Threat, Pettis Says,” Bloomberg News, June 6, 2018, https://www.bloomberg.com/news/articles/2018-06-06/america-should-chill-out-about-the-high-tech-china-threat.
[25]. Scott Kennedy, “The Fat Tech Dragon: Benchmarking China’s Innovation Drive” (CSIS, August 2017), https://www.csis.org/analysis/fat-tech-dragon.
[26]. National Science Foundation, Higher Education in Science and Engineering: February 2022 (Supplemental Table 11; accessed August 9, 2022), https://ncses.nsf.gov/pubs/nsb20223/data#table-block.
[27]. Richard Cuthbertson, Stephen J. Ezell, and Peder Inge Furseth, “Apple and Nokia: The Transformation from Products to Services,” in Innovating in a Service-Driven Economy (London: Palgrave Macmillan, 2015), 111–129.
[28]. Wesley Hilliard, “iPhone Dominates Premium Smartphone Market with 62% of Sales in Q1 2022,” AppleIndsider, June 23, 2022, https://appleinsider.com/articles/22/06/23/iphone-dominates-premium-smartphone-market-with-62-of-sales-in-q1-2022.
[29]. Jonathan Woetzel et al., The China Effect on Global Innovation (McKinsey Global Institute, October 2015), https://www.mckinsey.com/~/media/mckinsey/featured%20insights/innovation/gauging%20the%20strength%20of%20chinese%20innovation/mgi%20china%20effect_full%20report_october_2015.ashx.
[30]. Embassy of the People’s Republic of China in the United States of America, “Official Data Confirm China as World’s Biggest Auto Producer, Consumer, Challenges Remain,” news release January 11, 2010, https://www.mfa.gov.cn/ce/ceus/eng/xw/t650869.htm; Takashi Kawakami, Yohei Muramatsu, and Saki Shirai, “China Led World With 500,000 Electric Car Exports in 2021,” Nikkei Asia, March 8, 2022, https://asia.nikkei.com/Spotlight/Electric-cars-in-China/China-led-world-with-500-000-electric-car-exports-in-2021.
[31]. Morgan McFall-Johnsen, “NASA is Pushing its Human Moon Landing Back to 2025, and its Top Official Worries China Will Beat the US There,” Business Insider, November 9, 2021, https://www.businessinsider.com/nasa-pushes-astronaut-moon-landing-to-2025-racing-china-2021-11.
[32]. Zak Dychtwald, “China’s New Innovation Advantage,” Harvard Business Review, May–June 2021, https://hbr.org/2021/05/chinas-new-innovation-advantage.
[33]. TOP500, “TOP500,” June 2022 list, accessed August 8, 2022, https://top500.org/lists/top500/2022/06/; Nicole Hemseth, “Why Did China Keep its Exascale Supercomputers Quiet?” The Next Platform, November 15, 2021, https://www.nextplatform.com/2021/11/15/why-did-china-keep-its-exascale-supercomputers-quiet/.
[34]. Ben Jones, “Past, Present and Future: The Evolution of China’s Incredible High-Speed Rail Network,” CNN Travel, February 9, 2022, https://www.cnn.com/travel/article/china-high-speed-rail-cmd/index.html.
[35]. Ibid.
[36]. The Global Innovation Index 2016: Winning with Global Innovation (Ithaca, Fontainebleau, and Geneva: Cornell University, INSEAD, and WIPO, 2016), https://www.wipo.int/edocs/pubdocs/en/wipo_pub_gii_2016.pdf.
[37]. The Global Innovation Index 2022: What is the Future of Innovation-driven Growth? (Ithaca, Fontainebleau, and Geneva: Cornell University, INSEAD, and WIPO, 2022), https://www.wipo.int/edocs/pubdocs/en/wipo-pub-2000-2022-en-main-report-global-innovation-index-2022-15th-edition.pdf.
[38]. Ibid.
[39]. Bureau of Economic Analysis, Real gross domestic product per capita (chained 2012 dollars, seasonally adjusted annual rate; accessed August 9, 2022, through FRED, Federal Reserve Bank of St. Louis), https://fred.stlouisfed.org/series/A939RX0Q048SBEA; World Bank, GDP per capita (constant 2015 US$; accessed August 9, 2022), https://data.worldbank.org/indicator/NY.GDP.PCAP.KD; Authors’ calculations.
[40]. Organization for Economic Cooperation and Development (OECD), Gross domestic expenditure on R&D by sector of performance and type of R&D (PPP Dollars – Current prices; accessed May 27, 2022), https://stats.oecd.org/index.aspx?queryid=60702; OECD, Purchasing power parities (accessed September 26, 2022), https://data.oecd.org/conversion/purchasing-power-parities-ppp.htm#indicator-chart; OECD, Exchange rates (accessed September 26, 2022), https://data.oecd.org/conversion/exchange-rates.htm#indicator-chart; Authors’ calculations.
[41]. SCPRC, “The National Medium- and Long-Term Program for Science and Technology Development.”
[42]. OECD, Gross domestic expenditure on R&D by sector of performance and type of R&D (PPP Dollars – Current prices); OECD, Gross domestic product (current dollars, current PPP; accessed May 27, 2022), https://stats.oecd.org/index.aspx?queryid=60702#.
[43]. OECD Gross domestic expenditure on R&D by sector of performance and type of R&D (PPP Dollars – Current prices); OECD, Gross domestic product (current dollars, current PPP)
[44]. OECD, Gross domestic expenditure of R&D by sector of performance and source of funds (PPP Dollars – Current prices; accessed May 27, 2022), https://stats.oecd.org; OECD, Purchasing power parities; OECD, Exchange rates; Authors’ calculations.
[45]. OECD, Gross domestic expenditure on R&D by sector of performance and source of funds (PPP Dollars – Current prices); OECD, Gross domestic product (current dollars, current PPP).
[46]. OECD, Gross domestic expenditure on R&D by sector of performance and type of R&D (PPP Dollars – Current prices).
[47]. Ibid.
[48]. Ibid.
[49]. European Commission, The 2011 EU Industrial R&D Investment Scoreboard (accessed August 9, 2022), https://iri.jrc.ec.europa.eu/scoreboard/2011-eu-industrial-rd-investment-scoreboard#field_report; European Commission, The 2016 EU Industrial R&D Investment Scoreboard (accessed August 9, 2022), https://iri.jrc.ec.europa.eu/scoreboard/2016-eu-industrial-rd-investment-scoreboard; European Commission, The 2021 EU Industrial R&D Investment Scoreboard (accessed August 9, 2022), https://iri.jrc.ec.europa.eu/scoreboard/2021-eu-industrial-rd-investment-scoreboard.
[50]. SCPRC, “The National Medium- and Long-Term Program for Science and Technology Development.”
[51]. National Science Foundation, Invention, Knowledge Transfer, and Innovation: March 2022 (Supplemental Table 98; accessed August 10, 2022), https://ncses.nsf.gov/pubs/nsb20224/data.
[52]. Ibid.
[53]. Ibid.; OECD, GDP (current $US; accessed September 26, 2022), https://data.worldbank.org/indicator/NY.GDP.MKTP.CD.
[54]. OECD, Researchers (Total, per 1,000 employed, 2000–2019; accessed August 9, 2022), https://data.oecd.org/rd/researchers.htm; National Bureau of Statistics of China, China Statistical Yearbook 2021 (Table 4-2; accessed September 27, 2022), http://www.stats.gov.cn/tjsj/ndsj/2021/indexeh.htm; Bureau of Labor Statistics, All employees (thousands, total nonfarm, not seasonally adjusted; accessed September 27, 2022), http://www.stats.gov.cn/tjsj/ndsj/2020/indexeh.htm; Authors’ calculations.
[55]. OECD, R&D personnel by sector and function (full-time equivalent; accessed October 26, 2022).
[56]. OECD, Researchers (Total, per 1,000 employed, 2000–2020).
[57]. “80% of Chinese Students Return in China After Graduating Abroad,” Erudera News, December 23, 2020, https://erudera.com/news/80-of-chinese-students-return-in-china-after-graduating-abroad/.
[58]. National Science Foundation, Higher Education in Science and Engineering: February 2022 (Supplemental Table 11; accessed August 9, 2022), https://ncses.nsf.gov/pubs/nsb20223/data.
[59]. Ibid.
[60]. National Bureau of Statistic of China, China Statistical Yearbook (2012 through 2019, Population by Age and Sex; accessed August 23, 2022), http://www.stats.gov.cn/english/Statisticaldata/AnnualData/; Government of Hong Kong Census and Statistics Department, Population Estimates (Table A1, Population by Sex and Age Group; accessed August 23, 2022), https://www.censtatd.gov.hk/en/web_table.html?id=1A#; Government of Macao Statistics and Census Service, Population and Households (Demographic Statistics 2010 through 2017; accessed August 23, 2022), https://www.dsec.gov.mo/en-US/Statistic?id=101; United States Census Bureau, Population (Age and Sex Table A1, 2010 through 2018; accessed August 23, 2022); https://www.census.gov/topics/population/age-and-sex/data/tables.html; World Bank, Population (total; accessed August 9, 2022), https://data.worldbank.org/indicator/SP.POP.TOTL; Authors’ calculations.
[61]. National Bureau of Statistic of China, China Statistical Yearbook (2012 through 2019, Population by Age and Sex); Government of Hong Kong Census and Statistics Department, Population Estimates (Table A1, Population by Sex and Age Group); Government of Macao Statistics and Census Service, Population and Households (Demographic Statistics 2010 through 2017); World Bank, Population (total); Authors’ calculations.
[62]. United States Census Bureau, Population (Age and Sex Table A1, 2010 through 2018).
[63]. National Science Foundation, Higher Education in Science and Engineering: February 2022 (Supplemental Table 11; accessed August 9, 2022), https://ncses.nsf.gov/pubs/nsb20223/data; National Bureau of Statistic of China, China Statistical Yearbook (2012 through 2019, Population by Age and Sex); Government of Hong Kong Census and Statistics Department, Population Estimates (Table A1, Population by Sex and Age Group); Government of Macao Statistics and Census Service, Population and Households (Demographic Statistics 2010 through 2017); United States Census Bureau, Population (Age and Sex Table A1, 2010 through 2018); World Bank, Population (total); Authors’ calculations.
[64]. Ibid.
[65]. Jack Corrigan, James Dunham, and Remco Zwetsloot, “The Long-Term Stay Rates of International STEM PhD Graduates” (Center for Security and Emerging Technology, April 2022), https://cset.georgetown.edu/wp-content/uploads/CSET-The-Long-Term-Stay-Rates-of-International-STEM-PhD-Graduates.pdf.
[66]. National Science Foundation, Higher Education in Science and Engineering: February 2022 (Supplemental Table 12; accessed August 9, 2022), https://ncses.nsf.gov/pubs/nsb20223/data.
[67]. Ibid.
[68]. National Center for Science and Engineering Statistics, Doctorate Recipients from U.S. Universities: 2020 (Table 27; accessed August 24, 2022), https://ncses.nsf.gov/pubs/nsf22300/data-tables#group1.
[69]. Ibid.
[70]. National Science Foundation, Higher Education in Science and Engineering: February 2022 (Supplemental Table 12); National Bureau of Statistic of China, China Statistical Yearbook (2012 through 2019, Population by Age and Sex); Government of Hong Kong Census and Statistics Department, Population Estimates (Table A1, Population by Sex and Age Group); Government of Macao Statistics and Census Service, Population and Households (Demographic Statistics 2010 through 2017); United States Census Bureau, Population (Age and Sex Table A1, 2010 through 2018); World Bank, Population (total); Authors’ calculations.
[71]. Ibid.
[72]. Shanghai Ranking, Academic Ranking of World Universities (2010, 2015, and 2020 rankings; accessed May 30, 2022), https://www.shanghairanking.com/rankings/arwu/2020; Authors’ calculations.
[73]. National Science Foundation, Higher Education in Science and Engineering: February 2022 (Supplemental Table 11).
[74]. National Science Foundation, Publications Output: U.S. Trends and International Comparisons: October 2021 (Supplemental Table 2; accessed August 9, 2022), https://ncses.nsf.gov/pubs/nsb20214/data.
[75]. National Science Foundation, Publications Output: U.S. Trends and International Comparisons: October 2021 (Supplemental Tables 7, 8, and 12; accessed August 9, 2022), https://ncses.nsf.gov/pubs/nsb20214/data.
[76]. National Science Foundation, Publications Output: U.S. Trends and International Comparisons: October 2021 (Supplemental Tables 5, 6, 9, and 14; accessed August 9, 2022), https://ncses.nsf.gov/pubs/nsb20214/data.
[77]. National Science Foundation, Publications Output: U.S. Trends and International Comparisons: October 2021 (Supplemental Table 2); World Bank, Population (total).
[78]. National Science Foundation, Publications Output: U.S. Trends and International Comparisons, October 2021 (Supplemental Tables 7, 8, and 12); World Bank, Population (total).
[79]. National Science Foundation, Publications Output: U.S. Trends and International Comparisons, October 2021 (Supplemental Tables 5, 6, 9, and 14); World Bank, Population (total).
[80]. National Science Foundation, Publications Output: U.S. Trends and International Comparisons: October 2021 (Supplemental Table 58; accessed August 9, 2022), https://ncses.nsf.gov/pubs/nsb20214/data.
[81]. National Science Foundation, Publications Output: U.S. Trends and International Comparisons: October 2021 (Supplemental Tables 63, 64, and 68; accessed August 9, 2022), https://ncses.nsf.gov/pubs/nsb20214/data.
[82]. National Science Foundation, Publications Output: U.S. Trends and International Comparisons: October 2021 (Supplemental Tables 61, 62, 65, and 70; accessed August 9, 2022), https://ncses.nsf.gov/pubs/nsb20214/data.
[83]. Arthur R. Kroeber, China’s Economy: What Everyone Needs to Know (New York City: Oxford University Press, 2020), 76.
[84]. National Science Foundation, Invention, Knowledge Transfer, and Innovation: March 2022 (Supplemental Table 5; accessed August 9, 2022), https://ncses.nsf.gov/pubs/nsb20224/data.
[85]. National Science Foundation, Invention, Knowledge Transfer, and Innovation: March 2022 (Supplemental Tables 8, 9, 11, and 13; accessed August 9, 2022), https://ncses.nsf.gov/pubs/nsb20224/data.
[86]. National Science Foundation, Invention, Knowledge Transfer, and Innovation: March 2022 (Supplemental Tables 18, 20, and 21; accessed August 9, 2022), https://ncses.nsf.gov/pubs/nsb20224/data.
[87]. National Science Foundation, Invention, Knowledge Transfer, and Innovation: March 2022 (Supplemental Table 29; accessed August 9, 2022), https://ncses.nsf.gov/pubs/nsb20224/data.
[88]. National Science Foundation, Invention, Knowledge Transfer, and Innovation: March 2022 (Supplemental Table 5); World Bank, Population (total).
[89]. National Science Foundation, Invention, Knowledge Transfer, and Innovation: March 2022 (Supplemental Tables 8, 9, 11, and 13); World Bank, Population (total).
[90]. National Science Foundation, Invention, Knowledge Transfer, and Innovation: March 2022 (Supplemental Tables 18, 20, and 21); World Bank, Population (total).
[91]. National Science Foundation, Invention, Knowledge Transfer, and Innovation: March 2022 (Supplemental Table 29); World Bank, Population (total).
[92]. World Bank, Charges for the use of intellectual property, receipts (BoP, current US$; accessed August 7, 2022), https://data.worldbank.org/indicator/BX.GSR.ROYL.CD?locations=CN-US&view=chart
[93]. Ibid.; World Bank, GDP (Current US$; accessed August 24, 2022), https://data.worldbank.org/indicator/NY.GDP.MKTP.CD.
[94]. National Science Foundation, Production and Trade of Knowledge- and Technology-Intensive Industries: January 2020 (Supplemental Table 3; accessed August 9, 2022), https://ncses.nsf.gov/pubs/nsb20205/data; National Science Foundation, Production and Trade of Knowledge- and Technology-Intensive Industries: January 2020 (Supplemental Table 19; accessed August 9, 2022), https://ncses.nsf.gov/pubs/nsb20205/data.
[95]. National Science Foundation, Production and Trade of Knowledge- and Technology-Intensive Industries: January 2020 (Supplemental Table 3; accessed August 9, 2022), https://ncses.nsf.gov/pubs/nsb20205/data; World Bank, GDP (Current US$); National Science Foundation, Production and Trade of Knowledge- and Technology-Intensive Industries: January 2020 (Supplemental Table 19; accessed August 9, 2022), https://ncses.nsf.gov/pubs/nsb20205/data; OECD, Trade in Value Added (Gross exports; accessed August 7, 2022), https://stats.oecd.org/.
[96]. OECD, Trade in Value Added (Value added; accessed August 7, 2022), https://stats.oecd.org/.
[97]. Ibid.; World Bank, GDP (Current US$).
[98]. OECD, Trade in Value Added (Gross exports).
[99]. Ibid.
[100]. Harvard Growth Lab, Atlas of Economic Complexity (Economic Complexity Index; accessed August 7, 2022), https://atlas.cid.harvard.edu/rankings.
[101]. Dario Gil, “IBM Helps Bring Supercomputers into the Global Fight Against COVID-19,” IBM Newsroom, https://newsroom.ibm.com/IBM-helps-bring-supercomputers-into-the-global-fight-against-COVID-19.
[102]. “Applications,” National Artificial Intelligence Initiative Office, https://www.ai.gov/strategic-pillars/applications/.
[103]. “APP Metrics for Intel Microprocessors,” Intel Corporation, July 27, 2022, https://www.intel.com/content/dam/support/us/en/documents/processors/APP-for-Intel-Core-Processors.pdf.
[104].TOP500 June 2022 (accessed August 9, 2022), https://top500.org/lists/top500/2022/06/.
[105]. Nicole Hemsoth, “China Has Already Reached Exascale – On Two Separate Systems,” The Next Platform, October 26, 2021, https://www.nextplatform.com/2021/10/26/china-has-already-reached-exascale-on-two-separate-systems/.
[106]. TOP500, List Statistics (Countries/Regions, November lists 2010 through 2020; accessed August 9, 2022), https://top500.org/statistics/list/.
[107]. World Robotics Report (2010, 2015, and 2020 editions).
[108]. World Bank, Mobile cellular subscriptions (accessed September 27, 2022), https://data.worldbank.org/indicator/IT.CEL.SETS; World Bank, Fixed broadband subscriptions (accessed August 9, 2022), https://data.worldbank.org/indicator/IT.NET.BBND.
[109]. “How Web-Connected is China?” (CSIS), https://chinapower.csis.org/web-connectedness/.
[110]. World Bank, Mobile cellular subscriptions; World Bank, Fixed broadband subscriptions; United States Census Bureau, Historical Household Tables (Table HH-1; accessed August 9, 2022), https://www.census.gov/data/tables/time-series/demo/families/households.html; CEIC, China Population: Number of Households (Total; accessed August 9, 2022); Government of Hong Kong Census and Statistics Department, Table 5: Statistics on Domestic Households (accessed September 27, 2022), https://www.censtatd.gov.hk/en/web_table.html?id=5#; Government of Macau Statistics and Census Service, Population and Households (accessed September 27, 2022), https://www.dsec.gov.mo/en-US/Statistic?id=1.
[111]. GSMA, Mobile Connectivity Index (2014 through 2020; accessed August 8, 2022), https://www.mobileconnectivityindex.com/#year=2021&dataSet=indexScore.
[112]. United Nations (UN), E-Government Survey 2010 (New York City: UN Department of Economic and Social Affairs, 2010), https://publicadministration.un.org/egovkb/en-us/reports/un-e-government-survey-2010; UN, E-Government Survey 2012 (New York City: UN Department of Economic and Social Affairs, 2012), https://publicadministration.un.org/egovkb/en-us/reports/un-e-government-survey-2012; UN, E-Government Survey 2014 (New York City: UN Department of Economic and Social Affairs, 2014), https://publicadministration.un.org/egovkb/en-us/reports/un-e-government-survey-2014; UN, E-Government Survey 2016 Development (New York City: UN Department of Economic and Social Affairs, 2016), https://publicadministration.un.org/egovkb/en-us/reports/un-e-government-survey-2016; UN, E-Government Survey 2018 (New York City: UN Department of Economic and Social Affairs, 2018), https://publicadministration.un.org/egovkb/en-us/Reports/UN-E-Government-Survey-2018; UN, E-Government Survey 2020 (New York City: UN Department of Economic and Social Affairs, 2020), https://publicadministration.un.org/egovkb/en-us/Reports/UN-E-Government-Survey-2020.
[113]. “Cybersecurity Trends: Looking Over the Horizon,” McKinsey & Company, May 10, 2022, https://www.mckinsey.com/business-functions/risk-and-resilience/our-insights/cybersecurity/cybersecurity-trends-looking-over-the-horizon.
[114]. United Nations, Global Cybersecurity Index 2020 (Geneva: UN International Telecommunication Union, 2022), https://www.itu.int/epublications/publication/D-STR-GCI.01-2021-HTM-E.
[115]. Cyber Capabilities and National Power: A Net Assessment, (International Institute for Strategic Studies, June 2021), https://www.iiss.org/blogs/research-paper/2021/06/cyber-capabilities-national-power.
[116]. United Nations (UN), Global Cybersecurity Index and Cyberwellness Profiles (Geneva: UN International Telecommunication Union, 2015), https://www.itu.int/en/ITU-D/Cybersecurity/Pages/GCI-2014.aspx; UN, Global Cybersecurity Index 2020.
[117]. World Bank, GDP per capita (current $US, 2020; accessed August 12, 2022), https://data.worldbank.org/indicator/NY.GDP.PCAP.CD.
[118]. World Bank, Rural population (% of total population; accessed August 12, 2022), https://data.worldbank.org/indicator/SP.RUR.TOTL.ZS?locations=CN-US-DE.
[119]. United States Census Bureau, “1950 Census of Population: Preliminary Counts” (Washington DC: U.S. Census Bureau, 1951), https://www2.census.gov/library/publications/decennial/1950/pc-03/pc-3-10.pdf.
[120]. Li Tang, Philip Shapira, and Jan Youtie, “Is There a Clubbing Effect Underlying Chinese Research Citation Increases?” Journal of the Association for Information Science and Technology, no. 66 (March 2015), 1923–1932, https://doi.org/10.1002/asi.23302.
[121]. Georges Hamour and Max von Zedtwitz, Created in China 2025 (London: Bloomsbury Publishing, 2016), 30.
[122]. Ibid, 28.
[123]. Ibid.
[124]. World Bank, Charges for the use of intellectual property (receipts); World Bank, Chars for the use of intellectual property (payments, BoP, current $US; accessed August 12, 2022), https://data.worldbank.org/indicator/BM.GSR.ROYL.CD.
[125]. Stephen Ezell and Robert D. Atkinson, “The Vital Importance of High-Performance Computing to U.S. Competitiveness” (ITIF, April 2016), https://itif.org/publications/2016/04/28/vital-importance-high-performance-computing-us-competitiveness/.
[126]. “Chip Exports to Russia Plunged by 90% After Curbs-U.S. Official,” Reuters, June 29, 2022, https://www.reuters.com/technology/chip-exports-russia-plunged-by-90-after-curbs-us-official-2022-06-29/.
[127]. Ian King, “Nvidia Declines on Warning That China Restriction May Hurt Sales,” Bloomberg, August 31, 2022, https://www.bloomberg.com/news/articles/2022-08-31/nvidia-declines-on-warning-that-china-restriction-may-hurt-sales.
[128]. “NVIDIA A100 Tensor Core GPU,” NVIDIA Cloud and Data Center, https://www.nvidia.com/en-us/data-center/a100/; “NVIDIA H100 Tensor Core GPU,” NVIDIA Cloud and Data Center, https://www.nvidia.com/en-us/data-center/h100/.
[129]. Stephen Nellis, Karen Freifeld, and Alexandra Alper, “U.S. Aims to Hobble China’s Chip Industry With Sweeping New Export Rules,” Reuters, October 10, 2022, https://www.reuters.com/technology/us-aims-hobble-chinas-chip-industry-with-sweeping-new-export-rules-2022-10-07/.
[130]. National Bureau of Statistics of China, China Statistical Yearbook 2021 (Table 2-17; accessed August 12, 2022), http://www.stats.gov.cn/tjsj/ndsj/2021/indexeh.htm.
[131]. United States Census Bureau, National Demographic Analysis Tables: 2020 (2020 Demographic Analysis Estimates by Age and Sex, Table 1; accessed August 12, 2022), https://www.census.gov/data/tables/2020/demo/popest/2020-demographic-analysis-tables.html.
[132]. World Bank, Population growth (annual %; accessed August 12, 2022), https://data.worldbank.org/indicator/SP.POP.GROW.
[133]. World Bank, Labor force (total; accessed August 12, 2022), https://data.worldbank.org/indicator/SL.TLF.TOTL.IN.
[134]. Moses Abramovitz, “Resource and Output Trends in the United States Since 1870,” National Bureau of Economic Research, January 1956, https://www.nber.org/books-and-chapters/resource-and-output-trends-united-states-1870/resource-and-output-trends-united-states-1870.
[135]. University of Groningen Growth and Development Center, Penn World Table 10.0 (TFP at constant national prices; accessed August 28, 2022), https://www.rug.nl/ggdc/productivity/pwt/?lang=en.
[136]. Loren Brandt et al., “China’s Productivity Slowdown and Future Growth Potential,” World Bank, Policy Research Working Paper no. 9298, January 2020, https://openknowledge.worldbank.org/bitstream/handle/10986/33993/Chinas-Productivity-Slowdown-and-Future-Growth-Potential.pdf.
[137]. Ibid.
[138]. Ibid.
[139]. University of Groningen Growth and Development Center, Penn World Table 10.0; Authors’ calculations.
[140]. University of Groningen Growth and Development Center, Penn World Table 10.0.
[141]. Brandt et al., “China’s Productivity Slowdown and Future Growth Potential.”
[142]. Indermit Gill, “Joyless Growth in China, India, and the United States,” The Brookings Institution, January 22, 2019, https://www.brookings.edu/blog/future-development/2019/01/22/joyless-growth-in-china-india-and-the-united-states/.
[143]. World Bank, Gross Fixed Capital Formation (% of GDP; accessed August 26, 2022), https://data.worldbank.org/indicator/NE.GDI.FTOT.ZS?locations=CN.
[144]. University of Groningen Growth and Development Center, Penn World Table 10.0.
[145]. World Bank, Total Debt Service (% of GNI; accessed August 26, 2022), https://data.worldbank.org/indicator/DT.TDS.DECT.GN.ZS?locations=CN.
[146]. Ibid.
[147]. Brandt et al., “China’s Productivity Slowdown and Future Growth Potential.”
[148]. World Bank, Gross Fixed Capital Formation (% of GDP).
[149]. World Bank, Final Consumption Expenditures (% of GDP; accessed August 26, 2022), https://data.worldbank.org/indicator/NE.CON.TOTL.ZS?locations=CN; University of Groningen and University of California, Davis, Share of Labor Compensation in GDP at Current National Prices for China (accessed August 26, 2022, through FRED, Federal Reserve Bank of St. Louis), https://fred.stlouisfed.org/series/LABSHPCNA156NRUG.
[150]. World Bank, Financial Consumption Expenditures (% of GDP); World Bank, Gross Fixed Capital Formation (% of GDP).
[151]. Harvard Growth Lab, Atlas of Economic Complexity (Economic Complexity Index).
[152]. Ibid.
[153]. GSMA, Mobile Connectivity Index.
[154]. Ibid.
[155]. United Nations, E-Government Survey 2020
[156]. Ibid.; United Nations, E-Government Survey 2010
[157]. United Nations, Global Cybersecurity Index 2020
[158]. Ibid.; United Nations, Global Cybersecurity Index and Cyberwellness Profiles
