

Transatlantic Subnational Innovation Competitiveness Index 3.0
For policymakers to bolster the global competitiveness and innovation capacity of their regions, they must first understand their regions’ strengths and weaknesses. This report—by 11 think tanks from the Global Trade and Innovation Policy Alliance (GTIPA)—benchmarks 213 regions of 13 transatlantic countries using 14 commonly available innovation indicators.
KEY TAKEAWAYS
Key Takeaways
Contents
Highly Educated Population. 15
Professional, Scientific, and Technical Employment 18
Manufacturing Labor Productivity 20
Regional Development Policy 43
Regional Artificial Intelligence Laws and Strategies 52
Regional Development Policy 54
Regional Development Policy 56
Appendix A: Composite and Category Scores Methodology 62
Appendix B: Estimation Methodology for Unavailable Data. 64
Introduction
Innovation and competitiveness drive productivity, economic growth, and welfare growth. However, as countries seek to improve their innovation capacity through national strategies, they often overlook substantial subnational differences in innovativeness. This report seeks to close those gaps by analyzing the subnational innovation competitiveness of 13 countries: Austria, Albania, Bosnia and Herzegovina, Bulgaria, Germany, Greece, Hungary, Italy, North Macedonia, Poland, Serbia, Sweden, and the United States.
Since the last iteration of this report, innovation’s relevance to states’ global economic standing has only grown. In a time marked by rapid technological change, supply chain disruptions, and geopolitical uncertainty, nations and regions alike must continually advance their competitiveness through innovation. Furthermore, China’s explicit challenge to the techno-economic leadership of the United States and its transatlantic allies demands a strategic response. Mario Draghi’s 2024 report underscores the European Union’s lagging competitiveness, while U.S. presidents Trump and Biden have prioritized amplifying American innovation in key technology areas during each of their presidencies.[1]
Ecosystems that support scientific and technological development require substantial coordination and foresight. Research institutions, universities, start-ups, corporations, investors, and government bodies must collaborate to develop and diffuse knowledge and technologies, drawing on skilled individuals, robust infrastructure, and extensive funding (especially for research and development [R&D]), to support experimentation and implementation.
National and subnational ecosystems work in tandem to supply ingredients. While national governments may be responsible for setting regulatory policies, establishing education systems, and developing funding mechanisms, subnational actors make policy decisions that recognize unique local talent pools, resources, infrastructure, and industry capabilities. Thus, it is crucial to consider both national and subnational benchmarks for competitiveness to understand how regions and nations alike can maximize their potential for innovation and growth.
The Global Innovation Index (GII) and the European Innovation Scorecard (EIS) are prominent tools that provide comprehensive assessments of innovation performance on a global and regional scale. The GII offers a multidimensional perspective on innovation, evaluating factors such as R&D investments, human capital, and business sophistication, which collectively contribute to a country’s innovation capacity.[2] Similarly, the EIS provides a detailed analysis of innovation trends and capabilities within EU member states, facilitating benchmarking and policy evaluation.[3]
In line with the GII and EIS, the Global Trade and Innovation Policy Alliance (GTIPA) has contributed significantly to the discourse on innovation competitiveness through its series of insightful subnational innovation competitiveness reports, which provide nuanced insights into the intricate relationships between innovation, economic development, and regional competitiveness, offering valuable perspectives for policymakers, businesses, and researchers alike. This report, the “Transatlantic Subnational Innovation Competitiveness Index 3.0,” builds on two prior iterations of the Index, expanding the analysis to cover 213 regions in 13 countries. This report also, for the first time, includes an indicator on artificial intelligence (AI).
This report introduces the Index’s indicators and then assesses each region’s performance thereon. It concludes by providing policy recommendations to the 13 countries on how to boost their subnational innovation competitiveness, tailored to their unique strengths and weaknesses.
The Index
This third edition of the “Transatlantic Subnational Innovation Competitiveness Index” captures the innovation performance of 213 subnational regions across 13 countries: Austria (9 regions), Albania (12 regions [garge]), Bosnia and Herzegovina (3 entities), Bulgaria (28 provinces [oblasti]), Germany (13 federal states), Greece (13 regions), Hungary (8 regions), Italy (20 regions), North Macedonia (8 regions), Poland (17 regions), Serbia (25 districts), Sweden (7 regions), and the United States (50 states). In this report, we refer to all subnational entities, states, provinces, and districts as “regions” to simplify the analysis.
This report consists of 14 indicators representing the relevant determinants of a successful innovation ecosystem, grouped into three categories:
▪ Knowledge Economy: Indicators measure the educational attainment of the workforce; immigration of knowledge workers; employment in professional, technical, and scientific (PTS) activities; and manufacturing sector productivity.
▪ Globalization: Indicators measure high-tech exports and inward FDI.
▪ Innovation Capacity: Indicators measure a region’s expenditures on R&D, the number of R&D personnel, venture capital (VC) investment, the creation of new businesses, patent output, share of households subscribing to broadband Internet, and the extent of progress toward decarbonization.
The most heavily weighted category of the Index is innovation capacity, which accounts for 55 percent of the Index’s weight, while knowledge economy indicators account for 33 percent, and globalization indicators account for the remaining 12 percent.
Due to variations in data availability across nations and regions, certain indicators include data from varying years by country.
Also, this report assesses a 14th indicator: AI preparedness. This indicator is not included in the calculation of the final Index score, but is included in the report due to the growing understanding of how critical AI integration is and will be to economic growth, development, and innovation in the future. AI preparedness is measured by whether a region has a regional AI policy plan or strategy.
Table 1: Performance on the “Transatlantic Subnational Innovation Competitiveness Index 3.0”
|
Overall Score |
Country |
Region |
Overall Score |
Knowledge |
Globalization |
Innovation |
|||
|
Score |
Rank |
Score |
Rank |
Score |
Rank |
||||
|
1 |
USA |
Massachusetts |
95.2 |
92.9 |
2 |
51.4 |
82 |
94.7 |
2 |
|
2 |
USA |
California |
93.4 |
88.1 |
6 |
48.8 |
118 |
95.3 |
1 |
|
3 |
USA |
Delaware |
83.9 |
80.0 |
12 |
47.8 |
129 |
85.5 |
3 |
|
4 |
USA |
Maryland |
82.2 |
92.7 |
3 |
46.4 |
153 |
73.6 |
5 |
|
5 |
USA |
Washington |
78.3 |
76.0 |
16 |
46.7 |
150 |
79.2 |
4 |
|
6 |
Sweden |
Greater Metropolitan Region |
74.9 |
89.5 |
5 |
60.4 |
32 |
62.7 |
13 |
|
7 |
USA |
New Jersey |
73.8 |
86.1 |
9 |
48.3 |
122 |
64.2 |
12 |
|
8 |
Germany |
Baden-Württemberg |
73.5 |
74.2 |
21 |
60.3 |
33 |
71.5 |
6 |
|
9 |
USA |
Connecticut |
73.0 |
79.7 |
13 |
47.6 |
131 |
67.7 |
8 |
|
10 |
Sweden |
West Sweden |
73.0 |
78.2 |
14 |
63.4 |
22 |
67.4 |
10 |
|
11 |
Poland |
Warszawski Stołeczny |
69.1 |
91.6 |
4 |
58.2 |
42 |
51.6 |
24 |
|
12 |
USA |
Michigan |
66.0 |
63.8 |
38 |
48.0 |
126 |
67.5 |
9 |
|
13 |
USA |
New Hampshire |
65.7 |
59.2 |
51 |
47.8 |
128 |
70.3 |
7 |
|
14 |
USA |
Oregon |
65.5 |
66.3 |
32 |
50.8 |
95 |
64.7 |
11 |
|
15 |
USA |
Colorado |
65.3 |
77.4 |
15 |
47.0 |
143 |
56.5 |
18 |
|
16 |
Germany |
Bavaria |
65.2 |
75.5 |
18 |
59.9 |
38 |
56.7 |
17 |
|
17 |
Sweden |
South Sweden |
65.0 |
70.5 |
26 |
63.7 |
21 |
59.8 |
15 |
|
18 |
USA |
Virginia |
64.9 |
94.9 |
1 |
46.2 |
159 |
43.2 |
37 |
|
19 |
USA |
New York |
62.7 |
73.9 |
22 |
47.6 |
132 |
54.7 |
21 |
|
20 |
USA |
Minnesota |
61.5 |
64.6 |
36 |
48.1 |
124 |
59.5 |
16 |
|
21 |
Austria |
Vienna |
61.4 |
75.5 |
19 |
68.8 |
13 |
49.6 |
28 |
|
22 |
Germany |
Hesse |
60.1 |
80.4 |
11 |
64.7 |
18 |
44.2 |
34 |
|
23 |
USA |
North Carolina |
59.7 |
67.7 |
28 |
47.2 |
139 |
54.3 |
22 |
|
24 |
USA |
New Mexico |
58.6 |
62.1 |
44 |
57.3 |
47 |
55.7 |
19 |
|
25 |
Hungary |
Budapest |
58.1 |
80.5 |
10 |
61.2 |
27 |
41.1 |
41 |
|
26 |
USA |
Utah |
57.5 |
66.6 |
31 |
47.2 |
138 |
51.5 |
25 |
|
27 |
Germany |
Berlin/Brandenburg |
57.1 |
86.5 |
8 |
50.5 |
100 |
36.0 |
45 |
|
28 |
USA |
Pennsylvania |
56.8 |
62.4 |
42 |
48.6 |
120 |
53.2 |
23 |
|
29 |
USA |
Illinois |
56.3 |
74.4 |
20 |
49.8 |
109 |
43.5 |
35 |
|
30 |
Germany |
Hamburg/Schleswig-Holstein |
55.2 |
86.5 |
7 |
55.8 |
55 |
32.4 |
56 |
|
31 |
USA |
Texas |
55.0 |
75.6 |
17 |
51.0 |
92 |
40.4 |
42 |
|
32 |
Austria |
Styria |
54.9 |
45.7 |
93 |
57.5 |
45 |
61.5 |
14 |
|
33 |
Germany |
Rhineland-Palatinate |
54.3 |
65.7 |
33 |
50.4 |
102 |
46.4 |
30 |
|
34 |
USA |
Vermont |
53.4 |
57.3 |
56 |
47.1 |
142 |
51.4 |
26 |
|
35 |
USA |
Idaho |
53.3 |
52.1 |
74 |
46.2 |
157 |
55.0 |
20 |
|
36 |
USA |
Indiana |
52.5 |
64.1 |
37 |
48.3 |
121 |
44.8 |
32 |
|
37 |
USA |
Arizona |
51.8 |
66.6 |
30 |
50.9 |
94 |
41.5 |
40 |
|
38 |
Sweden |
Upper Norrland |
50.2 |
61.6 |
45 |
57.9 |
44 |
42.1 |
39 |
|
39 |
Germany |
North Rhine-Westphalia |
49.9 |
70.5 |
25 |
51.4 |
83 |
35.6 |
47 |
|
40 |
USA |
Wisconsin |
49.8 |
50.4 |
80 |
49.0 |
114 |
50.2 |
27 |
|
41 |
Germany |
Bremen/Lower Saxony |
49.0 |
68.3 |
27 |
52.7 |
72 |
35.5 |
48 |
|
42 |
USA |
Ohio |
48.4 |
57.0 |
58 |
47.8 |
130 |
43.3 |
36 |
|
43 |
USA |
Rhode Island |
48.1 |
56.8 |
59 |
45.6 |
164 |
43.1 |
38 |
|
44 |
Italy |
Emilia-Romagna |
47.5 |
51.7 |
76 |
63.8 |
20 |
44.2 |
33 |
|
45 |
USA |
Georgia |
47.2 |
65.0 |
35 |
48.7 |
119 |
35.4 |
49 |
|
46 |
Austria |
Upper Austria |
46.4 |
42.6 |
106 |
66.2 |
17 |
48.9 |
29 |
|
47 |
USA |
Wyoming |
45.7 |
73.8 |
23 |
47.5 |
134 |
26.5 |
77 |
|
48 |
Germany |
Saxony |
45.1 |
67.5 |
29 |
55.8 |
53 |
29.4 |
66 |
|
49 |
USA |
Missouri |
43.8 |
59.7 |
47 |
46.3 |
156 |
33.7 |
52 |
|
50 |
Poland |
Małopolskie |
43.6 |
55.8 |
62 |
50.6 |
97 |
35.9 |
46 |
|
51 |
USA |
Alabama |
43.6 |
54.0 |
69 |
46.2 |
158 |
37.6 |
43 |
|
52 |
USA |
Kansas |
43.6 |
59.2 |
52 |
47.5 |
133 |
33.6 |
53 |
|
53 |
Austria |
Vorarlberg |
43.2 |
40.8 |
117 |
60.1 |
35 |
45.3 |
31 |
|
54 |
Germany |
Thuringia |
43.0 |
59.5 |
49 |
55.8 |
54 |
31.7 |
61 |
|
55 |
USA |
Florida |
42.9 |
59.6 |
48 |
47.2 |
140 |
32.3 |
59 |
|
56 |
USA |
Nebraska |
42.8 |
59.4 |
50 |
45.9 |
161 |
32.3 |
58 |
|
57 |
USA |
Iowa |
42.6 |
55.7 |
63 |
47.4 |
135 |
34.6 |
51 |
|
58 |
Poland |
Dolnośląskie |
41.9 |
65.7 |
34 |
53.1 |
67 |
25.6 |
79 |
|
59 |
Serbia |
Belgrade |
41.3 |
63.4 |
39 |
62.7 |
23 |
25.5 |
81 |
|
60 |
USA |
Montana |
41.2 |
57.2 |
57 |
45.4 |
169 |
31.3 |
62 |
|
61 |
Italy |
Lombardy |
40.7 |
55.0 |
64 |
61.6 |
26 |
30.6 |
64 |
|
62 |
USA |
North Dakota |
40.5 |
53.7 |
70 |
46.6 |
151 |
32.6 |
55 |
|
63 |
USA |
Tennessee |
40.5 |
54.5 |
65 |
48.2 |
123 |
31.9 |
60 |
|
64 |
USA |
Louisiana |
40.3 |
72.0 |
24 |
45.9 |
160 |
18.9 |
103 |
|
65 |
Italy |
Lazio |
40.3 |
58.1 |
54 |
48.9 |
116 |
28.8 |
70 |
|
66 |
Germany |
Saarland |
40.3 |
60.6 |
46 |
55.1 |
56 |
26.4 |
78 |
|
67 |
Poland |
Pomorskie |
40.1 |
62.6 |
41 |
53.3 |
66 |
24.8 |
83 |
|
68 |
USA |
Maine |
39.3 |
55.9 |
61 |
45.5 |
168 |
29.1 |
68 |
|
69 |
Bulgaria |
Sofia City |
38.9 |
62.9 |
40 |
29.9 |
178 |
24.5 |
85 |
|
70 |
Austria |
Tyrol |
38.1 |
43.3 |
104 |
57.4 |
46 |
35.3 |
50 |
|
71 |
Italy |
Piedmont |
38.1 |
45.9 |
92 |
58.1 |
43 |
33.3 |
54 |
|
72 |
USA |
South Carolina |
37.9 |
54.0 |
68 |
47.1 |
141 |
27.9 |
72 |
|
73 |
Austria |
Carinthia |
37.7 |
39.3 |
122 |
60.2 |
34 |
37.3 |
44 |
|
74 |
USA |
Nevada |
37.7 |
47.4 |
90 |
47.2 |
137 |
32.4 |
57 |
|
75 |
Sweden |
Småland and the Islands |
37.5 |
50.4 |
81 |
67.9 |
14 |
28.2 |
71 |
|
76 |
USA |
Hawaii |
36.8 |
51.8 |
75 |
45.1 |
172 |
27.9 |
73 |
|
77 |
Austria |
Salzburg |
36.8 |
50.3 |
82 |
58.8 |
41 |
27.8 |
74 |
|
78 |
Sweden |
Middle Norrland |
36.5 |
53.4 |
72 |
60.5 |
30 |
25.0 |
82 |
|
79 |
Italy |
Friuli-Venezia Giulia |
36.4 |
45.3 |
95 |
60.0 |
37 |
30.7 |
63 |
|
80 |
USA |
Oklahoma |
36.1 |
48.3 |
89 |
46.3 |
155 |
29.1 |
67 |
|
81 |
Sweden |
North Middle Sweden |
35.9 |
50.8 |
77 |
64.7 |
19 |
25.6 |
80 |
|
82 |
Germany |
Saxony-Anhalt |
35.7 |
58.2 |
53 |
46.8 |
149 |
21.3 |
92 |
|
83 |
Italy |
Veneto |
35.2 |
44.1 |
103 |
60.5 |
31 |
29.6 |
65 |
|
84 |
Greece |
Attica |
34.5 |
54.4 |
66 |
17.5 |
200 |
24.4 |
86 |
|
85 |
Germany |
Mecklenburg-Vorpommern |
34.5 |
57.6 |
55 |
51.1 |
89 |
19.3 |
100 |
|
86 |
USA |
Alaska |
34.2 |
54.1 |
67 |
45.1 |
173 |
21.9 |
90 |
|
87 |
Italy |
Tuscany |
34.0 |
44.7 |
98 |
54.2 |
61 |
27.6 |
75 |
|
88 |
Italy |
Liguria |
33.8 |
49.0 |
84 |
50.2 |
104 |
24.5 |
84 |
|
89 |
Austria |
Lower Austria |
33.7 |
45.0 |
97 |
52.7 |
70 |
27.0 |
76 |
|
90 |
Italy |
Trentino |
33.5 |
41.6 |
113 |
54.6 |
59 |
29.0 |
69 |
|
91 |
Poland |
Śląskie |
32.6 |
56.2 |
60 |
51.3 |
85 |
17.2 |
111 |
|
92 |
Serbia |
South Bačka |
32.4 |
52.2 |
73 |
60.0 |
36 |
19.0 |
102 |
|
93 |
USA |
Kentucky |
31.6 |
50.7 |
78 |
49.4 |
111 |
19.7 |
96 |
|
94 |
Bulgaria |
Varna |
31.0 |
62.1 |
43 |
19.6 |
199 |
12.8 |
143 |
|
95 |
Poland |
Podlaskie |
30.6 |
45.5 |
94 |
46.9 |
148 |
22.0 |
88 |
|
96 |
Hungary |
Pest |
30.6 |
50.7 |
79 |
70.8 |
10 |
16.3 |
118 |
|
97 |
USA |
South Dakota |
30.6 |
44.2 |
102 |
45.4 |
170 |
23.0 |
87 |
|
98 |
USA |
West Virginia |
30.0 |
48.5 |
88 |
45.6 |
167 |
18.9 |
105 |
|
99 |
Poland |
Łódzkie |
29.6 |
48.6 |
87 |
50.2 |
103 |
17.8 |
108 |
|
100 |
Poland |
Lubelskie |
29.1 |
42.3 |
109 |
46.3 |
154 |
21.9 |
91 |
|
101 |
Italy |
Marche |
28.6 |
40.1 |
120 |
54.0 |
63 |
22.0 |
89 |
|
102 |
North Macedonia |
Skopje |
28.4 |
44.6 |
101 |
81.4 |
4 |
16.3 |
117 |
|
103 |
Poland |
Wielkopolskie |
27.8 |
47.0 |
91 |
51.1 |
91 |
15.8 |
122 |
|
104 |
Italy |
Abruzzo |
27.4 |
39.1 |
123 |
50.7 |
96 |
21.0 |
94 |
|
105 |
Poland |
Podkarpackie |
27.4 |
42.6 |
107 |
66.7 |
15 |
17.1 |
112 |
|
106 |
Poland |
Zachodniopomorskie |
27.3 |
48.9 |
85 |
48.9 |
115 |
13.8 |
139 |
|
107 |
Albania |
Tirana |
27.2 |
41.6 |
112 |
66.3 |
16 |
17.5 |
109 |
|
108 |
Italy |
Umbria |
27.2 |
41.4 |
115 |
51.6 |
81 |
18.9 |
104 |
|
109 |
USA |
Arkansas |
27.0 |
42.3 |
110 |
45.6 |
166 |
18.4 |
106 |
|
110 |
Poland |
Opolskie |
26.6 |
45.2 |
96 |
50.5 |
99 |
15.2 |
130 |
|
111 |
Poland |
Lubuskie |
26.4 |
44.6 |
100 |
50.5 |
101 |
15.3 |
127 |
|
112 |
Greece |
Central Macedonia |
26.2 |
42.0 |
111 |
17.5 |
200 |
19.6 |
97 |
|
113 |
Serbia |
Nišava |
25.9 |
41.6 |
114 |
56.2 |
50 |
16.2 |
119 |
|
114 |
Poland |
Kujawsko-Pomorskie |
25.8 |
44.6 |
99 |
49.2 |
112 |
14.4 |
136 |
|
115 |
Poland |
Świętokrzyskie |
25.7 |
43.1 |
105 |
49.1 |
113 |
15.4 |
126 |
|
116 |
Poland |
Warmińsko-Mazurskie |
25.2 |
40.5 |
119 |
45.8 |
162 |
16.8 |
115 |
|
117 |
Greece |
Epirus |
25.2 |
37.6 |
125 |
17.5 |
200 |
21.1 |
93 |
|
118 |
Hungary |
Central Transdanubia |
24.9 |
37.7 |
124 |
83.4 |
3 |
15.2 |
131 |
|
119 |
USA |
Mississippi |
24.6 |
40.9 |
116 |
47.9 |
127 |
15.2 |
129 |
|
120 |
Austria |
Burgenland |
24.4 |
34.2 |
138 |
52.5 |
74 |
19.5 |
98 |
|
121 |
Poland |
Mazowiecki Regionalny |
23.8 |
53.4 |
71 |
49.8 |
108 |
4.7 |
213 |
|
122 |
Italy |
Campania |
23.8 |
31.3 |
147 |
46.9 |
145 |
21.0 |
95 |
|
123 |
Bulgaria |
Montana |
22.9 |
48.8 |
86 |
26.3 |
187 |
8.5 |
193 |
|
124 |
Italy |
Aosta Valley |
22.3 |
33.3 |
140 |
48.1 |
125 |
17.0 |
113 |
|
125 |
Hungary |
Western Transdanubia |
22.3 |
31.8 |
146 |
77.1 |
6 |
15.7 |
124 |
|
126 |
Greece |
Central Greece |
22.1 |
49.8 |
83 |
17.5 |
200 |
7.2 |
207 |
|
127 |
Greece |
Crete |
22.0 |
32.8 |
142 |
17.5 |
200 |
19.3 |
99 |
|
128 |
Hungary |
Northern Great Plain |
21.5 |
30.2 |
152 |
84.8 |
2 |
15.0 |
132 |
|
129 |
Bulgaria |
Gabrovo |
21.5 |
37.2 |
126 |
30.4 |
177 |
14.2 |
137 |
|
130 |
Italy |
Molise |
21.4 |
32.2 |
145 |
45.7 |
163 |
16.4 |
116 |
|
131 |
Hungary |
Northern Hungary |
21.1 |
33.5 |
139 |
77.2 |
5 |
12.5 |
146 |
|
132 |
Serbia |
Šumadija |
20.9 |
34.5 |
135 |
56.7 |
49 |
13.1 |
142 |
|
133 |
Greece |
Thessaly |
20.9 |
35.4 |
132 |
17.5 |
200 |
15.6 |
125 |
|
134 |
Hungary |
Southern Great Plain |
20.6 |
25.6 |
168 |
69.2 |
12 |
18.1 |
107 |
|
135 |
Italy |
Basilicata |
20.6 |
32.8 |
143 |
46.5 |
152 |
14.6 |
134 |
|
136 |
Bulgaria |
Smolyan |
20.5 |
42.4 |
108 |
21.5 |
197 |
9.5 |
178 |
|
137 |
Greece |
West Greece |
20.4 |
29.2 |
157 |
17.5 |
200 |
19.2 |
101 |
|
138 |
Italy |
Apulia |
20.3 |
28.9 |
158 |
47.3 |
136 |
16.9 |
114 |
|
139 |
Italy |
Sardinia |
20.2 |
30.4 |
151 |
45.6 |
165 |
15.8 |
123 |
|
140 |
Bulgaria |
Shumen |
20.0 |
32.6 |
144 |
29.7 |
180 |
15.2 |
128 |
|
141 |
Italy |
Sicily |
19.9 |
27.7 |
159 |
47.0 |
144 |
17.2 |
110 |
|
142 |
Bulgaria |
Ruse |
19.9 |
34.2 |
137 |
27.1 |
184 |
14.0 |
138 |
|
143 |
Bulgaria |
Silistra |
19.7 |
40.6 |
118 |
27.0 |
185 |
9.0 |
188 |
|
144 |
Greece |
East Macedonia and Thrace |
19.2 |
31.1 |
148 |
17.5 |
200 |
15.9 |
121 |
|
145 |
Bulgaria |
Plovdiv |
18.7 |
30.7 |
150 |
24.9 |
190 |
14.7 |
133 |
|
146 |
Bulgaria |
Veliko Tarnovo |
18.5 |
34.7 |
133 |
23.2 |
195 |
11.7 |
151 |
|
147 |
Greece |
West Macedonia |
18.5 |
34.3 |
136 |
17.5 |
200 |
12.3 |
148 |
|
148 |
Serbia |
South Banat |
18.4 |
29.9 |
154 |
58.9 |
40 |
12.0 |
150 |
|
149 |
Bulgaria |
Pernik |
18.3 |
39.8 |
121 |
26.1 |
189 |
7.4 |
205 |
|
150 |
Hungary |
Southern Transdanubia |
18.2 |
26.5 |
163 |
70.6 |
11 |
13.2 |
140 |
|
151 |
Bulgaria |
Razgrad |
18.0 |
36.9 |
128 |
34.8 |
175 |
8.2 |
196 |
|
152 |
Bosnia and Herzegovina |
Federation of Bosnia and Herzegovina |
17.7 |
30.1 |
153 |
60.5 |
29 |
10.7 |
159 |
|
153 |
Italy |
Calabria |
17.6 |
26.3 |
164 |
45.2 |
171 |
14.5 |
135 |
|
154 |
Bulgaria |
Burgas |
17.2 |
34.6 |
134 |
23.1 |
196 |
9.6 |
177 |
|
155 |
Greece |
North Aegean |
17.2 |
26.1 |
165 |
17.5 |
200 |
16.2 |
120 |
|
156 |
Bulgaria |
Dobrich |
17.2 |
36.1 |
131 |
24.7 |
191 |
8.3 |
195 |
|
157 |
Bulgaria |
Kardzhali |
17.1 |
37.0 |
127 |
3.7 |
213 |
9.2 |
183 |
|
158 |
Bulgaria |
Vidin |
16.9 |
36.8 |
129 |
26.2 |
188 |
7.3 |
206 |
|
159 |
Serbia |
Bor |
16.9 |
31.1 |
149 |
74.8 |
8 |
7.4 |
204 |
|
160 |
Bulgaria |
Vratsa |
16.9 |
33.1 |
141 |
29.8 |
179 |
9.6 |
176 |
|
161 |
Greece |
Peloponnese |
16.8 |
29.3 |
156 |
17.5 |
200 |
13.2 |
141 |
|
162 |
Bulgaria |
Targovishte |
16.4 |
36.1 |
130 |
23.3 |
194 |
7.1 |
208 |
|
163 |
Serbia |
Moravica |
15.8 |
27.3 |
162 |
53.1 |
68 |
10.1 |
174 |
|
164 |
Serbia |
Zlatibor |
15.5 |
25.3 |
170 |
54.5 |
60 |
11.0 |
157 |
|
165 |
North Macedonia |
Pelagonia |
15.2 |
23.4 |
177 |
71.8 |
9 |
10.5 |
164 |
|
166 |
Bosnia and Herzegovina |
Republika Srpska |
15.2 |
24.3 |
171 |
55.0 |
57 |
11.1 |
156 |
|
167 |
Bulgaria |
Lovech |
15.1 |
27.4 |
161 |
37.1 |
174 |
10.2 |
172 |
|
168 |
Serbia |
Srem |
15.1 |
24.1 |
172 |
54.0 |
64 |
11.1 |
155 |
|
169 |
Bulgaria |
Pleven |
15.0 |
26.1 |
166 |
20.4 |
198 |
12.4 |
147 |
|
170 |
Bulgaria |
Stara Zagora |
15.0 |
27.6 |
160 |
28.6 |
181 |
10.5 |
166 |
|
171 |
Albania |
Durrës |
14.9 |
21.0 |
188 |
62.0 |
25 |
12.5 |
145 |
|
172 |
North Macedonia |
Southeastern |
14.9 |
17.7 |
197 |
96.3 |
1 |
12.1 |
149 |
|
173 |
Serbia |
Podunavlje |
14.4 |
25.4 |
169 |
50.9 |
93 |
9.2 |
182 |
|
174 |
Serbia |
Mačva |
14.2 |
23.1 |
179 |
54.7 |
58 |
10.4 |
168 |
|
175 |
Bosnia and Herzegovina |
Brčko District |
14.0 |
22.8 |
180 |
52.2 |
76 |
10.5 |
167 |
|
176 |
Serbia |
West Bačka |
13.7 |
23.5 |
176 |
51.7 |
80 |
9.5 |
179 |
|
177 |
Serbia |
North Bačka |
13.7 |
22.3 |
181 |
54.2 |
62 |
10.1 |
173 |
|
178 |
Bulgaria |
Pazardzhik |
13.6 |
21.0 |
189 |
34.5 |
176 |
12.6 |
144 |
|
179 |
North Macedonia |
Southwestern |
13.5 |
20.0 |
191 |
59.8 |
39 |
11.1 |
154 |
|
180 |
Greece |
Ionian Islands |
13.5 |
23.9 |
174 |
17.5 |
200 |
11.7 |
152 |
|
181 |
Serbia |
Pirot |
12.9 |
23.6 |
175 |
51.1 |
90 |
8.2 |
197 |
|
182 |
Bulgaria |
Blagoevgrad |
12.8 |
23.1 |
178 |
27.8 |
183 |
10.2 |
170 |
|
183 |
Bulgaria |
Kyustendil |
12.7 |
29.7 |
155 |
23.7 |
193 |
5.6 |
210 |
|
184 |
Greece |
South Aegean |
12.7 |
24.0 |
173 |
17.5 |
200 |
10.2 |
171 |
|
185 |
Serbia |
Pomoravlje |
12.7 |
21.7 |
183 |
52.4 |
75 |
9.0 |
187 |
|
186 |
Serbia |
Kolubara |
12.6 |
21.3 |
186 |
52.7 |
71 |
9.3 |
181 |
|
187 |
Serbia |
Central Banat |
12.6 |
21.0 |
187 |
52.8 |
69 |
9.4 |
180 |
|
188 |
North Macedonia |
Polog |
12.6 |
17.8 |
196 |
56.8 |
48 |
11.4 |
153 |
|
189 |
Serbia |
Rasina |
12.5 |
21.4 |
185 |
51.8 |
79 |
9.1 |
184 |
|
190 |
North Macedonia |
Eastern |
12.4 |
17.9 |
195 |
62.5 |
24 |
10.6 |
162 |
|
191 |
Serbia |
Braničevo |
12.1 |
21.5 |
184 |
51.3 |
86 |
8.4 |
194 |
|
192 |
North Macedonia |
Vardar |
12.0 |
16.0 |
201 |
76.2 |
7 |
10.2 |
169 |
|
193 |
Bulgaria |
Sliven |
11.6 |
25.8 |
167 |
28.0 |
182 |
6.3 |
209 |
|
194 |
Albania |
Vlorë |
11.6 |
16.1 |
200 |
60.9 |
28 |
10.6 |
161 |
|
195 |
Serbia |
North Banat |
11.4 |
20.1 |
190 |
51.2 |
87 |
8.1 |
200 |
|
196 |
Bulgaria |
Sofia Province |
10.7 |
15.1 |
202 |
52.5 |
73 |
10.5 |
163 |
|
197 |
Serbia |
Zaječar |
10.5 |
18.9 |
192 |
51.9 |
77 |
7.4 |
203 |
|
198 |
Serbia |
Jablanica |
10.2 |
18.1 |
194 |
50.5 |
98 |
7.7 |
202 |
|
199 |
Albania |
Fier |
10.2 |
14.2 |
203 |
55.9 |
52 |
10.1 |
175 |
|
200 |
Serbia |
Pčinja |
10.2 |
17.5 |
198 |
49.7 |
110 |
8.1 |
198 |
|
201 |
Albania |
Shkodër |
10.0 |
12.7 |
205 |
53.9 |
65 |
11.0 |
158 |
|
202 |
Albania |
Korçë |
9.5 |
12.4 |
206 |
51.9 |
78 |
10.5 |
165 |
|
203 |
Serbia |
Toplica |
9.4 |
16.3 |
199 |
49.9 |
106 |
7.8 |
201 |
|
204 |
Bulgaria |
Yambol |
9.4 |
22.1 |
182 |
23.8 |
192 |
5.6 |
211 |
|
205 |
Serbia |
Raška |
9.3 |
14.2 |
204 |
51.2 |
88 |
9.1 |
185 |
|
206 |
Albania |
Elbasan |
9.1 |
11.4 |
209 |
51.4 |
84 |
10.6 |
160 |
|
207 |
North Macedonia |
Northeastern |
8.8 |
12.4 |
207 |
56.0 |
51 |
9.1 |
186 |
|
208 |
Bulgaria |
Haskovo |
8.0 |
18.6 |
193 |
26.5 |
186 |
5.6 |
212 |
|
209 |
Albania |
Gjirokastër |
7.9 |
11.7 |
208 |
48.9 |
117 |
8.7 |
191 |
|
210 |
Albania |
Lezhë |
6.8 |
9.0 |
211 |
49.9 |
105 |
8.7 |
190 |
|
211 |
Albania |
Berat |
6.8 |
9.2 |
210 |
49.9 |
107 |
8.5 |
192 |
|
212 |
Albania |
Kukës |
5.0 |
5.1 |
213 |
46.9 |
146 |
8.8 |
189 |
|
213 |
Albania |
Dibër |
4.8 |
5.6 |
212 |
46.9 |
146 |
8.1 |
199 |
Overall
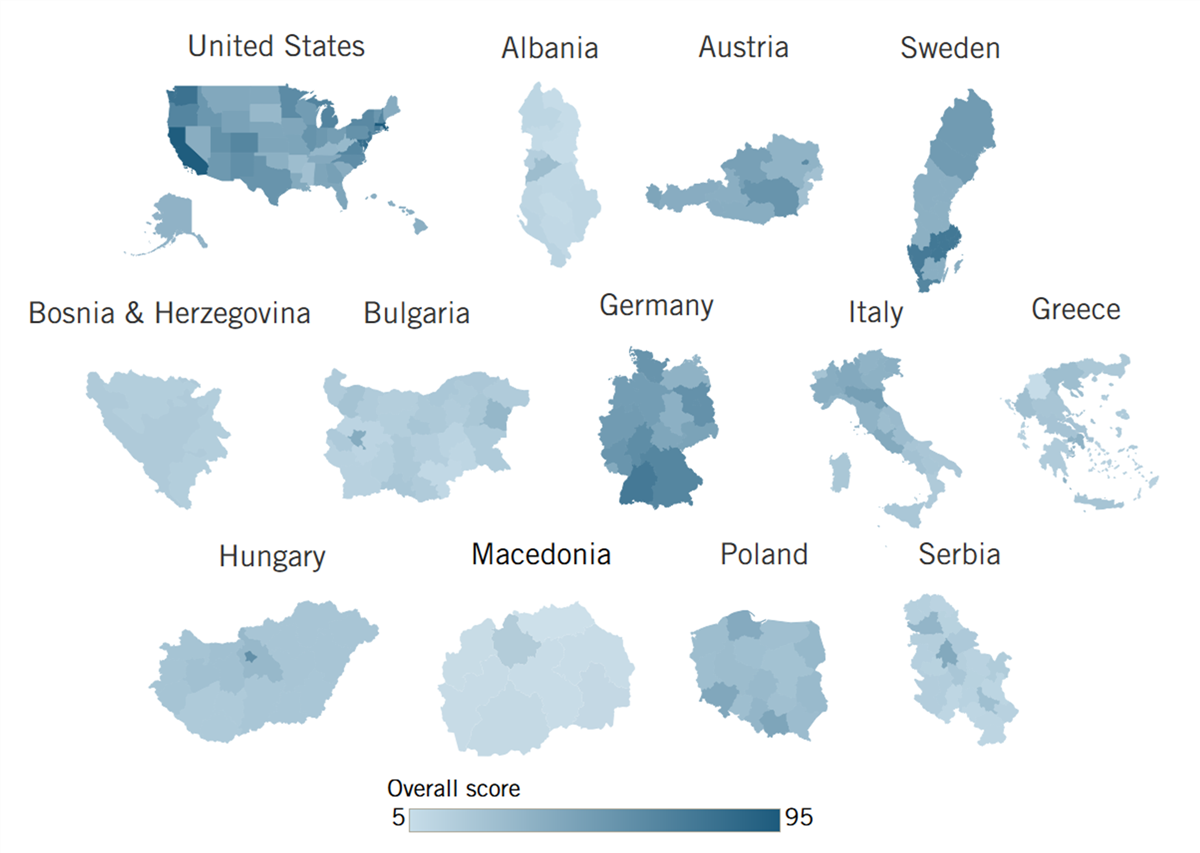
Several U.S. states lead the Index, taking 7 of the top 10 positions. Massachusetts is the highest-scoring region, with an overall score of 95.2, followed by California and Delaware. These three regions are highly specialized in advanced, innovative industries, including biopharmaceuticals and the digital economy. Sweden’s Greater Metropolitan Region and Germany’s Baden-Württemberg are the top-performing regions in Europe, capturing the 6th and 8th positions, respectively. West Sweden follows in 10th.
The United States has the largest regional variability of the countries in the Index, with a range of 70.6 between Massachusetts and the worst-performing state, Mississippi. Smaller and less-innovative regions exhibit significantly less variability, with Bosnia and Herzegovina, one of the smallest countries in the Index by population, having a range of just 3.7 points. In fact, the number of regions and variability in the Index score are highly positively correlated, with a correlation coefficient of 0.70.
The variances between the different countries also reflect the differences in the overall economic and geographic size and political-administrative independence of the respective sub-national entities. For example, U.S. and German states have considerable political and economic policy powers and are economically sizable themselves; in Austria, Italy, Poland, Sweden, and Greece (to an extent), these regions are more self-centered with smaller economies. In Albania, Bosnia and Herzegovina, Bulgaria, Hungary, North Macedonia, and Serbia, subnational units are essentially administrative divisions often without fiscal governance or self-sufficiency.
Figure 1: Maximum, minimum, quartiles, and median of Index scores[4]
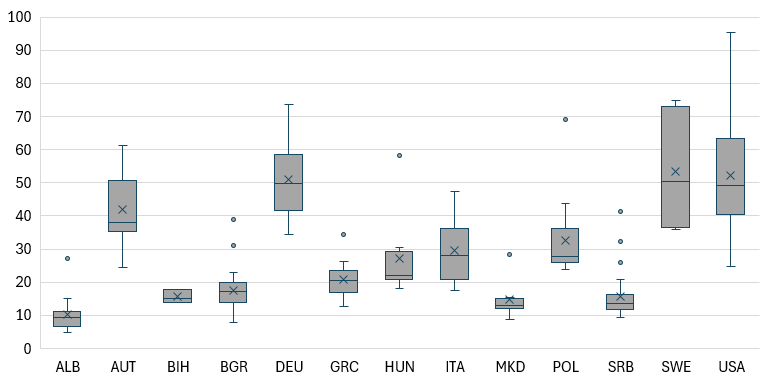
The best-performing regions in the Index tend to be areas with strong urban hubs. These include U.S. states such as California, which is anchored by the technology hub of San Francisco, San Jose, and the surrounding regions that comprise Silicon Valley, and Sweden’s Greater Metropolitan Region, which includes Stockholm. Additionally, city-states perform very well due to their high concentration of highly educated individuals, universities, and advanced industry. These include Budapest, Hungary; Berlin, Germany; and Sofia, Bulgaria.
Figure 2: Performance in the “Transatlantic Subnational Innovation Competitiveness Index 3.0”[5]
Knowledge Economy
Highly Educated Population
Why is this important? Knowledge is a fundamental innovation input, and the proportion of a population that is highly educated is a strong indicator of human capital.[6] In addition, higher education levels correlate with a more dynamic economy, greater per capita income to scale innovations, and better-integrated economies with international supply chains.[7] Thus, this indicator measures the share of a region’s 25- to 64-year-old (“working age”) population with a bachelor’s degree equivalent or higher.
Figure 3: Share of 25- to 64-year-old population with a bachelor’s degree (or equivalent) or higher, 2022–2025[8]
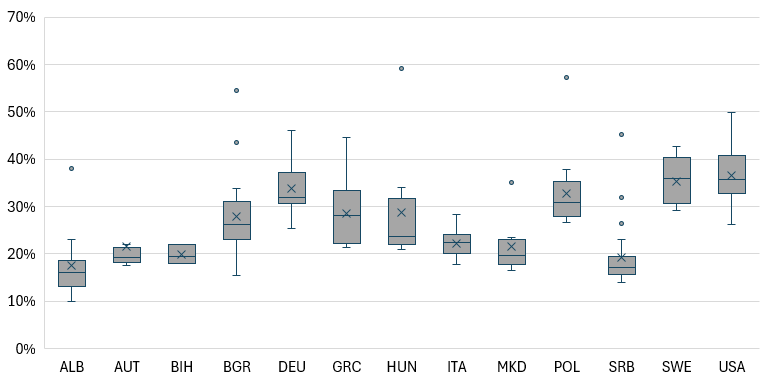
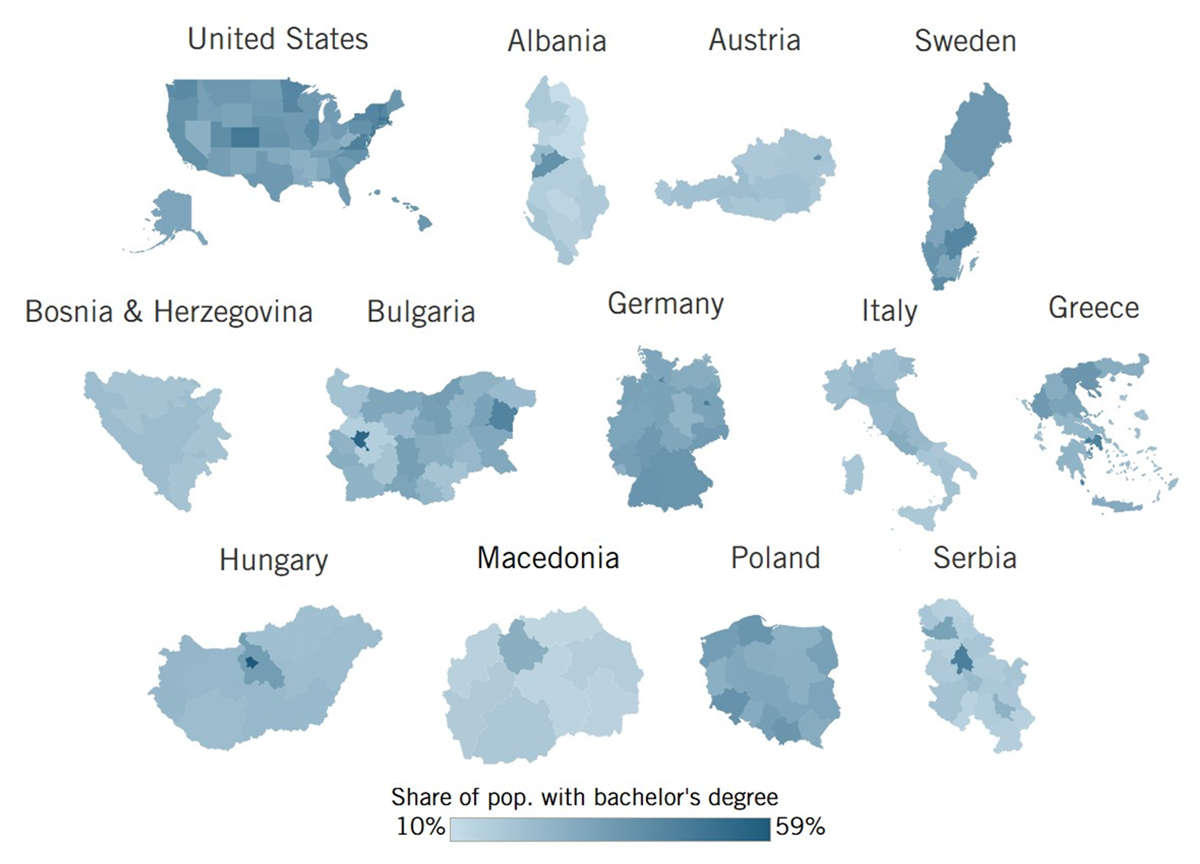
The regions with the largest share of highly educated workers are all located in Europe, with Budapest (59 percent) leading the Index, followed by Warszawski Stołeczny (57 percent), and Sofia City (55 percent). Massachusetts is the top-performing state in the United States and the only state in which half of the population has a tertiary degree or more, followed by Colorado (48 percent) and New Jersey (47 percent).
Sweden has the highest regional educational attainment level, on average, in the Index, with the median reaching 35.9 percent, meaning over one-third of the population in every Swedish region has the equivalent of a bachelor’s degree or higher. Behind Sweden is the United States, where the median is 35.7 percent. Unlike Sweden, the United States exhibits substantial variability on this indicator, with top states, such as Massachusetts, performing over 20 percentage points better than the worst-performing regions, such as West Virginia and Mississippi. Despite efforts to make higher education affordable across the Atlantic, all other countries in this Index fall below the Organization for Economic Cooperation and Development (OECD) average for bachelor’s-or-higher educational attainment, at roughly 36 percent.
Most countries in the Index are led by a single outlier region, typically a capital or urban area. This is the case in Hungary, where Budapest performs 25 percentage points better than the next-closest region, Pest (34 percent). Similar trends can be seen in Poland, Serbia, Bulgaria, Albania, and North Macedonia, where the capital cities lead the country by a sizeable margin while the median remains low.
The regions with the lowest educational attainment tend to be very rural areas with few urban centers or innovation activity. For example, Albania’s Lezhë (14 percent), Berat (13 percent), Dibër (11 percent), and Kukes (10 percent) fall to the bottom of the Index. These areas are all highly dependent on agriculture and agro-processing, resulting in relatively low levels of educational attainment. Historically, they have also lacked local universities due to fiscal dependence on the central government and no strong private sector.
Figure 4: Performance in highly educated populations[9]
Skilled Immigration
Why is this important? Skilled immigration enables the collaboration of workers with unique educational experiences and backgrounds, driving innovation. As skill is a difficult variable to quantify, this indicator measures the educational attainment of immigrants, calculated as a region’s share of foreign-born workers with at least some tertiary education relative to the total regional population. A 2022 study from the Institute for Progress finds that over half of all science, technology, engineering, and mathematics (STEM) doctoral degree holders working in American defense industries are foreign-born, while across all industries, foreign-born workers account for 19 percent of all STEM workers and 43 percent of doctorate-level scientists and engineers.[10] Conversely, a low level of skilled immigration, or even a net emigration of skilled workers, can be detrimental to a nation’s (or subnational region’s) innovation ecosystem.
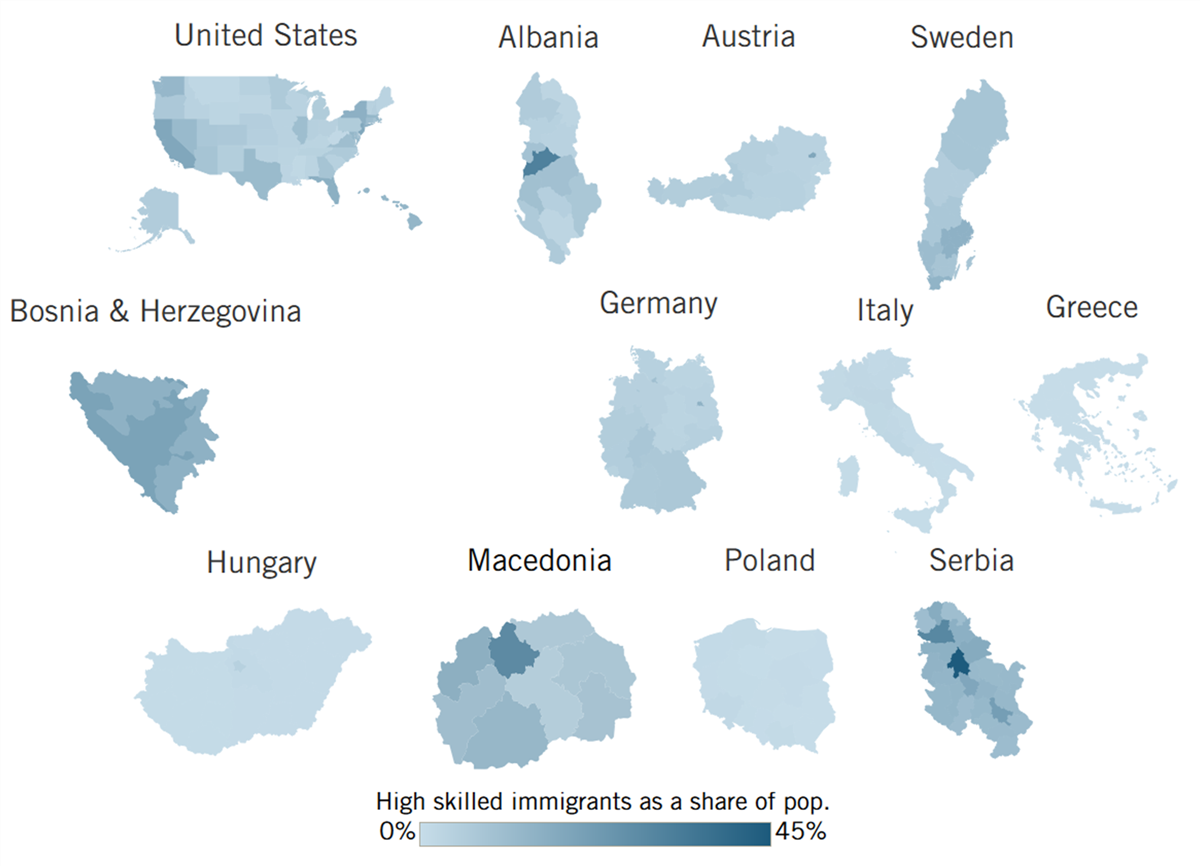
Figure 5: Share of population that was foreign born and had some tertiary education, 2022–2025[11]
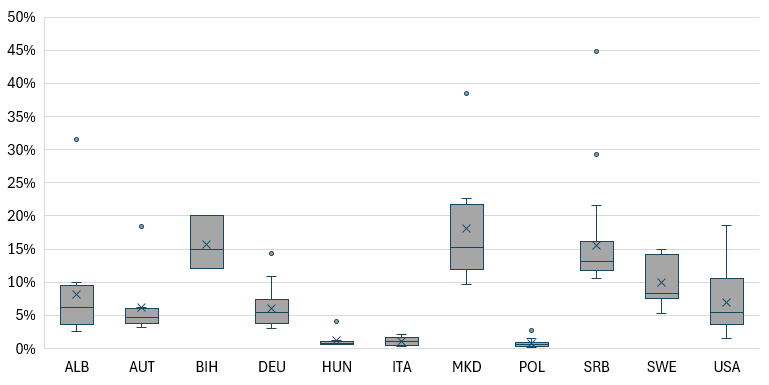
The regions with the highest proportions of educated foreign-born populations are Belgrade (45 percent), Skopje (38 percent), and Tirana (32 percent). Notably, these regions are all in the Western Balkans, a region with significant migration. However, overall, the Western Balkans experience a net emigration of skilled workers, with nearly 25 percent of Western Balkan citizens living abroad.[12] Several other Balkan regions rank near the top of the Index for skilled immigration, with South Bačka, Polog, Nišava, and the Federation of Bosnia and Herzegovina all above 20 percent.
The United States has many regions that attract high numbers of skilled immigrants, including California (19 percent), New Jersey (18 percent), Florida (16 percent), and New York (15 percent). These regions are located on the coasts and have high concentrations of universities and advanced industries, making them attractive destinations for highly educated foreign immigrants. European capital regions also exhibit high percentages of skilled immigrants, including Vienna (18 percent), Stockholm (14 percent), and Berlin (14 percent).
Conversely, the Visegrád economies attract much lower percentages of foreign highly educated talent, with Hungary and Poland each registering a country median of 1 percent. Both countries are led by their respective capitals, with Budapest registering a skilled immigration rate of 4 percent, while Warszawski Stołeczny shows a rate of 3 percent. Italy also has a country median of 1 percent, though Sicily is an outlier.
Figure 6: Performance in skilled immigration[13]
Professional, Scientific, and Technical Employment
Why is this important? This indicator measures the share of employees working in PTS activities in each region. This includes, for example, engineers, researchers, doctors, and lawyers. PTS services include those needed to facilitate the development, implementation, and commercialization of innovations. Automation and globalization also make high-value-added professional services increasingly important to the modern economy. These occupations are highly knowledge intensive and therefore harder to offshore, and they also pay significantly higher-than-average wages.[14]
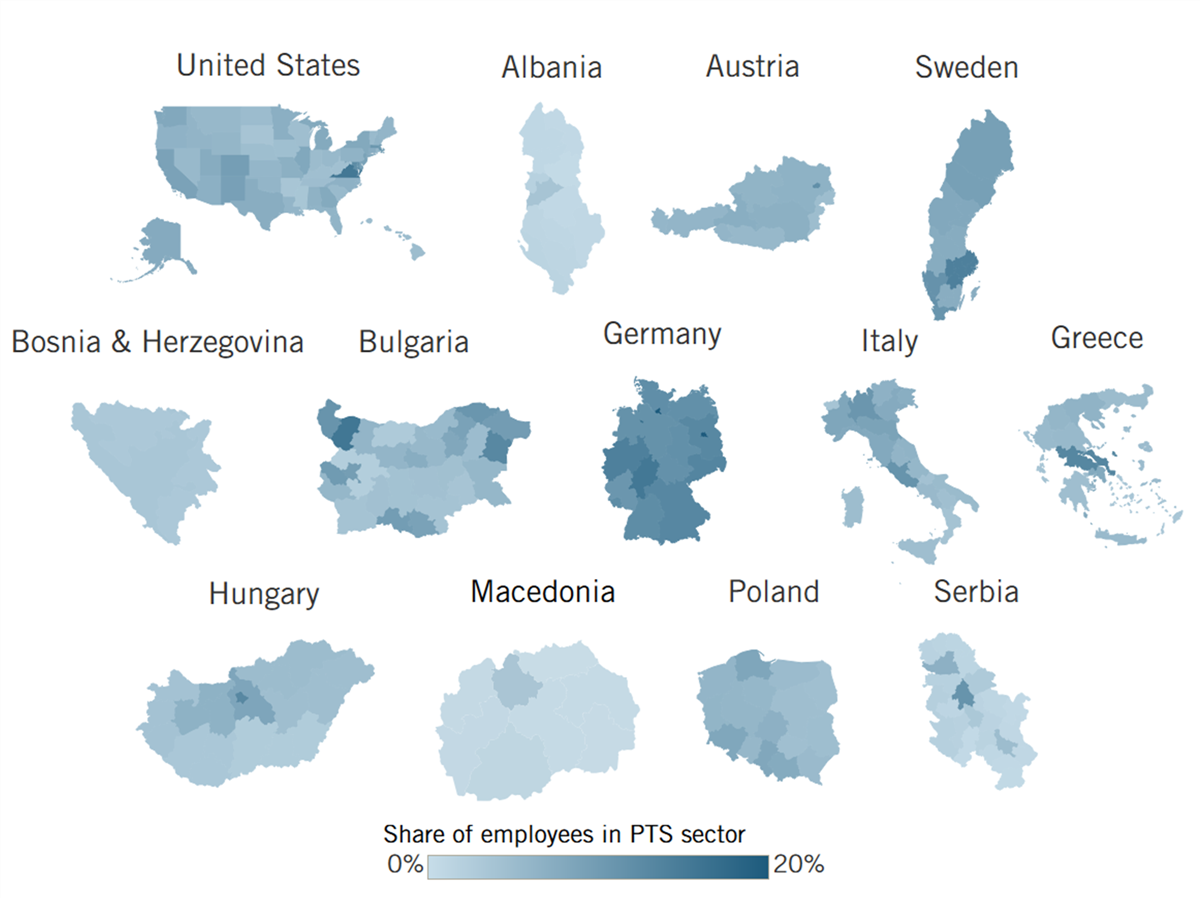
Figure 7: Share of employees in PTS fields, 2022–2025[15]
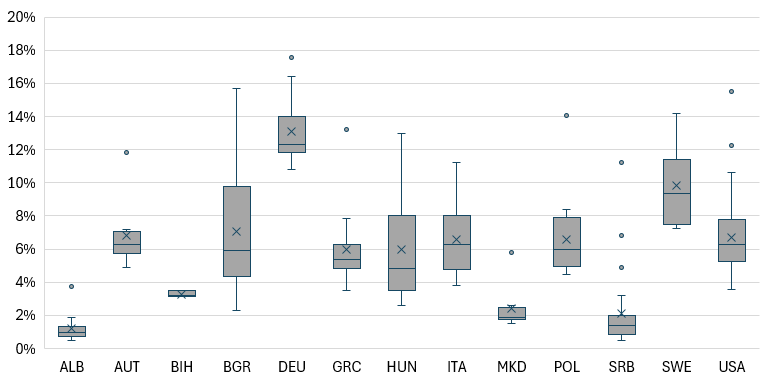
Germany leads the Index with the highest average regional PTS employment rate. City-states drive Germany’s leadership, with Berlin and Brandenburg (18 percent) and Hamburg and Schleswig-Holstein (16 percent), followed closely by Hesse (16 percent) and North Rhine-Westphalia (14 percent). These regions highlight Germany’s powerful research and innovation ecosystem, contributing to a robust employment landscape.
Outside Germany, Montana, Bulgaria posts the highest employment rate of PTS workers at 16 percent, driven by the region’s strong manufacturing industry, particularly its battery industry. Monbat, the leading company in the region, produces over 1 million lead-acid batteries annually for use in the production of cars, trucks, and military vehicles.[16] Outside Montana, there exists a wide range in PTS employment in Bulgaria, with some regions, such as Pleven and Sofia Province, reaching just 3 percent and 2 percent, respectively. Montana and Pleven have also been among the priority regions in Bulgaria for R&D and innovation investments from EU funds, which could be another reason for the higher employment rate of PTS workers, though this might be a temporary subsidy effect.
High PTS employment is strongly correlated with high concentrations of the technology and defense industries. For example, Virginia leads the United States (15 percent), followed by Maryland (12 percent) and Massachusetts (11 percent). In Europe, the same trend holds, with Sweden’s Greater Metropolitan Region (15 percent), Warszawski Stołeczny (14 percent), Bavaria (13 percent), and Budapest (13 percent) all excelling on this indicator.
Aside from their capitals and a few urban areas, Serbia and Albania host almost no PTS employment. In Serbia, Belgrade and South Bačka lead with 11 and 7 percent of their workforce employed in PTS, respectively, while in Albania, every region outside Tirana (4 percent) sits at or below 2 percent of all jobs.
Figure 8: Performance in PTS employment[17]
Manufacturing Labor Productivity
Why is this important? Within manufacturing, high-value-added firms are most often capital intensive, producing more technologically complex products and organizing their workers to take better advantage of their skills. They are typically more productive, pay higher wages, and generate greater value for each hour worked. All else being equal, firms with higher value-added levels are more likely to be able to meet global competitiveness challenges. In this context, gross value added (GVA) measures the contribution to gross domestic product (GDP) made by an individual producer, industry, or sector. This indicator focuses on the manufacturing sector, and it measures the average GVA per worker on a purchasing power parity (PPP) basis.
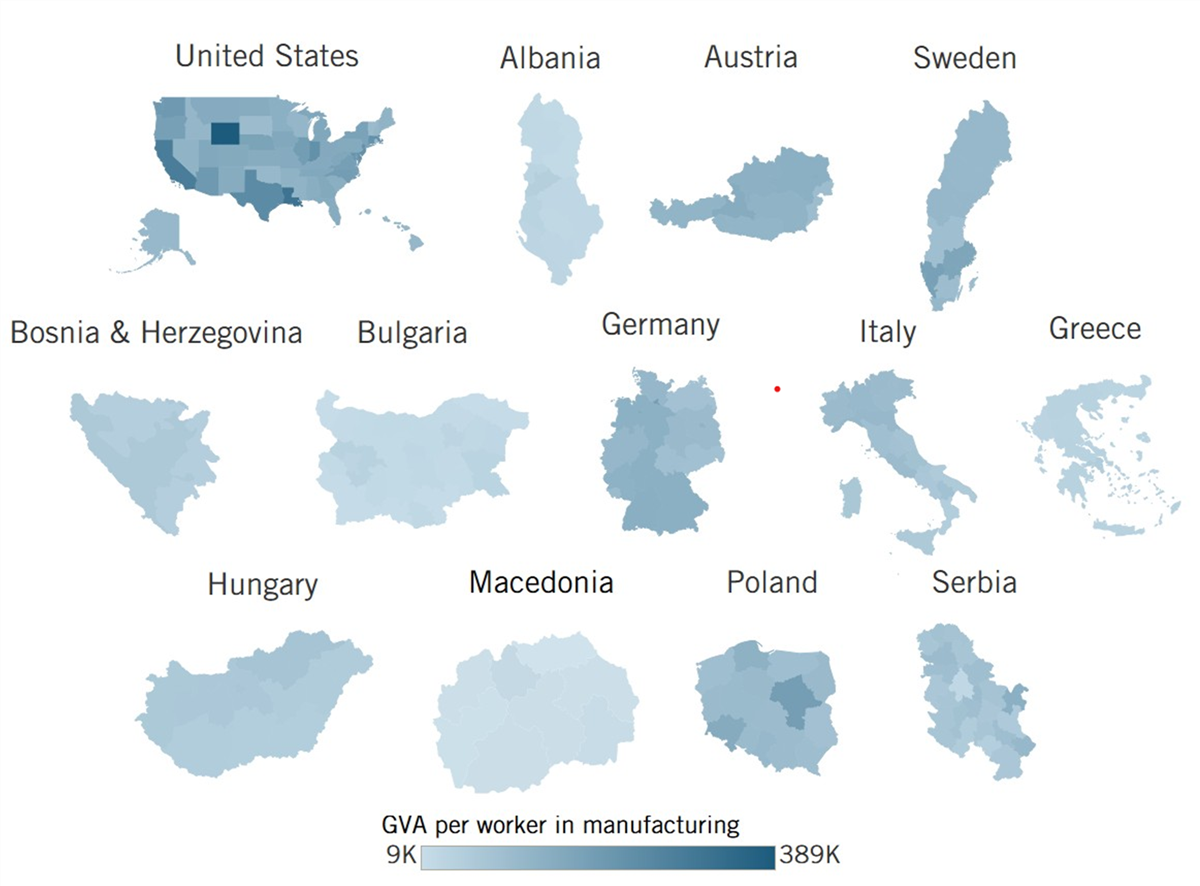
Figure 9: PPP-adjusted GVA per worker in the manufacturing sector, 2021–2025[18]
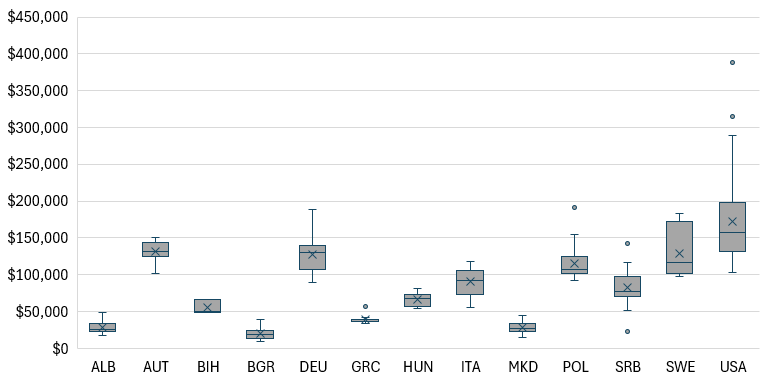
Regions in the United States take the top 14 spots in manufacturing labor productivity. This metric favors capital-intensive process industries, so states with chemical and petroleum refining tend to perform well, including Wyoming ($389,000), Louisiana ($315,000), and Texas ($247,000). California and Massachusetts boast more diverse industries but still rank highly thanks to their sophisticated precision instruments, aerospace, and biotechnology manufacturing sectors ($289,000 and $230,000, respectively).
This pattern is also reflected in European regions with high manufacturing labor productivity: Mazowiecki Regionalny ($191,000) is home to a petrochemical complex, and West Sweden ($183,000) has high-value-added manufacturing bases and refining capacity. Sweden’s Greater Metropolitan Region, Germany’s Hamburg and Schleswig-Holstein region, and Poland’s Dolnośląskie region also perform well with manufacturing GVA over $154,000 due to their diversified, high-value-added manufacturing activities.
Nine out of 10 of the lowest-productivity regions in this Index are in Bulgaria—Silistra ($9,000), Vidin ($11,000), Blagoevgrad ($11,000), Smolyan ($13,000), Kyustendil ($13,000), Dobrich ($13,000), Haskovo ($13,000), Montana ($14,000), and Razgrad ($17,000)—with North Macedonia’s Northeastern region ($15,000) the only exception. Bulgaria, North Macedonia, and Albania have the lowest median manufacturing labor productivities in the Index, which is consistent with their comparatively low-income economies amongst participants in the Index.
Figure 10: Performance in manufacturing labor productivity[19]

Globalization
High-Tech Exports
Why is this important? This indicator measures a region’s exports in the machinery manufacturing, computer and electronic products manufacturing, and electrical equipment, appliances, and components manufacturing industries (North American Industry Classification System “NAICS” 333–335, or equivalent) as a share of GDP. High-value-added manufactured goods such as these are crucial to the modern global economy, as they support supply chains for advanced and national power industries.[20] A region’s exports of these goods as a share of GDP show to what extent a region has a comparative advantage in high-tech production and exportation.
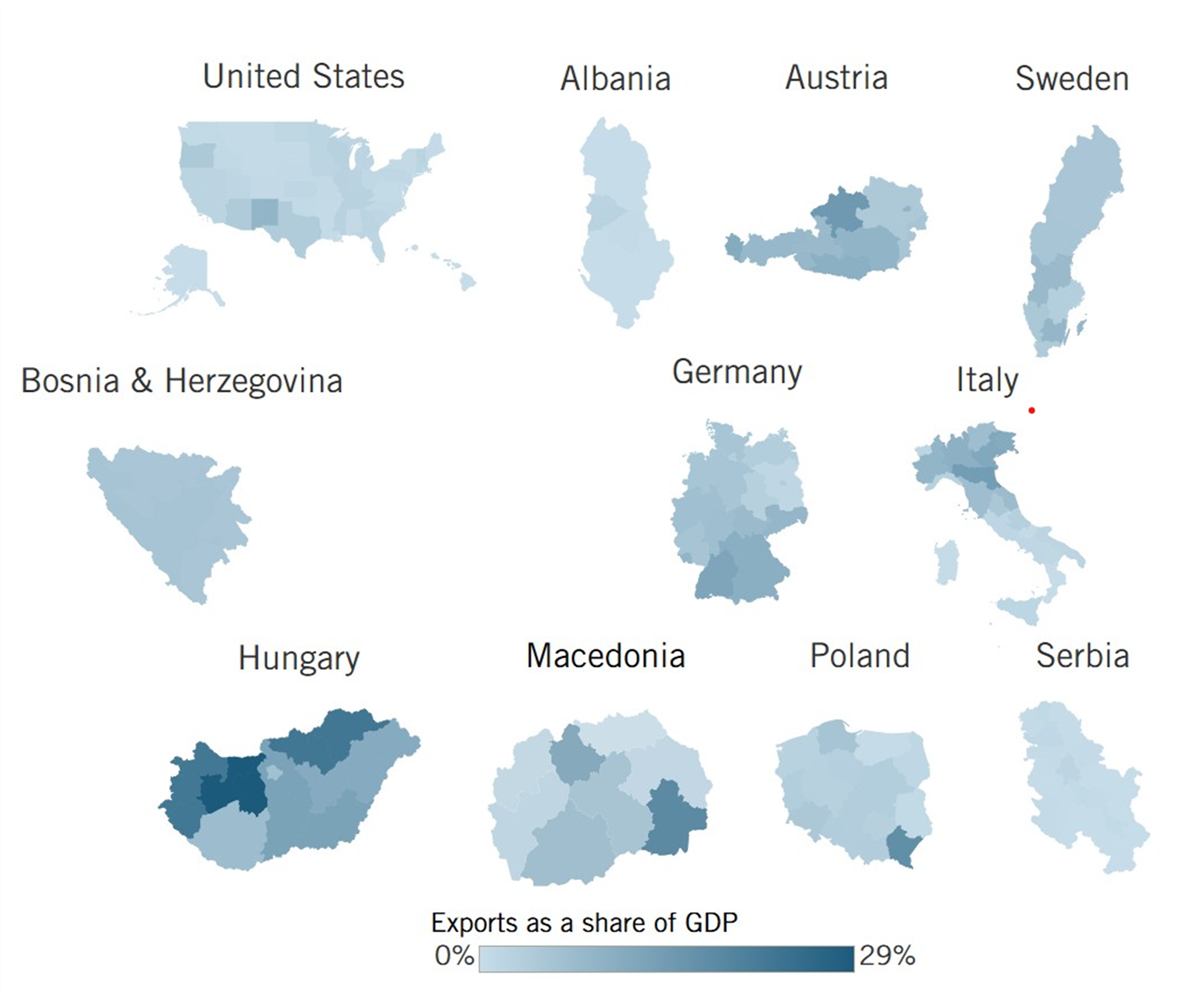
Figure 11: Exports in NAICS 333–335 (or equivalent) as a share of GDP, 2023–2025[21]
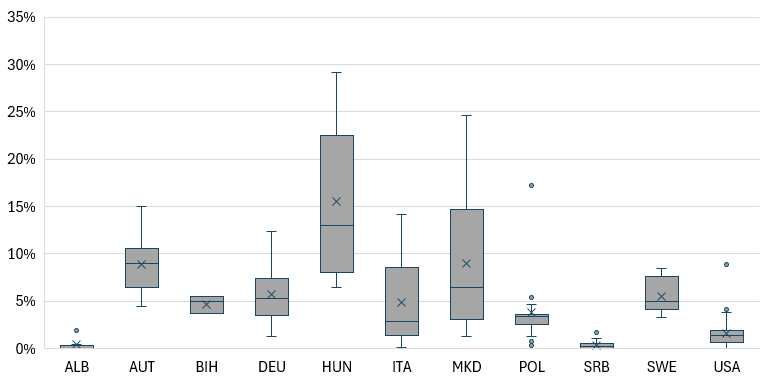
Hungary’s assembly regions score highly on this indicator, including Central Transdanubia (29 percent), Northern Hungary (23 percent), and Western Transdanubia (22 percent). In addition, six of the country’s eight regions record high-tech exports exceeding 10 percent of GDP, with 3 regions above 20 percent. This high concentration of high-tech exporters reflects Hungary’s strength in advanced manufacturing sectors, particularly automotive and automotive parts manufacturing.
Other regions in Central and Southern Europe perform particularly well. North Macedonia’s Southeastern region (25 percent) records the second-highest share of high-tech exports as a share of GDP, due in part to its location near the borders of two EU member states, Bulgaria and Greece, and its strong agribusiness and agricultural machinery industries. Podkarpackie (17 percent), Skopje (16 percent), Upper Austria (15 percent), and Emilia-Romagna (14 percent) are also among the top-scoring regions on this indicator in the Index.
Countries with strong, broad-based manufacturing ecosystems tend to perform well on this indicator, including Germany and Italy. Germany’s manufacturing-heavy regions, including Baden-Württemberg, Bavaria, Saarland, and Saxony, have high-tech export rates of over 9 percent. Meanwhile, in Italy, Emilia-Romagna, Veneto, Friuli-Venezia Giulia, Lombardy, and Piedmont also export high-tech products valued at 9 percent or more of GDP.
The United States is a relatively weak performer on this indicator, with the third-lowest median regional score, ahead of only Serbia and Albania. New Mexico exhibits the highest rate of high-tech exports in the United States, driven by its semiconductor, aerospace, and defense manufacturing industries. These industries are supported by the state’s broader innovation ecosystem, with Los Alamos and Sandia National Laboratories conducting R&D activities in these areas. Other high-performing states also tend to be regions with some level of semiconductor manufacturing activity. Oregon (4 percent), Arizona (4 percent), and Texas (4 percent) record the next highest levels of high-tech exports.
Yet, a dependence on high-tech exports is also exposing regions to greater supply chain risks in the current turbulent geopolitical environment. As such, there have been efforts by the United States to reshore and friend-shore supply chains to allies in the OECD and EU, while the EU has made similar attempts, as its regions are much more exposed to non-EU and non-OECD exports.
Figure 12: Performance in high-tech exports[22]

Inward FDI
Why is this important? Inward FDI is critical to spurring domestic economic activity and facilitating technology transfer between foreign-owned enterprises and local establishments. Foreign firms may also introduce domestic firms to new international markets and help regions carve out positions in global supply chains. Inward FDI has also been associated with greater economic growth in market economies and tends to be more productive, inducing greater investment by domestic firms.[23] This indicator measures the inward FDI a region receives from a foreign-based entity to purchase, establish, or expand enterprises relative to the region’s GDP.
Figure 13: Inward FDI as a percentage of GDP, 2018–2025[24]
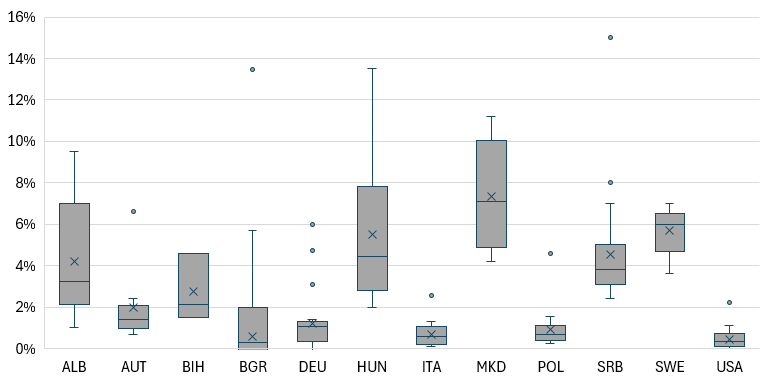
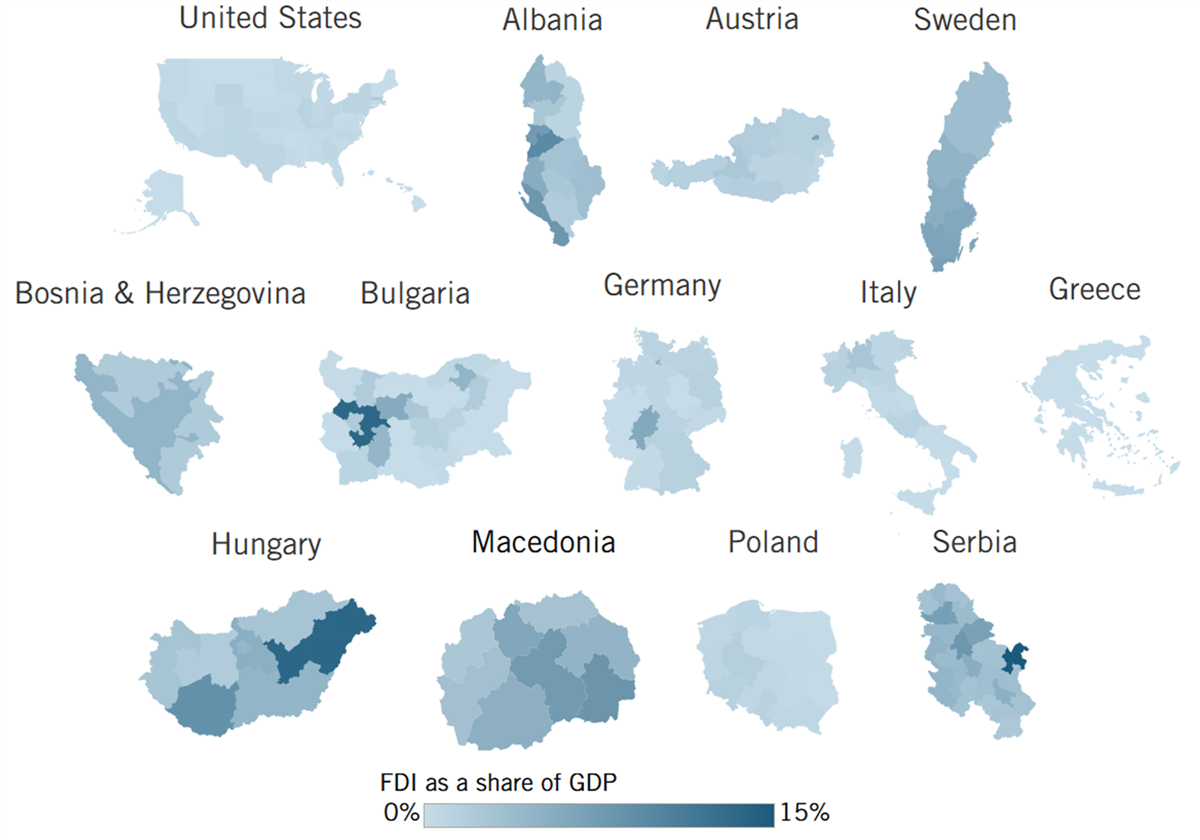
Several regions in the Western Balkans also perform well in this indicator. In Serbia and North Macedonia, regions bordering EU member states with strong manufacturing industries are the best performers, such as Bor (15 percent) and the Southeastern region of North Macedonia (11 percent). Regions with or near capital cities also perform well due to their greater concentration of knowledge economy workers and more developed infrastructure, including Tirana (10 percent), Skopje (9 percent), and Belgrade (8 percent). The Federation of Bosnia and Herzegovina, which includes the capital of Sarajevo, also scores highly at 5 percent. FDI has been a particularly strong area for the Western Balkan region, with FDI inflows reaching 6.4 percent of GDP in 2024, more than quadruple the EU average.[25]
More developed countries, such as Sweden, Germany, and Austria, occupy the middle of the distribution, exhibiting moderate, but well-distributed, levels of inward FDI. Sweden’s regions all fall between 4 and 7 percent, with South Sweden receiving the largest sum of FDI as a share of GDP. Germany has a few regions with relatively high inward FDI levels, including Hesse (6 percent) and Hamburg (5 percent), while most other regions cluster near 1 percent. While Austria’s leading region, Vienna, has an inward FDI level equal to 7 percent of GDP, most other regions cluster between 1 and 2 percent.
The United States and Italy record comparatively low inward FDI relative to GDP across most regions. Massachusetts (2 percent) is the best-performing region in the United States, while Italy’s Lombardy is the best region in the country, with FDI equal to about 3 percent of GDP. Inward FDI inflows for most other regions in the countries range between 0 and 1 percent of GDP.
Bulgaria and Hungary are unique in their wide range of inward FDI between subnational regions. In Bulgaria, Sofia Province leads with one of the highest FDI values in the Index (13 percent), while other regions such as Kardzhali and Pernik record effectively no inward FDI flows. Similarly, in Hungary, the Northern Great Plain region records high levels of inward FDI (14 percent), while regions such as Central Transdanubia and Northern Hungary show inflows of between 2 and 3 percent of GDP.
Figure 14: Performance in inward FDI[26]
Innovation Capacity
R&D Intensity
Why is this important? R&D expenditure constitutes a critical innovation input, as it measures the overall investment in new knowledge and the early stages of technological development within a region. While not all innovation is R&D based, R&D expenditure is highly correlated with innovation performance, as it reflects investments in advancing scientific and technological frontiers. Additionally, R&D investment has been positively correlated with the number of patent applications filed by a firm, the establishment and growth rate of start-ups, and the ability of a firm to export.[27] This indicator measures R&D expenditures by all funding sources (business, government, and higher education) in a region relative to its GDP.
Figure 15: R&D investment as a share of GDP, 2023–2024[28]
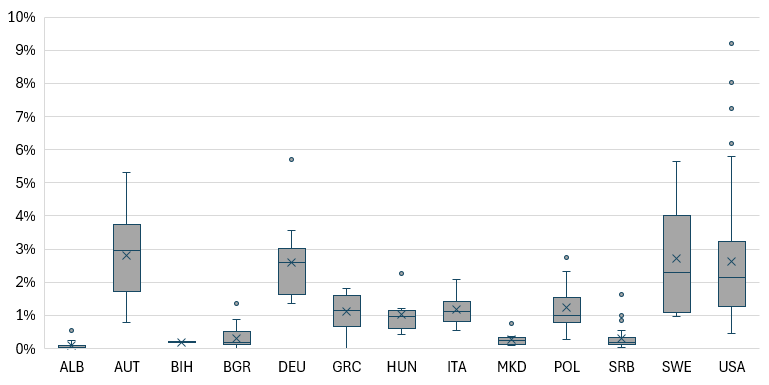
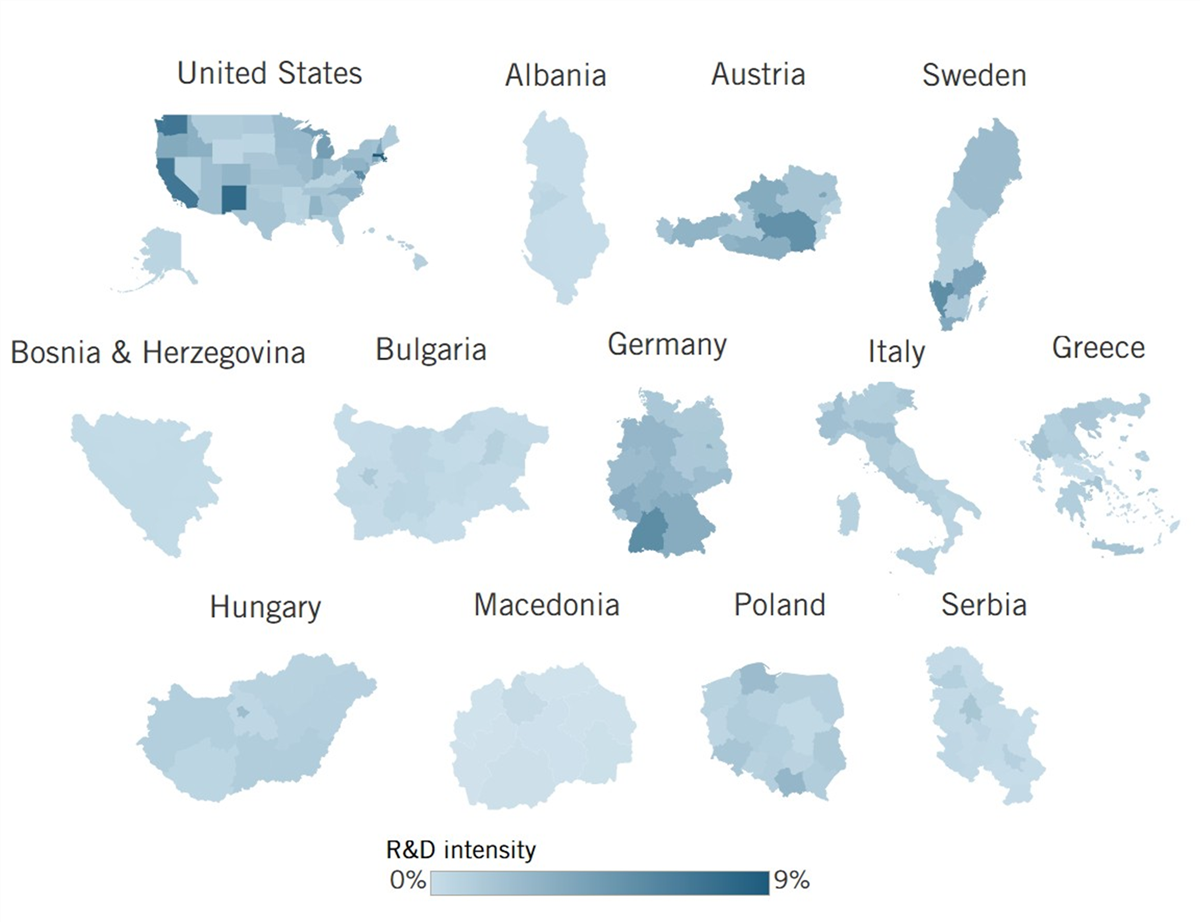
R&D intensity tends to concentrate in regions with strong manufacturing bases, many research universities, and technology hubs. The United States has several regions that emerge as world leaders in R&D intensity. Massachusetts leads all regions in the Index, with R&D expenditures equal to 9.2 percent of GDP, followed by New Mexico (8.0 percent), Washington (7.3 percent), California (7.2 percent), and Maryland (6.2 percent). European regions also perform strongly on this indicator, including Baden-Württemberg (5.7 percent), West Sweden (5.6 percent), and Styria (5.3 percent). Almost all of these regions invest in R&D at twice the OECD average, which stood at 2.7 percent in 2024.[29]
While the United States, Germany, Sweden, and Austria have high R&D investment outliers, they also exhibit relatively high median regional R&D intensity levels. Conversely, several countries in the Index rely heavily on a single or a few innovation centers to drive R&D investment nationwide. For example, Poland is led by the regions of Warszawski Stołeczny (2.8 percent) and Pomorskie (2.3 percent), while all other regions have R&D intensities less than 2 percent. Similarly, Hungary’s R&D investment activity is concentrated in Budapest (2.3 percent), while the median region invests about 1 percent.
The Balkan countries exhibit the lowest levels of R&D intensity in the Index, with regional R&D investment at less than 0.5 percent of GDP. For most of these countries, the national capital acts as the innovation hub and therefore has the highest levels of R&D investment, while other regions record little to no R&D activity. For example, Tirana records an R&D intensity of 0.6 percent, while six other regions in Albania have virtually no R&D activity. Belgrade leads Serbia with an R&D intensity of 1.6 percent, while nine regions have R&D intensities of 0.1 percent or less.
Broadly, rural regions or regions focused on nonadvanced industries have the lowest levels of R&D activity. As such, countries that are highly concentrated or reliant on these industries have the lowest levels of median national R&D intensity. Given that 183 of the 213 regions covered in this Index have an R&D intensity below the OECD average, the data clearly shows how important it is for European and U.S. regions to substantially boost their R&D investments if they want to become more competitive in the global innovation economy.
Figure 16: Performance in R&D intensity[30]
R&D Personnel
Why is this important? R&D personnel are important for conducting R&D activities and turning investments into productivity-enhancing knowledge and commercializable technologies. The R&D workforce also creates spillovers, because as workers move to other jobs, their frontier knowledge is applied beyond the research itself.[31] This indicator measures the number of R&D personnel as a share of each region’s total labor force.
Figure 17: R&D personnel as a share of total employees, 2023–2024[32]
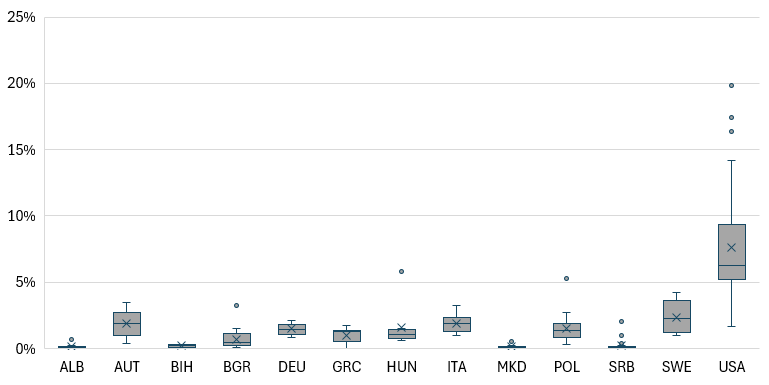
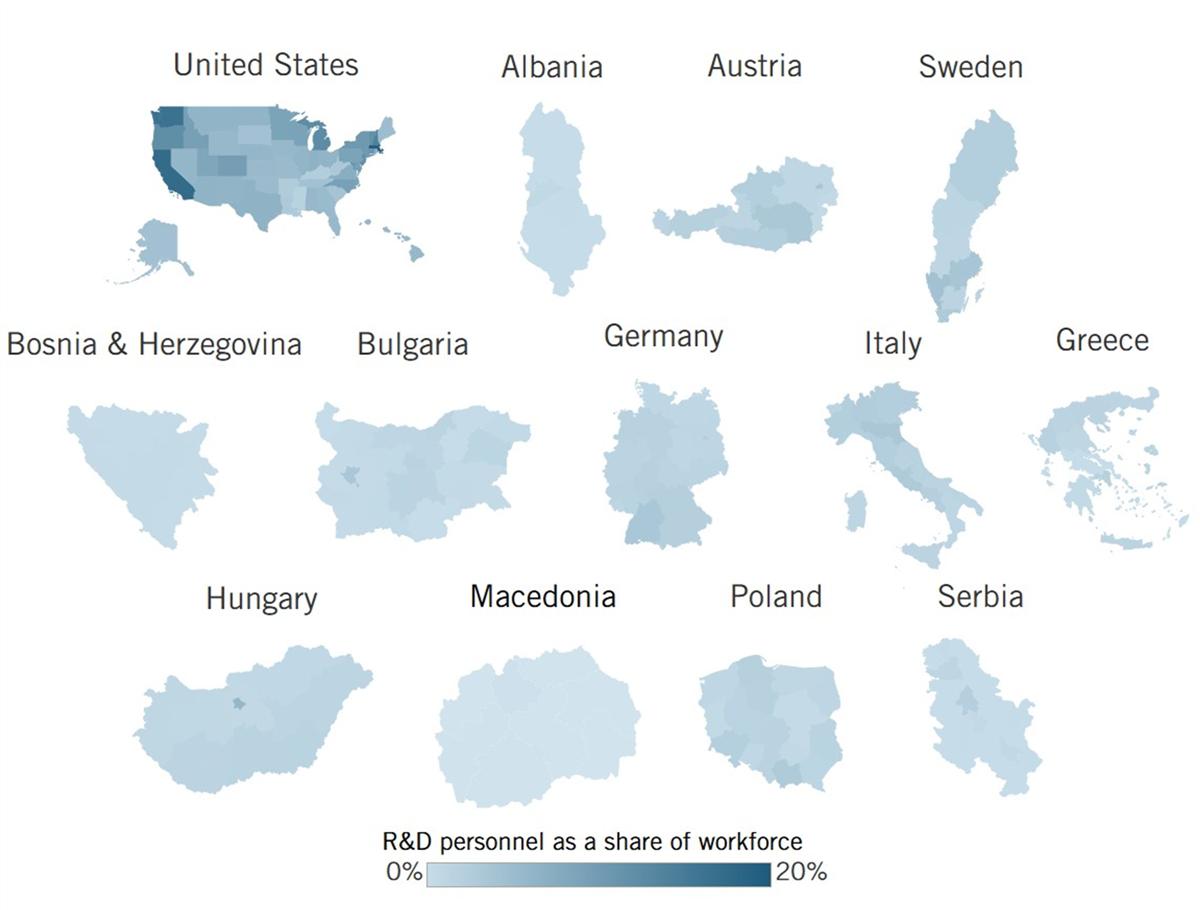
Employment of R&D personnel is highly concentrated in regions with high R&D intensity. However, unlike R&D intensity, the United States is the clear leader on this indicator, accounting for 31 of the top positions. Massachusetts leads all regions, with R&D personnel occupying 20 percent of the workforce, driven by the state’s strong biopharmaceutical industry. Massachusetts is then followed by California (17 percent), Washington (16 percent), and New Hampshire (14 percent). Several other states, including Michigan, Oregon, New Jersey, Vermont, and Connecticut, also report shares over 10 percent.
Outside the United States, Budapest leads Europe with 6 percent of its workforce dedicated to R&D, followed by Warszawski Stołeczny at 5 percent. Both of these regions align with the broader trend of capitals and major cities employing the greatest share of R&D personnel. Sweden’s Greater Metropolitan Region (4 percent), Vienna (3 percent), Baden-Württemberg (3 percent), Sofia City (3 percent), and Emilia-Romagna (3 percent) all stand out as leaders of research employment both in their respective countries and in Europe.
Germany and Italy stand out as two countries with multiple regions with at least 2 to 3 percent of employment devoted to R&D activities. In Germany, 5 of the 13 regions have R&D employment equal to at least 2 percent of the workforce, while in Italy, 12 of the country’s 20 regions have 2 percent of employment dedicated to R&D personnel.
The data also reveals a high concentration of R&D activities in metropolitan areas across many countries in Eastern and Southeastern Europe. Attica is the leading region in Greece with R&D personnel accounting for over 2 percent of the workforce, whereas more rural and island regions such as Central Greece, East Macedonia and Thrace, and the South Aegean have minimal R&D workforces. Similarly, Belgrade leads Serbia (2 percent), while 17 of the country’s 25 regions have R&D personnel who make up 0.1 percent of the workforce.
Figure 18: Performance in R&D personnel[33]
Venture Capital
Why is this important? VC is a form of business financing in which investors provide funds to early-stage companies in exchange for equity in those firms, making it a critical input to develop a strong and innovative start-up ecosystem. Given the considerable uncertainty regarding start-ups’ potential for success, VC investment entails higher risk than do other forms of investment. A region’s level of VC investment reflects both the innovativeness of its start-up ecosystem and the commitment of its firms to lead in crucial technologies such as AI, biotechnology, clean energy, advanced manufacturing, and robotics. This indicator measures a region’s total VC investment as a share of its GDP.
Figure 19: VC investment received as a percentage of GDP, 2022–2025[34]
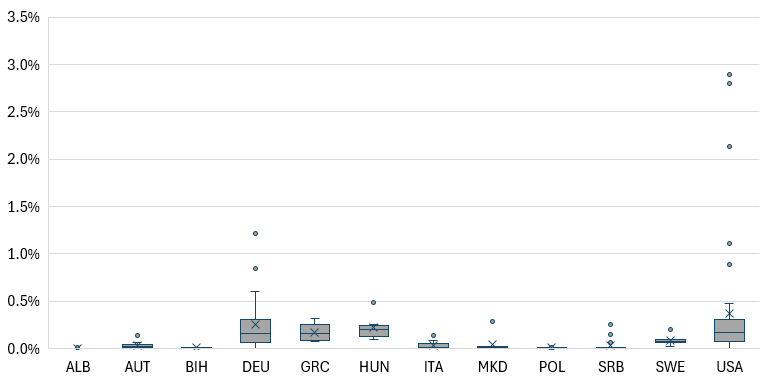
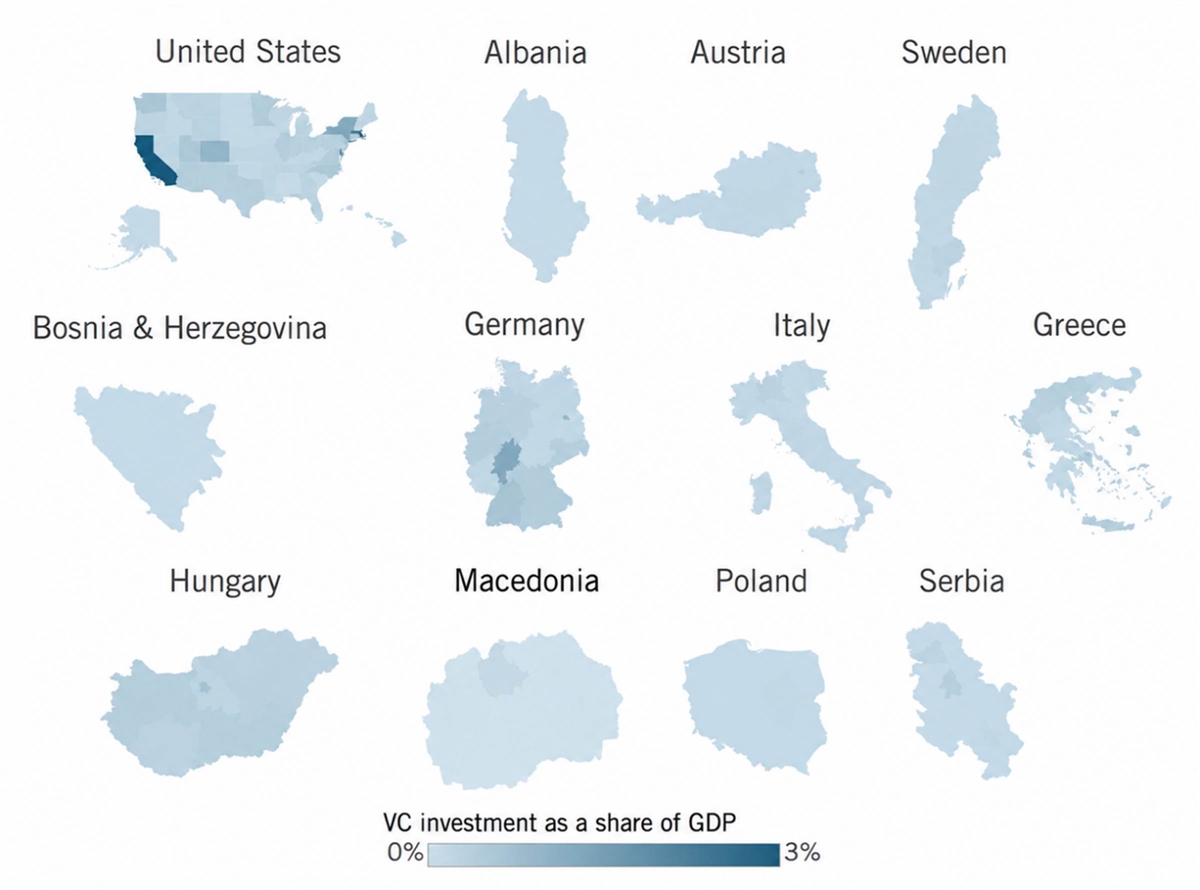
VC investment is highly concentrated in urban areas, even more so than other indicators. Even in countries with a broader distribution of innovation hubs, such as the United States, Germany, and Sweden, very few regions attract high levels of VC investment due to the unique combination of a strong entrepreneurial ecosystem, strong research institutions, high-growth firms, and the deep capital markets required to develop a successful VC environment. As such, the majority of subnational regions attract little to no VC investment, with 181 regions seeing investment equal to 0.5 percent of GDP or less.
Unsurprisingly, a small group of U.S. states leads the Index by a substantial margin, with VC investment equal to nearly 3 percent of GDP in California (2.9 percent) and Delaware (2.8 percent). Massachusetts (2.1 percent), Vermont (1.2 percent), New York (1.1 percent), and Colorado (0.9 percent) are also high-performing regions in the Index. In Europe, the German region of Hesse (1.2 percent) leads due to its status as a financial hub. Berlin and Brandenburg (0.6 percent) and Baden-Württemberg (0.5 percent) are also outliers, along with Budapest (0.5 percent). Given the high concentrations of advanced industries in these regions, including biotech, software, and advanced manufacturing, it is unsurprising that capital investment would cluster there.
Several countries in the Index report virtually no VC investment activity. In North Macedonia, only Skopje receives investment greater than 0.2 percent of GDP, while in Albania and Bosnia and Herzegovina, only Tirana and the Federation of Bosnia and Herzegovina receive any investment, at merely 0.02 and 0.01 percent of GDP, respectively. Poland also exhibits almost no VC activity, with the best-performing region, Mazowiecki Regionalny, at 0.04 percent.
VC activity in Bulgaria is highly concentrated in the capital, Sofia City, with few deals happening outside the region. Moreover, because effectively all VC funds in the country are located in Sofia, all VC activity is registered as occurring in Sofia. As such, data on Bulgaria’s VC activity is not included in the calculation of the overall Index score. However, it is worth noting that VC investment as a share of regional GDP in Sofia City was 0.32 percent in 2025.
Figure 20: Performance in VC investment[35]
Business Creation
Why is this important? Newcomer firms capable of challenging incumbents are essential for a business environment that rewards innovation and competitiveness. Start-up businesses often drive outside-the-box thinking in both established and emerging industries, accelerating the development of new technologies.[36] This indicator measures the share of a region’s business enterprises that were established over the previous year; however, this indicator is limited, as it does not capture business turnover, does not differentiate among industries with low or high knowledge intensity, and does not distinguish between subsistence-driven and competition-driven start-ups. Absent a better alternative at the cross-national regional level, this indicator reflects a region’s overall economic resilience and regional competitiveness.
Figure 21: Enterprise birth rate, 2021–2024[37]
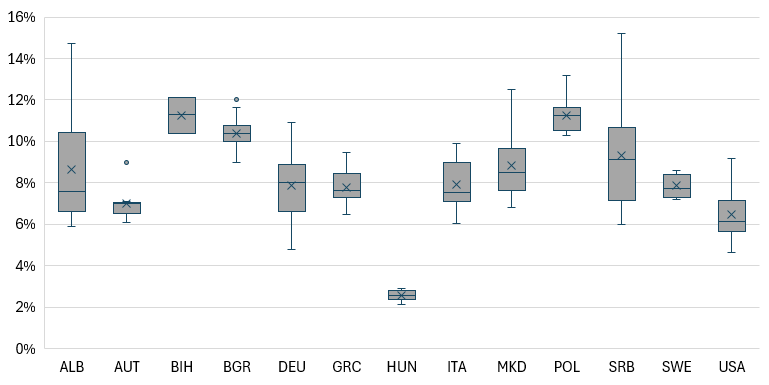
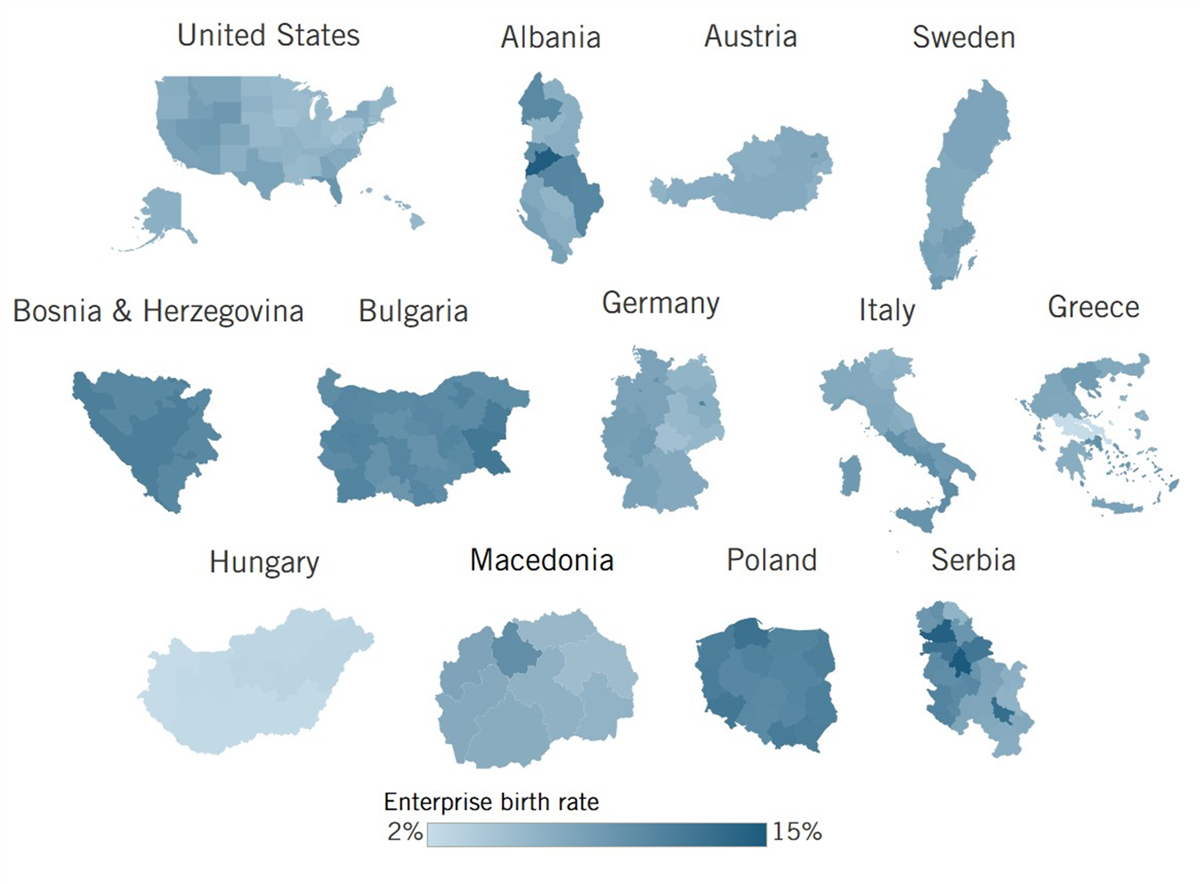
Enterprise birth rate is highly dispersed across subnational regions, with regions in the Western Balkans and Central Europe showing the strongest performances. The capitals of Belgrade and Tirana lead the Index with enterprise birth rates of 15 percent each, followed by South Bačka (14 percent) and Warszawski Stołeczny (13 percent). Skopje (13 percent) and the Brčko District (12 percent) also stand out with strong performances while leading North Macedonia and Bosnia and Herzegovina, respectively.
Poland and Bosnia and Herzegovina stand out as two countries with the highest median subnational enterprise birth rates, indicating that subnational business creation is not concentrated solely in the country’s high-performing urban areas. All of the regions in both countries post enterprise birth rates of 10 percent or greater, placing them in the top one-third of all regions in the Index.
Notably, regions that traditionally stand out as outliers in innovation indicators perform more moderately in enterprise birth rate. Germany, Sweden, Austria, Italy, Greece, and the United States occupy the middle of the distribution, with regions recording rates between 6 and 9 percent. Germany’s leading regions, including Berlin and Brandenburg, Saarland, Hamburg and Schleswig-Holstein, and Hesse reach about 9 to 10 percent, while all other German regions fall above 5 percent. Sweden’s regions are highly clustered between 7 and 9 percent, led by South Sweden, while Italy and Greece’s subnational regions have enterprise birth rates ranging from 6 to 10 percent.
The United States has a similar profile to other Western European countries. Though there are a few strong performers, including Florida, Wyoming, and Delaware (9 percent each), several U.S. states cluster near the bottom of the distribution, with states such as Connecticut, Minnesota, Wisconsin, and Ohio falling at about 5 percent.
Hungary stands out as an outlier on the low end of the distribution. Budapest, the best-performing region, records an enterprise birth rate of just under 3 percent, while all other regions sit between 2.1 percent and 2.9 percent.
Figure 22: Performance in business creation[38]
Patent Applications
Why is this important? A patent is an innovation output that protects or licenses an invention. Patents also secure private returns on investment in R&D activities, which are necessary to incentivize these activities and their socially desirable spillover effects. Patent applications per million inhabitants of a region measure the “inventiveness” of its residents. This indicator focuses on internationally filed patents under the Patent Cooperation Treaty (PCT) to mitigate differences in patent qualifications between countries’ patent offices.[39]
Figure 23: PCT patent applications per million residents, 2018–2025[40]
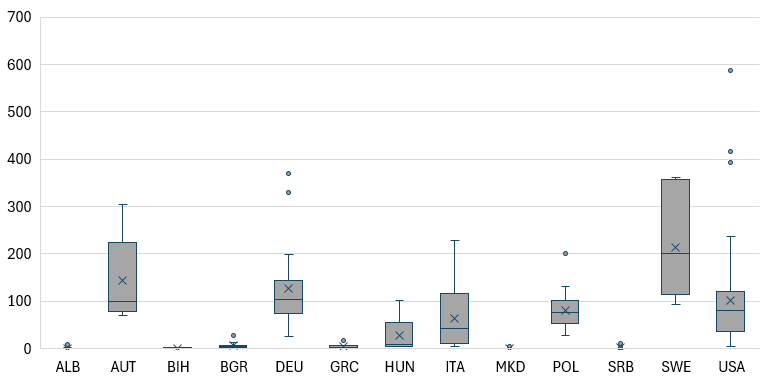
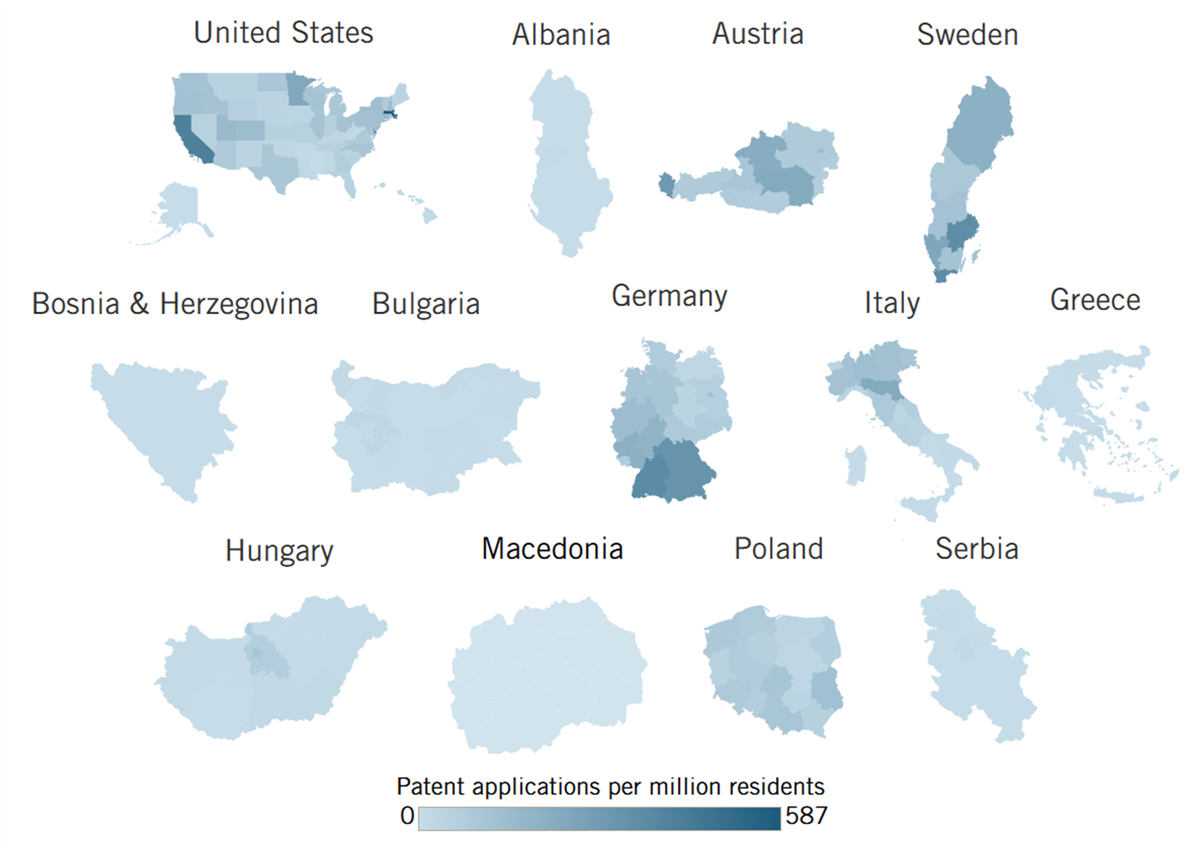
The highest levels of patenting activity are found in a small group of globally competitive and highly innovative regions. Massachusetts leads these regions with 587 patents per million residents, followed by California (416), Delaware (393), Baden-Württemberg (369), and Sweden’s Greater Metropolitan Region (361). Though the United States has some of the best-performing regions, it also has the widest range in performance on this variable. Several states, including Arkansas, Mississippi, and Alaska, report fewer than 20 patents per million residents.
Germany, Italy, and Poland are also characterized by a few strong outliers, while several other regions demonstrate weaker patenting performances. In Germany, Baden-Württemberg and Bavaria both report more than 300 patents per million residents, while Mecklenburg-Vorpommern reports just 26. Similarly, Italy and Poland are led by Emilia-Romagna and Warszawski Stołeczny, respectively, which each have over 200 patents per million residents, while several regions in each country have minimal patenting activity.
Conversely, several countries in the Index show high levels of patenting activity nationwide. Austria demonstrates this broad-based patenting ecosystem, with high-performing regions such as Vorarlberg (305) and Styria (230), while all other regions still exhibit fairly strong performance. For example, Burgenland, Austria’s worst-performing region, reports 69 patents per million residents. The same can be said for Sweden, which has strong outliers such as the Greater Metropolitan Region (361), South Sweden (357), and West Sweden (246), as well as several moderate performers, including Upper Norrland (201) and North Middle Sweden (119).
The Balkan countries of Albania, Bosnia and Herzegovina, Bulgaria, Greece, North Macedonia, and Serbia exhibit minimal patenting activity. Capital cities and regions in these countries perform the best, demonstrating their stronger innovation ecosystems relative to the rest of their nations, though their level of patenting activity is relatively small compared with the rest of the Index. Sofia City stands out as an outlier among these countries with 28 patents per million residents, more than any other Balkan region. The capital city of Bulgaria, Sofia, has benefited considerably from hosting most of the universities in the country, the Bulgarian Academy of Sciences (the only full-fledged technology park), and half of the business activity and patent offices in the country.[41]
Figure 24: Performance in patent applications[42]
Broadband Adoption
Why is this important? The Internet is now an essential public good for participation in today’s increasingly digitalized economy. Internet connectivity produces positive externalities for productivity improvements, economic growth, job creation, and per capita income growth.[43] In addition, broadband adoption can enhance innovation capabilities by expanding the market reach of potential customers, reducing transaction and information costs, and accelerating the product development process.[44] This indicator measures broadband adoption at the consumer level—that is, the share of households with broadband Internet connection availability (including satellite adoption).
Figure 25: Share of households that adopted broadband Internet, 2021–2025[45]
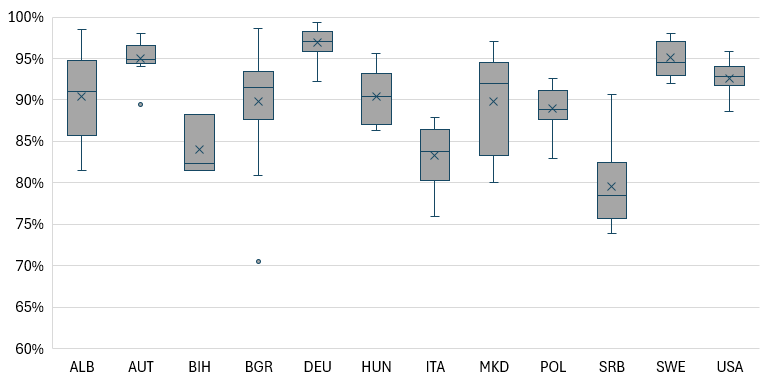
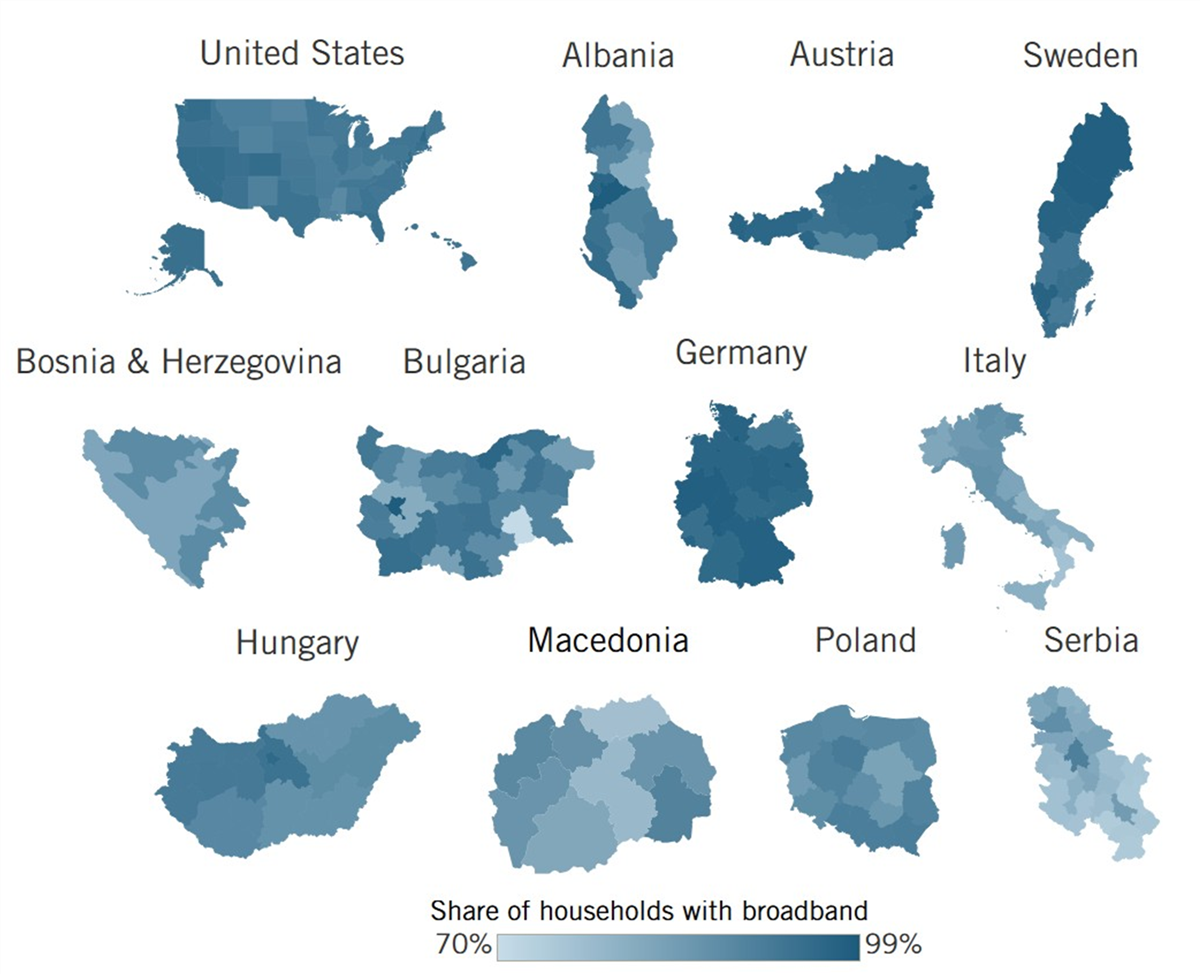
City-states account for the top-performing regions when it comes to broadband adoption, with Sofia City leading the Index (98.6 percent), followed by Tirana (98.5 percent), Hamburg and Schleswig-Holstein (98.3 percent), and Berlin and Brandenburg (98.3 percent). These regions benefit from small geographic areas and a stronger innovation ecosystem, driving a greater demand for Internet connectivity. Vienna and Upper Norrland also both perform well, with adoption rates above 98 percent.
Austria, Germany, Sweden, and the United States have generally higher broadband adoption levels than do other countries featured in the Index. All regions in Germany have broadband adoption rates above 92 percent, with most above 97 percent. The same trend is evident in Sweden, with all regions exhibiting broadband adoption rates exceeding 92 percent. The United States, which has the largest number of subnational regions among the countries in the Index, has one of the lowest levels of variability in broadband adoption across states. The broadband adoption rate in the top-performing region, New Hampshire (95.8 percent), is just 7.1 percentage points higher than in the worst-performing region, Mississippi (88.6 percent).
In Southeastern Europe, Bulgaria has the largest variability in broadband adoption in the Index, with over 28 percentage points separating the most- and least-connected regions. Outside Sofia City, the urban areas of Ruse and Blagoevgrad perform strongly, with broadband adoption rates exceeding 94 percent. Conversely, Yambol, a region dependent largely on agriculture and agribusiness, has the lowest connectivity at 70.5 percent.
In the Western Balkan countries of Albania, Bosnia and Herzegovina, North Macedonia, and Serbia, broadband adoption is relatively high by regional standards, supported in part by EU-backed digital connectivity initiatives that aim to improve cross-border integration, expand broadband infrastructure, and enable digital market integration. These initiatives, including the Western Balkans Investment Fund, have invested over €1 billion in increasing digital connectivity and broadband adoption across the region.[46] Indeed, these programs have been successful in bridging the digital divide, with broadband adoption across all regions in the Western Balkans exceeding 74 percent, and averaging 84 percent.
Figure 26: Performance in broadband adoption[47]
Carbon Efficiency
Why is this important? A region’s ability to innovate sustainably to achieve a reduction in and the efficient use of carbon and other greenhouse gases will determine its long-term competitiveness, as well as its economic prosperity. This indicator measures carbon dioxide (CO2) emissions per $10,000 of PPP-adjusted GDP. It is noted that more developed regions may have a slight advantage on this indicator due to their somewhat more service-oriented economies and their higher income to invest in higher-cost, low-emission capital.
Figure 27: Metric tons of CO2 emissions per $10,000 of PPP-adjusted GDP, 2018–2024[48]
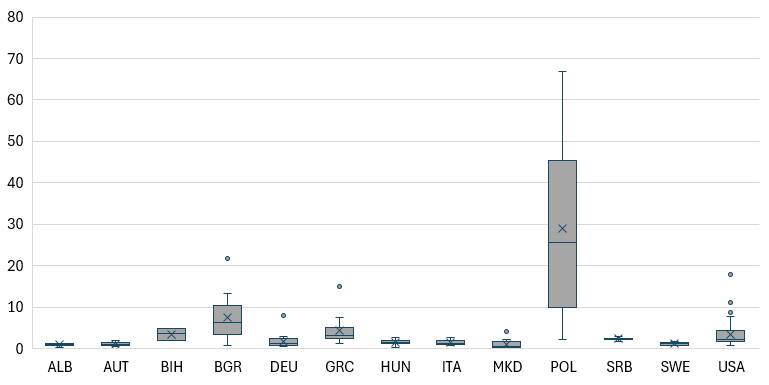
The top 10 most carbon-intensive regions in the Index are located in Poland. Leading the Index is Śląskie with an emissions intensity of 66.8, followed by Mazowiecki Regionalny (60.5), Kujawsko-Pomorskie (57.6), Lubelski (46.8), and Zachodniopmorskie (44.2). The high emissions intensity of these regions reflects the continued heavy reliance on solid fuels and fossil fuels for heating and electricity. However, not all regions in Poland are such heavy emitters. Lubuskie (7.8), Warszawski Stołeczny (6.2), and Podlaskie (2.2) have carbon intensities near or below the mean for the Index (5). Overall, Poland has the highest median regional emissions intensity in the Index, at 28.9.
Outside of Poland, Bulgaria, the United States, and Greece are home to some of the other most carbon-intensive regions. Sliven (22.2) and Kyustendil (21.8) in Bulgaria are two of the highest emitters of CO2 per $10,000 of GDP in the Index, followed by North Dakota (17.9), whose economy is heavily reliant on fossil fuel extraction, and West Macedonia (14.9), which has historically depended on lignite-fired power generation.
The United States exhibits one of the broadest regional distributions. Due to a heavy reliance on both drilling for and burning of fossil fuels, states such as Wyoming, Montana, and Mississippi report emissions intensities greater than 7 metric tons of CO2 per $10,000 of GDP. Conversely, the United States has some of the most carbon-efficient regions in the Index, including Hawaii (0.8), Massachusetts (0.8), and New York (0.7). These states have reduced their emissions intensities through concerted efforts to transition away from high-emission industries such as coal mining and toward lower-emission service industries.
Paradoxically, the best-performing regions on this indicator are either highly urban, metropolitan areas or rural, agriculture-based economies. For example, Northeastern and Eastern Macedonia have the lowest emission intensities in the Index (0.2), both of which are largely rural and dependent on agriculture and light manufacturing. Conversely, Sofia City (0.6), Sweden’s Greater Metropolitan Region (0.6), Vienna (0.4), and Budapest (0.3) are also among some of the lowest-emitting regions.
Figure 28: Performance in carbon efficiency[49]
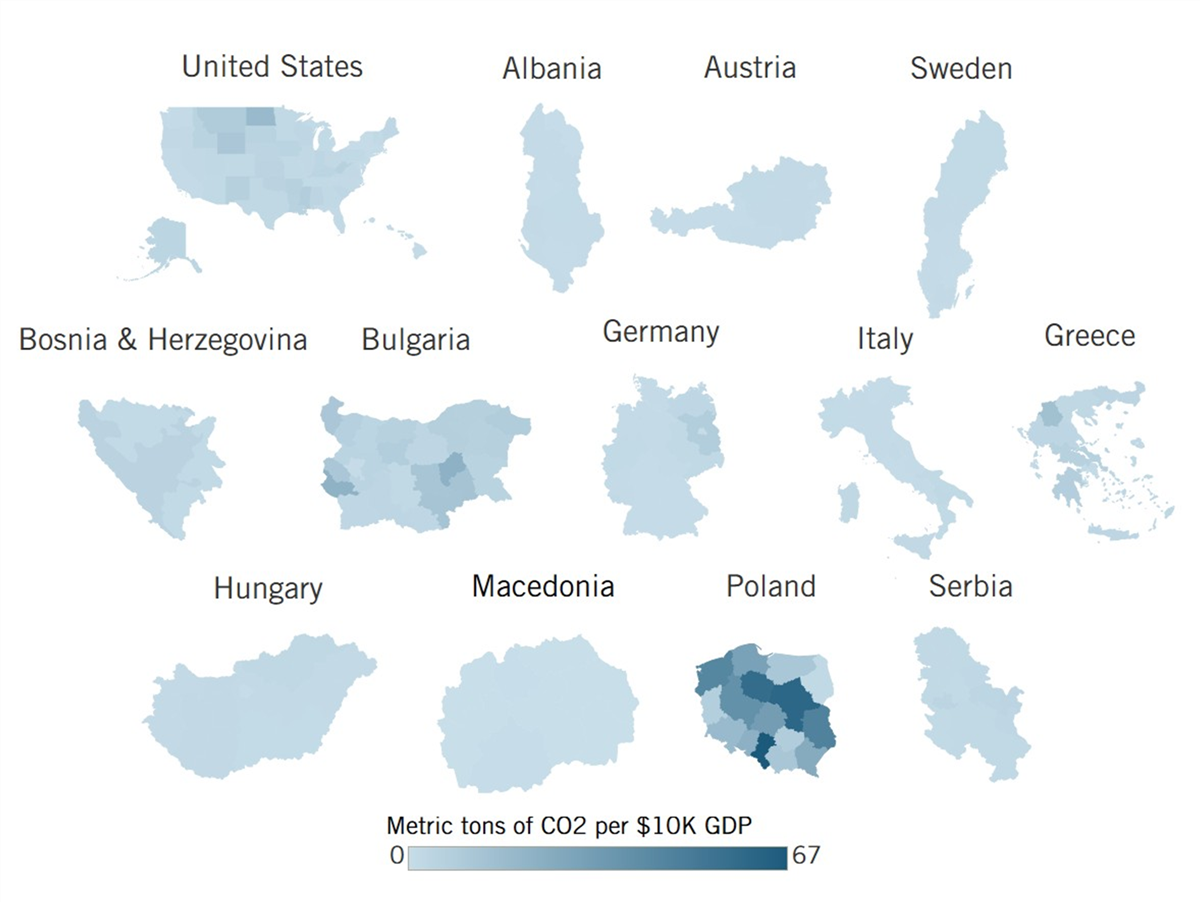
AI Preparedness
Why is this important? AI is the defining technology of this generation, with the power to substantially increase labor productivity, a necessity given the lackluster productivity growth in much of the OECD over the past decade.[50] However, the safe and effective implementation of AI in government and industry requires a well-thought-out strategy to ensure AI has the greatest positive impact on education, employment, and economic growth, while avoiding undue negative consequences. This indicator measures whether a region has implemented a regional AI strategy, be it through the creation of an AI working group, an advisory council, a whole-of-government adoption strategy, or another method. Regions are marked as “no” if there is a national AI strategy but not a regional one.
Figure 29: Performance in AI preparedness[51]
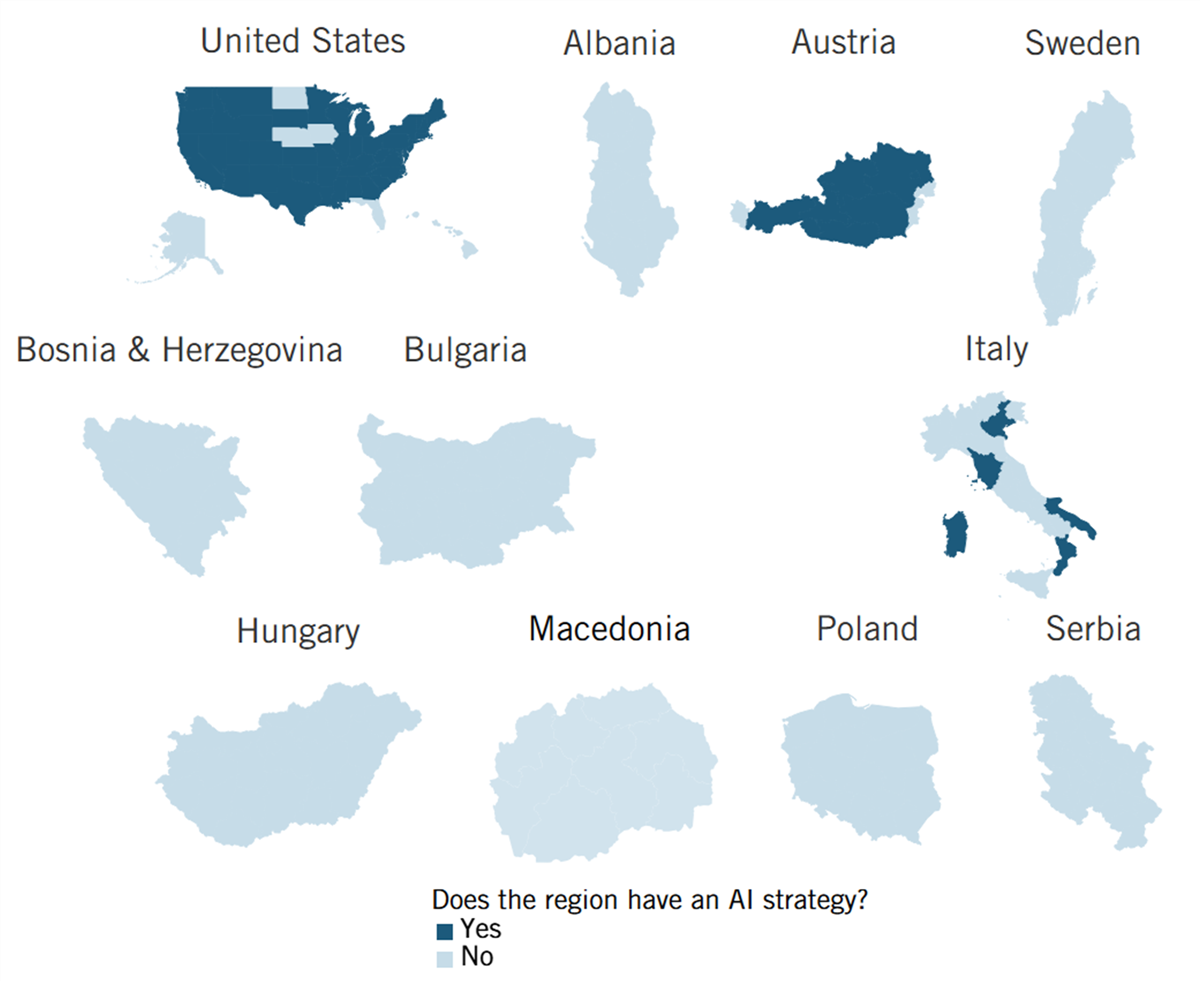
Several countries across the transatlantic have begun adopting their own AI strategies. These are not policies to restrict or regulate the use of AI, but rather to encourage the safe and effective adoption of it. However, few regions have implemented regional AI strategies. These regional strategies focus on the unique characteristics of a region, including its workforce, economy, major industries, and innovation ecosystem, when considering how AI may be most useful to the region. These strategies are multifaceted, with many including the creation of an AI advisory council to develop a roadmap for implementation in government and industry, while others include the creation of a research group to study the best use cases for AI adoption.
Only the regions in the United States, Austria, and Italy have implemented subnational AI strategies. In the United States, the majority of states have taken up these strategies, with just six states failing to do so: Alaska, Florida, Hawaii, Iowa, Nebraska, and North Dakota. In Italy, the share of regions that have implemented these strategies is smaller, with just Apulia, Calabria, Sardinia, Tuscany, and Veneto having developed strategies. In Austria, every region, excluding Burgenland and Vorarlberg, has developed a regional strategy.
Notably, several of the countries without regional AI strategies do have comprehensive national AI strategies. Sweden has implemented a comprehensive national AI strategy to position the country among global AI leaders.[52] Relatedly, Albania has developed a national AI roadmap, with a focus on deploying and developing AI technologies focused on sustainability and minimal energy consumption.[53] Greece has released its national AI strategy to foster digital transformation across public and private sectors, though subnational implementations remain decentralized.[54]
There are also unmistakable advancements in international collaboration that prove promising. Despite considerable differences in governance approaches to AI adoption, the EU seems poised to seek greater access to U.S. AI capabilities, as indicated by the accession of the EU and others to the U.S.’s Pax Silica initiative.
Policy Recommendations
Albania
Competitiveness Policy
Albania’s competitiveness policy is mainly framed through the Business and Investment Development Strategy 2021–2027, aligned with the National Plan for European Integration, the Economic Reform Program, the Common Regional Market Action Plan, and the European Union SME (small- to medium-sized enterprise) Strategy. This document largely responds to the findings of the Balkan SICI, as it focuses on SME development, export promotion, investment attraction, digital transition, and integration into regional and EU value chains.[55] However, the report shows that Albania’s competitiveness challenge is not only national but also strongly territorial: Tirana ranks fourth overall and Durrës ninth, while the five lowest-ranked regions in the whole Index are Albanian regions: Gjirokastër, Lezhë, Berat, Kukës and Dibër. The competitiveness policy of Albania to this end does not offer an adequate response, as it addresses the national competitiveness agenda, and it does not yet sufficiently differentiate support according to the severe subnational gaps in skills, productivity, high-tech exports, VC, and innovation capacity identified by the report.
Innovation Policy
Albania’s innovation policy is increasingly structured around the Smart Specialization Strategy, which positions innovation as a driver of economic growth, entrepreneurship, and EU alignment. This responds well to the report’s core finding that Albania has low-value-added sectors and lacks strong knowledge-based growth. The report finds that Tirana is Albania’s clear innovation pole, with the highest national performance in highly educated population; professional, scientific, and technical employment; patenting; enterprise creation; and broadband adoption, while most other regions remain weak in innovation inputs and outputs. To this end, the Smart Specialization Strategy as a policy framework has been instrumental, as it can identify priority domains where Albania has realistic economic and research potential. However, its response will remain incomplete unless it explicitly targets noncapital regions with weak R&D intensity, negligible VC penetration, and limited skilled labor attraction.
Regional Development Policy
Albania’s regional development framework is linked to the Law on Regional Development and Cohesion, approved in 2020, and to the National Strategy for Development and European Integration 2022–2030, which places territorial development within the wider sustainable development and EU integration agenda. The report shows one of the sharpest capital–periphery divides in the Index: Tirana and Durrës perform comparatively well, while northern, interior, and agricultural regions perform poorly. The policy response this policy framework provides is not effective, as it is more directed to cohesion and balanced regional development than provisioning measures of targeted support for knowledge workers, digital services, productivity upgrading, local enterprise growth, and sectoral specialization outside Tirana.
Recommendations
▪ Revise the Business and Investment Development Strategy and Smart Specialization Strategy to create a territorially targeted competitiveness package for the lowest-performing regions, especially Dibër, Kukës, Berat, Lezhë, and Gjirokastër. Add regional-level indicators for monitoring and evaluation of the strategies (on R&D expenditure, patents, VC, high-tech exports, PTS employment, and skilled migration.)
▪ Use the EU’s best-performing instruments to support innovation, such as regional innovation vouchers for SMEs, cofinancing for technology upgrading in agro-processing and light manufacturing, and export-readiness support outside Tirana and Durrës.
▪ Support stronger links between universities, vocational schools, and local firms through dedicated regional R&D, science, and technology parks.
▪ Set up a start-up fund for noncapital regions, with small grants for applied research, proof-of-concept projects, and local business accelerators.
Austria
To strengthen subnational innovation performance, Austria should replace subsidy-driven industrial policy with an economic framework based on private property, free prices, competition, and entrepreneurial discovery. Economically relevant knowledge is dispersed, local, and constantly changing; ministries and regional authorities therefore cannot reliably determine which technologies, firms, or industries will create future value. The state should concentrate on its core functions: legal certainty, contract enforcement, efficient administration, and sound public finances. Business subsidies, state guarantees, preferential loans, investment grants, and sector-specific tax privileges should be abolished. The resulting fiscal savings should finance broad and permanent tax reductions rather than new government programs.
Knowledge Economy
Austria should strengthen institutional competition and individual choice. Schools, universities, and vocational providers should receive greater autonomy over curricula, staffing, admissions, and cooperation with firms. Barriers to private education, alternative certification, company-based training, and new educational providers should be removed. Occupational licensing and recognition procedures should be radically simplified. The tax burden on labor should also be reduced, particularly for qualified employment, while skilled migrants and international graduates should be able to enter the Austrian labor market through fast, transparent, and rules-based procedures.
Globalization
Austria should pursue openness to trade, capital, technology, and skilled migration without subsidizing exporters or creating national champions. Foreign and domestic firms should operate under the same general rules. Restrictions on establishment, ownership, cross-border services, and investment should be eliminated wherever possible. Export competitiveness should result from productivity, specialization, and market-tested entrepreneurship—not from protection, public aid, or politically directed credit. Austria should also oppose bailouts and other measures that shield established firms from competition and prevent capital and labor from moving toward more productive uses.
Innovation Capacity
For innovation capacity, the central priorities should be lower taxes and comprehensive deregulation, rather than the current habit of “gold-plating” EU law. Corporate and personal income taxes, payroll charges, and taxes on capital formation should be reduced, while business investment should be fully and immediately deductible. Permitting, zoning, labor, energy, and environmental rules should be simplified through binding deadlines, automatic approval when authorities fail to decide, sunset clauses, and a strict regulatory budget. Regions should compete over tax burdens, administrative speed, and regulatory quality rather than coordinating additional interventions. State-owned commercial activities should be privatized or opened to genuine competition. Innovation will be strongest when entrepreneurs can experiment with their own capital, retain profits, bear losses, and reallocate resources without political permission.
Bosnia and Herzegovina
Bosnia and Herzegovina should prioritize the development of a coherent and integrated national innovation ecosystem that simultaneously strengthens knowledge creation, innovation capacity, and international connectivity. While the country possesses a relatively well-educated workforce and a solid academic base, these strengths are not sufficiently translated into research commercialization, high-value entrepreneurship, or technology-intensive economic growth due to fragmented governance, limited coordination, and weak linkages among universities, businesses, and public institutions.
Policy priorities should therefore focus on increasing investment in R&D, particularly by stimulating private-sector R&D through fiscal incentives, competitive funding schemes, and stronger university–industry collaboration. Particular attention should be given to expanding VC availability, supporting technology-based start-ups, and strengthening technology transfer offices, incubators, and innovation hubs capable of commercializing research results. At the same time, targeted measures are needed to attract and retain highly skilled professionals, reverse brain drain, and encourage skilled immigration, thereby enhancing the country’s human capital base.
Given the increasing importance of digital transformation, Bosnia and Herzegovina should accelerate broadband deployment, strengthen digital infrastructure, and adopt a comprehensive national AI Strategy aligned with European Union priorities. AI readiness should become an integral component of the national innovation policy, supporting both public sector modernization and business competitiveness. Furthermore, improving carbon efficiency should not be treated solely as an environmental objective but also as an opportunity to stimulate green innovation, sustainable entrepreneurship, and the development of circular economy business models.
Finally, stronger integration into global value chains should be pursued by attracting higher-quality FDI, increasing the share of high-technology exports, and promoting international research and innovation partnerships. A coordinated policy framework that combines investments in human capital, research excellence, entrepreneurship, digital transformation, and sustainability would significantly strengthen Bosnia and Herzegovina’s innovation ecosystem and improve its long-term competitiveness and resilience.
Bulgaria
The “Transatlantic Subnational Innovation Competitiveness Index 3.0” reveals a Bulgarian paradox. The country holds comparatively good positions on many of the indicators, yet 9 of the 10 least-productive manufacturing regions among all 213 regions surveyed are Bulgarian, with GVA per worker of $9,000 to $17,000 against $150,000+ in leading European regions. Rising inputs do not seem to be converting into productivity. This confirms the central warning of ARC Fund’s Innovation.bg 2025: labor productivity stands at just 9.7 percent of the EU average and human capital remains the economy’s Achilles’ heel of Bulgaria’s overall competitiveness performance.[56] Bulgaria is locked in a low-cost assembly equilibrium, and the gap between Sofia City (ranked 58th) and regions such as Haskovo (207th) is among the widest internal divides in the Index. Raising productivity, by upgrading what firms and people in every region do, must become the single organizing objective of Bulgarian innovation policy. To this end, there are several recommendations, which European and Bulgarian authorities could focus on:
To Bulgaria’s provinces (oblasti):
▪ Convert FDI presence into supplier upgrades. Regions already hosting export-oriented investors (Sofia Province, Burgas, Gabrovo, Plovdiv) should run structured supplier-development programs moving local firms from assembly and subcontracting toward design, testing, certification, embedded software, and after-sales engineering, following the MIT REAP Bulgaria and EC smart specialization models, with compact regional ecosystem teams (local government, universities, investors, firms) holding two-year implementation mandates rather than producing strategies.[57]
▪ Adopt regional AI and skills plans. No Bulgarian region has an AI adoption strategy, an indicator on which only U.S., Austrian, and Italian regions score. Regional plans should link the national AI factory (BRAIN++/INSAIT) and the National STEM Centre’s regional offices to local industry needs and close the 28-percentage-point regional broadband adoption gap (Yambol: 70.5 percent) that excludes lagging regions from the digital economy. Removing the very strong digitalization gap, which threatens to be further compounded by AI acceleration, should be a top priority for the Bulgarian and European authorities.
To the Bulgarian government:
▪ Adopt the “new social contract for innovation” called for in Innovation.bg 2025. This includes long-term goals to 2050, R&D investment of 1.5 percent+ of GDP by 2030, innovation prioritized in annual budgeting, and judicial and antitrust reform, the institutional weaknesses that suppress entrepreneurship and productivity.
▪ Sign the Pax Silica Declaration and anchor Bulgaria to transatlantic excellence. The U.S.-led Pax Silica initiative—the State Department’s flagship framework for securing AI stack supply chains, from critical minerals and energy inputs to semiconductors, advanced manufacturing, and compute—counts 24 signatories, including the EU, Germany, Greece, Sweden, Finland, and the Netherlands. Bulgarian accession would connect the country’s competitive pockets in microelectronics, batteries, industrial software, defense production, and spare energy capacity to allied co-investment and trusted-partner supply chains and would build on institutional bridges to U.S. excellence already in place through MIT REAP Bulgaria and other international partnerships.[58] Accession alongside neighboring Greece would strengthen the case for AI-infrastructure and data-center corridors in Southeast Europe.
▪ End the structural starvation of university science. Higher-education R&D has stagnated at 0.05 percent of GDP for 20 years, ranking last in the EU, and Bulgaria recorded the EU’s largest decline in academic R&D personnel since 2014. Competitive remuneration, Blue Card fast-tracks (work and residence permits for highly skilled non-EU professionals that offer fast visa processing, accelerated family reunification, and an expedited path to permanent residency), and openness to foreign researchers (currently near zero) are prerequisites for productivity growth.
▪ Shift FDI policy to value. The country should condition investment incentives on local R&D content, workforce upskilling, and supplier spillovers and translate the AI Concept 2030 into an operational national strategy with a governing body, funding stream, and regional action plans, including the regulatory framework for hyperscale data-center investment.
To the European Union:
▪ Apply a stronger subnational lens to cohesion and innovation instruments. EU funds drive most Bulgarian R&D growth and need to focus on linking the high-growth capital region with explicit regional-upgrading and productivity conditionality so that European strategic-autonomy investment in Bulgaria—for example, in defense production, microelectronics, batteries, industrial software—builds stronger overall national capability. As a Pax Silica signatory itself, the EU should actively support Bulgarian accession.
Germany
To strengthen subnational innovation performance, Germany should focus on the three structural pillars examined in this report: knowledge economy, globalization, and innovation capacity.[59]
Knowledge Economy
For the knowledge economy, the main priority is to strengthen human capital formation across the education system. This includes improving basic skills, expanding STEM education, and facilitating smoother transitions from school to vocational training and higher education. Higher education institutions should also play a stronger role as regional anchors for entrepreneurship, applied research, continuing education, and cooperation with local firms, especially outside the strongest metropolitan regions.
Early childhood education should be strengthened, high-quality full-day programs expanded, language and reading support intensified, and additional funding—differentiated based on a social index—made available for the individual support of children and adolescents. Ensuring the availability of STEM teachers is also particularly important for promoting STEM education. In terms of both research spending and patent applications at universities, Germany lags significantly behind its strongest competitors. If we take these countries as a benchmark, research spending at universities would need to be increased by approximately 0.3 to 0.4 percentage points of GDP. It would therefore make sense to expand research spending at universities, particularly in the areas of AI, digitalization, and climate protection.
Globalization
For globalization, Germany should both strengthen its international talent base and expand its high-tech export capacity. Recent analyses show that the German export model has come under increasing pressure and that export growth has weakened markedly in recent years. Policy should therefore support the diversification and upgrading of export-oriented industries, particularly in technologically sophisticated sectors where Germany still holds strong positions in world markets.
At the same time, improving skilled immigration pathways, reducing barriers in recognition procedures, and attracting and retaining more international students would strengthen the supply of highly qualified labor needed for innovation and export competitiveness. International talent can directly reinforce regional innovation ecosystems, especially where firms and research institutions depend on scarce high-level skills.
Innovation Capacity
For innovation capacity, Germany should strengthen the links between research, higher education, and business transformation. The simultaneous pressures of demography, digitalization, decarbonization, and deglobalization increase the need for targeted investment in research, knowledge transfer, spin-offs, and upskilling in transformation-relevant fields. A more regionally differentiated approach would help build on existing industrial strengths while broadening innovation capacity beyond the leading regions.
The measures announced in the federal government’s coalition agreement are to be viewed favorably. With regard to digitalization, the agreement states, “We support technology transfer from universities to the business sector, and from start-ups to established companies.”[60] The transfer from universities is to be accelerated and expanded, and universities of applied sciences are to be given greater consideration in funding programs. The federal government also aims to “enable spin-offs within 24 hours and, to this end, introduce standardized spin-off agreements at universities and research institutions that are binding and, in particular, allow for the granting of intellectual property rights in exchange for a market-standard share.”[61]
In addition, spending on R&D is to be increased to 3.5 percent of GDP. In this context, greater tax incentives for corporate research spending and an expansion of the budgets of public research institutions would be advisable.
Greece
The findings from the report reveal that Greece faces a clear structural bottleneck: while human capital inputs—such as tertiary education graduates—remain competitive in several regions, the conversion of that capital into commercialized technology, patents, high-tech exports, and VC investments remains severely lagging. To overcome this gap and enhance regional competitiveness, national and regional policymakers should pursue five interconnected policy strategies.
First, Greece must actively work to deconcentrate its subnational R&D ecosystem away from Attica and Central Macedonia. By leveraging the National Smart Specialization Strategy and its attached EU Cohesion funds, the state should build regional technology transfer offices and specialized innovation parks around prominent noncapital universities, such as the University of Crete, the University of Patras in West Greece, and the Democritus University of Thrace.
Second, policymakers must create direct mechanisms to translate high tertiary educational attainment into high-tech production and international trade. Regions with solid workforce fundamentals such as Central Greece should be bolstered with export accelerators, business incubator tax incentives, and targeted R&D co-funding for local firms that file PCT patents or produce high-value-added manufactured goods.
Third, Greece should pioneer regional AI implementation plans tailored to localized economic strengths. Moving beyond its overarching national framework, regional authorities in Attica and Central Macedonia should establish local AI advisory bodies to deploy technologies across key sectors, such as digitalizing maritime supply chains in port cities, deploying smart agriculture tools in Thessaly, and automating seasonal service infrastructure in the Aegean islands.
Fourth, targeted industrial policy must support regions undergoing structural decarbonization, most notably West Macedonia. As the region phases out lignite power generation, Just Transition Mechanism funding should be heavily channeled into green hydrogen, renewable energy storage testing, and clean manufacturing ecosystems, effectively turning a carbon-efficiency liability into an advanced clean-tech asset.
Fifth, national financial institutions should deepen subnational VC coverage and effectively transform Greece into an entrepreneurial state. By building on success and lessons learned from national fund-of-funds initiatives such as the Hellenic Development Bank of Investments and leveraging regional programs in the context of the National Smart Specialization Strategy, policymakers should establish coinvestment facilities that require a portion of capital deployment to be directed toward early-stage university spin-offs and start-ups based outside the primary Attica basin.
Hungary
The Hungarian findings indicate a dual spatial pattern, with Budapest ranked 25th on the strength of the Index’s highest tertiary education attainment (59 percent) and Europe’s largest share of R&D personnel in total employment (6 percent), well above the country’s other seven regions, which fall between 96th and 150th place. While the globalization ranking of the Hungarian regions is high, with 7 of them making the top 15 in terms of global exposure, it is largely driven by foreign investment in assembly production for the automotive, battery, and electronics industries rather than by homegrown innovation—and at the same time, the country displays the lowest enterprise dynamism of all countries in the Index, with no region reaching a 3 percent enterprise birth rate. In order to switch from an assembly-oriented to an innovation-driven growth model, Hungarian policymakers should pursue the following policy recommendations.[62]
▪ Support cooperation between academia and business. The country’s competitive advantages, for example, in mathematics and IT skills, should be leveraged, and higher education, particularly in STEM subjects, where Hungary has traditionally excelled, should be further strengthened. Connections between academic and publicly funded research institutions and industry should be solidified through the establishment of internationally proven technology transfer models.[63] Universities and publicly funded research institutes should be supported in developing university and academic spin-offs through the establishment of incubators/accelerators.
▪ Rebuild business dynamism. Enterprise birth rates in Hungary, which range between 2.1 and 2.9 percent, are the lowest of all countries in the Index and indicate an environment where few new companies are formed to take on incumbents. Therefore, the administration related to business formation and taxation, particularly for technology start-ups, is to be fundamentally simplified. Similarly, procedures for protecting intellectual property are to be simplified, and pre-commercial procurement (based on proven models from the United States, such as the Small Business Innovation Research [SBIR] program) is to be introduced, in which innovative small businesses are provided with a separate budget for competitive tenders within the framework of public procurement procedures.
▪ Tie investment subsidies to R&D and local knowledge content. Hungary is known for offering some of the highest per-job cash incentives in the EU to foreign investors’ manufacturing ventures within the framework of the Individual Government Decision subsidy scheme, which most recently included the electric vehicle (EV) and battery assembly factories of the Northern Great Plain region, where inward FDI accounts for 13.5 percent of regional GDP.[64] Making any future subsidies contingent upon commitments to develop local R&D facilities and engineering centers would ensure that these investments result in regional innovation rather than merely in a larger workforce at assembly factories.
▪ Let private VC lead. Outside Budapest, where VC investment reaches just 0.5 percent of GDP, VC activity is virtually nonexistent, and state-supported funds remain the main players in the domestic market to a degree that distorts deal selection and pricing. Redirecting public money into fund-of-funds vehicles that require private lead investors would improve the quality of investment decisions and crowd in, rather than crowd out, private capital.[65]
▪ Introduce tax relief both for VC firms and start-ups. Ensure that start-ups have access to sufficient funding at every stage of their life cycle, from ideation and business model development to internationalization and entry into global markets. Strengthen VC firms by providing significant tax advantages on their investments. At the same time, reduce the tax burdens for start-ups, give greater consideration to their R&D costs, introduce increased R&D funding, and grant start-ups preferential tax treatment for income from intellectual property contributions or tax breaks for patent revenue.
▪ Decentralize R&D and adopt regional AI strategies. R&D investment remains focused on Budapest (2.3 percent of GDP), whereas the median region spends around 1 percent of its GDP, and none of the Hungarian regions has yet developed a regional AI strategy.[66] Competitive long-term block grants for university–industry innovation centers in Debrecen, Szeged, Miskolc, Győr, and Pécs, allocated through independent peer review and paired with regional AI adoption programs for SMEs, could help distribute innovation potential beyond the capital city.
Italy
The results of the “Transatlantic Subnational Innovation Competitiveness Index 3.0” report reveal an Italian regional system with important industrial and scientific assets, but also with pronounced territorial disparities and structural weaknesses that limit its overall innovation potential.
Knowledge Economy
Italian regional policies should place the expansion of human capital at the center of their competitiveness strategies. Regions should therefore establish measurable medium-term targets for increasing tertiary attainment, differentiated according to their starting conditions but consistent with a common national ambition. Regional resources for education, cohesion, and industrial policy should be used to reduce university dropout rates, enlarge access to tertiary education, and strengthen the connection between academic programs and regional economic specializations. Scholarships, affordable student accommodations, and mobility grants should be expanded, particularly for students from low-income families and peripheral areas. Particular attention should be paid to STEM disciplines, but also to economics, management, and other fields that provide the complementary skills necessary for the organizational adoption of new technologies.
Increasing the number of graduates will not be sufficient unless regions also retain them. Regional governments should create integrated graduate-retention programs combining internships, industrial doctorates, support for innovative entrepreneurship, and incentives for firms hiring highly qualified young workers. Universities should be encouraged to monitor graduates’ employment outcomes and cooperate with employers in updating curricula, while regional funding for vocational and managerial training should increasingly be linked to independently assessed labor-market needs.
Skilled immigration represents an equally important and underused source of human capital. The share of the regional population that is both foreign born and tertiary educated is around 2 percent, even in the best-performing Italian regions. It reaches 2.11 percent in Emilia-Romagna, 1.86 percent in Lazio, 1.77 percent in Lombardy, and 1.68 percent in Tuscany, while remaining below 0.6 percent in much of Southern Italy. Although migration and entry rules are primarily national responsibilities, regions can substantially influence whether international students, researchers, entrepreneurs, and specialized workers decide to settle and remain locally. Each region should establish a talent-attraction office acting as a single point of contact for foreign workers and firms. Its functions should include assistance with administrative procedures, recognition of qualifications, housing, language training, family integration, and connections with employers. Regional universities should be supported in attracting more international students and researchers, including through English-language programs and scholarships linked to priority sectors, while graduates should receive assistance in moving from study to employment or entrepreneurship.
Finally, regions should increase employment in professional, scientific, and technical activities, mostly by encouraging the growth of engineering, software, data analytics, design, cybersecurity, and research services, which can diffuse innovation across the wider economy and help manufacturing SMEs move toward higher-value activities.
Globalization
Italian regions display significant export capacity, but participation in high-technology trade is highly concentrated. Regional industrial policies (in combination with national-level ones) should aim not simply to increase exports in general, but to raise the technological content and domestic value added of exported goods and services.
Export promotion should consequently be more closely connected to innovation and investment policies. Regions should identify a limited number of existing or potentially competitive technological specializations and build integrated programs around them, combining R&D investment, skills, internationalization, and access to finance. Support should prioritize firms entering new markets, participating in European and global supply chains, adopting international standards, or developing proprietary technology rather than subsidizing activities that firms would undertake in any case. Cooperation among neighboring regions should be encouraged wherever industrial ecosystems cross administrative boundaries.
Inward FDI is also strongly concentrated. Lombardy’s amounts to approximately 2.5 percent of regional GDP, more than twice the level of most other leading Italian regions, while several southern regions attract inflows equivalent to 0.2 percent of GDP or less. Every region should adopt a proactive and specialized investment-attraction strategy, replacing generic territorial promotion with targeted propositions based on specific technological and industrial assets. Regional development and investment agencies should develop inventories of available industrial sites, skills, research facilities, supply chains, and authorization requirements. They should not only identify international companies whose activities complement regional clusters, but also offer coordinated support covering permits, workforce recruitment, partnerships with universities, and access to existing incentives. Particular priority should be given to investments that establish R&D centers, advanced production facilities, or meaningful relationships with local suppliers, rather than projects whose contributions are limited to real estate or low-value employment.
Investment incentives should be conditional on transparent and measurable commitments concerning technological intensity, skilled employment, training, R&D, and local supply-chain integration. Regions should also devote more attention to aftercare: once an international company has invested, dedicated teams should help it expand, collaborate with local firms, and overcome administrative obstacles.
Innovation Capacity
Italian regions must substantially increase both public and private expenditure on R&D. Only Emilia-Romagna and Piedmont record R&D intensity slightly above 2 percent of GDP, while the weakest performers spend little more than 0.5–0.6 percent of GDP. This gap affects not only the production of knowledge but also the ability of firms to absorb technologies developed elsewhere.
Public support should increasingly rely on competitive calls, independent evaluation, and clear indicators concerning additionality, collaboration, and commercialization. Funding should favor collaborative projects involving firms, universities, and research organizations while avoiding excessive fragmentation across numerous small initiatives. Where regions lack the scale to develop autonomous research capabilities in every field, they should specialize and participate in interregional platforms and European programs.
A larger share of regional resources should support technology transfer. Universities and public research institutes need stronger incentives to work with businesses, create spin-offs, license intellectual property, and share research infrastructure. Regional technology-transfer offices could provide common services—patent expertise, proof-of-concept funding, market validation, and entrepreneurial support—to institutions that individually lack sufficient capacity. Industrial doctorates and researcher mobility between universities and firms should become standard components of regional innovation strategies.
VC is another critical weakness. Lombardy has the largest regional market, but VC received still represents only around 0.14 percent of GDP. Regions should avoid attempting to replace private investors with politically managed funds. Their role should instead be to reduce early-stage risk, crowd in professional capital, and create a stronger pipeline of investable companies. Regional funds should be managed by independent investment professionals and structured on market-oriented terms, preferably through coinvestment arrangements with private operators. Public intervention should address identifiable gaps, such as seed funding, university spin-offs, and the transition from early-stage financing to scale-up capital. Programs should also help start-ups reach investors outside their region and outside Italy, since a successful ecosystem cannot depend exclusively on locally available capital. Procurement, regulatory experimentation, and access to corporate customers can be as important as direct financial support in helping innovative firms grow.
Regional innovation policies should finally address the marked disparities in patenting and research employment. Emilia-Romagna records more than 229 international patent applications per million residents, compared with fewer than 15 in many southern regions. It also has the country’s highest share of R&D personnel, at 3.25 percent of employment. Regions with weaker results should not seek to reproduce the leading regions mechanically. They should concentrate resources on a smaller number of sectors where universities, firms, and local capabilities provide credible foundations for specialization, while ensuring that successful projects can subsequently access national and European markets and finance.
Regional Artificial Intelligence Laws and Strategies
The Index separately assesses AI preparedness according to whether a region has adopted an AI policy or strategy, reflecting the growing importance of AI integration for future productivity, development, and innovation. Yet, the data indicates that only five Italian regions—Apulia, Calabria, Sardinia, Tuscany, and Veneto—currently have a recognizable regional AI strategy or legislative initiative. All Italian regions should adopt an ad hoc AI law, or a similarly binding and adequately funded strategy, coordinated with national and EU rules but focused on the policy responsibilities that lie within regional competence.
These regional frameworks should not primarily create new regulatory obligations. Their central objective should be to accelerate adoption, particularly among SMEs. Italian regions are uniquely positioned to address this challenge. They already manage significant financial resources devoted to industrial policy, vocational training, innovation, and regional development. These tools should be reorganized around a coherent AI-adoption pathway. Firms should first receive access to subsidized digital and AI maturity assessments, followed by support for feasibility studies, proof-of-concept projects, and full deployment. AI vouchers could finance technology assessments, cloud and computing services, data preparation, cybersecurity, and integration with business processes, provided that beneficiaries define measurable productivity or quality objectives.
Regional AI strategies should also strengthen the role of European Digital Innovation Hubs, Competence Centers, and universities as local intermediaries capable of accompanying firms throughout their AI adoption journey—from awareness and experimentation to full-scale deployment.
In this respect, training must be an integral component rather than a separate policy stream. Regional programs should cover not only advanced specialists but also managers, technicians, and workers whose capacity to reorganize production processes will determine whether AI generates real productivity gains. Funding should therefore be conditional on organizational change, worker involvement, and the evaluation of results. Common national guidelines and interoperable monitoring indicators would prevent unnecessary fragmentation while still allowing each region to tailor instruments to its industrial structure.
The ultimate test of a regional AI law should not be the number of initiatives launched, but the increase in firms using AI effectively and the productivity improvements they achieve.
North Macedonia
Competitiveness Policy
North Macedonia’s competitiveness policy is primarily framed by the Industrial Strategy 2018–2027, which aims to increase manufacturing productivity, strengthen industrial competitiveness, support SMEs, improve export capacity, and encourage industrial modernization. This policy document does not distinguish between regions or have a territorial development focus, resulting in variable performances across regions. Skopje ranks third overall and the Southeastern region eighth, while the Northeastern region ranks lowest within the country. The report also finds that, driven by FDI policy, which is very much regionally determined, North Macedonia performs strongly in globalization indicators, particularly high-tech exports in selected regions. However, the low manufacturing labor productivity and weak innovation capacity outside Skopje remain a problem. The Industrial Strategy, to this end, needs stronger regional targeting and a clearer focus on innovation, R&D personnel, and productivity enhancement, especially in regions where industrial activity exists but value added remains low.
Innovation Policy
North Macedonia’s current innovation framework is the Smart Specialization Strategy 2024–2027, adopted in December 2023, with priority domains including smart agriculture and food with higher value added, information and communications technology (ICT), Industry 4.0, and sustainable materials, with energy and tourism as horizontal priorities. This responds well to the report’s finding that North Macedonia has identifiable sectoral and regional strengths but weak R&D depth and heavy concentration of innovation activity in Skopje. The report shows that Skopje leads the country in education, PTS employment, R&D, patents, and VC, while several regions have low innovation capacity despite export or manufacturing potential. The Smart Specialization Strategy is therefore the right policy instrument, but it must be implemented as a regional innovation policy, not only as a sectoral strategy, by linking priority domains to the specific strengths of Skopje, Pelagonia, Polog, and Eastern, and utilizing existing university-linked infrastructure: Business Accelerator UKIM in Skopje can function as the national start-up and technology-commercialization hub; SEEU TechPark/Business and Innovation Center in Tetovo can serve as the Polog innovation node; Goce Delčev University in Štip can anchor an Eastern/Southeastern innovation node; and St. Kliment Ohridski University–Bitola (UKLO) can support a Pelagonia innovation node, particularly through its technical, ICT, engineering, tourism, food, and applied research capacities.
Regional Development Policy
North Macedonia’s regional development policy is regulated by the Strategy for Regional Development 2021–2031 and is reinforced by the National Development Strategy 2024–2044. The regional development framework is particularly relevant because, as the report shows, a large gap exists between Skopje and the rest of the country. The report also identifies noncapital potential, especially in selected manufacturing/export-oriented regions. Existing regional development policy focuses on balanced development, rational use of regional resources, and improved living standards, but it does not yet sufficiently integrate innovation indicators such as R&D personnel, high-tech exports, patenting, VC, and skilled migration. To respond to the report’s findings, regional development policy should become more innovation sensitive and should finance region-specific productivity and technology upgrading, not just infrastructure and general local development.
Recommendations
▪ Integrate the Smart Specialization Strategy, Industrial Strategy, and Regional Development Strategy into one operational pipeline of regional innovation projects.
▪ Support Skopje as the national R&D and start-up hub, but direct public funding to other regions through university–industry consortia, applied research centers, and regional technology extension services.
▪ The Southeastern region’s reported high export performance, especially in terms of food processing, should be supported through export upgrading, supplier development across the country, and domestic firm innovation.
▪ Strengthen domestic productive capacity and avoid overreliance on assumed FDI effects. The Southeastern region should serve as an example of competitiveness without greenfield investments and public policy support.
▪ Pelagonia should receive green industrial transition support due to its carbon-intensive energy profile, while Polog, Vardar, and Eastern regions should be targeted for SME digitalization, skilled workforce retention, and applied innovation in food, logistics, manufacturing, and tourism.
▪ Future monitoring of FDI and regional development funds should include innovation indicators.
Poland
Poland’s innovation weakness stems not from a shortage of educated people, but from a systemic failure to convert human capital into economic value. The Index shows Poland’s knowledge-economy performance is respectable, driven almost entirely by Warsaw region (Warszawski Stołeczny), which ranks second in Europe for educational attainment, hosts 5 percent of the workforce in R&D roles, and has the highest R&D outlays in the country, while all other Polish regions trail far behind.
This capital-dependent pattern indicates that Poland functions as a single-hub innovation economy rather than a broadly competitive one, and it is compounded by a chronic underfunding problem: national R&D spending sits at just 1.4 percent of GDP. Educational attainment is high in volume but the qualitative payoff is limited, since Poland’s education system has historically emphasized rote learning, standardized testing, and compliance over problem-solving, entrepreneurial initiative, and applied research skills. Business R&D is underperforming and so is the presence of VC activity, where even the best-performing region attracts only 0.04 percent of GDP in VC investment. Patent output tells a similar story of concentration and shallowness: Warszawski Stołeczny is Poland’s only region exceeding 200 patents per million residents, while most other regions show minimal patenting activity, confirming that Poland’s research base rarely translates into innovation outside the capital. Academia–business cooperation remains a persistent weak link, as evidenced by fragmented sectoral R&D ecosystems in which spending, cross-firm collaboration, and academic engagement fail to reach the critical mass needed to lift entire industries despite Poland’s underlying scale advantages.
Given this diagnosis, there are several areas for policy actions. First, R&D funding must rise substantially beyond the current level, with a deliberate shift toward diversifying investment across regions, as Poland’s regional disparity is among the starkest. Second, the government should create structured, incentivized channels for university–industry collaboration. Third, education reform should target curricula and pedagogy that build initiative, critical thinking, and entrepreneurial skills rather than solely raising credential attainment, since Poland’s problem is not enrollment, but the practical applicability and dynamism of its graduates. Fourth, targeted efforts to build VC markets and business creation support outside Warsaw are essential. Such efforts leverage Poland’s strength in enterprise birth rate, placing the country in the Index’s top one-third for business dynamism despite weak VC and patenting activity. Fifth, scientific and higher education performance should be strengthened by significantly increasing the conditionality component in financing for universities based on the quality of the research they conduct as it relates to the global frontier. This should apply both to basic research as well as to applied research, where commercialization of innovation should be rewarded. However, such performance-oriented financing should also occur alongside a significant increase in public research funding, as R&D funding across Poland lags behind top-performing economies.
Serbia
Competitiveness Policy
Serbia’s competitiveness policy is strongly framed by the Industrial Policy Strategy 2021–2030, adopted to improve the competitiveness of Serbian industry, strengthen its international market position, coordinate industrial development policy, and improve implementation instruments. This corresponds closely to the report’s findings because Serbia dominates the top of the Index: Belgrade ranks first, South Bačka second, Nišava fifth, Šumadija sixth, and South Banat seventh. At the same time, Serbia also has 5 regions in the bottom 10, including Raška, Pčinja, Zaječar, Jablanica, and Toplica. The Industrial Policy Strategy is therefore well aligned with Serbia’s leading industrial and innovation regions, especially Belgrade and South Bačka, but less adequate as a territorial cohesion instrument because, as the report shows, Serbia’s competitiveness advantage is highly concentrated and coexists with deep regional underperformance in southern and eastern districts.
Innovation Policy
Serbia’s innovation policy is regulated by the Smart Specialization Strategy 2020–2027, one of the key documents for developing a knowledge-based economy and society. Its priority domains include food for the future, future machines and manufacturing systems, ICT development, and creative industries. This report’s findings show that Serbia is the only country in the Index with several regions showing meaningful innovation capacity beyond the capital: Belgrade, South Bačka, and Nišava perform strongly in R&D investment, R&D personnel, patent applications, VC, and knowledge-economy indicators. The policy response is therefore stronger than in the other countries because Serbia has developed a network of science and technology parks and innovation infrastructure in Belgrade, Novi Sad, Niš, and Čačak, with further innovation infrastructure linked to Kragujevac and the wider national research and innovation system. These parks are important because they allow Smart Specialization to be implemented not only as a sectoral strategy, but also through territorial innovation nodes: Belgrade for ICT, start-ups, creative industries, and advanced research; Novi Sad/South Bačka for ICT, food, agritech, and advanced manufacturing; Niš/Nišava for electronics, ICT, and engineering; Čačak/Moravica for technical sciences, SMEs, and manufacturing innovation; and Kragujevac/Šumadija for industrial innovation, automotive-related capabilities, and engineering. The remaining gap is due to this infrastructure still not sufficiently reaching Serbia’s weakest districts, where the report records much lower innovation capacity, broadband adoption, R&D intensity, and enterprise dynamism.
Regional Development Policy
Serbia’s regional development policy is less clearly consolidated than its industrial and innovation policies are. The policy framework includes the Law on Regional Development, territorial and cross-border cooperation programs, and development instruments implemented through the Ministry of Economy and other agencies. But analyses of Serbia’s regional development system consistently point to very large regional disparities and limited effectiveness of subsidy-based regional policy. This directly matches this report’s finding that Serbia has the widest internal variation in the Index: it contains the two best-performing regions, Belgrade and South Bačka, but also several of the weakest-performing regions. The current regional development response therefore needs to move from general subsidies and infrastructure support toward place-based innovation and productivity policy, especially for southern and eastern districts that do not benefit automatically from Serbia’s national industrial and innovation growth.
Recommendations
▪ Keep investing in leading innovation poles—Belgrade, South Baka, and Nišava—but redesign regional development policy so these centers become engines of diffusion rather than isolated winners.
▪ Include territorial targets for lagging districts—particularly Raška, Pinja, Zaječar, Jablanica, and Toplica—as part of the Industrial Policy Strategy and Smart Specialization Strategy.
▪ Use the science and technology park network as the main delivery mechanism for turning Smart Specialization into a regional innovation policy.
▪ Mandate technology parks to not only support start-ups in their own cities but also provide technology-extension services to weaker districts, especially Raška, Pinja, Zaječar, Jablanica, and Toplica.
▪ Utilize local chambers of commerce and introduce a mandate to help SMEs adopt digital tools, improve productivity, access export markets, and connect to advanced manufacturing value chains.
▪ Condition future subsidies on technology transfer, local supplier development, worker training, and measurable productivity gains in less-developed districts.
▪ Expand broadband and digital business services in the weakest regions and create incentives for R&D personnel, engineers, and start-ups to work with firms outside Belgrade and Novi Sad.
Sweden
Knowledge Economy
Since the previous edition of this report, Sweden has strengthened several of the structural foundations underpinning its knowledge economy. Educational attainment has continued to increase across all regions, skilled immigration has expanded, manufacturing productivity has improved, and employment in knowledge-intensive sectors remains among the highest in Europe. The country has also continued to invest heavily in research infrastructure, digitalization, advanced manufacturing, electrification, life sciences, and AI-related capabilities.
However, Sweden’s future challenge is no longer simply producing more university graduates. The primary challenge has shifted toward ensuring an adequate supply of highly specialized engineers, AI specialists, semiconductor-related competencies, software developers, advanced manufacturing specialists, life-science researchers, cybersecurity experts, and technicians capable of supporting knowledge-intensive industries. Future policy should therefore increasingly focus on the quality and relevance of skills development by strengthening advanced STEM education, lifelong learning, vocational education, and international talent attraction while deepening collaboration between universities, industry, and regional innovation ecosystems.
Northern Sweden’s industrial transformation continues to reshape labor demand through investments in batteries, fossil-free steel, electrification, and energy-intensive industries. While several flagship projects have recently experienced delays, more challenging financing conditions, and signs of softer demand for certain green products, these developments are not yet reflected in the indicators used in this Index.
More broadly, Sweden’s long-term competitiveness will depend on its ability to align skills development, research, infrastructure, and innovation policy with the evolving needs of both established industrial regions and emerging growth clusters across the country.
Globalization
Sweden remains one of Europe’s most internationally integrated innovation economies. Foreign-owned companies continue to play an important role within Swedish industry while exports remain concentrated in technology-intensive sectors including advanced manufacturing, pharmaceuticals, telecommunications, automotive technologies, and digital services.
The geopolitical environment has changed significantly since the previous edition of this report. Supply-chain resilience, technological sovereignty, industrial security, and global competition for research investments, advanced manufacturing, AI capabilities, and highly skilled talent have become increasingly important drivers of competitiveness.
Sweden’s accession to NATO represents one of the most significant structural changes affecting the country’s long-term innovation landscape. Beyond its security implications, NATO membership creates new opportunities for collaboration in defense innovation, dual-use technologies, cybersecurity, space technologies, and resilient industrial ecosystems. The key challenge will be to integrate these opportunities with Sweden’s existing strengths in research, industrial development, and innovation.
Sweden should therefore move beyond viewing globalization primarily through exports and inward FDI. Future competitiveness will increasingly depend on attracting globally mobile R&D investments, strengthening international innovation partnerships, and positioning Sweden within emerging value chains in AI, semiconductors, life sciences, defense, advanced materials, and clean technologies. This will require continued coordination between research, industrial, trade, and higher education policies and reinforce Sweden’s position as a leading location for research-intensive industrial development, testing, demonstration, and commercialization.
Innovation Capacity
Sweden continues to demonstrate one of Europe’s strongest innovation ecosystems. Since the previous edition of this report, nearly all structural innovation indicators have improved. Business creation has increased, research intensity has strengthened, R&D personnel have expanded, VC investment has increased, inward FDI has grown, manufacturing productivity has improved, and educational attainment has continued to rise across virtually all Swedish regions.
One indicator deserves particular attention. OECD regional patent statistics indicate a decline in patent intensity since the previous edition. However, this should be interpreted with caution, as the change may partly reflect post-pandemic effects, sector-specific developments, and patent filing behavior rather than a broad weakening of Sweden’s innovation system. Sweden nevertheless remains among Europe’s strongest countries in patent applications per capita. Taken together, the broader evidence suggests that Sweden’s underlying innovation system remains robust despite weaker measured patent output.
The policy challenge has therefore evolved. Sweden’s principal challenge is no longer increasing research inputs alone but translating its strong scientific and industrial capabilities into globally competitive firms, internationally scalable technologies, and higher productivity. Continued efforts to strengthen commercialization, scale-up financing, VC markets, and collaboration between universities, industry, and capital markets should therefore remain central priorities. Maintaining internationally competitive framework conditions—including efficient permitting processes and strong test and demonstration environments—will be essential for converting research and innovation into productivity, industrial competitiveness, and long-term growth.
AI represents perhaps the most important new technology platform since the previous edition of this report. AI adoption now influences productivity across manufacturing, life sciences, public administration, healthcare, financial services, and advanced engineering. Sweden possesses excellent prerequisites through its digital maturity and research system, but long-term competitiveness will increasingly depend on the speed with which AI is adopted across the broader economy rather than within a limited number of frontier firms. National and regional AI implementation strategies should therefore focus on accelerating diffusion across both the public and private sectors to strengthen productivity and international competitiveness.
Similarly, defense innovation, dual-use technologies, cybersecurity, energy technologies, and resilient industrial systems have become increasingly important components of national innovation capacity. Sweden is well positioned to build on its strong industrial base, research capability, and recent NATO membership to develop internationally competitive innovation ecosystems that strengthen competitiveness, resilience, and strategic autonomy simultaneously.
United States
Knowledge Economy
Though the United States has one of the most highly educated workforces in the world, it’s become increasingly evident that students are leaving school ill-equipped to enter the workforce. The societal bias toward four-year liberal arts degree programs in the humanities and social sciences is largely failing to provide students with the workforce training that high-tech and advanced industries need. What’s more, rather than addressing this problem through light-handed and targeted actions, the administration has opted instead for sweeping cuts, including a proposed $2 billion cut to the Department of Education and an estimated $33.7 billion cut in federal nondefense R&D investment, much of which would go to fund extramural research in universities across the country.[67]
Rather than cutting these vital programs, policymakers must take a renewed interest in the downstream effects of education and research funding. Direct government support for advanced research in strategic areas, such as batteries or semiconductors, would incentivize highly focused research at top institutions. University research has a clear and positive effect on economic growth, with the societal rate of return ranging from 30 to 100 percent, leading to more technical innovations, start-ups, and productivity growth.[68] The United States should also act to create a stronger supply of skilled STEM workers across regions. To do so, policymakers should restructure land-grant universities around technical skills that industries need, providing students with affordable, practical, and industrial-focused education that will also supply industries with the skilled workforces they need. They should also support both the creation of industrial colleges for specific industries, such as what Kettering University is to the auto industry, and the expansion of critical technology degree programs that hold national importance, such as AI, new energy, and semiconductor engineering.[69]
Additionally, the United States should be streamlining the process of skilled immigration, making it easier for immigrants looking to pursue education and careers in STEM fields to move to the United States. Currently, 49 percent of all STEM master’s degrees and 57 percent of all STEM doctoral degrees are earned by international students, a large share of whom remain in the United States after graduation.[70] Limiting the flow of skilled immigration into the United States, as the Trump administration has done through its new H-1B visa policies, including a $100,000 entry fee for new visas and an enhanced vetting process for applicants, reduces the skilled workforce of the United States, impacting global competitiveness in advanced industries.[71]
Regarding manufacturing productivity, Congress should empower the Manufacturing Extension Partnership (MEP) under the National Institute of Standards and Technology (NIST) to help small and medium-sized manufacturers adopt next-generation production processes and technologies. NIST operates MEPs in all 50 states, and they play a significant role in enabling small manufacturers with less capital to invest in productivity-enhancing technology, such as robotics or AI tools.[72] Unfortunately, in its proposed FY 2027 budget, the Trump administration calls for eliminating MEP funding, a misguided request that could seriously impact the productivity and profitability of small manufacturers nationwide.[73] Instead, Congress should not only maintain but bolster MEP funding to $300 million annually, up from its current funding levels of $175 million.[74]
Globalization
The Trump Administration’s America First Trade Policy has been designed to address both the lack of manufacturing capacity and the United States’ significant trade deficit—but these policies have yielded mixed results. While FDI in 2025 was up for the first time in three years, greenfield investment was down, and foreign allied countries have now taken steps to recalibrate their trade networks and lower their dependency on the U.S. supply chain due to the administration’s inflammatory tariff regime.[75] For example, in June 2026, the European Commission published the EU Tech Sovereignty Package, which aims to develop native cloud infrastructure and semiconductor manufacturing.[76] The package takes direct aim at the United States, explicitly attempting to reduce dependence on American technology.[77] Additionally, the United States’ aggressive tariffs against Canada may have contributed to Canada’s decision to allow EVs produced in China into its market.[78]
To overcome the uncertainty caused by these trade barriers, state policymakers should create policies that incentivize foreign and local investment in state-specific industries. For example, New York’s Green CHIPS Act, which provided $10 billion in tax credits to firms opening semiconductor fabs in the state, was used to attract high-value, advanced manufacturing to the state of New York.[79] Similar programs can be undertaken in other states, focusing on industries in which a state is already specialized, such as biotechnology in Massachusetts, shipbuilding in Mississippi, or aerospace in Kansas and Oklahoma. Moreover, the investment tax credit (ITC), which provides companies that invest in semiconductor-related manufacturing with a 35 percent tax credit, has proven immensely successful in incentivizing semiconductor manufacturing in the United States, but it is set to expire at the end of 2026. The ITC should be extended at least through the end of 2030 (if not made permanent), and states should explore implementing similar policy measures for other industries to encourage greater FDI in advanced, traded-sector industries.
Innovation Capacity
The most critical way in which the United States can ensure it bolsters its innovation capacity is by not making any further cuts to federal R&D investment. U.S. investment in research is already below that of comparable nations, ranking 11th out of 33 countries in federal R&D intensity, and with the cuts outlined by Trump’s proposed budget for fiscal year 2027, that ranking is poised to fall even further.[80] Instead of cutting federal R&D, Congress should increase federal investment in university research, bringing federal R&D intensity on par with countries such as Austria and Germany, which invest nearly 50 percent more than the United States does.[81] Additionally, the federal R&D tax credit should be increased from its current rate of 20 percent to a minimum of 40 percent. Congress should also triple the Alternative Simplified R&D Credit to incentivize further investment in R&D.
The United States should encourage collaboration between industry, government, and universities in research through collaborative R&D tax credits. Collaboration between universities, industry, and government in research activity has enabled the creation of some of the most critical inventions of our generation, including the touchscreen and mRNA vaccine technology. Currently, the United States provides a 20 percent collaborative R&D credit solely to energy research. This restriction should be removed, and the credit should apply to all fields.
Most states have economic development programs that emphasize growth in advanced technology sectors, while the federal government also has its own fragmented set of programs to incentivize economic development. For example, the Economic Development Administration, the Department of Defense, the National Science Foundation (NSF), and the Small Business Administration all administer their own regional technology hub programs. Instead of creating a small number of hubs focused on advanced technology areas across the country, the four programs have collectively invested in technology hubs in 48 different states, with multiple “hubs” covering the same technology areas.[82] Rather than continue this fragmentation, Congress should empower NSF’s Technology, Innovation, and Partnership (TIP) Directorate to be the leading coordinator of all these hub programs, ensuring that funding is allocated in a way that strategically targets states and industries poised for growth and investment. Strategic investment in technology hub programs will also increase the amount of VC invested in each state. Although not every state can create another Silicon Valley, each state has innovative industries it can capitalize on to attract capital investment.
Moreover, to empower the TIP program, Congress should fully fund it at the levels specified under the CHIPS and Science Act. Supplying the $20 billion appropriated in 2022 would ensure that federal R&D dollars are used on translational research with a high technology readiness level.[83]
Conclusion
Innovation has become one of the primary drivers of regional and national economic growth and competitiveness. Although the global economy has faced economic and geopolitical uncertainty over the past several years, there is ample evidence that regions that invest in innovation, human capital, and advanced industries are better positioned to achieve sustained growth and higher productivity. While national innovation strategies constitute important policy tools, they often favor the largest and most populous regions, overlooking a country’s differences in subnational innovation capacity. As this Index indicates, regions within the same country can vary dramatically in their strengths and weaknesses, suggesting that a single national strategy or policy is not the most optimal tool for maximizing innovation.
Policymakers should consider targeted policies to increase innovation capacity, grow skilled workforces, and bolster globally traded industries to address region-specific challenges. These policies include, but are not limited to, investing in STEM education, incentivizing public and private R&D investment, attracting highly skilled foreign workers, and developing business-friendly regulations to attract foreign investment. By analyzing this Index, policymakers can gain a better understanding of the specific policies needed to bolster each region’s innovativeness within their respective country.
Appendices
Appendix A: Composite and Category Scores Methodology
For each indicator, regions’ scores were converted to a standardized score, which was capped at ±3 to avoid an outlier performance on a single indicator from too heavily influencing the composite score. For composite and category scores, a weighted-average capped standardized score (WACSS) was calculated for each indicator, wherein the weights used are those listed in table A1 (normalized such that an indicator’s applied weight is equal to its listed weight divided by the sum of the listed weights—i.e., applied weights sum to one). For the composite score, this was calculated by including all indicator weights; for the category scores, this was done by including only the weights for the indicators that fall under that category. WACCSs are rescaled to a 100-point scale via min-max normalization, in which the “maximum” parameter is the maximum WACCS plus one-quarter standard deviation of WACCS, and the “minimum” parameter is the minimum WACCS minus one-quarter standard deviation of WACCS.
Mathematically, the WACCS of region  is calculated as:

wherein  denotes the indicator,
  denotes the capped standardized score for region in indicator , and
  is the applied weight of indicator , defined as:
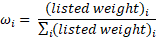
such that  .
.
The scaled score for region/UT is then calculated as:

Table A1: Indicator weights and descriptions
|
Indicator |
Weight |
Year |
Description |
Category |
|
Broadband Adoption |
0.75 |
2021–2025 |
Share of households subscribing to broadband Internet |
Innovation Capacity |
|
Business Creation |
0.50 |
2021–2024 |
Enterprise birth rate in share of employer enterprises |
Innovation Capacity |
|
Carbon Efficiency |
0.50 |
2018–2024 |
Metric tons of CO2e emitted per $10,000 of PPP-adjusted GDP |
Innovation Capacity |
|
High-Tech Exports |
0.75 |
2023–2025 |
Exports in NACIS codes 333–335 (or equivalent) as a share of GDP |
Globalization |
|
Highly Educated Population |
1.00 |
2022–2025 |
Share of 25- to 64-year-old population with a bachelor’s degree (or equivalent) or higher |
Knowledge Economy |
|
Inward FDI |
0.75 |
2018–2025 |
FDI inflow as a share of GDP |
Globalization |
|
Manufacturing Labor Productivity |
1.25 |
2021–2025 |
PPP-adjusted GVA per worker in the manufacturing sector |
Knowledge Economy |
|
Patent Applications |
1.25 |
2018–2025 |
PCT patent applications per million residents |
Innovation Capacity |
|
Professional, Technical, and Scientific Employment |
1.25 |
2022–2025 |
Share of employees in professional, technical, and scientific activities sector |
Knowledge Economy |
|
R&D Intensity |
1.50 |
2023–2024 |
R&D expenditures as a share of GDP |
Innovation Capacity |
|
R&D Personnel |
1.50 |
2023–2024 |
R&D personnel as a share of total employees |
Innovation Capacity |
|
Skilled Immigration |
0.50 |
2022–2022 |
Share of population that is foreign born and has at least some tertiary education (ISEC 5–8) |
Knowledge Economy |
|
Venture Capital Received |
0.75 |
2022–2025 |
VC investments received as a share of GDP |
Innovation Capacity |
Appendix B: Estimation Methodology for Unavailable Data
Subnational-level data was not available for all indicators and countries. To bridge this gap, we used proxy indicators that are available at the subnational level, and we assumed that they correlate with the original indicator. These estimations allow for capturing parts of the innovation competitiveness metrics of regions despite the unavailability of the exact original indicator.
For Bulgaria, FDI inflows were estimated using the existing regional FDI stock data. The FDI stock value for 2023 was subtracted from the stock value of 2024 to approximate the value of FDI inflows in 2024.
For Poland, proxy data was used for FDI inflows and VC investment. FDI inflow data was only available at the national level, but FDI stock distribution data was available at the regional level. This distribution data was applied to the national FDI inflow value and normalized by GDP. Regional VC investment data was also not available, although national VC investment was. This value was distributed based on each region’s share of total investment in business enterprises.
For Greece, VC investment data was approximated using national-level VC data and the distribution of registered start-ups by region.[84]
About the Authors
Meghan Ostertag is a policy analyst for economic policy at ITIF. She holds a bachelor’s degree in economics from American University.
Stephen Ezell is vice president for global innovation policy at ITIF and director of ITIF’s Center for Life Sciences Innovation. He also leads the GTIPA.
Mary Marsh is a policy fellow at ITIF where she supports the GTIPA and contributes to ITIF’s research on trade and innovation.
Amila Pilav-Velic is vice dean for Scientific Research and projects and full professor at the School of Economics and Business, University of Sarajevo.
Andreas Larsson is CEO at STUNS and chairman of the board at Uppsala Innovation Centre.
Axel Plünnecke is head of the Cluster Education, Innovation, and Migration at the German Economic Institute (IW) and professor at the German University of Prevention and Health Management.
Prof. Zoltán Cséfalvay heads the Center for Next Technological Futures at Mathias Corvinus Collegium (MCC, Budapest).
Marcell Kovács is a researcher at the Center for Next Technological Futures at Mathias Corvinus Collegium (MCC, Budapest).
Marija Risteska is the founder and executive director of the Centre for Research and Policy Making (CRPM), a Western Balkan regional think and do tank.
Goran Miladinov is a researcher and lead demographer at CRPM.
Stefan Baumgartner is a research fellow at the Friedrich A. v. Hayek Institute in Vienna, Austria.
Ruslan Stefanov is the director for Strategy and Innovation at the Applied Research and Communications Fund (ARC Fund).
Georgi Dobrev works as an analyst at the Applied Research and Communications Fund (ARC Fund).
Tsvetomir Nikolov is an analyst at the Energy and Climate Program of the Center for the Study of Democracy (CSD).
Stefano da Empoli is president and principal policy analyst at the Institute for Competitiveness (I-Com), a think tank based in Rome and Brussels and which he founded in 2005.
Petros Dimas is a post-doctoral researcher at the Laboratory of Industrial and Energy Economics (LIEE) at the National Technical University of Athens (NTUA), Greece.
Dimitrios Stamopoulos is a post-doctoral researcher at LIEE-NTUA.
Theodora Tzoumanika is a Ph.D. candidate in Industrial Policy and Strategy at LIEE-NTUA.
Aggelos Tsakanikas is professor of Innovation and Entrepreneurship at NTUA and director of LIEE.
Jan Hagemejer is a Macro & Trade director at CASE and also works as an assistant professor at the University of Warsaw.
About the Global Trade and Innovation Policy Alliance
The Global Trade and Innovation Policy Alliance (GTIPA) is a global network of think tanks that collaborate to develop and disseminate policy solutions that support greater trade liberalization and integration. GTIPA members share a conviction that globalization can generate lasting prosperity if countries play by the rules and foster across-the-board, innovation-based growth strategies. Members share principles that include opposing trade-distorting “innovation mercantilism,” but affirm that governments have important proactive roles to play in spurring greater innovation and productivity in their economies. For more information, visit gtipa.org.
Endnotes
[1]. Mario Draghi, “A Competitiveness Strategy for Europe” (Publications Office of the European Union, September 9, 2024), https://commission.europa.eu/topics/competitiveness/draghi-report_en.
[2]. World Intellectual Property Organization (WIPO), “Global Innovation Index 2025: Innovation at a Crossroads” (WIPO, 2024), https://www.wipo.int/web-publications/global-innovation-index-2025/assets/89507/global-innovation-index-2025-en.pdf.
[3]. European Commission: Directorate-General for Research and Innovation, “European Innovation Scoreboard 2025” (Geneva: Publications Office of the European Union, 2025), https://data.europa.eu/doi/10.2777/3239776.
[4]. Authors’ calculation. For further information, please see our methodology in the Appendix section.
[5]. Ibid.
[6]. “Education GPS,” Organization for Economic Cooperation and Development (OECD), accessed September 12, 2025, https://gpseducation.oecd.org/revieweducationpolicies#!node=&filter=all; “Science & Engineering Indicators 2018,” National Science Foundation (NSF), January 2018, https://www.nsf.gov/statistics/2018/nsb20181/report/sections/invention-knowledge-transfer-and-innovation/introduction.
[7]. Christian Daude and Virginia Robano, “On Intergenerational (Im)mobility in Latin America,” Latin American Economic Review 24, no. 9 (2015), https://latinaer.springeropen.com/articles/10.1007/s40503-015-0030-x; Tommaso Agasisti and Alice Bertoletti, “Higher Education and Economic Growth: A Longitudinal Study of European Regions 2000-2017,” Socio-Economic Planning Sciences 81, (June 2022), https://www.sciencedirect.com/science/article/abs/pii/S0038012119306809; Jaehyuk Park, et al., “Global Labor Flow Network Reveals the Hierarchical Organization and Dynamics of Geo-Industrial Clusters in the World Economy,” (working paper, March 19, 2019), https://arxiv.org/abs/1902.04613.
[8]. Institute of Statistics of Albania (INSTAT) (Share of 25–64-year-old population with a bachelor’s degree (or equivalent) or higher, 2024; accessed April 2026); Statistics Austria, (Share of 25–64-year-old population with a bachelor’s degree (or equivalent) or higher; accessed May 2026), https://www.statistik.at/fileadmin/user_upload/Arbeitsmarktstatistiken_2023_Webversion-barrierefrei.pdf; Agency of Statistics of Bosnia and Herzegovina (ASB&H) (Labor Force Survey, 2023; accessed April 2026); Statistical Office of the Republic of Serbia (SORS) (Share of 25–64-year-old population with a bachelor’s degree (or equivalent) or higher, 2024; accessed April 2026); “National Statistical Institute (NSI), (Regional Statistics; accessed May 2026), https://www.nsi.bg/en/statistical-data/62; Statistisches Bundesamt, (Internationale Bildungsindikatoren im Ländervergleich, 2025; accessed May 2026), https://www.statistikportal.de/sites/default/files/2025-09/Internationale_Bildungsindikatoren_im_Laendervergleich_2025_0.pdf; Eurostat, (Persons aged 25-64 with tertiary educational attainment level by sex and NUTS 2 region; accessed May 2026), https://ec.europa.eu/eurostat/databrowser/view/tgs00109/default/table?lang=en&category=t_educ.t_educ_outc; European Commission (EC) (Share of 25–64-year-old population with a bachelor’s degree (or equivalent) or higher; accessed April 2026); North Macedonia State Statistical Office (SSO) (Share of 25–64-year-old population with a bachelor’s degree (or equivalent) or higher, 2024; accessed April 2026); OECD, (Educational attainment – regions, tertiary education; accessed May 2026), https://data-viewer.oecd.org/?chartId=731f7a11-648c-44de-bd50-dc758f699d4b.
[9]. Ibid.
[10]. Marcelo Jauregui-Volpe, “New Data Show U.S. Retains Significant Share of Foreign Science and Engineering Talent Upon Graduation,” Association of American Universities, April 18, 2025, https://www.aau.edu/newsroom/leading-research-universities-report/new-data-show-us-retains-significant-share-foreign.
[11]. INSTAT (Share of population that is foreign born and has at least some tertiary education, 2023; accessed April 2026); OIF, “Bundesländer,” 2025, https://www.integrationsfonds.at/fileadmin/content/AT/monitor/OEIF_Bundeslaender_Broschuere_2025_WEB_barrierefreii.pdf; Ministry of Security of Bosnia and Herzegovina, International Labor Organization, the World Bank (Share of population that is foreign born and has at least some tertiary education, 2024; accessed April 2026); Sonderauswertung Statistisches Bundesamt, accessed May 2026; Eurostat, (Population in private households by country of birth, labour status and NUTS 2 region; accessed May 2026), https://ec.europa.eu/eurostat/databrowser/view/lfst_r_lfsd2pwc__custom_20762082/default/table; ISTAT, (Share of population that is foreign born and has at least some tertiary education (ISEC 5–8); SORS and United National Economic Commission for Europe (Share of population that is foreign born and has at least some tertiary education, 2024; accessed April 2026); SSO (Share of population that is foreign born and has at least some tertiary education, 2024; accessed April 2026); Statistics Poland, (Share of population that is foreign born and has at least some tertiary education (ISEC 5–8); accessed May 2026); U.S. Census Bureau, (Place of Birth by Educational Attainment in the United States, 2022; accessed September 1, 2025), https://data.census.gov/table?q=B06009:+Place+of+Birth+by+Educational+Attainment+in+the+United+States&g=010XX00US$0400000&y=2024.
[12]. Meghan Ostertag et al., “Balkan Subnational Innovation Competitiveness Index” (ITIF, May 2026), https://itif.org/publications/2026/05/26/balkan-subnational-innovation-competitiveness-index/.
[13]. Ibid.
[14]. “Professional, Scientific, and Technical Services,” DataUSA, accessed May 6, 2026, https://datausa.io/profile/naics/professional-scientific-technical-services.
[15]. INSTAT (Share of employees in professional, technical, and scientific activities sectors, 2024), accessed April 2026; Statistics Austria (Share of employees in professional, technical, and scientific activities sectors, accessed May 2026); ASB&H (Share of employees in professional, technical, and scientific activities sectors, 2023, accessed April 2026); Eurostat (Employment in professional, scientific, and technical services, accessed May 2026), https://ec.europa.eu/eurostat/databrowser/view/nama_10r_3empers__custom_21346877/default/table; VGR der Lander (Tabelle 11.4.2.3, accessed May 2026); ELSTAT (Number of employees per two-digit sector of economic activity, accessed May 2026); SORS (Share of employees in professional, technical, and scientific activities sectors, 2024, accessed April 2026); SSO (Share of employees in professional, technical, and scientific activities sectors, 2024, accessed April 2026); OECD (employment by professional, scientific, and technical activities, accessed May 2026), https://data-viewer.oecd.org/?chartId=e7cad935-8e38-4387-a16a-1a672371440d; U.S. Census Bureau (CB2200CBP, accessed May 2026), https://data.census.gov/table/CBP2022.CB2200CBP?q=CBP2022.CB2200CBP&g=010XX00US$0400000&nkd=EMPSZES~001,LFO~006.
[16]. “Montana Region,” Bulgaria for Ukraine, https://ukraine.gov.bg/montana-region/.
[17]. Ibid.
[18]. INSTAT (PPP adjusted GVA per worker in the manufacturing sector, 2024, accessed April 2026); Statistics Austria (GVA in manufacturing, accessed May 2026), https://www.statistik.at/fileadmin/announcement/2025/12/20251209Bruttoregionalprodukt2024.pdf; Eurostat (GVA at basic prices by NUTS 3 region, accessed May 2026); CEIC data (PPP adjusted GVA per worker in the manufacturing sector, 2024, accessed April 2026); OECD Regions and Cities Atlas (GVA in manufacturing, accessed May 2026); Statistics Poland (GVA in manufacturing, accessed May 2026); SORS (PPP adjusted GVA per worker in the manufacturing sector, 2024, accessed April 2026); SSO (PPP adjusted GVA per worker in the manufacturing sector, 2024, accessed April 2026); “Manufacturing Productivity by State (2025-2026),” Manufacturing Lead Generation, updated April 15, 2026, https://manufacturingleadgeneration.com/manufacturing-productivity-by-state/.
[19]. Ibid.
[20]. Robert D. Atkinson, “Marshaling National Power Industries to Preserve America’s Strength and Thwart China’s Bid for Global Dominance” (ITIF, November 17, 2025), https://itif.org/publications/2025/11/17/marshaling-national-power-industries-to-preserve-us-strength-and-thwart-china/.
[21]. INSTAT, CEIC, EC (Exports in NAICS codes 333-335 as a share of GDP, 2024, accessed April 2026); Statistics Austria (Exports by product, accessed May 2026), https://www.statistik.at/fileadmin/announcement/2025/07/20250715RegionalerAussenhandelBL2024.pdf; ASB&H (Exports in NAICS codes 333-335 as a share of GDP, 2024, accessed April 2026); Außenhandelsstatistik VGR der Länder (51000-0040, accessed May 2026); KSH (Value and volume index of export industrial sales by residence quarterly, accessed May 2026); ISTAT (Exports in NAICS codes 333-335 as a share of GDP, 2024, accessed May 2026); Uminski S., “Export performance cluster analysis of Poland’s regions in the first 20 years of EU membership,” Quaestiones Geographicae, 2025; SORS (Exports in NAICS codes 333-335 as a share of GDP, 2024, accessed April 2026); SSO (Exports in NAICS codes 333-335 as a share of GDP, 2024, accessed April 2026); Statistics Sweden (Exports by product, accessed May 2026); BEA (Gross Domestic Product by State, accessed May 2026); USATrade (Exports by NAICS Code, accessed May 2026).
[22]. Ibid.
[23]. Eduardo Borensztein, Jose De Gregorio, and Jong-Wha Lee, “How Does Foreign Direct Investment Affect Economic Growth?” NBER Working Paper Series, No. 5057 (March 1995), https://www.sciencedirect.com/science/article/abs/pii/S0022199697000330; W.N.M. Azman-Saini, Ahmad Zubaidi Baharumshah, and Siong Hook Law, “Foreign Direct Investment, Economic Freedom and Economic Growth: International Evidence,” Economic Modelling No. 27 (2010): 1079–1089, https://www.sciencedirect.com/science/article/abs/pii/S0264999310000635.
[24]. INSTAT (FDI inflow as a share of GDP, 2024, accessed April 2026); “Österreichische Direktinvestitionen im Ausland und ausländische Direktinvestitionen in Österreich,” Austrian National Bank Reports, 2022, https://www.oenb.at/dam/jcr:6079eb12-b9b8-4153-bbf1-bf6c3f9d4eed/report-2025-4-statistik-sh-di.pdf; Central Bank of Bosnia and Herzegovina (FDI inflow as a share of GDP, 2024, accessed April 2026); National Statistical Institute (NSI) (Regional Statistics, accessed May 2026), https://www.nsi.bg/en/statistical-data/70; NSI (Regional GDP, accessed May 2026), https://www.nsi.bg/en/statistical-data/141/429; Bundesbankstatistik (Change in stock size, accessed May 2026); KSH (FDI in Hungary by county and region, accessed May 2026), https://www.ksh.hu/stadat_files/kkr/hu/kkr0082.html; Banca d’Italia (FDI inflows, accessed May 2026); SORS (FDI inflow as a share of GDP, 2024, accessed April 2026); SSO (FDI inflow as a share of GDP, 2024, accessed April 2026); Statistics Sweden (SCB) (FDI inflows, accessed May 2026); BEA (Data on new FDI in the United States, accessed May 2026), http://apps.bea.gov/iTable/.
[25]. Organization for Economic Cooperation and Development (OECD), “Economic Convergence Scoreboard for the Western Balkans 2025” (Paris, France: OECD, June 10, 2025), https://www.oecd.org/en/publications/economic-convergence-scoreboard-for-the-western-balkans-2025_bc0babf3-en/full-report/business-environment-cluster_5d7aef9e.html.
[26]. Ibid.
[27]. Meghan Ostertag, “How Reducing Federal R&D Reduces GDP” (ITIF, September 15, 2025), https://itif.org/publications/2025/09/15/how-reducing-federal-rd-reduces-gdp-growth/.
[28]. INSTAT (R&D expenditures as a share of GDP, 2024, accessed April 2026); Statistics Austria (R&D Intensity, accessed May 2026), https://www.statistik.at/fileadmin/pages/286/FE23_FE-Hauptergebnisse.ods; Republika Srpska Institute of Statistics (R&D expenditures as a share of GDP, 2024, accessed April 2026); NSI (Regional Statistics, R&D investment, accessed May 2026), https://www.nsi.bg/en/statistical-data/70; Bundesministerium fur Forschung, Technologie und Raumfahrt (Federal Report on Research and Innovation, accessed May 2026), https://www.bundesbericht-forschung-innovation.de/en/Numbers-and-Figures-1729.html; Eurostat (Intramural R&D expenditure by NUTS 2 region, accessed May 2026), https://ec.europa.eu/eurostat/databrowser/view/tgs00042/default/table?lang=en; SORS (R&D expenditures as a share of GDP, 2024, accessed April 2026); SSO (R&D expenditures as a share of GDP, 2023, accessed April 2026); National Center for Science and Engineering Statistics (NCSES) (U.S. R&D expenditures, by state, accessed May 2026), https://ncses.nsf.gov/data-collections/national-patterns/2023-2024#data.
[29]. OECD, “OECD Overall R&D Growth Stable; Government R&D Budgets Decline and Reorient Towards Defence” (Paris, France: OECD, March 31, 2026), https://www.oecd.org/en/data/insights/statistical-releases/2026/03/oecd-overall-rd-growth-stable-government-rd-budgets-decline-and-reorient-towards-defence.html.
[30]. Ibid.
[31]. Anders Akerman and Kerstin Holzheu, “The Role of Workers In Knowledge Diffusion Across Firms” (Science Po Economics Discussion Paper, no. 2024-04, November 6, 2024), https://www.sciencespo.fr/department-economics/sites/sciencespo.fr.department-economics/files/2024_v2_akerman_holzheu_the_role_of_workers_in_knowledge_diffusion_across_firms.pdf; Victoria Castillo et al., “The Effects of Knowledge Spillovers Through Labor Mobility” (MPRA Paper 69141, University Library of Munich, Germany, 2016), https://ideas.repec.org/p/pra/mprapa/69141.html.
[32]. INSTAT, EC (R&D personnel as a share of total employees, 2024, accessed April 2026); Statistics Austria (R&D personnel, accessed May 2026), https://www.statistik.at/statistiken/forschung-innovation-digitalisierung/forschung-und-experimentelle-entwicklung-fe/fe-in-allen-volkswirtschaftlichen-sektoren/fe-auswertungen-sektoruebergreifend; ASB&H and EC (R&D personnel as a share of total employees, 2024, accessed April 2026); NSI (Regional employment statistics, accessed May 2026), https://www.nsi.bg/statistical-data/168/543; Bundesministerium fur Forschung, Technologie und Raumfahrt (Federal Report on Research and Innovation, accessed May 2026); Eurostat (Researchers in all sectors, accessed May 2026), https://ec.europa.eu/eurostat/databrowser/view/tgs00043/default/table?lang=en&category=t_scitech.t_rd; SORS (R&D personnel as a share of total employees, 2024, accessed April 2026); SSO (R&D personnel as a share of total employees, 2023, accessed April 2026); NCSES (Domestic employment and R&D employment, by state: 2023), https://ncses.nsf.gov/surveys/business-enterprise-research-development/2023#data.
[33]. Ibid.
[34]. European Bank for Reconstruction and Development (VC investments received as a share of GDP, 2024, accessed April 2026); Florian Haas, “EY Start-up Barometer Österreich 2025,” 2025, https://www.ey.com/content/dam/ey-unified-site/ey-com/de-at/noindex/reports/2025/at-ey-start-up-barometer-2025.pdf?; BVK Statistik nach Bundesländern (VC Investment as a share of GDP, accessed May 2026); EC (VC investments received as a share of GDP, 2024/2025, accessed April 2026); HVCA Annual Report 2024, https://www.hvca.hu/documents/HVCA_report_2024_final.pdf; KSH (GDP by county and region, accessed May 2026), https://www.ksh.hu/stadat_files/gdp/hu/gdp0077.html; ISTAT and EY (VC investment by region, accessed May 2026); SORS (VC investments received as a share of GDP, 2024, accessed April 2026); SSO (VC investments received as a share of GDP, 2024, accessed April 2026); NCSES (VC disbursed per $1 million of GDP, accessed May 2026), https://ncsesdata.nsf.gov/indicators/states/indicator/venture-capital-per-1-million-state-gdp/.
[35]. Ibid.
[36]. Miranda Fraraccio, “How Startups Contribute to Innovation in Emerging Industries,” US Chamber, April 15, 2024, https://www.uschamber.com/co/start/strategy/startup-ingenuity-and-innovation.
[37]. INSTAT (Enterprise birth rate in share of employer enterprises, 2024, accessed April 2026); Statistics Austria (Enterprise birth rate as a share of employer enterprises, accessed May 2026), https://www.statistik.at/statistiken/industrie-bau-handel-und-dienstleistungen/unternehmensdemografie/arbeitgeberunternehmensdemografie; Eurostat (Business demography by size class and NUTS 3 region, accessed May 2026), https://ec.europa.eu/eurostat/databrowser/view/bd_size_r/default/table; ASB&H (Enterprise birth rate in share of employer enterprises, 2023, accessed April 2026); Anke Rink, Ines Seiwert, and Raimund Rodel, “Regionale Ergebnisse Der Unternehmensdemografie,” Statistisches Bundesamt, 2024, https://www.destatis.de/DE/Methoden/WISTA-Wirtschaft-und-Statistik/2024/03/regionale-ergebnisse-unternehmensdemografie-032024.pdf?__blob=publicationFile&v=4; EL STAT, “Business Demography, 2023,” October 31, 2025, https://www.statistics.gr/documents/20181/aa2af3b3-c26f-7e80-71e5-df8a189cefdd ; SORS (Enterprise birth rate in share of employer enterprises, 2024, accessed April 2026); SSO (Enterprise birth rate in share of employer enterprises, 2024, accessed April 2026); Tillväxtanalys (Enterprise birth rate, accessed May 2026), https://www.tillvaxtanalys.se/; Census Bureau (Business Dynamics Statistics 2023, accessed May 2026), https://bds.explorer.ces.census.gov/?year=2023&xaxis-id=state&xaxis-selected=01,02,04,05,06,08,09,10,11,12,13,15,16,17,18,19,20,21,22,23,24,25,26,27,28,29,30,31,32,33,34,35,36,37,38,39,40,41,42,44,45,46,47,48,49,50,51,53,54,55,56&group-id=fage&group-selected=001,010&group-group=2&measure-id=estab&chart-type=table.
[38]. Ibid.
[39]. “PCT – The International Patent System,” WIPO, https://www.wipo.int/en/web/pct-system.
[40]. WIPO (PCT patent applications per million residents, 2024, accessed April 2026); “Jahresbericht 2025,” Das Österreichische Patentamt, https://2025.patentamt.at/; OECD Regions and Cities (Patent PCT applications per million inhabitants (fractional count), accessed May 2026), https://regions-cities-atlas.oecd.org/TL3/x/x/REGION_INNOVATION%20-PCT_MILLION-../2022; ISTAT (PCT patent applications per million residents, accessed May 2026).
[41]. Ruslan Stefanov et al. (2025), “Innovation.bg 2025: Innovation, Economic Security and Tech Sovereignty”, Applied Research and Communications Fund, 2025. https://arcfund.net/en/category-publications/innovatsii-bg-2025/.
[42]. Ibid.
[43]. Nina Czernich et al., “Broadband Infrastructure and Economic Growth,” The Economic Journal No. 121 (May 2011), 505–532, https://doi.org/10.1111/j.1468-0297.2011.02420.x; Banu Demir and Arti Grover, “Do Investments in Digital Infrastructure Improve Employment Outcomes? Evidence from Türkiye” (policy research working paper 11314, World Bank Group, February 2026), https://documents1.worldbank.org/curated/en/099550002172617975/pdf/IDU-c781ea45-9b40-40bd-b4ff-0c5f6271ae39.pdf.
[44]. Zhixiong Yand and Jishun Zhang, “Digital Infrastructure Construction and the Development of New-Quality Productive Forces in Enterprises,” Scientific Reports 15 (2025), https://www.nature.com/articles/s41598-025-09897-w; Wolfgang Briglauer et al., “Economic Benefits of New Broadband Network Coverage and Service Adoption: Evidence from OECD Member States,” Industrial and Corporate Change (January 21, 2025), https://academic.oup.com/icc/advance-article/doi/10.1093/icc/dtae043/7965758.
[45]. INSTAT, Electronic and Postal Communications Authority (Share of households subscribing to broadband Internet, 2024, accessed April 2026); Statistics Austria (Share of households subscribing to broadband Internet, accessed May 2026); ASB&H (Share of households subscribing to broadband Internet, 2024, accessed April 2026); NSI (Regional statistics, accessed May 2026), https://www.nsi.bg/en/statistical-data/46; Statistische Amter Des Bundes Und Der Lander (Broadband availability across all technologies in percent of households, accessed May 2026), https://www.statistikportal.de/de/nachhaltigkeit/ergebnisse/ziel-9-industrie-innovation-und-infrastruktur/breitbandverfuegbarkeit; Eurostat (Households with broadband access, accessed May 2026), https://ec.europa.eu/eurostat/databrowser/view/isoc_r_broad_h/default/table?lang=en; ISTAT (Households with broadband access, accessed May 2026); SORS (Share of households subscribing to broadband Internet, 2024, accessed April 2026); SSO (Share of households subscribing to broadband Internet, 2024, accessed April 2026); SCB (Households with broadband access, accessed May 2026); State Health Compare (Percent of households with a broadband Internet subscription, accessed May 2026), https://statehealthcompare.shadac.org/map/232/percent-of-households-with-a-broadband-internet-subscription-by-total#a/83/267.
[46]. Western Balkan Investment Framework, “Connectivity Agenda,” https://www.wbif.eu/sectors/connectivity-agenda.
[47]. Ibid.
[48]. INSTAT (Metric tons of CO2e emitted per $10,000 of PPP-adjusted GDP, 2024, accessed April 2026); Umwelt Bundesamt, “Bundesländer Luftschadstoff-Inventur 1990–2023” (Vienna, Austria: Umwelt Bundesamt, 2025), https://www.umweltbundesamt.at/fileadmin/site/publikationen/rep1006.pdf; Statistische Amter Des Bundes Und Der Lander (Greenhouse gas emissions, CO2 intensity in current prices, accessed May 2026), https://www.regionalstatistik.de/genesis/online?operation=table&code=86431-Z-06&bypass=true&levelindex=0&levelid=1773917528890; Eurostat (GDP at current market prices by NUTS 2 region, accessed May 2026), ; Eurostat (Greenhouse Gas Emissions at Subnational Level, accessed May 2026), https://edgar.jrc.ec.europa.eu/dataset_ghg80_nuts2; ISPRA and ISTAT (Carbon intensity by region, accessed May 2026); Monica Crippa et al., “GHG Emissions of All World Countries,” JRC Publications, 2024, doi:10.2760/4002897; CEIC and the International Monetary Fund (Metric tons of CO2e emitted per $10,000 of PPP-adjusted GDP, 2024, accessed April 2026); SORS (Metric tons of CO2e emitted per $10,000 of PPP-adjusted GDP, 2024, accessed April 2026); SSO and Ministry of the Environment (Metric tons of CO2e emitted per $10,000 of PPP-adjusted GDP, 2024, accessed April 2026); OECD Regions and Cities Atlas.
[49]. Ibid.
[50]. “OECD Compendium of Productivity Indicators 2026” (Organization for Economic Cooperation and Development; Paris, France, June 23, 2026), https://www.oecd.org/en/publications/oecd-compendium-of-productivity-indicators-2026_734a5e68-en/full-report/productivity-growth-in-a-challenging-global-environment_d888e417.html.
[51]. Information on regional AI preparedness plans was pulled from primary source documents describing regional AI strategies.
[52]. Government Offices of Sweden, “Sweden’s AI Strategy” (Stockholm, Sweden: Government Offices of Sweden, February 25, 2026); https://www.government.se/information-material/2026/02/swedens-ai-strategy/.
[53]. “Inetum Consulting Helping Albania Implement Its AI Strategy and Roadmap,” Consultancy.eu, June 6, 2025, https://www.consultancy.eu/news/11930/inetum-consulting-helping-albania-implement-its-ai-strategy-and-roadmap.
[54]. High-Level Advisory Committee on Artificial Intelligence, “A Blueprint for Greece’s AI Transformation” (Athens: Special Secretariat of Foresight, Presidency of the Hellenic Government, November 2024), https://foresight.gov.gr/en/studies/A-Blueprint-for-Greece-s-AI-Transformation/.
[55]. Ostertag et al., “Balkan Subnational Innovation Competitiveness Index” (ITIF and CPRM, May 2026), https://itif.org/publications/2026/05/26/balkan-subnational-innovation-competitiveness-index/.
[56]. R. Stefanov et al., Innovation.bg 2025: Innovation, Economic Security, and Tech Sovereignty, Applied Research and Communications Fund, 2025, https://arcfund.net/en/category-publications/innovatsii-bg-2025/; IMD World Competitiveness Center, Bulgaria – World Competitiveness Ranking profile, https://www.imd.org/entity-profile/bulgaria-wcr/.
[57]. MIT Regional Entrepreneurship Acceleration Program (REAP), Bulgaria Cohort, https://reap.mit.edu/cohort/bulgaria/.
[58]. “Bulgaria,” MIT REAP, https://reap.mit.edu/cohort/bulgaria/.
[59]. Axel Plünnecke/Michael Hüther, “Die Bedeutung der Hochschulen für einen erfolgreichen Transformationsprozess der Wirtschaft,” IW-Policy Paper (2025), Christina Anger, Julia Betz, and Axel Plünnecke “Bildungspolitik – Was jetzt zu tun ist. Handlungsempfehlungen an die Politik nach den Bundestagswahlen, Gutachten für die Initiative Neue Soziale Marktwirtschaft (INSM),” Köln (2025), Jürgen Matthes and Samina Sultan, “Alarmsignale vom deutschen Export: Eine empirische Bestandsaufnahme der deutschen Exportentwicklung,” IW-Report Nr. 5 (2025), Samina Sultan and Jürgen Matthes, “Exportdominanz Deutschlands im Außenhandel: Wo ist Deutschland noch Exportweltmeister?” IW-Report Nr. 12 (2025), Christina Anger, Julia Betz, and Axel Plünnecke, “MINT-Herbstreport 2025. MINT-Zuwanderung über die Hochschulen,” Gutachten für BDA, Gesamtmetall und MINT Zukunft schaffen, Köln (2025).
[60]. “Mit Wissen und Netzwerken: Mittelstand und Handwerk gezielt stärken,” DLR Projektträger, https://projekttraeger.dlr.de/de/news/mit-wissen-und-netzwerken-mittelstand-und-handwerk-gezielt-staerken.
[61]. German Federal Government, Koalitionsvertrag 2025, “Innovationsfreiheitsgesetz,” pp. 79–80.
[62]. Zoltán Cséfalvay, Freedom, Innovation, Prosperity: The Secrets of Success in the Digital Era (Budapest: MCC Press, 2026).
[63]. Zoltán Cséfalvay, “Europe’s Scaleup Geography and the Role of Access to Talent,” in Knowledge and Digital Technology, ed. Johannes Glückler and Robert Panitz (Cham: Springer, 2024), 107–130, https://doi.org/10.1007/978-3-031-39101-9_6; Zoltán Cséfalvay and Zalán Horlik, “Startups and Talents: How Access to Locally Available Talent at Universities Influences the Startup Performance of European Cities,” in Startups and Knowledge, ed. Zoltán Cséfalvay (Budapest: MCC Press, 2025), 139-199.
[64]. Martin Šebeňa et al., Central Europe-East Asia EV Nexus: Tracking Chinese, South Korean and Japanese Electric Vehicle and Battery Investment in the V4 Countries (Central European Institute of Asian Studies, May 2025), https://ceias.eu/central-europe-east-asia-ev-nexus/.
[65]. Marcell Kovács, “European Defense Scaleups: Who Really Benefits from ReArm Europe’s €800 Billion?” (Gránit Asset Management, May 19, 2026), https://granitalapkezelo.hu/en/grandioblog/european-defense-scaleups-rearm-europe/.
[66]. Zoltán Cséfalvay, György Papp, and Zalán Horlik, “Artificial Intelligence Scaleups and Their Knowledge Background in European Cities,” 2025 IEEE 16th International Conference on Cognitive Infocommunications (CogInfoCom) (Vienna, 2025), 225–230, https://ieeexplore.ieee.org/abstract/document/11200724.
[67]. Alessandra Zimmerman, “FY 2026 R&D Appropriations: Federal R&D Estimates,” American Association for the Advancement of Science, July 15, 2025, https://www.aaas.org/news/fy-2026-rd-appropriations-federal-rd-estimates; Mackenzie Wilkes and Bianca Quinlantan, “Trump budget calls for billions for an Education Department he wants to eliminate,” Politico, April 2, 2026, https://subscriber.politicopro.com/article/2026/04/trump-budget-calls-for-billions-for-an-education-department-he-wants-to-eliminate-00857565.
[68]. Meghan Ostertag, “America Is Falling Behind on University Research” (ITIF, May 16, 2026), https://itif.org/publications/2025/05/16/america-is-falling-behind-on-university-research/.
[69]. Robert D. Atkinson, “Mobilizing for Techno-Economic War, Part 4: Transforming Education and Workforce Policy” (ITIF, May 13, 2026), https://itif.org/publications/2026/05/13/mobilizing-for-techno-economic-war-part-4-transforming-education-and-workforce-policy/.
[70]. “More International Students Enroll in U.S. Grad STEM Programs: The Numbers and Their Impact,” ETS, 2025, https://www.ets.org/grad-school-journey/international-students-stem-programs.html.
[71]. Drishti Pillai and Samantha Artiga, “Potential Impacts of Trump Administration H-1B Visa Policies on the Health Care and Social Assistance Industries” (KFF, February 5, 2026), https://www.kff.org/immigrant-health/potential-impacts-of-trump-administration-h-1b-visa-policies-on-the-health-care-and-social-assistance-industries/.
[72]. Manufacturing.gov, “What Is the MEP National Network,” https://www.manufacturing.gov/qa/what-mep-national-network.
[73]. Jeffrey Kinney, “Trump again proposes eliminating Manufacturing Extension Partnership,” Manufacturing Drive, April 8, 2026, https://www.manufacturingdive.com/news/trumps-fy-2027-budget-eliminates-manufacturing-extension-partnership-program/816844/.
[74]. NIST Congressional and Legislative Affairs, “NIST Appropriations Summary FY 2022 – FY 2024,” https://www.nist.gov/congressional-and-legislative-affairs/nist-appropriations-summary-1.
[75]. Meghan Ostertag, “After Three Years of Decline, US FDI Rebounded in 2025” (ITIF, July 13, 2026), https://itif.org/publications/2026/07/13/after-three-years-of-decline-us-fdi-rebounded-in-2025/; Stephen Ezell and Rodrigo Balbontin, “How America’s Trading Partners Are Reacting to US Tariffs” (ITIF, June 30, 2025), https://itif.org/publications/2025/06/30/how-americas-trading-partners-reacting-to-us-tariffs/.
[76]. Jadzia Pierce et al., “EU Tech Sovereignty Package,” Global Policy Watch, June 4, 2026, https://www.globalpolicywatch.com/2026/06/eu-tech-sovereignty-package/.
[77]. Tanya Nagrath, “The Case Against the EU’s Tech Sovereignty Package” (ITIF, June 11, 2026), https://itif.org/publications/2026/06/11/the-case-against-the-eus-tech-sovereignty-package/.
[78]. Lawrence Zhang, “Cars, Canola, and the Country Canada Chooses To Be” (January 17, 2026), https://itif.org/publications/2026/01/17/cars-canola-and-the-country-canada-chooses-to-be/.
[79]. Meghan Ostertag, “The State Hamilton Index: Most States Underperform in Advanced Industries” (ITIF, May 5, 2026), https://itif.org/publications/2025/05/05/the-state-hamilton-index-most-states-underperform-in-advanced-industries/.
[80]. Ostertag, “How Reducing Federal R&D Reduces GDP Growth.”
[81]. OECD, Gross domestic expenditure on R&D by sector of performance and source of funds (Constant prices, US 2020 dollars, PPP converted, millions), accessed April 21, 2025, https://data-explorer.oecd.org/vis?lc=en&df[ds]=dsDisseminateFinalDMZ&df[id]=DSD_RDS_GERD%40DF_GERD_SOF&df[ag]=OECD.STI.STP&df[vs]=1.0&dq=AUS%2BAUT%2BBEL%2BCAN%2BCHL%2BCOL%2BCRI%2BCZE%2BDNK%2BEST%2BFIN%2BFRA%2BDEU%2BGRC%2BHUN%2BIRL%2BISL%2BISR%2BITA%2BJPN%2BKOR%2BLVA%2BLTU%2BLUX%2BNLD%2BNZL%2BNOR%2BPOL%2BPRT%2BSVK%2BSVN%2BESP%2BSWE%2BCHE%2BTUR%2BGBR%2BUSA.A..HES%2B_T.HES%2BBES%2BGOV%2B_T.....USD_PPP.Q&pd=2019%2C2024&to[TIME_PERIOD]=false&vw=tb.
[82]. Robert D. Atkinson and Trelysa Long, “Tech Hubs or Tech Dispersion?” (ITIF, January 6, 2025), https://itif.org/publications/2025/01/06/tech-hubs-or-tech-dispersion/.
[83]. Robert D. Atkinson and Meghan Ostertag, “Congress Should Fully Fund NSF’s TIP Directorate to Make America More Competitive Versus China” (ITIF, June 30, 2025), https://itif.org/publications/2025/06/30/congress-should-fully-fund-nsf-tip-directorate/.
[84]. “Mapping the Greek Startup Ecosystem,” EuroCC@Greece, https://eurocc-greece.gr/mapping-the-greek-startup-ecosystem/.
Editors’ Recommendations
November 14, 2022
The Transatlantic Subnational Innovation Competitiveness Index
September 14, 2023
