
The State Hamilton Index: Most States Underperform in Advanced Industries

Innovation-driven production is key to reclaiming U.S. dominance on the international stage. Yet, all but a few U.S. state economies are less concentrated in advanced industries than the world average—and only one is ahead of China.
KEY TAKEAWAYS
Key Takeaways
Introduction
The United States faces fierce competition for global market share in traded-sector, advanced technology industries, wherein success directly impacts national economic strength and security. As China’s economy continues to grow and innovate—surpassing expectations from just a few years ago—the United States must look to expand its innovation and production capacity. China’s gains have come at the expense of the United States and its allies, making this challenge even more pressing. While the Information Technology and Innovation Foundation (ITIF) has conducted analysis of the U.S. share of a variety of advanced industries relative to other nations, it’s worth conducting that analysis at a more granular level: U.S. states.
Innovation-driven production is key to reclaiming U.S. dominance on the international stage. Once the leader in the production of advanced technologies, the United States now finds itself with less capabilities than the global average. Over the past several decades, the erosion of domestic industry has slowed economic growth, weakened the terms of trade, degraded national security, and made America vulnerable to China’s innovation mercantilist tactics.
If the United States wants to grow domestic production, the federal and state governments must coordinate a national industrial strategy in which U.S. states prioritize the development of industries that strengthen the national economy—not just their own. Today, most states are indifferent to what industries they foster and what jobs are available to their citizens (e.g., a job producing potato chips is just as valuable as a job producing computer chips). However, computer chips are far more strategically important than potato chips, and organizing a national strategy to develop advanced industries state-by-state will bring the United States closer to its industrial goals.[1]
A domestic industrial strategy could help improve U.S. regional economic development in two key ways. First, policies supporting the collaboration and coordination between relevant firms could help to develop regional clusters or hubs, areas of inter-firm information sharing where high-skill workers develop and share new technologies. There is a deep literature on innovation hubs, their successful efforts to create them in the United States, and their benefits.[2] Second, a regional industrial strategy could attract firms of one industry and reorient the economy, breaking cities and states out of economic ruts dependent on legacy industries with minimal growth outlook.[3]
To assess the industrial performance of U.S. states and the District of Columbia, ITIF examined their share of U.S. output in seven industry sectors, which are aggregated into the Hamilton Index of Advanced-Technology Performance: information technology (IT) and information services; computer, electronic, and optical products; pharmaceuticals and biotechnology; electrical equipment; machinery and equipment; motor vehicles; and other transport equipment. We also compared each state’s total concentration with the globe’s and China’s, and used data from the United States Census Bureau’s dataset on total employees in 2022.[4]
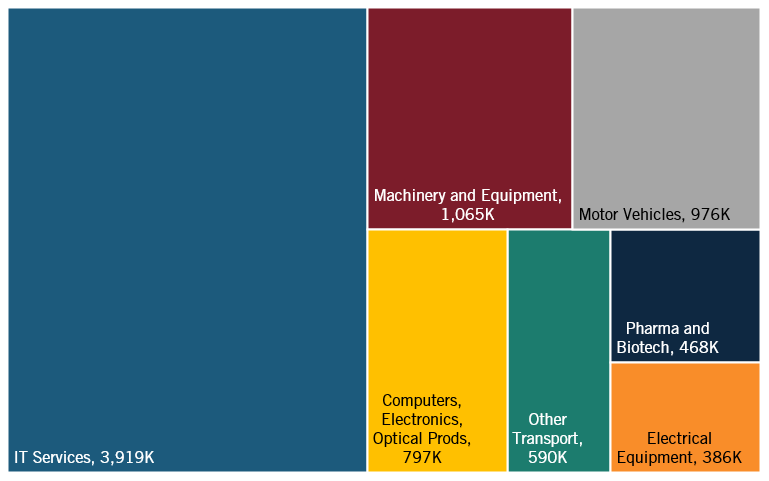
The seven industries included in the Hamilton Index together accounted for 8 million workers in the United States in 2022 (figure 1). The IT and information services industry (including software and Internet services) is the largest of the 10, accounting for 48 percent of all employees in Hamilton Index industries.
Figure 1: Total employment in industries included in Hamilton Index, 2022 (8.2 million)
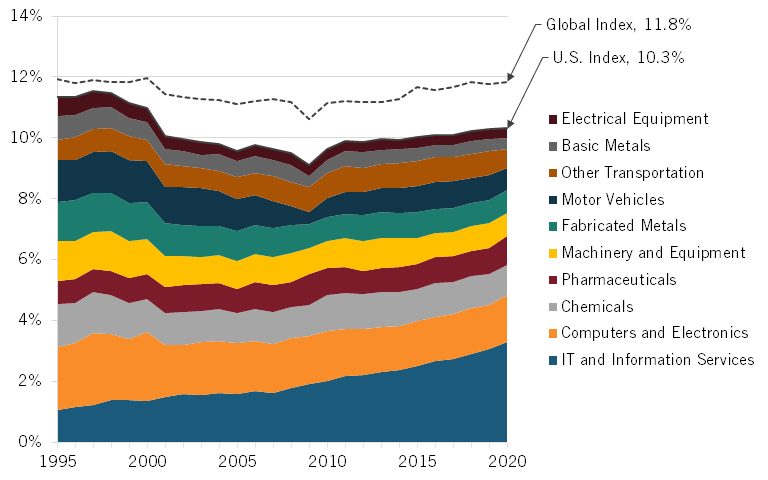
Using data from the Hamilton Index published in 2023, America’s aggregate performance in advanced industries has been weak over the last two-plus decades, barring the IT and information services industry, which has seen growth due to leading U.S. firms such as Google, Meta, and Microsoft (figure 2).[5] Overall, the domestic market share of Hamilton industries in the United States has fallen by over 1 percentage point; excluding the IT and information services industry, market share has fallen by over 3 points.
Figure 2: Hamilton industry shares of the U.S. economy
Domestic market shares or total employees in advanced industries cannot serve as the only metric of national competitiveness—or even the primary one—because states have different-sized economies. To assess states’ relative performance in strategically important industries, ITIF used an analytical statistic known as a location quotient (LQ), which measures any region’s level of industrial specialization relative to a larger geographic unit—in this case, a state relative to the United States as a whole. LQs have long been used for regional economic analysis to assess the industrial specialization of a region. However, our research shows that no such assessment has been done on U.S. states in recent years.[6] For this analysis, all states with LQs at or above 1.00 are considered over-performing, while all LQs below 1.00 are considered underperforming.
Methodology
The LQ is calculated as an industry’s share of a state’s economy divided by the national industry’s share of the U.S. economy or as a state’s share of domestic output in an industry divided by the state’s overall share of the national economy. In this report, the share of the industry’s output is calculated using the number of employees working in that industry. An LQ greater than 1 means the state’s share of the national output in an industry is greater than the national average, and an LQ less than 1 means a state’s share is less than the national average. For example, Michigan’s motor vehicle output in 2022 was 16.92 percent of national motor vehicle production, while Michigan’s economy overall was 2.47 percent of the national economy. Thus, the Michigan LQ in the motor vehicles industry was 16.92 percent divided by 2.47 percent, or 6.84, meaning Michigan significantly over-performed in the industry: its output was 684 percent of the level we would expect based on the size of the Michigan economy.
Within each of the seven industries previously listed, there are subindustries. For example, the other transportation industry has three subindustries: aerospace product and parts manufacturing, railroad rolling stock manufacturing, and ship and boat building. Some industries, such as machinery and equipment, have only one subindustry. States are ranked in relative performance and absolute employment in each of the 21 subindustries. Employment in each subindustry is used to calculate each state’s overall LQ. Composite LQs are calculated by dividing a state’s share of employees in Hamilton industries by the national share of employees in Hamilton industries. LQs are found to be stable and accurate measures of industry specialization in analyses of three-digit NAICS industries for populations between 100,000 and 1 million. Both of these criteria are true in this analysis.[7]
In addition to composite LQs, a global LQ is calculated for each state. Each state’s global LQ is the share of all Hamilton industries in a state’s economy divided by the share of all Hamilton industries in the global economy. For example. Hamilton industries account for 9.11 percent of Michigan’s output, while they account for 8.37 percent of global output.[8] Thus, the global LQ of Michigan is 9.11 percent divided by 8.37 percent, or 1.09, meaning Michigan over-performs in Hamilton industries relative to the world.[9]
Findings
Specialization Rankings
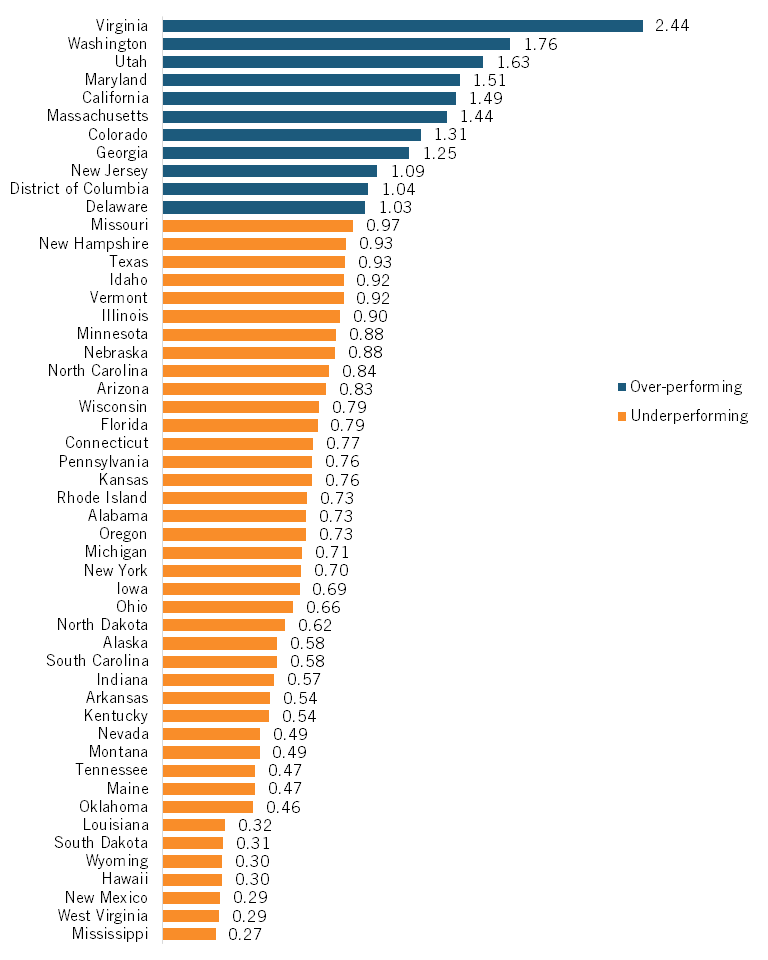
Figure 3 ranks the states and D.C. according to their relative performance, or LQ, in the composite Hamilton Index. Nineteen states have LQs above 1.00, indicating that they are above the national average in the aggregate output in the 21 Hamilton subindustries analyzed. Washington state ranks first with an LQ of 1.79, driven by its diverse landscape of advanced technology companies, mainly in Seattle, including IT and aerospace firms. States focusing on high-tech industries, such as Virginia, California, and Massachusetts, ranked second, fifth, and sixth, respectively. At the same time, manufacturing hubs such as Indiana, Michigan, and Kansas were third, fourth, and eighth overall, respectively.
The composite rankings revealed both surprising and expected findings. Rural states such Oklahoma (0.66) and Wyoming (0.33) underperformed in the composite score, revealing the dependence on low-tech, agrarian, and service-based industries. At the same time, states with large urban centers, such as Texas (0.84), New York (0.73), and Florida (0.50), were below the national average. Thirty-one U.S. states and the District of Columbia underperformed in the composite of all Hamilton industries, reemphasizing the fact that advanced industries tend to be somewhat concentrated geographically.
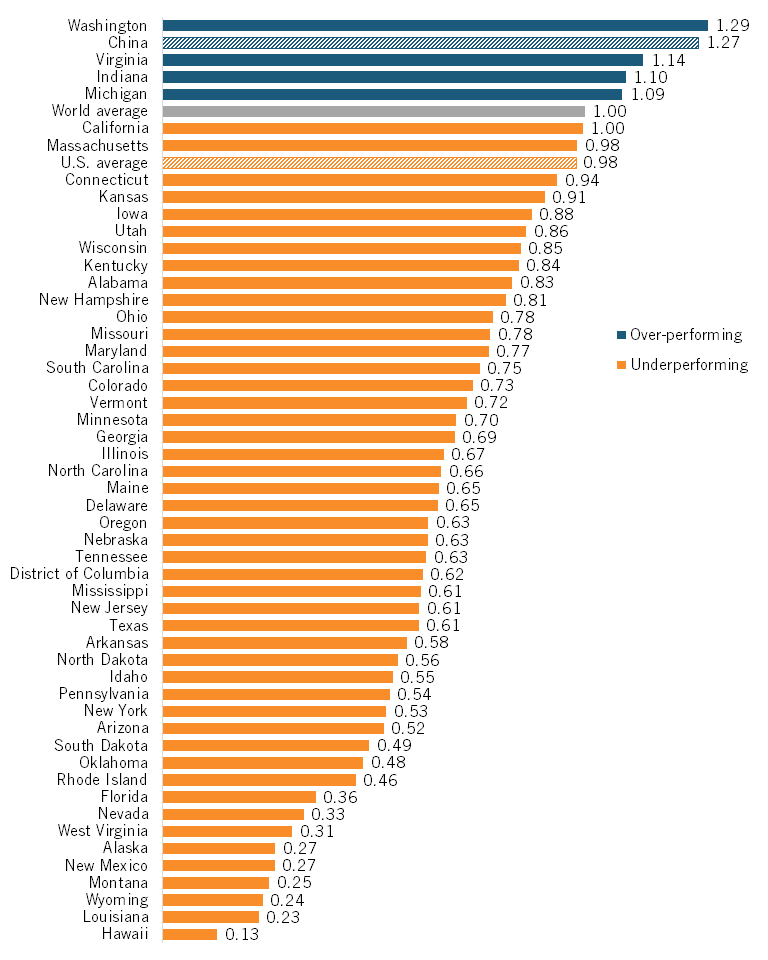
Only four states—Washington, Virginia, Indiana, and Michigan—have a greater concentration of advanced industries than the global average. And just Washington has a greater concentration than China.
The United States is underperforming the world average in the seven Hamilton Index industries included in this analysis (LQ of 0.98).[10] This means a state that performs at par with the country (composite LQ of 1.00) is still underperforming when considering the rest of the world. As such, it’s valuable to see how individual states perform on a global scale. Figure 4 shows that only Washington, Virginia, Indiana, and Michigan have a greater concentration of advanced industries than the global average. And only Washington has a greater concentration than China, while 25 states have an LQ half or less than China’s LQ. In other words, virtually all U.S. states have economies less concentrated in advanced industries than the world average and China. Every state must consider growing its advanced industries to be the number one priority in the race against China.
Figure 3: States’ national LQs
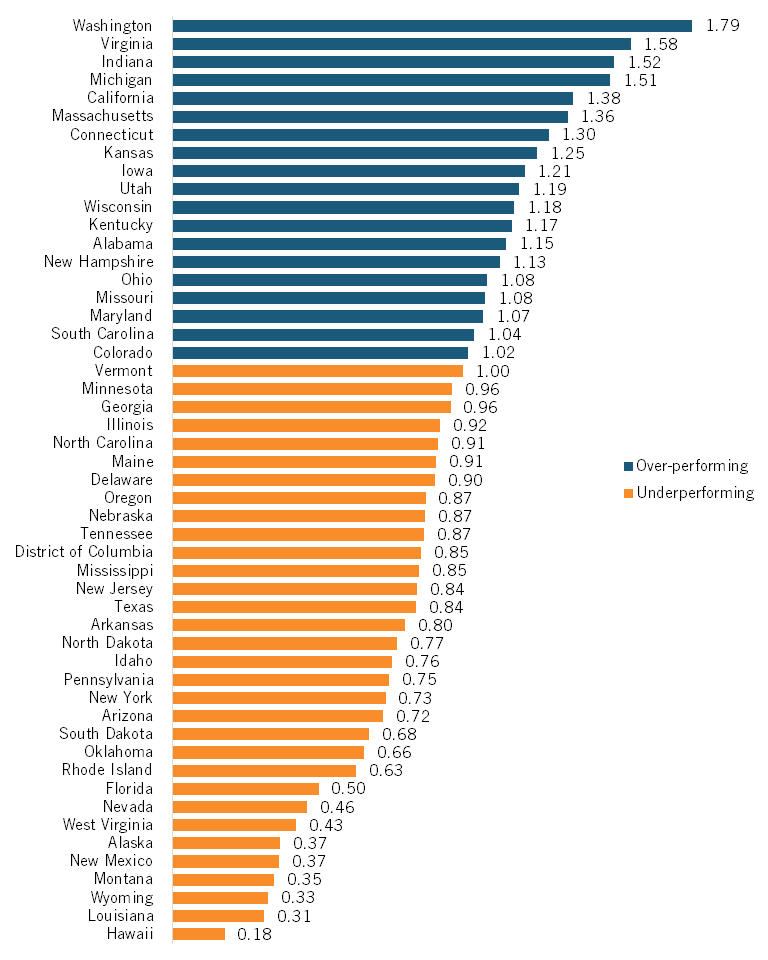
Figure 4: States’ global LQs
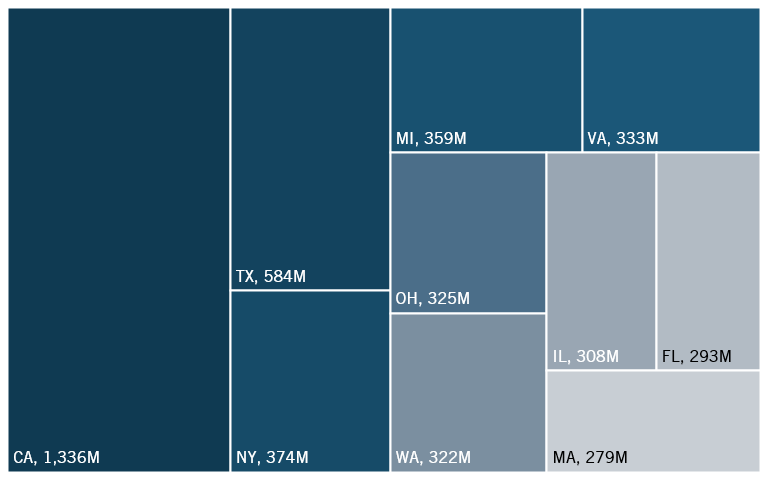
In terms of absolute employment, the results are to be expected. The largest states in the country, California and Texas, lead the Hamilton Index with 1.3 million and 584,000 individuals working in Hamilton industries, respectively (figure 5). Less-populated states, such as Washington and Massachusetts, also make the top 10, reflecting the density of advanced industries in their largest cities.
Figure 5: Number of employees in Hamilton Index industries (top 10 states)
Some industries are more concentrated than others, with certain states having significant comparative advantages over others in the sector. For example, Virginia, the leader in IT and information services, had an LQ of 2.44 (table 1.) Meanwhile, the relative leader of the motor vehicles industry, Indiana, had an LQ of 7.94, showing extreme dominance relative to other states. Some states with relative specializations have small populations, such as Maine and New Hampshire, making it easier for a specific industry to dominate the economy. However, other states, such as Virginia or Wisconsin, excel in broader industries and benefit from strategic locations, helping them to outperform all other states.
Table 1: State Hamilton Index industry leaders, 2022
|
Industry |
Total U.S. Workforce |
Leading Producer |
Leader’s Share |
Leading Specialist |
Leader’s LQ |
|
IT and information services |
3,919,000 |
California |
21.6% |
Virginia |
2.44 |
|
Computers, electronics, and optical products |
797,000 |
California |
20.2% |
New Hampshire |
3.12 |
|
Pharma and biotech |
468,000 |
California |
24.2% |
Maine |
4.30 |
|
Machinery and equipment |
1,065,000 |
Ohio |
7.3% |
Iowa |
4.10 |
|
Motor vehicles |
976,000 |
Michigan |
16.9% |
Indiana |
7.94 |
|
Other transportation |
590,000 |
California |
12.6% |
Kansas |
5.40 |
|
Electrical equipment |
386,000 |
California |
7.5% |
Wisconsin |
4.70 |
|
Composite state index |
8,201,000 |
California |
16.3% |
Washington |
1.79 |
Industry Profiles
IT and Information Services
The IT and information services industry group is comprised of four subindustries: software publishing; data processing, hosting, and related services; Internet publishing, broadcasting, and web search portals; and computer systems design and related services.
Figure 6: IT and information services industry group LQ, 2022
Software Publishing
The software publishing industry includes employees engaged in computer software creation and publication. Everyday applications, including Microsoft Word, video games, and the iOS platform Apple devices run on depend on software publishing, as does novel and innovative technology, such as artificial intelligence (AI). Software publishers are key innovation drivers and essential for the United States to maintain technology dominance.
Figure 7: Software publishing LQ, 2022
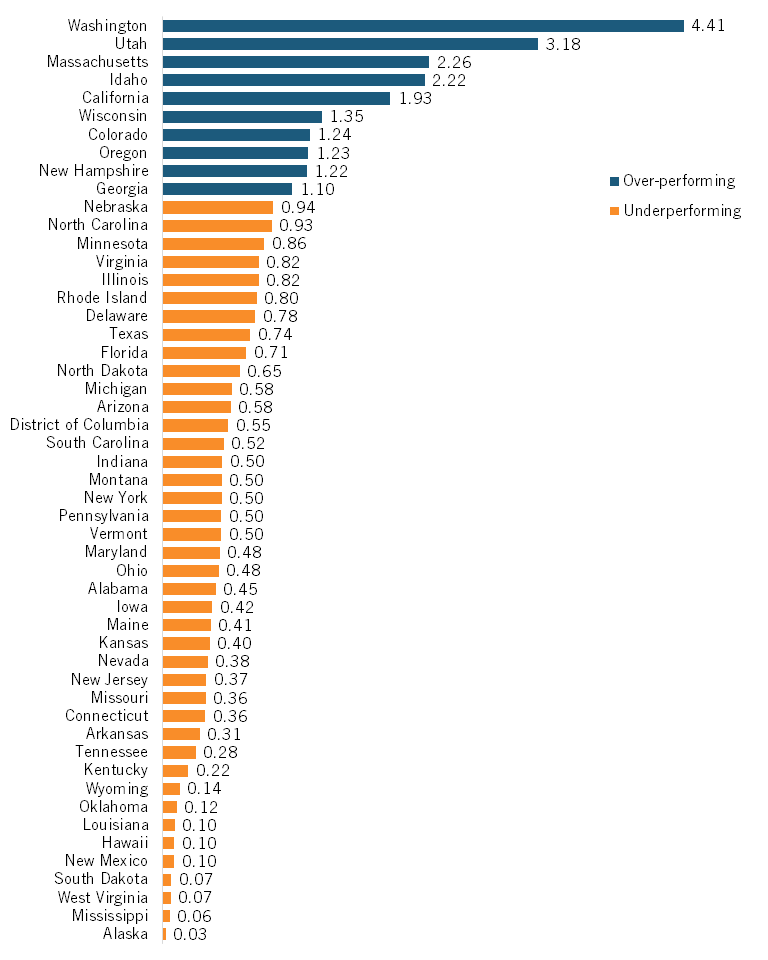
Washington state, home to tech giants such as Microsoft and Amazon and countless start-up firms, leads the nation in relative performance in software publishing with an LQ of 4.41. (See figure 7.) Other high-ranking states include Utah (3.18), Massachusetts (2.26), Idaho (2.22), and California (1.93), all of which punch far above their weight in the number of software publishers relative to the size of their economies.
Most states underperformed in this industry, underscoring the clustered nature of tech companies in just a few major cities nationwide. Even states with large urban centers, including Texas (0.74), Florida (0.71), and New York (0.50), employ fewer software engineers than expected based on the size of their urban centers.
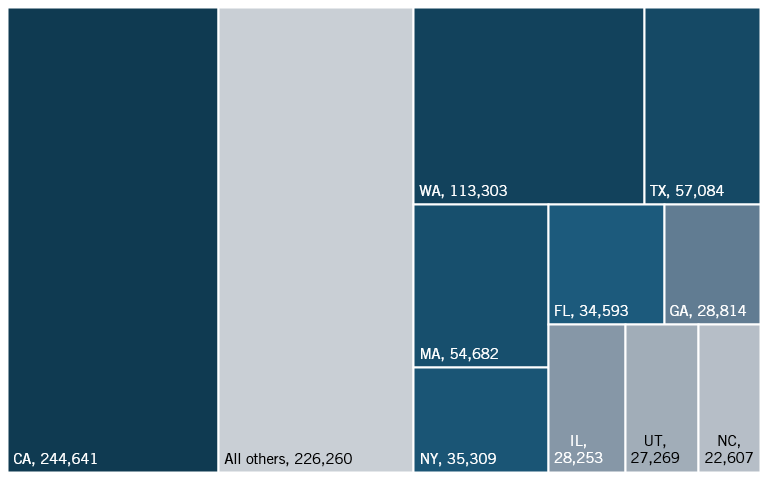
In terms of absolute employees (figure 8), the story is slightly different. California employs more than 240,000 individuals, over twice as many as Washington (113,303). Even though California has just the fifth-highest relative performance in software publishing, over 28 percent of employees in this industry live in the state, which is unsurprising given that global tech leaders such as Google, Meta, and Oracle call the state home. Silicon Valley has become an innovative technology hub, attracting the largest tech firms in the world and fostering an environment of entrepreneurship in the tech space. Texas and Massachusetts each employ over 50,000 people in the software publishing industry. Thirty-five states employ less than 1 percent of the total software publishers nationwide.
Figure 8: Number of employees in software publishing by state (top 10 states, and all others)
Data Processing, Hosting, and Related Services
The data processing, hosting, and related services industry encompasses businesses that provide computing, data storage, and online services infrastructure. This includes cloud computing providers, data centers, web hosting, and companies managing large-scale data analytics. As businesses and consumers increasingly rely on digital platforms, the industry has become a crucial backbone of modern technology, supporting e-commerce, finance, healthcare, and many other sectors.
Figure 9: Data processing, hosting, and related services LQ, 2022
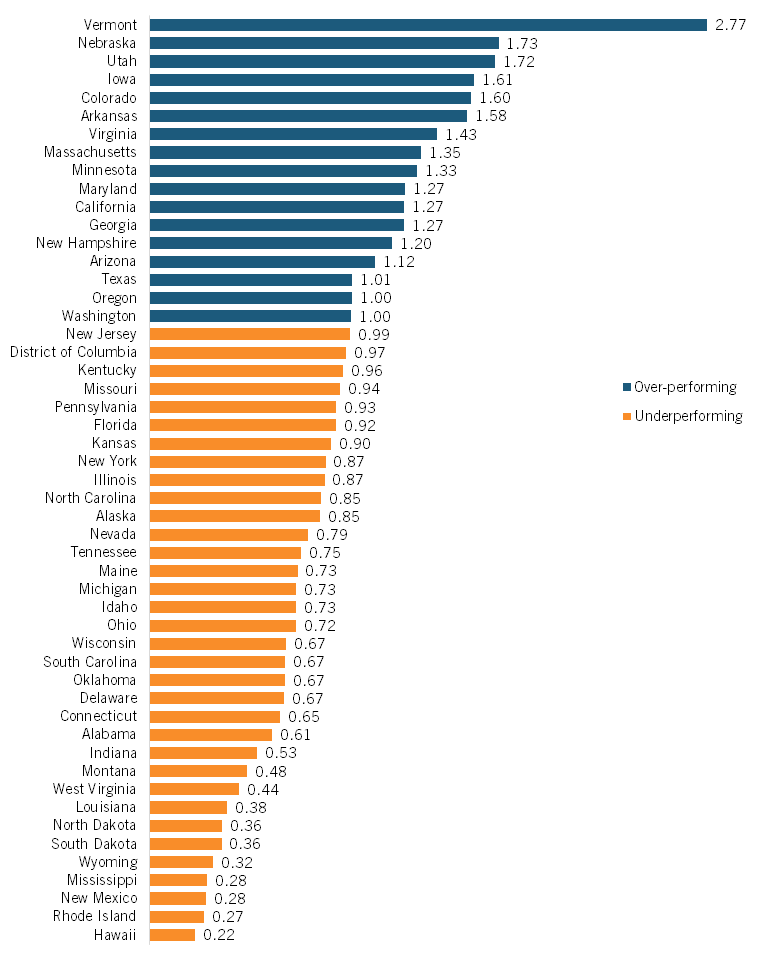
Vermont leads the nation in relative performance in data processing, hosting, and related services with an LQ of 2.77, significantly outperforming other states. (See figure 9.) Other high-ranking states include Nebraska (1.73), Utah (1.72), Iowa (1.61), and Colorado (1.60), all of which have an intense concentration of data-related businesses relative to their overall economies. These states likely benefit from favorable business environments, lower costs for operating data centers, and investments in digital infrastructure that attract technology firms.
Many states underperform in this industry, highlighting the clustered nature of the technology sector in specific regions. States with an LQ below 1.00, such as Florida (0.92), New York (0.87), and North Carolina (0.85), employ fewer data processing and hosting professionals than expected based on their economic size. The lowest-ranking states, including New Mexico (0.28), Rhode Island (0.27), and Hawaii (0.22), face challenges such as high operational costs, limited broadband infrastructure, or less focus on tech-driven industries.
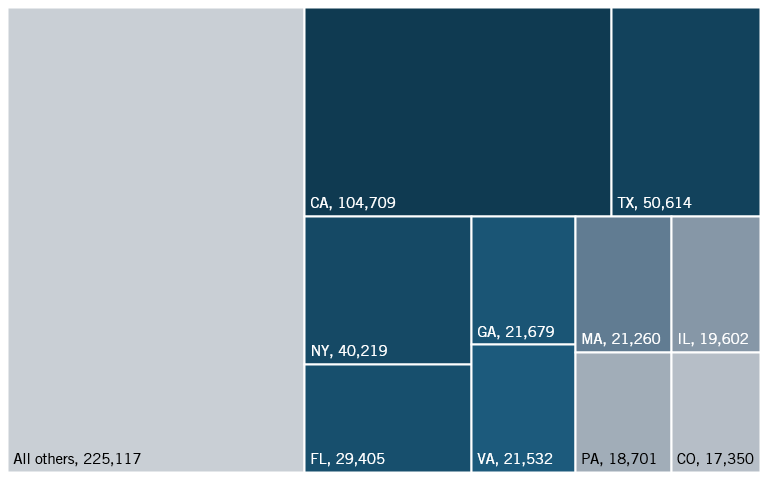
California again leads in absolute employment (figure 10) with over 104,000 employees working in its data processing, hosting, and related services, more than twice as many as Texas, which employs around 50,000. While California dominates in absolute employment, Texas, New York, and Florida also play significant roles, each employing tens of thousands in the industry. Georgia, Virginia, and Massachusetts each have over 20,000 employees, reflecting their growing influence in data services. However, a large portion of employment in this sector is spread across other states, with all other states accounting for over 39 percent (225,000) of jobs. Despite California’s dominance, the industry is widely distributed, with many states contributing to the nation’s data infrastructure and cloud computing capabilities.
Figure 10: Number of employees in data processing, hosting, and related services (top 10 states, and all others)
Internet Publishing and Broadcasting and Web Search Portals
The Internet publishing, broadcasting, and web search portals industry includes businesses that create, distribute, and manage digital content and online information services. This sector encompasses news websites, streaming platforms, social media companies, and search engines that facilitate the discovery and dissemination of digital media. As consumer behavior increasingly shifts toward online content consumption, this industry plays a crucial role in information accessibility, digital advertising, and global connectivity.
Figure 11: Internet publishing, broadcasting, and web search portals LQ, 2022
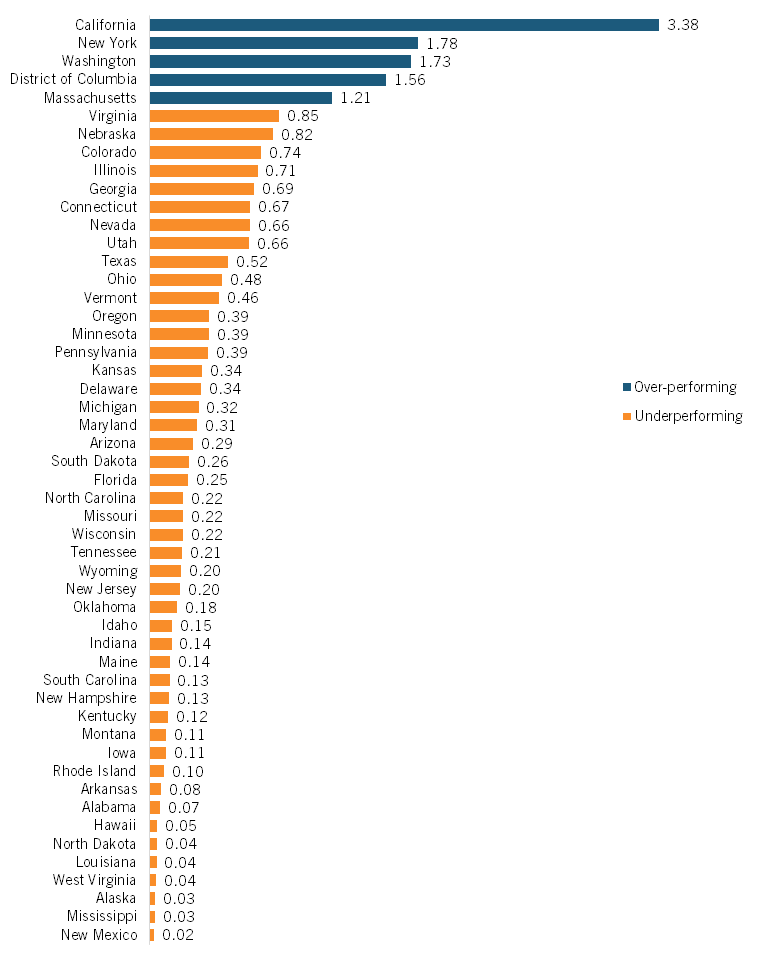
California leads the nation in this industry with an LQ of 3.38, far exceeding any other state (figure 11). Other high-ranking states include New York (1.78), Washington (1.73), and the District of Columbia (1.56), all of which have a strong presence of major tech firms, media companies, and online service providers. Massachusetts (1.21) also stands out due to its concentration of digital media and tech-driven businesses. These states benefit from innovation hubs, venture capital funding, and high demand for digital content creation.
All but five states underperform in this industry. Even states with large populations, such as Texas (0.52), Pennsylvania (0.39), and Florida (0.25), employ fewer professionals in this sector than expected based on their overall economies. The lowest-ranking states, including Mississippi (0.03), Alaska (0.03), and New Mexico (0.02), likely struggle with limited digital infrastructure and fewer large-scale media firms. This geographic disparity underscores the industry’s reliance on established tech hubs and suggests potential growth opportunities in underrepresented areas.
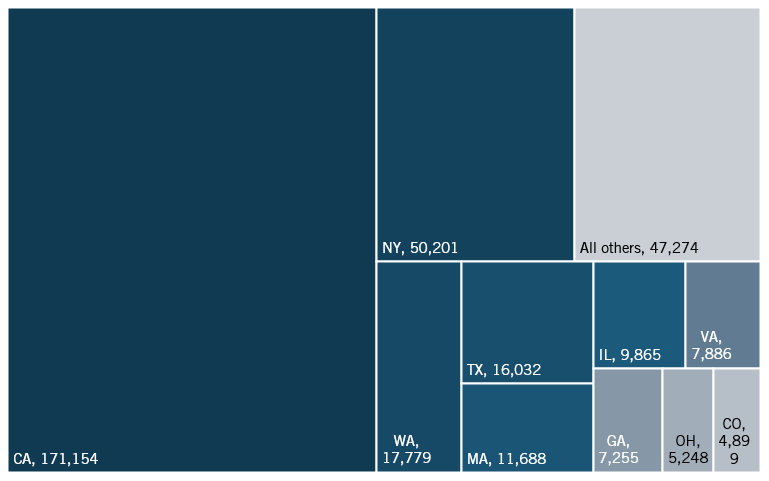
California leads the Internet publishing, broadcasting, and web search portals industry with over 171,000 employees (figure 12), far surpassing New York, which follows with just over 50,000. While other states contribute significantly, California remains the industry’s epicenter, home to innovative big tech companies. Washington, Texas, and Massachusetts also have substantial employment in the sector, with Washington employing nearly 18,000 workers and Texas around 16,000. Despite these numbers, employment in this industry is heavily concentrated in a few states, with California alone accounting for almost 50 percent of the domestic workforce. Many states, including Virginia, Georgia, and Illinois, employ smaller but notable numbers, while most other states contribute relatively little to overall employment in this sector.
Figure 12: Number of employees in Internet publishing, broadcasting, and web search (top 10 states and all others)
Computer Systems Design and Related Services
Computer systems design and related services firms provide IT expertise through software development, systems integration, network design, and consulting. These companies help businesses implement and maintain technology infrastructure, from cybersecurity to cloud computing services.
Figure 13: Computer systems design and related services LQ, 2022
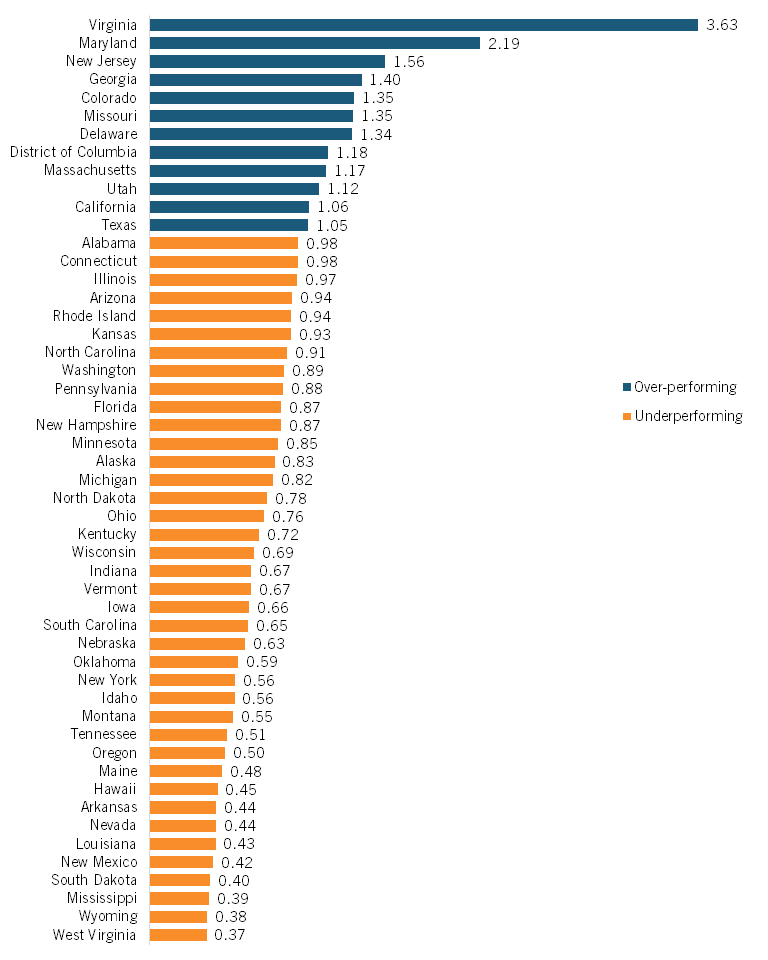
Virginia leads with an LQ of 3.63 (figure 13), driven by federal agencies and defense contractors near D.C. Maryland follows at 2.19, with New Jersey (1.56), Georgia (1.40), and Colorado (1.35) next. These states benefit from government contracts, tech corridors, and access to technical talent.
Most states have LQs below 1.00, demonstrating an overall underperformance in this industry. Despite large economies, Illinois (0.97) and New York (0.56) underperform. The Deep South and Mountain West show low concentrations, with Mississippi (0.39), Wyoming (0.38), and West Virginia (0.37) at the bottom. This suggests that the industry clusters in regions with government presence or established tech hubs.
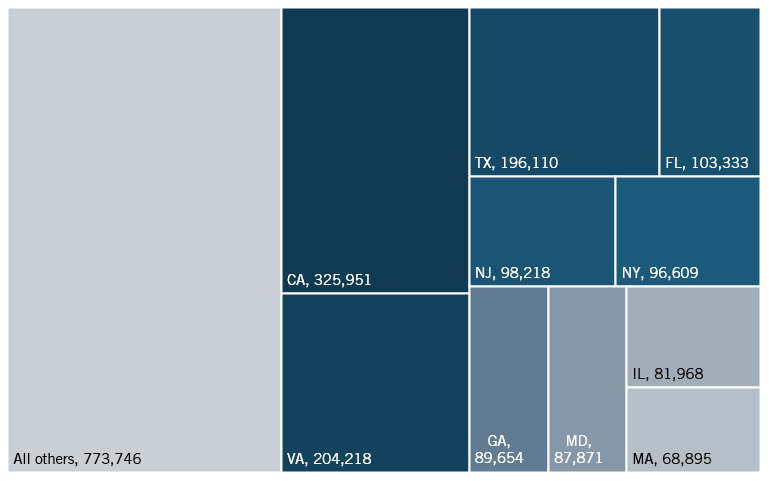
Like other tech industries, California leads the nation in computer systems design and related services employment (figure 14), with over 325,000 individuals working in the industry—far more than any other state. Virginia and Texas also have a strong presence, employing over 200,000 and 196,000 people, respectively, reflecting their roles as major technology and government contracting hubs. Florida and New Jersey each have close to 100,000 jobs in this industry, while New York, Georgia, and Maryland also have large workforces. Despite California’s dominance, employment in this industry is more evenly distributed than in certain other IT sectors, with many states playing a key role in IT services and consulting. 773,746 employees work in states outside the top contributors, emphasizing the industry’s broad national reach.
Figure 14: Number of employees in computer systems design and related services (top 10 states, and all others)
Electrical Equipment
The electrical equipment industry grouping is comprised of seven subindustries: engine, turbine, and power transmission equipment; household appliances; electric lamp bulbs and parts; power equipment; batteries; fiber optic cable; and wire devices.
Figure 15: Electrical equipment manufacturing industry group LQ, 2022
Engine, Turbine, and Power Transmission Equipment Manufacturing
Engine, turbine, and power transmission equipment manufacturing involves the production of power generation and transfer equipment. This includes power plant turbines, industrial machinery engines, gears, speed changers, and other mechanical power transmission equipment. These manufacturers are critical to energy production, transportation, and industrial operations across the United States.
Figure 16: Engine, turbine, and power transmission equipment manufacturing equipment LQ, 2022
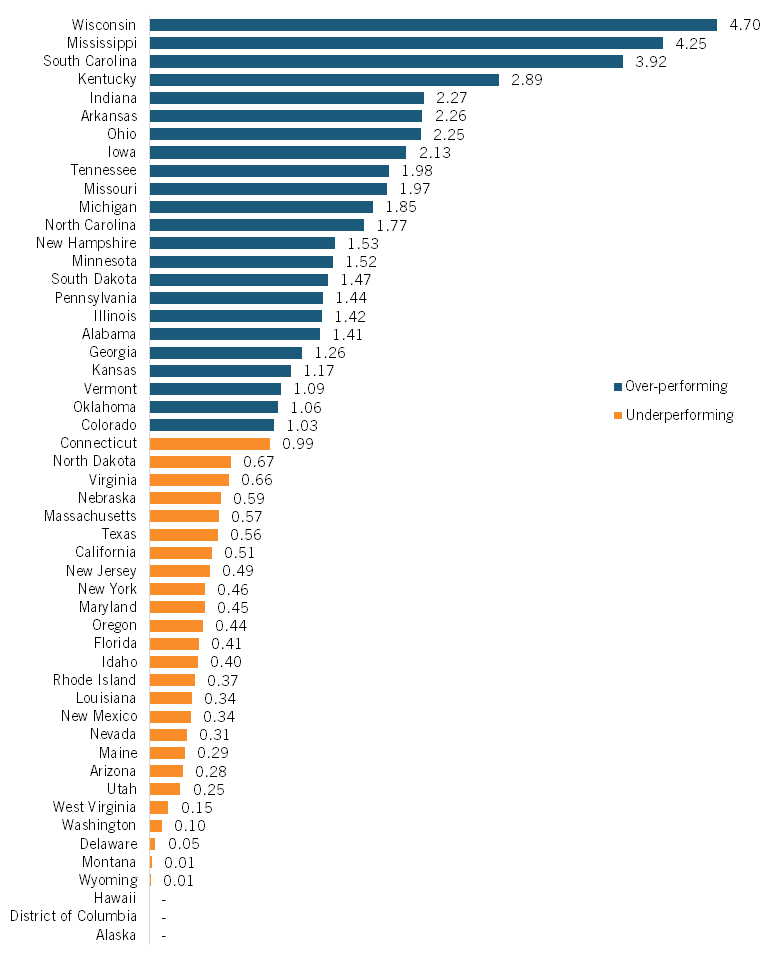
Indiana leads the nation with an LQ of 6.02, followed by Mississippi (5.44) and South Carolina (5.10). (See figure 16.) Wisconsin (3.62), Michigan (3.29), and Colorado (3.06) also show strong concentration in this industry. These states have developed manufacturing clusters supported by skilled labor, proximity to end users, and established supply chains.
Many states underperform, with LQs below 1.00 or even at 0.00. Several states, including Hawaii, D.C., Delaware, and Alaska, have a minimal presence in this industry, all showing LQs of 0.00. Even states with significant manufacturing bases, such as Kentucky (0.80) and Georgia (0.60), show lower concentrations than expected. Ten states record no measurable employment in this sector, highlighting its geographic concentration in specific regions.
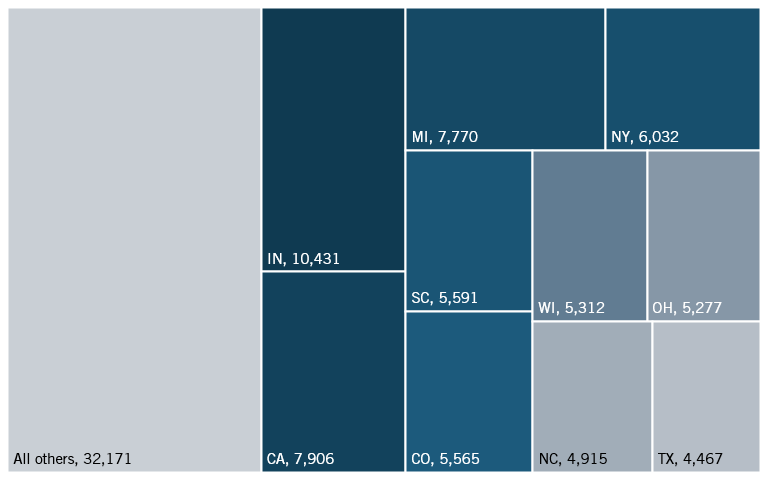
Indiana leads the engine, turbine, and power transmission equipment manufacturing industry in LQ and absolute employment (10,431 employees), making it the top state in this sector (figure 17). Despite its modest LQ, California follows with 7,906 workers, closely trailed by Michigan at 7,770. Several states with high LQs, such as Mississippi (2,714) and North Dakota (650), do not employ many employees relative to other states. All other states outside the top 10 employ over 32,000 individuals, or one-third of total employees in the domestic industry.
Figure 17: Number of employees in engine, turbine, and power transmission equipment manufacturing (top 10 states, and all others)
Household Appliance Manufacturing
The household appliance manufacturing industry produces electrical and gas-powered appliances for home use. These include major appliances such as refrigerators, washing machines, and ovens, and smaller appliances such as microwave ovens, blenders, and vacuum cleaners. This industry is essential for modern domestic life and represents a significant segment of consumer durables manufacturing in the United States. Many of the goods produced in this industry are traditionally imported from nations such as China, so developing a manufacturing base is essential for U.S. trade independence.
Figure 18: Household appliance manufacturing LQ, 2022
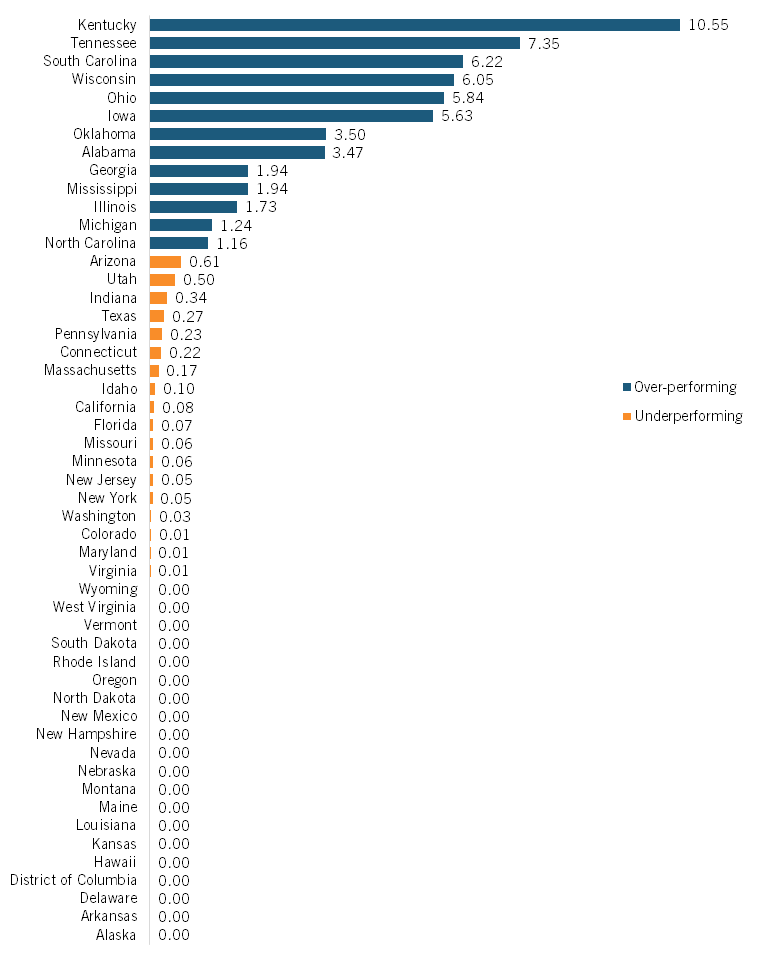
Kentucky dominates the industry with an LQ of 10.55 (figure 18), indicating an appliance manufacturing concentration over 10 times the national average. Tennessee follows with an LQ of 7.35, while South Carolina (6.22), Wisconsin (6.05), Ohio (5.84), and Iowa (5.63) also show strong concentrations. These states benefit from established manufacturing infrastructure, skilled labor forces, and strategic locations for distribution across the country.
Most states show minimal presence in this industry, with many recording LQs of 0.00, indicating no significant appliance manufacturing activity. Even large manufacturing states such as Indiana (0.34), Texas (0.27), and Pennsylvania (0.23) show surprisingly low concentrations. California and New York, despite their large economies, have very low LQs of 0.08 and 0.05, respectively. Twenty-three states show no measurable employment in this sector, highlighting its concentrated nature in specific manufacturing regions.
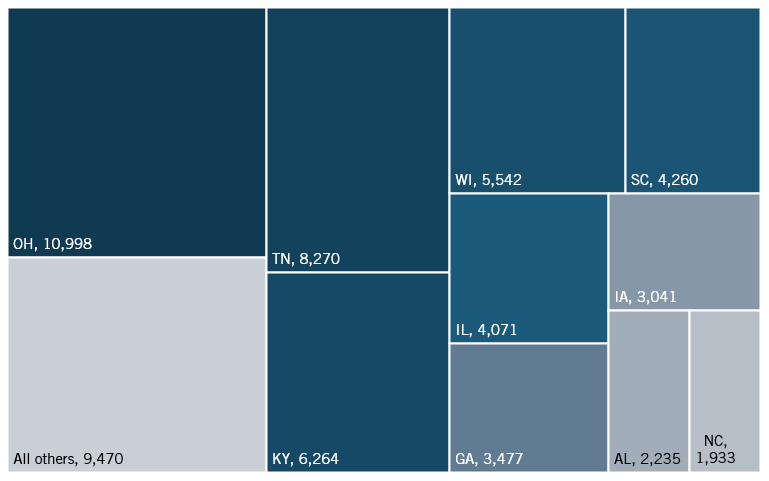
In absolute terms (figure 19), Ohio employs the most workers in the household appliance manufacturing industry, with 10,998 employees. Tennessee follows with 8,270 workers, while Kentucky, the leading state in relative employment, employs 6,264 individuals. Almost 50 percent of all household appliance manufacturing industry employees are located in those three states. Wisconsin and South Carolina also play notable roles, with 5,542 and 4,260 employees, respectively. The remaining 40 states and D.C. collectively employ 9,470 individuals.
Figure 19: Number of employees in household appliance manufacturing (top 10 states, and all others)
Electric Lamp Bulb and Part Manufacturing
The electric lamp bulb and part manufacturing industry produces lighting components from incandescent bulbs to LED lights, fluorescent tubes, and parts. It provides residential and commercial lighting while adapting to energy-efficient technologies and smart lighting systems.
Figure 20: Electric lamp bulb and part manufacturing LQ, 2022
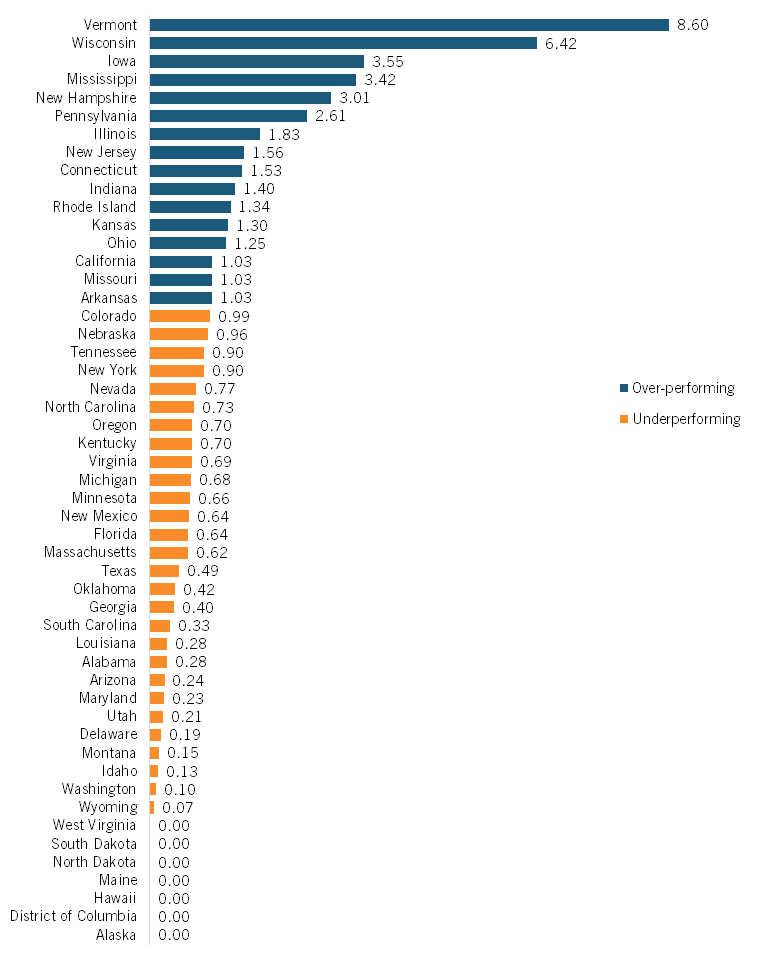
Vermont leads with an LQ of 8.60, followed by Wisconsin at 6.42. Iowa (3.55), Mississippi (3.42), and New Hampshire (3.01) also show strong concentrations (figure 20). These states combine manufacturing capabilities with established supply chains and skilled labor.
Most states have LQs below 1.00. Large industrial states such as Michigan (0.68), Texas (0.49), and Georgia (0.40) show low concentrations. Eight states, including Alaska, Hawaii, and Maine, report no employment in the sector. This shows that the industry remains concentrated in specific manufacturing regions, such as the Midwest and Northeast.
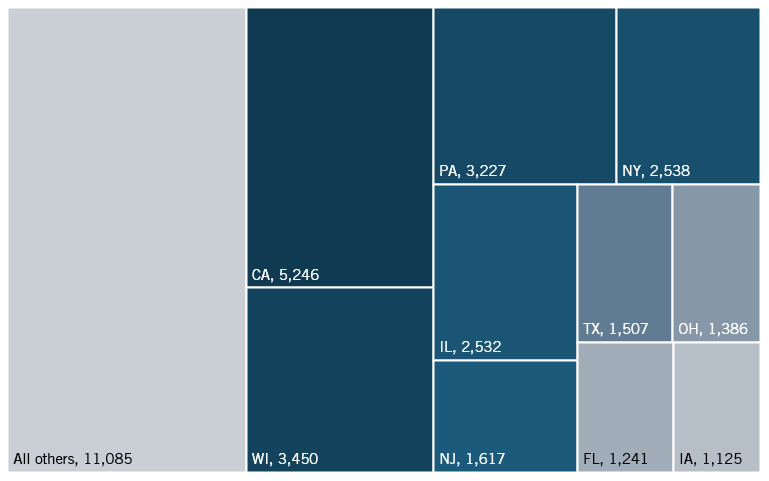
Despite its modest LQ, California leads the electric lamp bulb and part manufacturing industry with 5,246 employees (figure 21). Wisconsin follows with 3,450 workers, while Pennsylvania and New York employ 3,227 and 2,538 individuals. Vermont, which leads the country in relative employment in this industry, employs just 477 employees, or 1 percent of total domestic employment. Other manufacturing hubs in the Midwest, such as Illinois, Ohio, and Iowa, also have many employees in this sector. Due to the wide disbursement of this industry across the country, one in three employees in lamp bulb and part manufacturing are located outside the top 10 states.
Figure 21: Number of employees in electric lamp bulb and parts manufacturing (top 10 states, and all others)
Power Equipment Manufacturing
The power equipment manufacturing industry produces components, machinery, and household and industrial use equipment. It supports energy, transportation, and telecommunications by manufacturing transformers, motors, and switchgear for power generation and distribution.
Figure 22: Power equipment manufacturing LQ, 2022
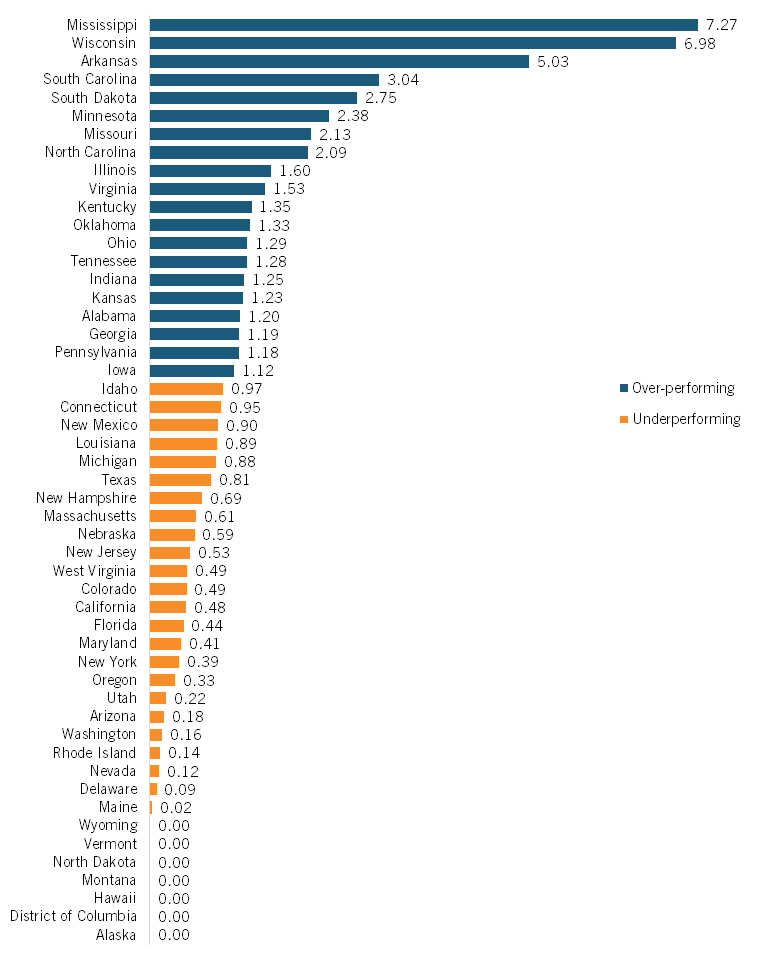
Mississippi leads with an LQ of 7.27, followed by Wisconsin (6.98), Arkansas (5.03), and South Carolina (3.04). (See figure 22.) The Midwest and South dominate due to established manufacturing bases, skilled labor, and business-friendly policies. Other states, such as Kentucky (1.35), Oklahoma (1.33), and Kansas (1.23), over-perform what is expected based on their size.
Several states underperform, with LQs below 1.00. California (0.48), Florida (0.44), and New York (0.39) have fewer industry jobs than expected. Washington (0.16), Nevada (0.12), Rhode Island (0.14), and Delaware (0.09) also lag behind. Alaska, Hawaii, and Vermont have an LQ of 0.00, indicating no significant industry presence.
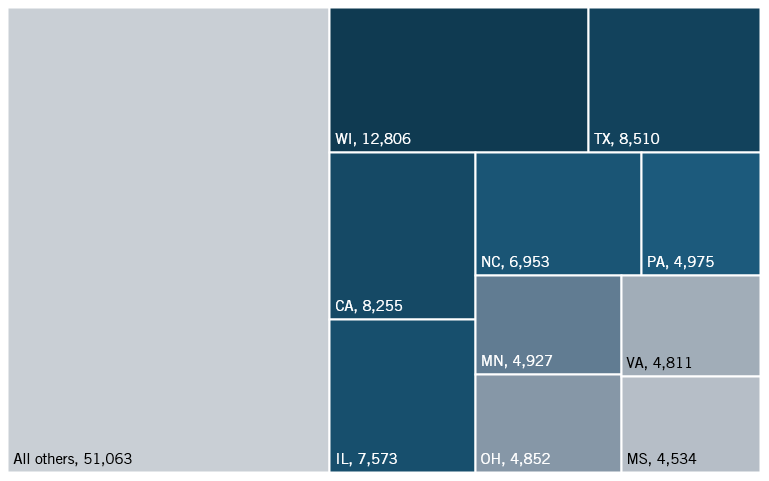
Wisconsin leads the power equipment manufacturing industry with over 12,800 employees, making it the top contributor. Texas and California follow closely, employing over 8,000 workers each, while Illinois employs more than 7,500. Mississippi, the leading state in relative employment, is home to just 4 percent of all individuals working in power equipment manufacturing, making it the state with the 10th-most employees in the country in this industry. Like many other manufacturing sectors, many of the employees in this industry are concentrated in the Midwest, with Pennsylvania, Minnesota, and Ohio all employing just under 5,000 individuals. The remaining states account for over 51,000 individuals or 43 percent of domestic employees in this sector.
Figure 23: Number of employees in power equipment manufacturing (top 10 states, and all others)
Battery Manufacturing
The battery industry includes companies producing energy storage solutions, from small consumer batteries to large-scale industrial and automotive applications. With the rise of electric vehicles, renewable energy storage, and portable electronics, battery manufacturing has become critical for technological advancement and energy sustainability. This industry plays a key role in innovating power sources in the clean energy sector.
Figure 24: Battery manufacturing LQ, 2022
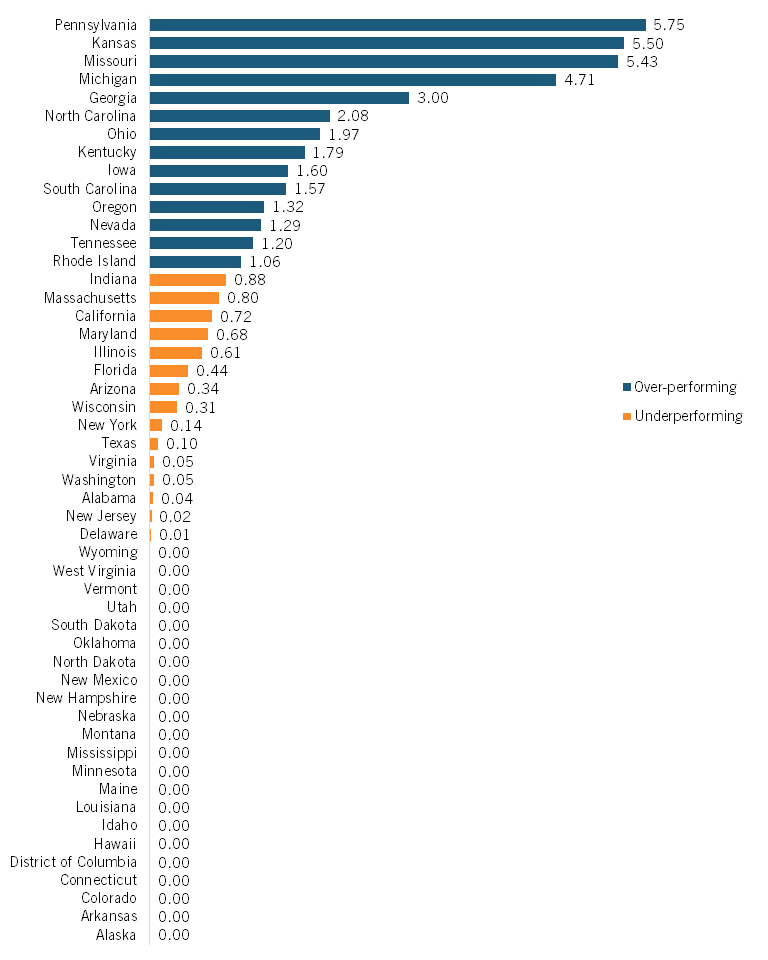
Pennsylvania leads the nation in battery manufacturing with an LQ of 5.75, followed by Kansas (5.50), Missouri (5.43), and Michigan (4.71). (See figure 24.) Georgia (3.00) and North Carolina (2.08) also have substantial concentrations of battery industry employment. These states benefit from major manufacturing facilities, raw materials access, and investments in energy storage technologies. The Midwest and Southeast regions dominate, reflecting their growing role in battery production, particularly for electric vehicles and grid storage.
Many states underperform in this industry, with LQs below 1.00. Large states such as California (0.72), Florida (0.44), and Texas (0.10) have fewer battery manufacturing jobs than expected, despite their size. Other underperforming states include Arizona (0.34), New York (0.14), and Washington (0.05). Several states, including Colorado, Connecticut, and Mississippi, have an LQ of 0.00, indicating little to no battery manufacturing presence.
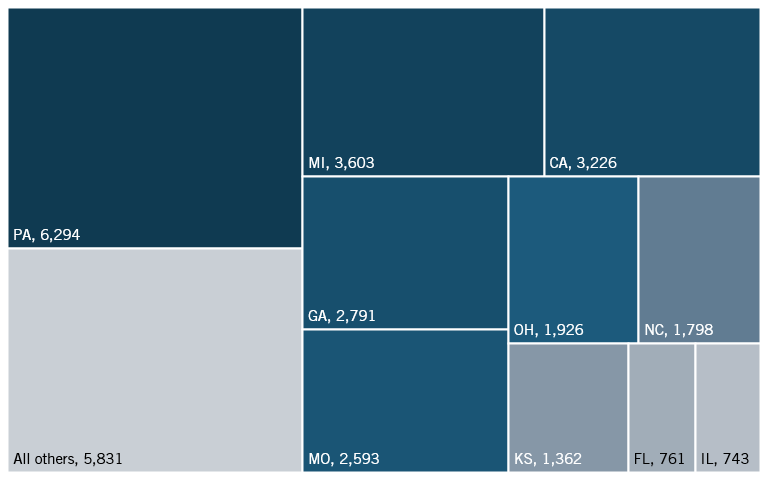
Unsurprisingly, given its high LQ, Pennsylvania leads the battery manufacturing industry with 6,294 employees (figure 25). Michigan and California follow with 3,603 and 3,226 workers, respectively. Georgia employs 2,791 individuals, while Missouri contributes 2,593. Similar to other electrical equipment manufacturing industries, all other major employers in the battery industry are located in the Midwest and Southeast. Ohio, North Carolina, and Kansas are all significant employers as well. Nineteen percent of employees in the battery manufacturing sector are located in states outside the top 10.
Figure 25: Number of employees in battery manufacturing (top 10 states, and all others)
Fiber Optic Cable Manufacturing
The fiber optic cable manufacturing industry produces high-speed telecommunications cables, Internet infrastructure, and data transmission. These cables, made from thin strands of glass or plastic, enable faster and more reliable data transfer than does traditional copper wiring. As global demand for broadband and 5G networks increases, fiber optic manufacturing is crucial in expanding connectivity and supporting digital transformation.
Figure 26: Fiber optic cable manufacturing LQ, 2022
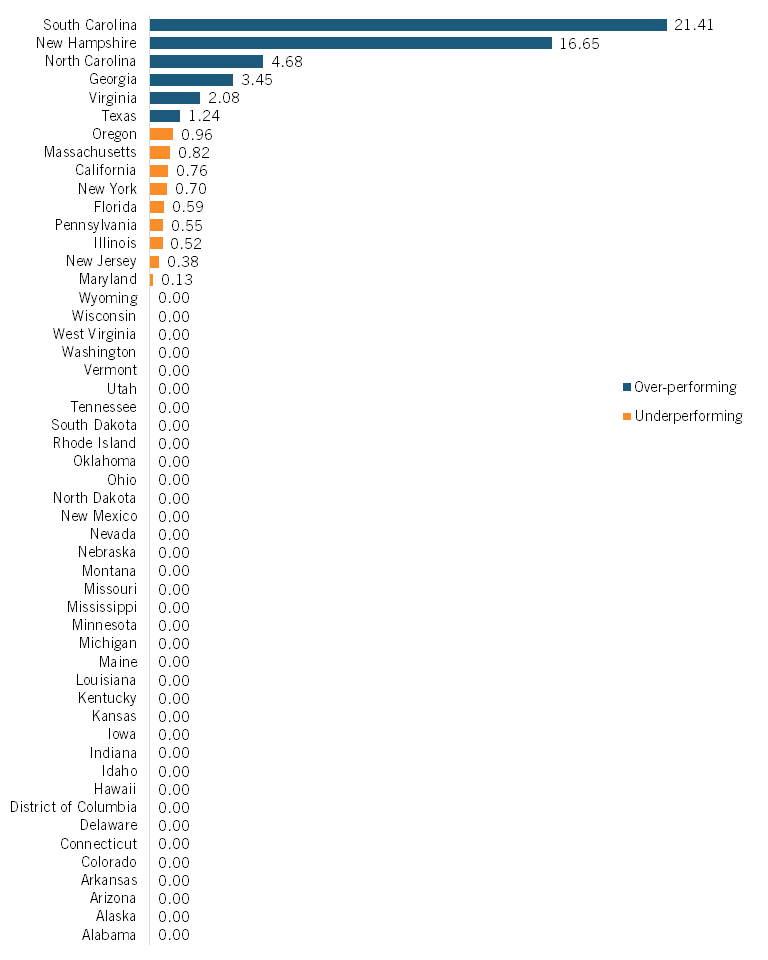
South Carolina leads the nation in fiber optic cable manufacturing by far (figure 26), with an LQ of 21.41, followed by New Hampshire (16.65), North Carolina (4.68), and Georgia (3.45). These states have a strong industry presence due to significant investment in broadband infrastructure. Virginia (2.08) and Texas (1.24) also outperform, benefiting from proximity to technology hubs and a growing demand for fiber networks.
Many states underperform in this industry, with LQs below 1.00. Large economies such as California (0.76), New York (0.70), and Florida (0.59) have fewer fiber optic manufacturing jobs than expected. Other underperforming states include Pennsylvania (0.55), Illinois (0.52), and New Jersey (0.38). Thirty-six states, including Ohio, Michigan, and Arizona, have an LQ of 0.00, indicating little to no industry presence.
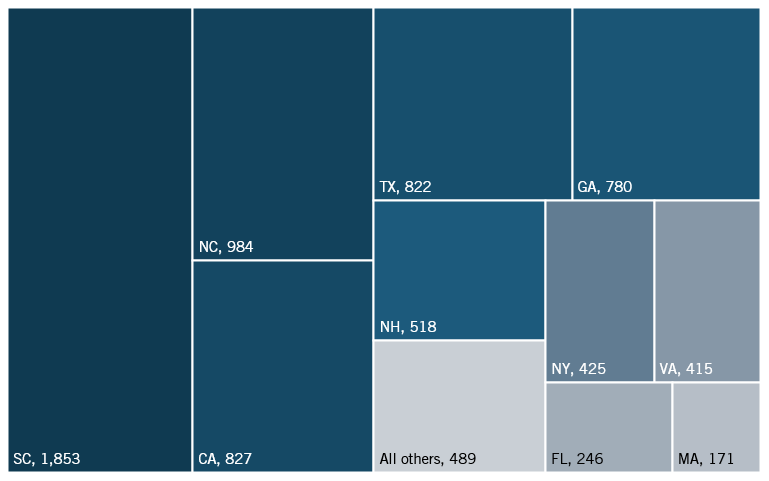
One-fourth of all fiber optic cable manufacturing employees are employed in South Carolina (1,853), almost twice as many as the second largest employer, North Carolina (984). California (827), Texas (822), and Georgia (780) also have a significant presence in the industry (figure 27). Considering the small size of the fiber optic cable industry (only 7,530 total employees in the United States), few other states manufacture this complex technology; 70 percent of all fiber optic cable manufacturing workers are employed in the previously listed five states.
Figure 27: Number of employees in fiber optic cable manufacturing (top 10 states, and all others)
Wiring Device Manufacturing
The wiring device manufacturing industry produces electrical components such as switches, outlets, and connectors for residential, commercial, and industrial electrical systems. These products support modern infrastructure, from home wiring to large-scale power distribution.
Figure 28: Wiring device manufacturing LQ, 2022
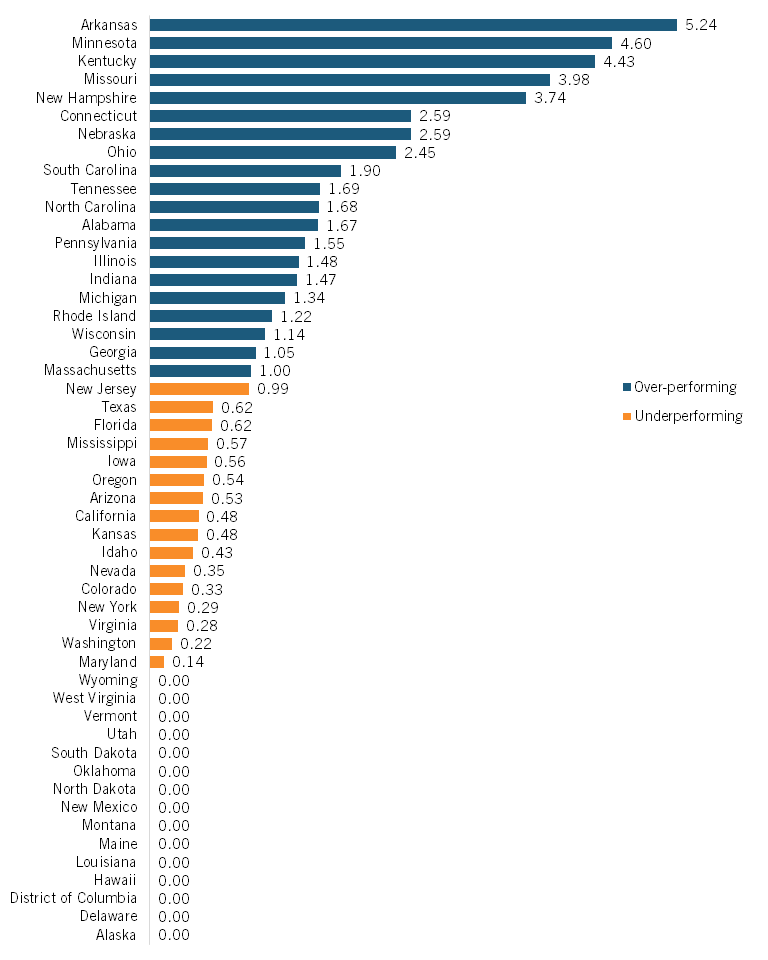
Arkansas leads with an LQ of 5.24 (figure 28), followed by Minnesota (4.60), Kentucky (4.43), and Missouri (3.98). Other strong states include New Hampshire (3.74), Connecticut (2.59), Nebraska (2.59), and Ohio (2.45). The states over-performing in wiring device manufacturing differ significantly in geographic location, indicating the broad range of technologies included within wiring device technologies.
Many states underperform, with LQs below 1.00, indicating less employment in wiring device manufacturing than expected. Large states such as Texas (0.62), California (0.48), and New York (0.29) fall below average. Fifteen states, including West Virginia, North Dakota, and Montana, have an LQ of 0.00, showing no industry presence.
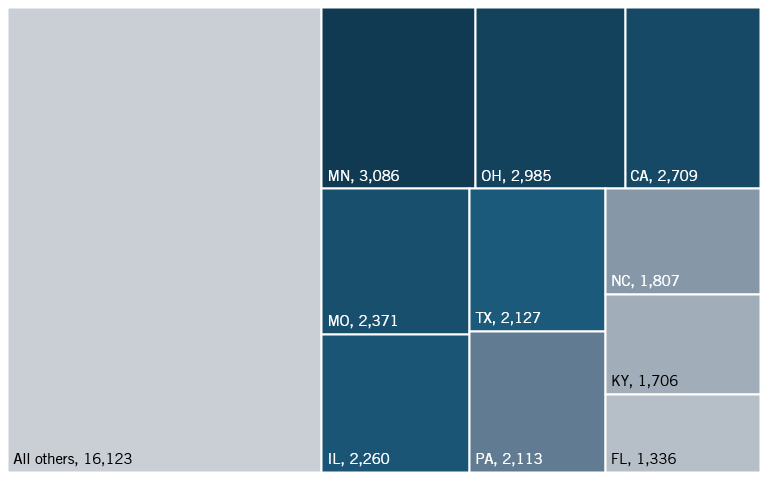
Minnesota leads the wiring device manufacturing industry with 3,086 employees, followed closely by Ohio with 2,985 workers (figure 29). California has 2,709 employees, while Missouri, Illinois, Texas, and Pennsylvania employ over 2,000 individuals each. Arkansas, the state with the highest LQ, employs 1,274 individuals, placing it just out of the top 10 in absolute employment ranks. The remaining states account for 16,123 employees, highlighting a dispersed but focused workforce, with Minnesota at the forefront.
Figure 29: Number of employees in wiring device manufacturing (top 10 states, and all others)
Motor Vehicles
The motor vehicles industry group is comprised of three subindustries: automobiles and light-duty motor vehicles; motor vehicles bodies and trailers; and motor vehicle parts.
Figure 30: Motor vehicle manufacturing industry group LQ, 2022
Automobile and Light-Duty Motor Vehicle Manufacturing
The automobile and light-duty motor vehicle manufacturing industry produces passenger cars, SUVs, and light trucks. This sector includes vehicle assembly, parts production, and technological innovations in fuel efficiency and electric vehicles. It plays a vital role in the U.S. economy, supporting manufacturing, engineering, and supply chain jobs. The motor vehicles sector has become more innovative due to new electric and self-driving car developments.
Figure 31: Automobile and light-duty motor vehicle manufacturing LQ, 2022
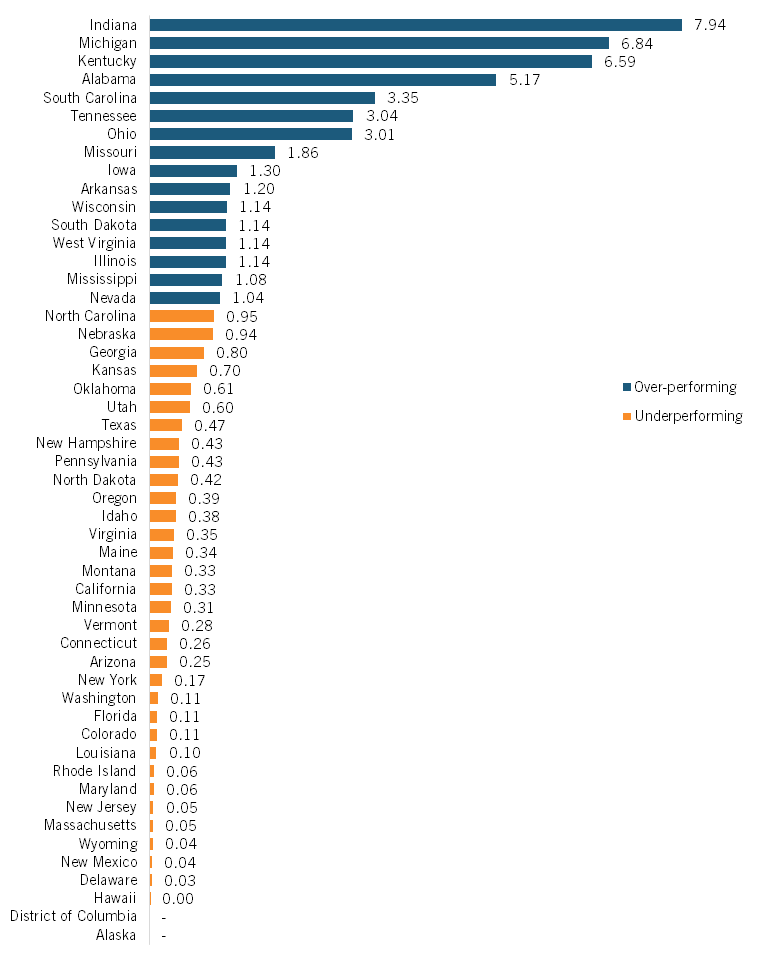
Kentucky leads the nation with an LQ of 10.10 (figure 31), followed by Alabama (7.34), Michigan (7.18), and South Carolina (5.70). Other strong performers include Indiana (5.53), Nevada (4.24), Missouri (3.00), and Tennessee (2.72). These states benefit from established automotive plants, skilled labor, and proximity to suppliers, making them key vehicle producers.
Many states underperform, with LQs below 1.00, indicating a lower concentration of employment in this industry. Large states such as California (0.76), Texas (0.63), and New York (0.10) fall below average. Others, including Arizona (0.27), Virginia (0.05), and Minnesota (0.03), have minimal industry presence. Several states, such as Florida, Massachusetts, and Colorado, have an LQ of 0.00, showing no significant employment in vehicle manufacturing.
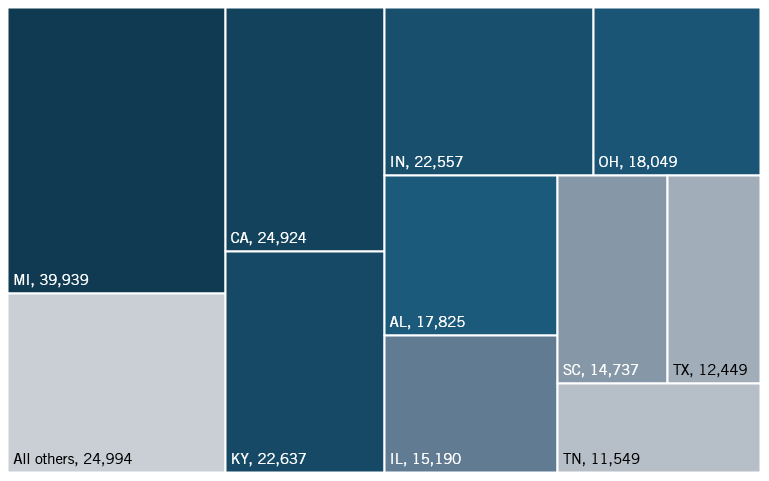
Michigan employs 39,939 individuals in the automobile and light-duty motor vehicle manufacturing industry, leading all other states in absolute employment. California has 24,924 employees, while Indiana and Kentucky employ over 22,000 people. States in the South and Midwest round out the top 10, with Ohio, Alabama, and Illinois each accounting for more than 15,000 persons employed in the industry. The remaining states collectively employ 24,994 workers, indicating a more minor but notable presence in the industry (11 percent of all employees domestically). Nevada, which over-performs in this industry with an LQ of 4.24, is not featured in the top 10.
Figure 32: Number of employees in automobile and light-duty motor vehicle manufacturing by state (top 10 states, and all others)
Motor Vehicle Body and Trailer Manufacturing
The motor vehicle body and trailer manufacturing industry produces vehicle frames, truck trailers, and specialty vehicle bodies, which are essential for transportation and logistics. This sector is crucial in the automotive supply chain, supporting commercial transportation, logistics, and personal vehicle markets. It also contributes significantly to the industrial and transportation economy.
Figure 33: Motor vehicle body and trailer manufacturing LQ, 2022
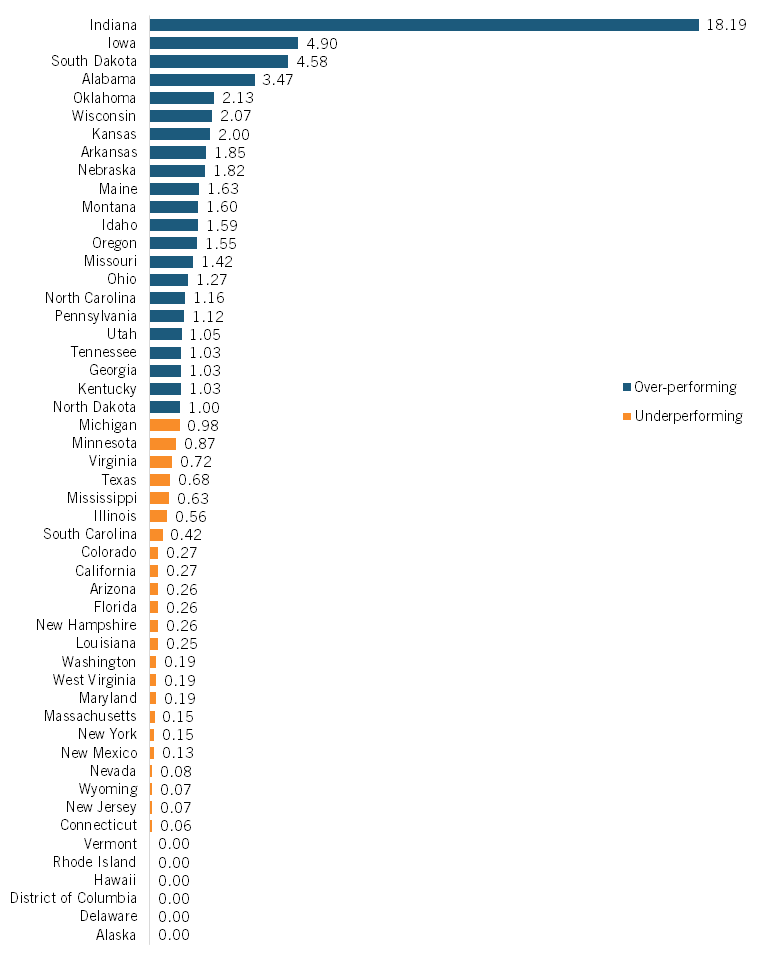
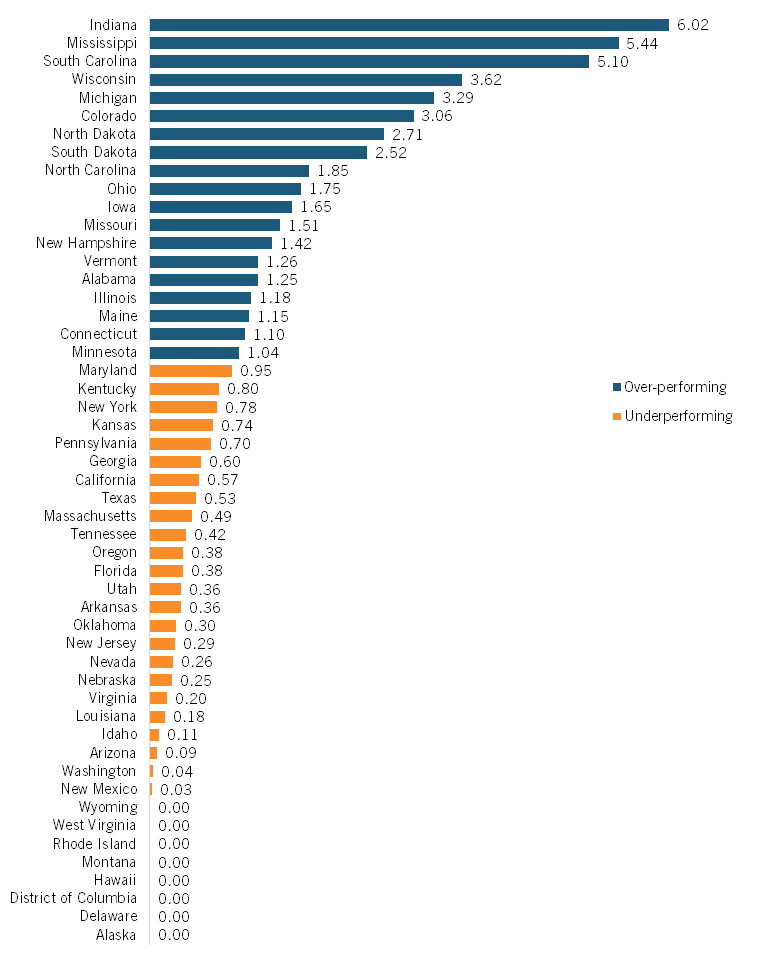
Indiana leads with an LQ of 18.19 (figure 33), followed by Iowa (4.90), South Dakota (4.58), and Alabama (3.47). Strong performers include Oklahoma (2.13) and Wisconsin (2.07), which benefit from industrial expertise and a strategic location surrounded by other states with large car manufacturing capacities.
Many states underperform, including California (0.27), Florida (0.26), and New York (0.15), where service and tech industries dominate. Vermont, Rhode Island, and several other small Northeastern and Mid-Atlantic states (0.00) lack the infrastructure and workforce for large-scale manufacturing, keeping the industry concentrated in the Midwest and South.
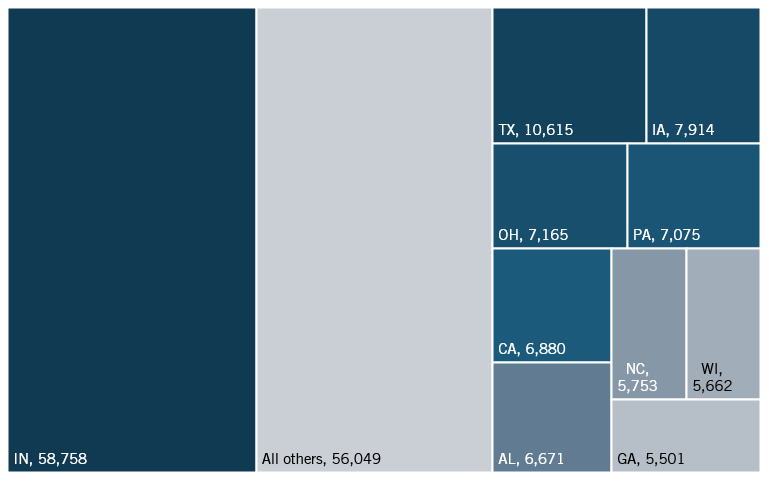
Unsurprisingly, given its significant LQ, Indiana leads the motor vehicle body and trailer manufacturing industry, employing 58,758 individuals, one-third of domestic employment (figure 34). Texas follows with 10,615 employees, while the Midwestern manufacturing centers of Iowa (7,914), Ohio (7,165), and Pennsylvania (7,075) round out the top five states. Like other manufacturing industries, the prevalence of the South and Midwestern regions is significant. All other states account for 56,049 employees, 31 percent of total domestic employment. Indiana plays a dominant role in the industry, while other states maintain a smaller, supportive presence.
Figure 34: Motor vehicle body and trailer manufacturing (top 10 states, and all others)
Motor Vehicle Parts Manufacturing
The motor vehicle parts manufacturing industry produces essential automobile components, including engines, transmissions, and electrical systems. This sector supports vehicle assembly plants and the aftermarket repair industry, which is critical in the automotive supply chain.
Figure 35: Motor vehicle parts manufacturing LQ, 2022
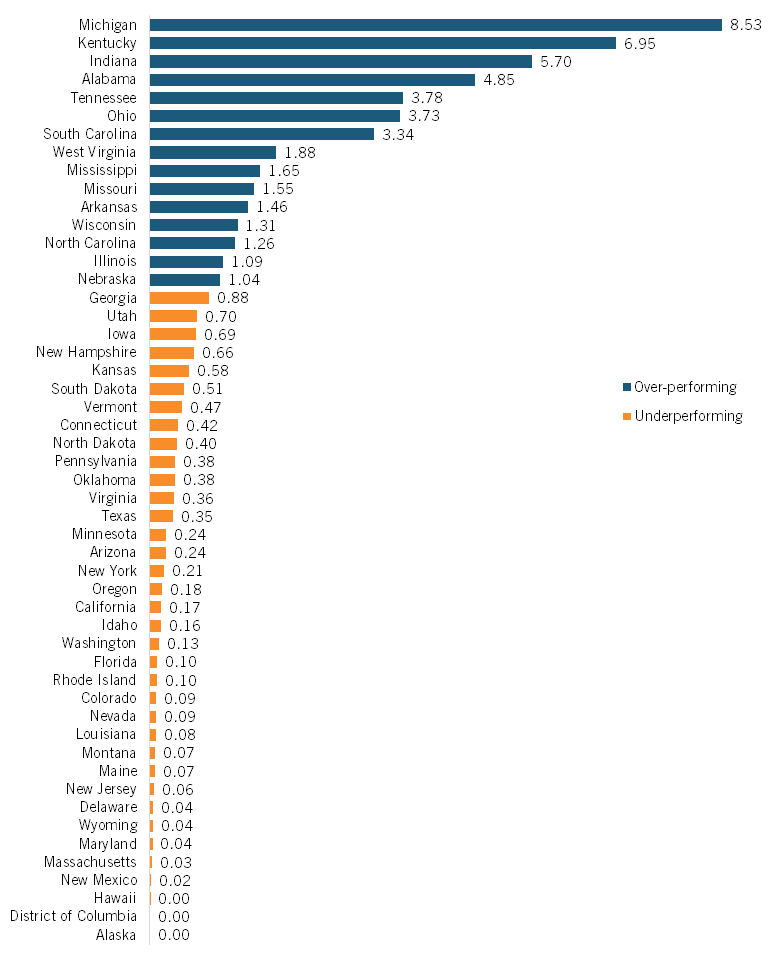
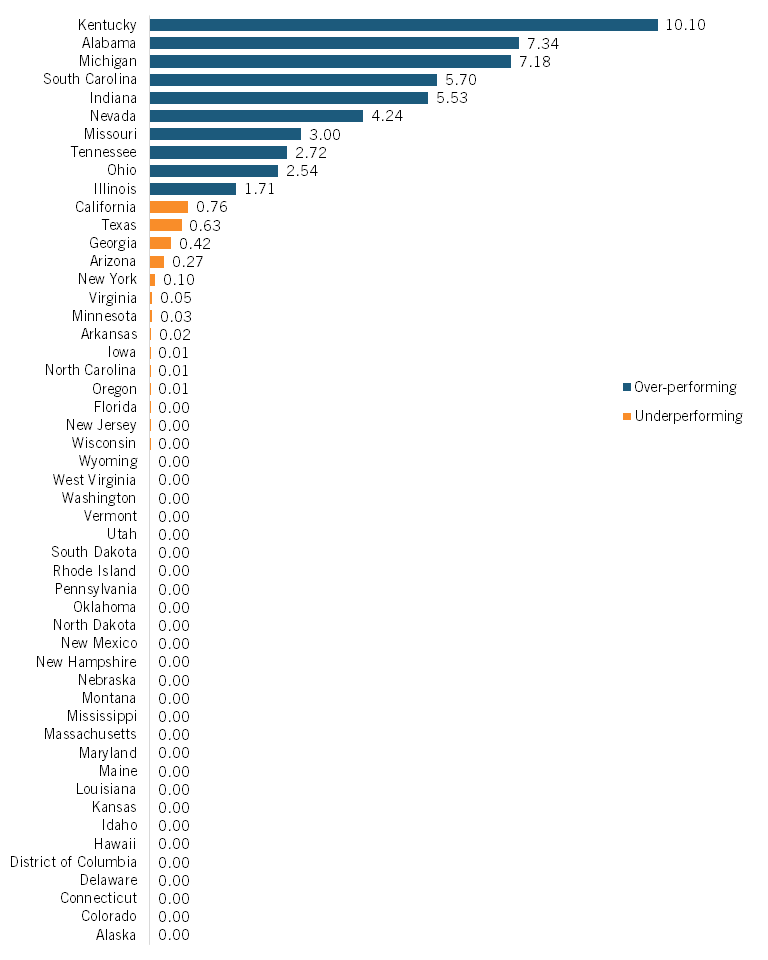
Michigan leads with an LQ of 8.53, reflecting its deep automotive roots (figure 35). Kentucky (6.95), Indiana (5.70), and Alabama (4.85) follow, benefiting from significant auto plants and supplier networks. Strong performers include Tennessee (3.78) and Ohio (3.73), reinforcing the Midwest and South as manufacturing hubs.
Many states underperform, including Texas (0.35), New York (0.21), and California (0.17), where tech and service industries dominate. Coastal states such as Washington (0.13) and Massachusetts (0.03) lack the necessary industrial infrastructure, while Alaska, D.C., and Hawaii (0.00) have no significant presence in the sector.
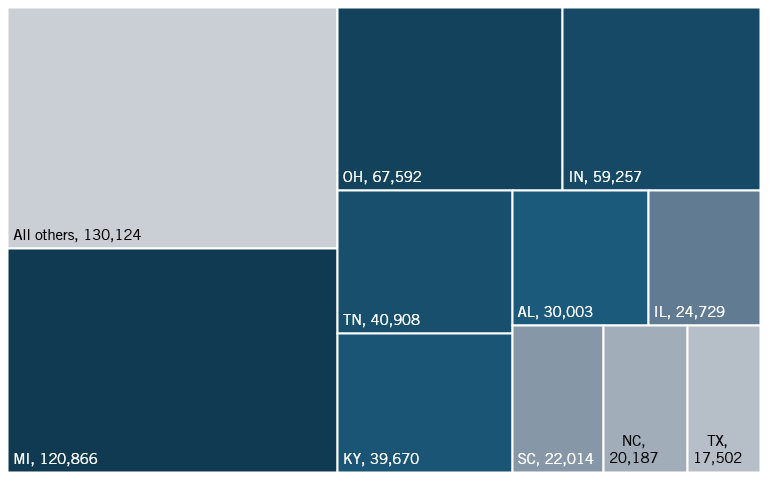
Michigan dominates motor vehicle parts manufacturing with 120,866 employees (figure 36), followed by Ohio (67,592), Indiana (59,257), and Tennessee (40,908). Half of all employment in this industry is concentrated in these four states. Kentucky and Alabama employ over 30,000 each, while Southern states such as South Carolina, North Carolina, and Texas round out the top 10 largest producers of motor vehicle parts. Despite significant concentration in four states, this industry is widely dispersed among many U.S. states. The remaining states collectively account for over 130,000 employees.
Figure 36: Motor vehicle parts manufacturing (top 10 states, and all others)
Machinery and Equipment
The machinery manufacturing industry produces equipment for agriculture, construction, and industrial applications, including machine tools, mechanical systems, and heavy machinery. This sector supports infrastructure, transportation, and automation, making it essential for various industries.
Figure 37: Machinery manufacturing LQ, 2022
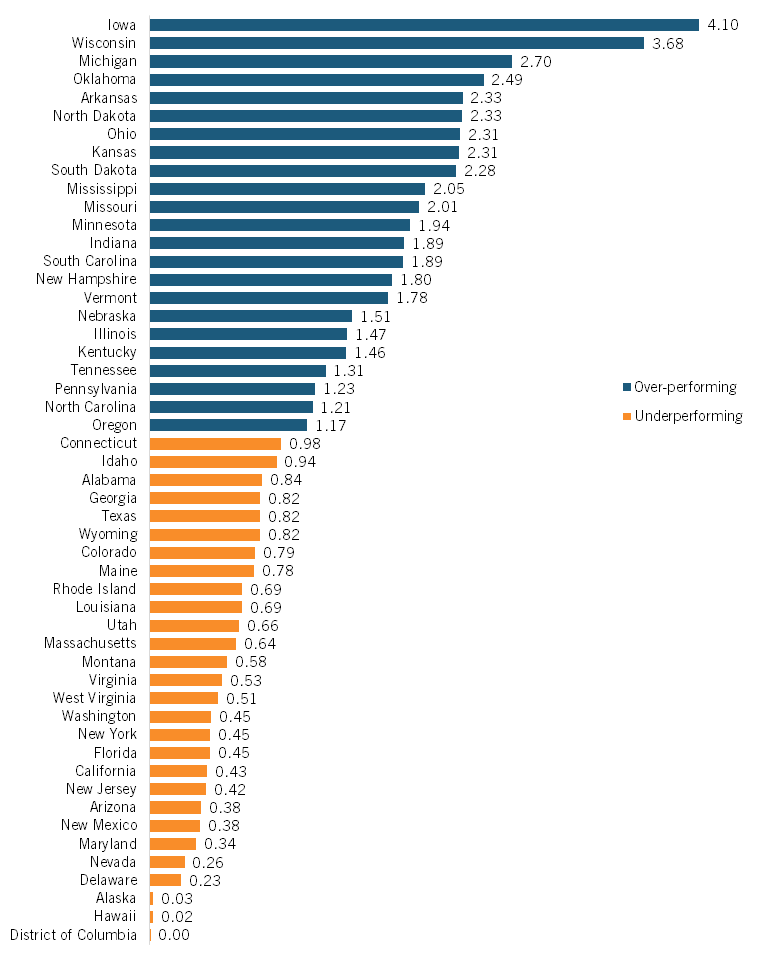
Iowa leads with an LQ of 4.10 (figure 37), followed by Wisconsin (3.68) and Michigan (2.70), another indication of the strong manufacturing sector concentrated in the Midwest. Other top states include Arkansas (2.33), North Dakota (2.33), and Oklahoma (2.49), all of which have large agricultural sectors requiring a significant amount of machinery stock.
Underperforming states include New York (0.45), Florida (0.45), and California (0.43), where service-based and advanced technology industries dominate. Generally, states specializing in high-tech industries underperform in machinery manufacturing, with Massachusetts (0.64) and Washington (0.45) lacking a strong manufacturing presence. Alaska (0.03) and Hawaii (0.02), states specializing in energy production and tourism, respectively, have minimal industry activity.
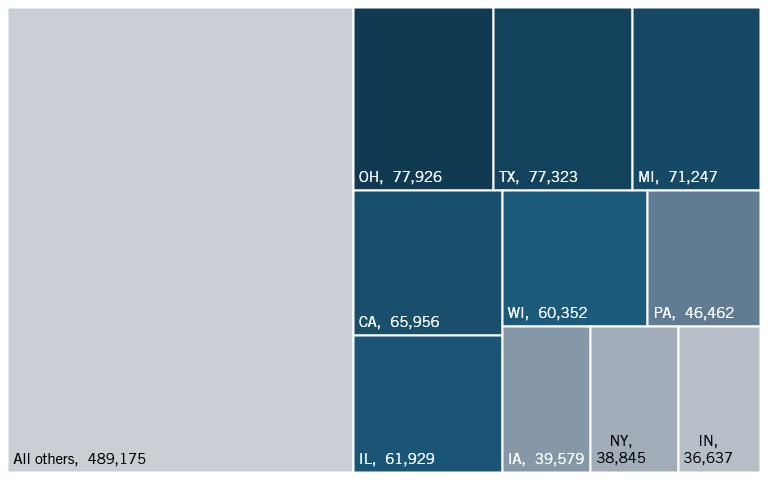
In absolute terms, Ohio leads the machinery manufacturing industry with 77,926 employees, followed closely by Texas with 77,323 and Michigan with 71,247. California, Illinois, and Wisconsin also contribute significantly, each employing 6 percent of total machinery manufacturing employees nationwide. Iowa, an agricultural hub that benefits from producing agrarian machinery, employs close to 40,000 individuals. The remaining states collectively account for 489,175 workers (46 percent of the nationwide workforce), highlighting the widespread distribution of this industry.
Figure 38: Number of employees in machinery manufacturing (top 10 states, and all others)
Computers, Electronics, and Optical Products
The computer and electronic product manufacturing industry designs and produces computers, semiconductors, and electronic devices essential to many sectors, including telecommunications, aerospace, and healthcare. This industry drives technological innovation and strengthens U.S. global competitiveness. As this industry includes semiconductors, it is now fiercely competed over internationally.
Figure 39: Computer and electronic manufacturing LQ, 2022
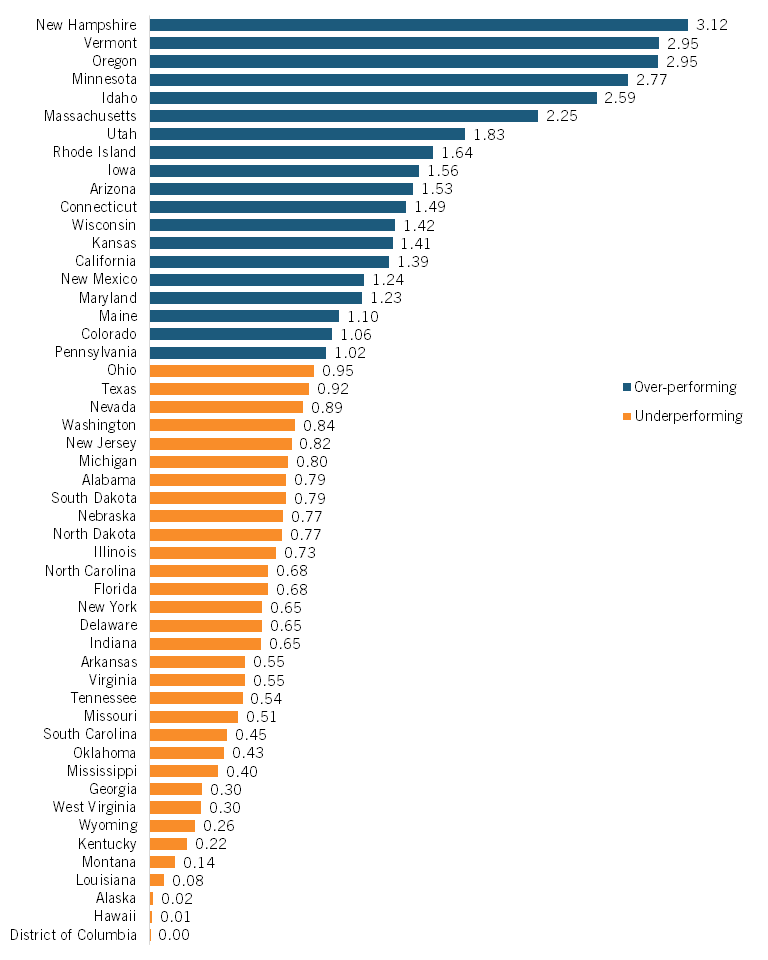
New Hampshire leads the nation in relative employment concentration in this industry, with an LQ of 3.12, indicating that it has more than three times the national average concentration of computer and electronic product manufacturing jobs. Other high-performing states include Vermont and Oregon (2.95), Minnesota (2.77), and Idaho (2.59), all of which have strong technology and manufacturing ecosystems. These states benefit from skilled labor, investment in research and development (R&D), and proximity to major tech hubs or specialized industries that drive growth in computer and electronics manufacturing.
Many states underperform in this industry, highlighting the geographic concentration of high-tech manufacturing in certain regions. States such as Texas (0.92), Nevada (0.89), Washington (0.84), and New Jersey (0.82) fall below the national average in employment concentration in this sector. The lowest-performing states include Louisiana (0.08), Alaska (0.02), and Hawaii (0.01), with the District of Columbia (0.00) having virtually no presence in the industry.
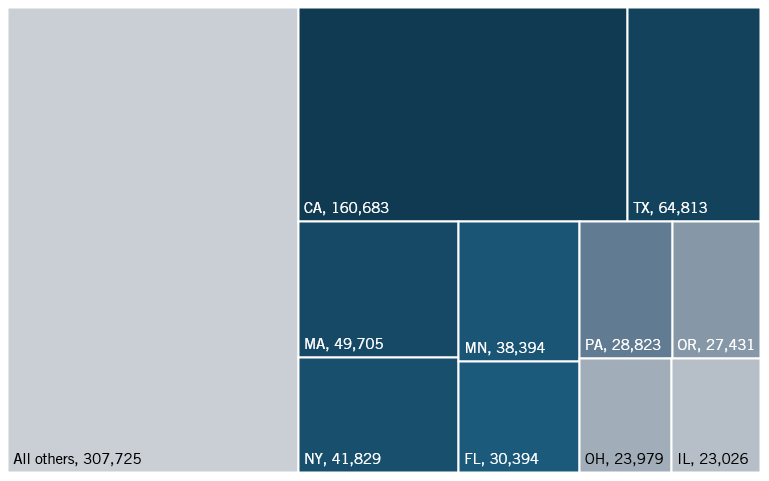
With 160,683 employees, California dominates the computer and electronic product manufacturing industry, far ahead of other states (figure 40). Texas ranks second with 64,813 workers, less than half that of California’s computer and electronic workforce. Massachusetts and New York employ 49,705 and 41,829 individuals, respectively. Minnesota and Florida contribute significantly as well, with over 30,000 employees each. Despite their high LQs, New Hampshire and Vermont employ 1 percent and less than 1 percent of employees in computer and electronic production, respectively, indicating that while these industries are very concentrated in these states, they are not very large in absolute terms. The remaining states collectively account for 307,725 employees (39 percent of domestic employment), showcasing the industry’s broad national presence despite California’s clear leadership.
Figure 40: Employees in computer and electronic product manufacturing (top 10 states, and all others)
Other Transportation
The other transportation industry group is comprised of three subindustries: aerospace products and parts; railroad rolling stock; and ship and boat building.
Figure 41: Other transportation industry group LQ, 2022
Aerospace Product and Parts Manufacturing
The aerospace product and parts manufacturing industry involves designing, producing, and assembling aircraft, spacecraft, and related components. This sector is critical to national defense, commercial aviation, space exploration, driving engineering, materials science, and technological innovation. The industry supports a highly skilled workforce and contributes significantly to the U.S. economy through exports and technological advancements.
Figure 42: Aerospace product and parts manufacturing LQ, 2022
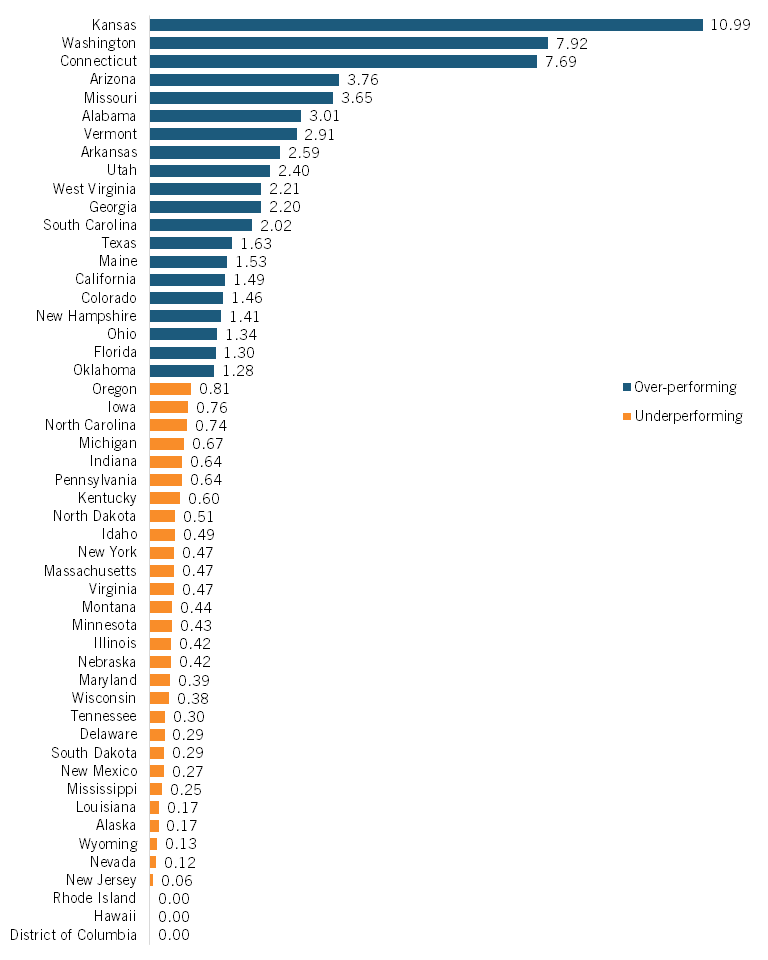
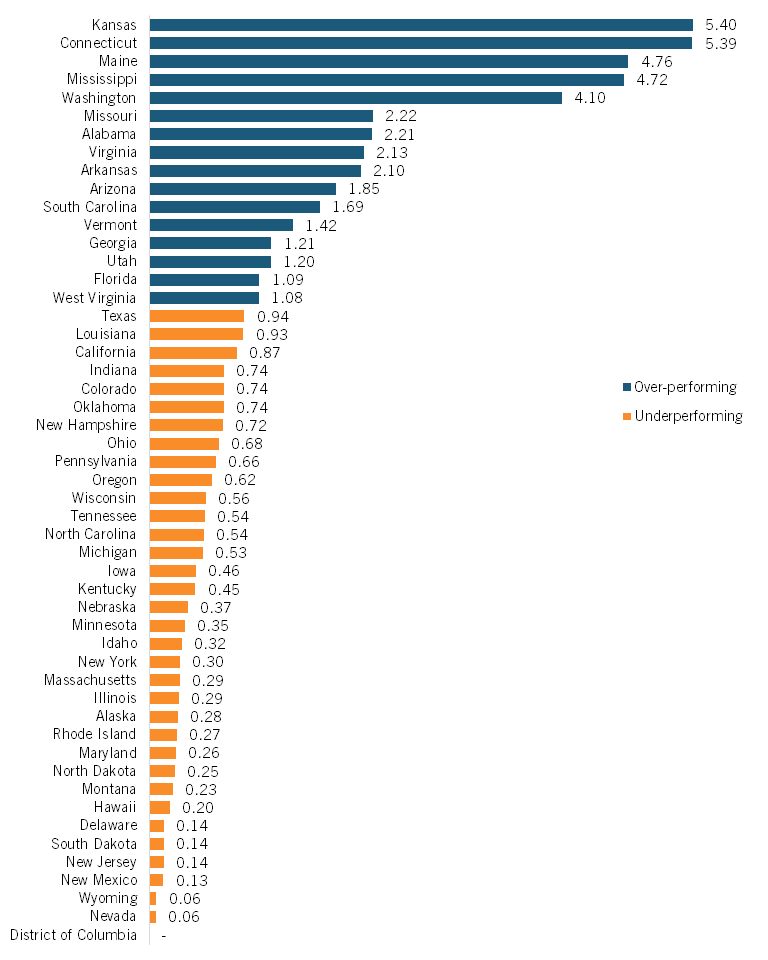
Kansas leads the nation in aerospace manufacturing concentration with an LQ of 10.99 (figure 42), followed by Washington (7.92) and Connecticut (7.69), reflecting their strong aerospace infrastructure and major industry players such as Boeing and Pratt & Whitney. Other high-performing states include Arizona (3.76), Missouri (3.65), and Alabama (3.01), all of which have well-established aerospace clusters benefiting from government contracts, skilled labor, and research institutions.
Many states underperform in this industry, with Oregon (0.81), Iowa (0.76), and North Carolina (0.74) falling below the national average. The lowest LQs are found in Rhode Island (0.00), Hawaii (0.00), and the District of Columbia (0.00), indicating little to no aerospace manufacturing presence.
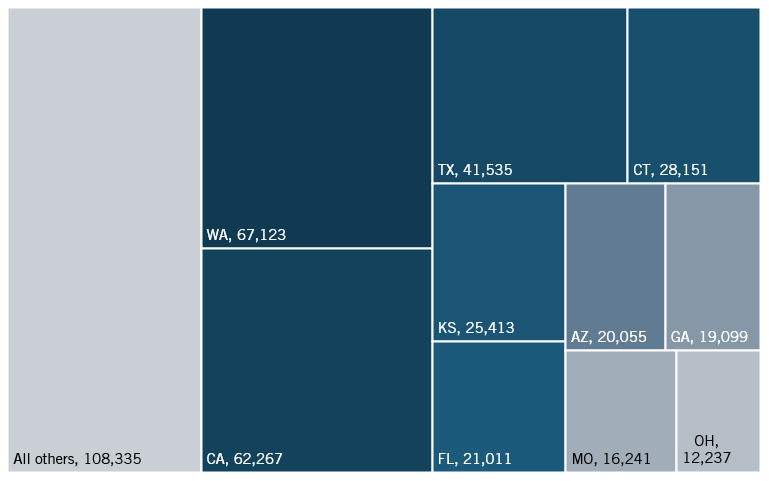
Washington leads the aerospace product and parts manufacturing industry with 67,123 employees, establishing itself as the dominant hub (figure 43). California has 62,267 workers, while Texas, home to SpaceX and many other NASA contracting firms, employs 41,535 employees. Connecticut and Kansas, which have high LQs, also play significant roles, employing 28,151 and 25,413 individuals, respectively. Employees in the aerospace industry are widely dispersed around the United States, with 26 percent of the nationwide workforce located outside the 10 largest states in the industry.
Figure 43: Number of employees in aerospace product and parts manufacturing (top 10 states, and all others)
Railroad Rolling Stock Manufacturing
The railroad rolling stock manufacturing industry produces locomotives, railcars, and related equipment essential for freight and passenger transportation. This sector supports infrastructure, economic growth, and sustainability through specialized manufacturing and innovation.
Figure 44: Railroad rolling stock manufacturing LQ, 2022
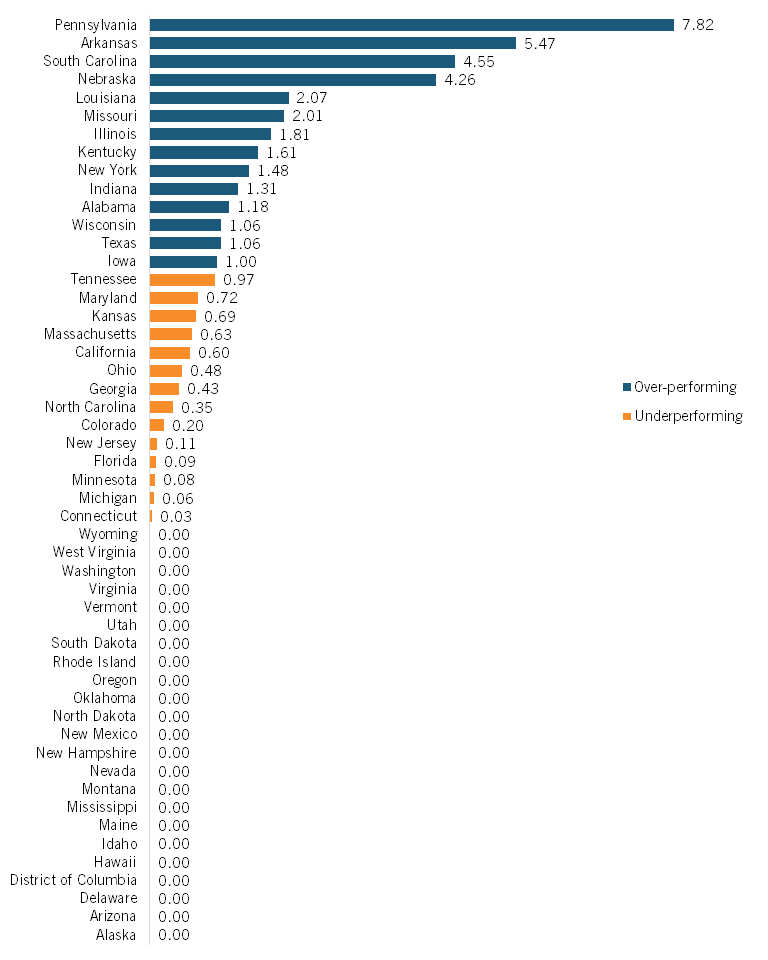
Pennsylvania leads with an LQ of 7.82, followed by Arkansas (5.47), South Carolina (4.55), and Nebraska (4.26) (Figure 44.) Other strong performers include Louisiana (2.07), Missouri (2.01), and Kentucky (1.61), benefiting from industry hubs and transportation networks.
Many states have some industry presence but underperform, including Tennessee (0.97) and Maryland (0.72). Several, such as Virginia, Washington, and Arizona, have an LQ of 0.00, reflecting little to no rail manufacturing presence due to infrastructure and workforce limitations.
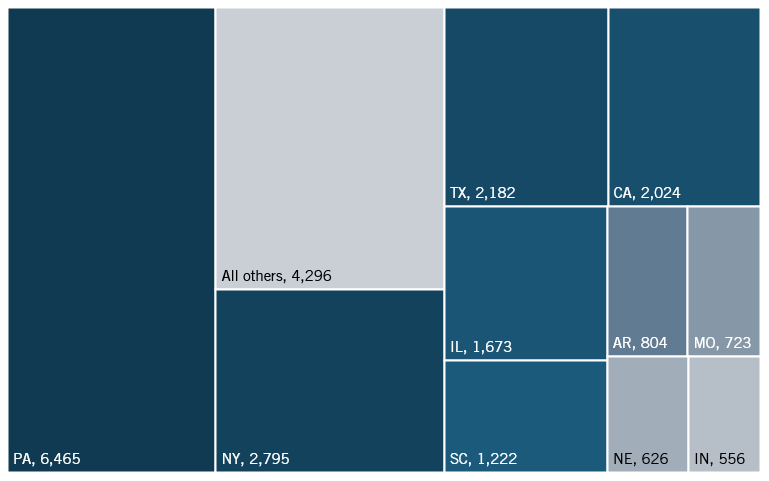
Pennsylvania leads the railroad rolling stock manufacturing industry in LQ and absolute employment with 6,465 employees (figure 45). New York and Texas follow, employing 2,795 and 2,182 workers, respectively. California, Illinois, South Carolina, and Arkansas also employ many employees in the industry, illustrating the scattered nature of the railroad industry in states nationwide. 4,296 individuals are employed outside the 10 states where this industry is most concentrated.
Figure 45: Number of employees in railroad rolling stock manufacturing (top 10 states, and all others)
Ship and Boat Building
The ship and boat building industry encompasses the construction, repair, and maintenance of vessels ranging from small recreational boats to large commercial ships. This sector is crucial for maritime transportation, defense, recreation, and commercial fishing, requiring specialized skills in metalworking, engineering, and marine systems integration.
Figure 46: Ship and boat building LQ, 2022
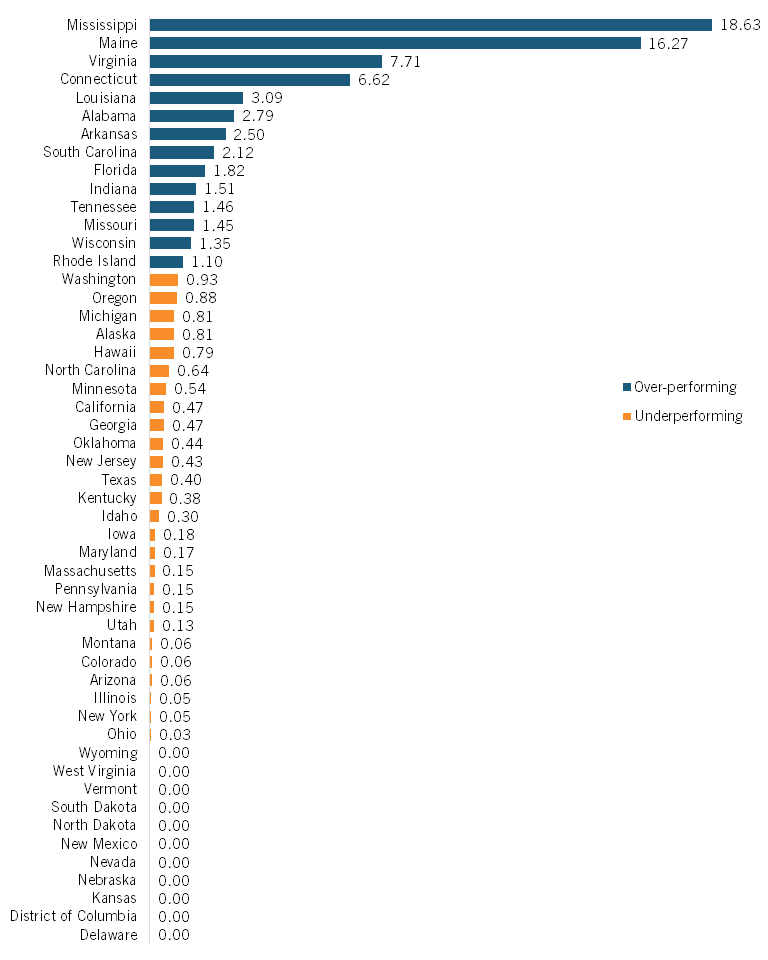
Mississippi dominates the industry with an LQ of 18.63 (figure 46), followed by Maine (16.27) and Virginia (7.71). These states’ high concentrations reflect their historic maritime traditions and continued investment in shipbuilding infrastructure, particularly for military vessels. Connecticut (6.62) and Louisiana (3.09) also show strong performance, likely due to their coastal locations and naval facilities.
Most states underperform in shipbuilding, with 38 states showing LQs below 1.00. States such as California (0.47) and Texas (0.40) have surprisingly low concentrations despite their lengthy coastlines and large economies. Eleven states, including Kansas, Delaware, and Nevada, show no significant shipbuilding activity (0.00), presumably due to their inland location and focus on other industries.
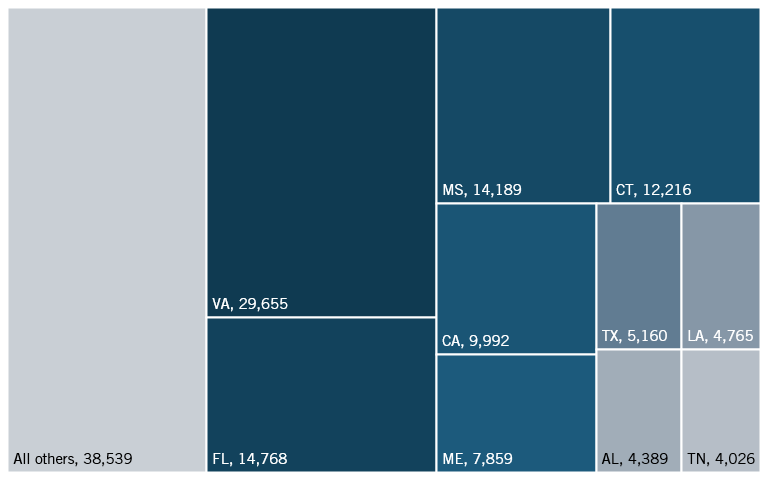
Virginia, home to several naval and civilian shipyards along its coast, leads the ship and boat building industry with 29,655 employees, nearly double the workforce of Florida, which employs 14,768 (figure 47). Mississippi and Maine, states with LQs far greater than any other states, employ 14,189 and 7,859 individuals, respectively. Coastal states, such as Connecticut, California, and Texas, are also hubs for ship and boat building. Collectively, the states outside the top 10 employ 26 percent of all employees in the ship and boat building industry. Most states with a presence in this industry have a major coastline.
Figure 47: Number of employees in ship and boat building (top 10 states, and all others)
Pharmaceuticals and Biotech
The pharmaceuticals and biotechnology industry group is comprised of two subindustries: pharmaceuticals and medicines, and biotechnology R&D.
Figure 48: Pharmaceuticals and biotech industry group LQ, 2022
Pharmaceutical and Medicine Manufacturing
The pharmaceutical and medicine manufacturing industry includes the research, development, and production of drugs, medications, and other medical products. This sector is crucial for public health, combining advanced chemistry, biotechnology, and manufacturing processes to create medications and treatments. It is a strategically important sector because much of it is high wage, traded across borders, and a key driver of innovation.
Figure 49: Pharmaceutical and medicine manufacturing LQ, 2022
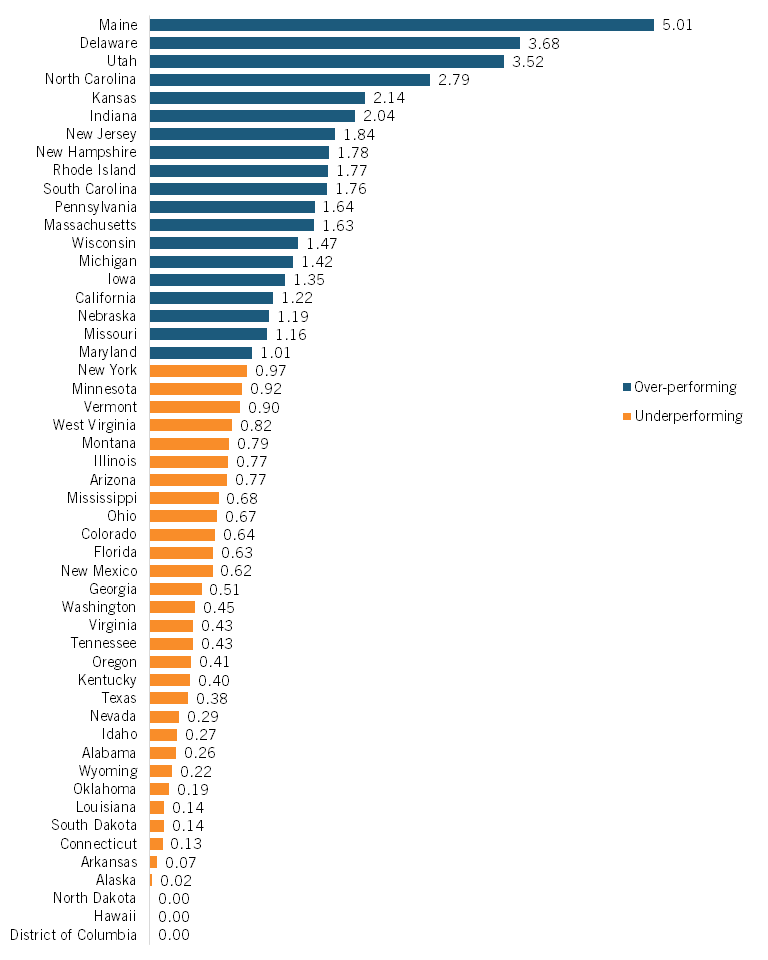
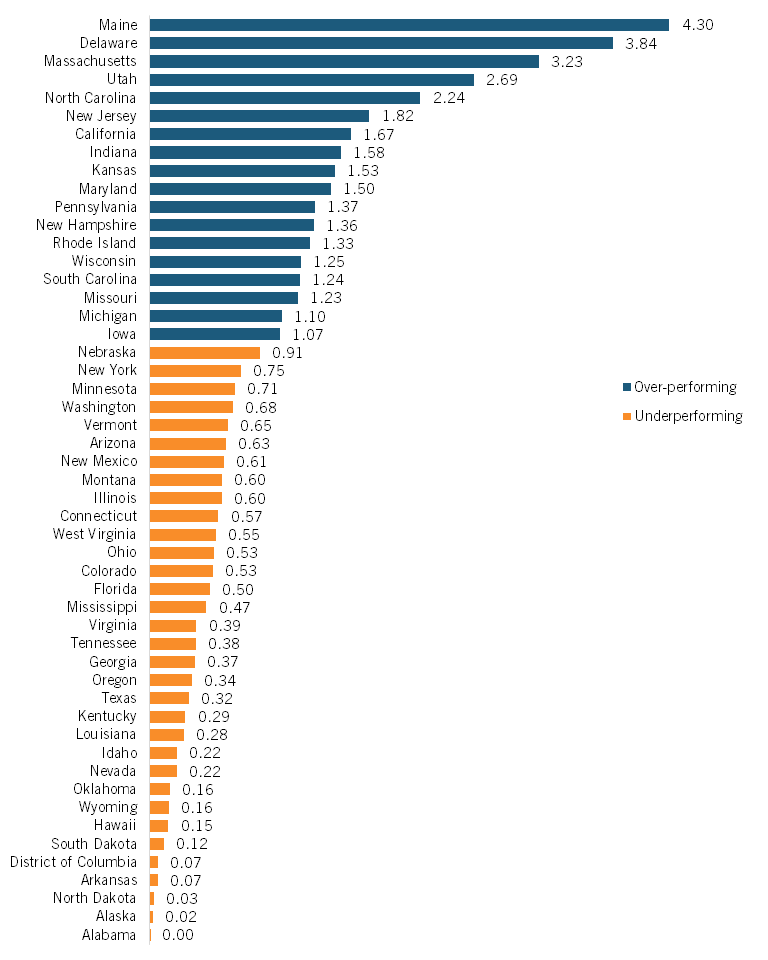
Maine leads the nation with an LQ of 5.01, indicating a concentration of pharmaceutical manufacturing far above the national average. Delaware (3.68) and Utah (3.52) are relatively large pharmaceutical hubs, likely due to their business-friendly environments and established research infrastructure. North Carolina (2.79) and Kansas (2.14) are among the top five, with a strong pharmaceutical manufacturing presence supported by research universities and specialized industrial hubs. California, while over-performing, has a lower LQ of 1.22.
Most states underperform in pharmaceutical manufacturing, with 29 states showing LQs below 1.00. Surprisingly, some states with large populations and significant research institutions show relatively low concentrations, such as Florida (0.63), Washington (0.45), and Texas (0.38). The lowest-performing states include Arkansas (0.07), Alaska (0.02), and several states with no significant pharmaceutical manufacturing presence (0.00) such as the District of Columbia, Hawaii, and North Dakota.
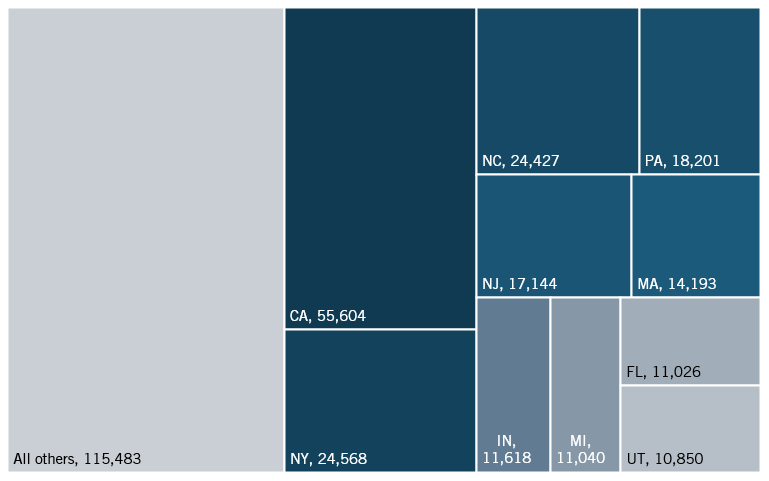
California leads the pharmaceutical and medicine manufacturing industry with 55,604 employees, making it the top state in this sector in absolute employment despite its modest LQ. New York and North Carolina follow with 24,568 and 24,427 employees, respectively. Pennsylvania, New Jersey, and Massachusetts, with large metropolitan areas and developed healthcare infrastructure, are also leaders in this industry with over 14,000 employees each. Utah has 10,850 employees, while Delaware employs just 1 percent of the nationwide workforce (3,986).
Figure 50: Number of employees in pharmaceutical and medicine manufacturing (top 10 states, and all others)
Biotechnology R&D
The biotechnology R&D industry focuses on harnessing biological processes for medical, agricultural, industrial, and environmental applications. Firms in this industry range from small start-ups developing novel therapies to large multinational corporations with expansive research pipelines. The industry is critical for technological advancement, medical breakthroughs, and maintaining the United States’ global innovation and scientific discovery leadership.
Figure 51: Biotechnology R&D LQ, 2022
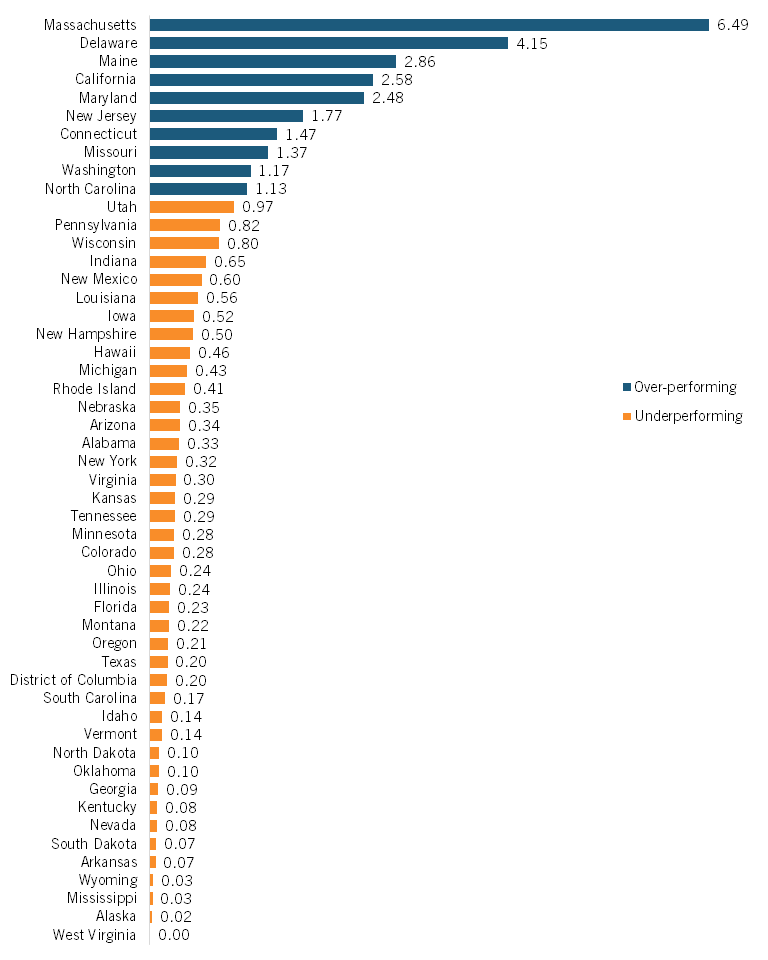
Massachusetts dominates the biotech R&D landscape with an impressive LQ of 6.49 (figure 51), reflecting its dense concentration of research universities, biotechnology firms, and research hospitals. Delaware follows with an LQ of 4.15, while Maine (2.86), California (2.58), and Maryland (2.48) round out the top five performers. These states benefit from robust academic-industry partnerships, substantial research funding, and established innovation ecosystems attracting top scientific talent and investment.
Most states show a relatively low concentration in scientific R&D services, with 39 states having LQs below 1.00. Notably, several states with large economies underperform significantly, including New York (0.32), Florida (0.23), and Texas (0.20). The lowest-performing states include Wyoming (0.03), Mississippi (0.03), and Alaska (0.02), with West Virginia showing no significant R&D activity (0.00). This distribution highlights the industry’s tendency to cluster around major research institutions and established innovation hubs, leaving many regions with limited scientific research activity despite their economic size.
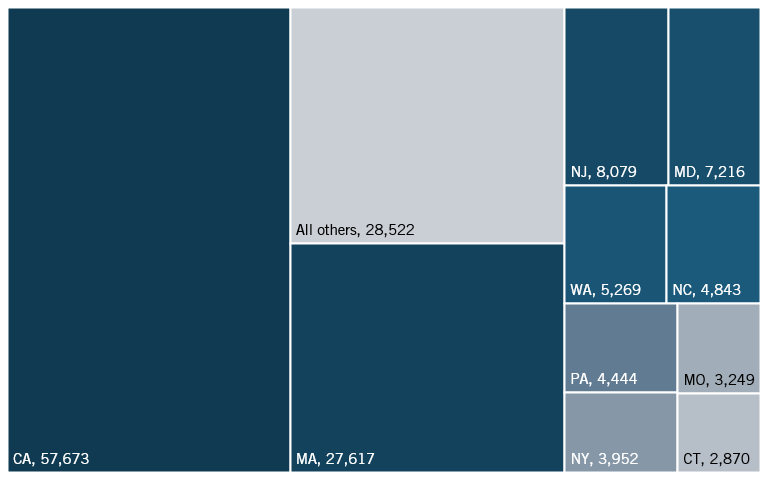
California leads the biotechnology industry with 57,673 employees, far outpacing other states (figure 52). Massachusetts follows with 27,617 employees. Both states are biotechnology hubs, with areas such as Cambridge, Massachusetts, and San Diego, California, acting as magnets for high-caliber biotechnology companies such as Thermo Fisher Scientific and Bristol Meyers Squibb. New Jersey, Maryland, and Washington also play key roles, employing over 5,000 individuals each. The remaining states outside the top 10 collectively account for 28,522 employees. Among these states are Delaware and Maine, which employ 2,199 and 1,457 employees, respectively—modest amounts considering their large LQs in the industry.
Figure 52: Number of employees in biotechnology R&D (top 10 states, and all others)
State Profiles
See how every state and the District of Columbia performs in the State Hamilton Index:
▪ Browse and download state profiles. (Dataviz and PDFs)
▪ Download the full report. (PDF)
Policy Recommendations
Most states have economic development programs emphasizing growth in advanced technology sectors. While these sectors succeed in providing job growth and, in some cases, attract new and innovative industries, state policies remain fragmented, with little coordination from the federal government. While it’s critical for states to continue pushing forward in their own economic development efforts, it is equally critical for the federal government to partner with state governments to coordinate a national development strategy in advanced industries. To do this, Congress and state governments must prioritize four things:
Stop Using Taxpayer Dollars to Attract Chinese Companies to the United States
State governments have long taken up the strategy that “all jobs are good jobs,” supporting whatever strategy is necessary to increase job growth and decrease unemployment for their constituents. This has included subsidizing Chinese foreign direct investment (FDI) in the form of greenfield (building a new facility on American soil) or acquisition (buying an American firm). While this strategy may be lucrative for lawmakers and U.S. citizens locally, it harms American businesses, giving a leg up to firms from China, a country where industrial subsidization has reached record highs.
If the United States wants to advance its competitiveness, state and local governments must stop providing taxpayer dollars to its greatest competitors. The federal government should ban this practice while still encouraging incentives to attract American firms and friendly FDI. Congress can start by prohibiting federal aid, such as grants, loans, and tax breaks, from being awarded to Chinese firms or firms connected to Chinese interests. Additionally, Congress can make economic development aid to states conditional on following the same practices and not providing incentives to Chinese firms.[11]
Establish Grant Programs for States to Attract FDI and Domestic Advanced Technology Production Similar to the CHIPS Act
The CHIPS Act successfully incentivized domestic and international semiconductor firms to grow operations in the United States, using $52.7 billion in funding. Most of these firms settled in semiconductor manufacturing hubs, such as Arizona and Texas; however, others set up operations in states with strong economic development plans, such as New York with its Green CHIPS Act, which provides $10 billion in tax credit to firms opening semiconductor fabs.[12]
To attract greenfield FDI in key industries, Congress should promote state economic development initiatives such as New York’s Green CHIPS Act for other technology areas. A new program under the Department of Commerce should allocate up to $5 billion annually in matching funds for state-led initiatives targeting biotechnology, machinery manufacturing, and other advanced industries. States can choose the industries they specialize in to play to their own economic strengths, though the industries must be in a traded sector and improve U.S. global competitiveness.
Retool the Regional Technology Hub Programs
ITIF has advocated for regional growth centers, or technology hubs (in 2019), arguing that targeted federal investment through the Department of Commerce for promising metro areas could transform small industries into self-sustaining innovation centers such as Silicon Valley or Cambridge, Massachusetts.[13] These hubs would attract top talent, foster entrepreneurship, and accelerate industrial innovation. Congress appropriated funds for these hubs, authorizing $10 billion to the Tech Hub Program under the Economic Development Administration (EDA). However, other agencies—including the National Science Foundation (NSF), the Defense Department (DOD), and the Small Business Administration (SBA)—have since launched their own competing initiatives.
Together, these programs have allocated tech hub funding to 48 states, leading to fragmentation rather than specialization. Multiple cities have been awarded funding to develop a hub for the same technology area. For example, 22 regions have been awarded funding for biotechnology.[14]
This strategy has been unsuccessful, and taxpayer dollars are being used for an incoherent and inefficient industrial strategy. Instead of continuing down this path, Congress should narrow and concentrate funding from these programs toward only NSF and EDA, allowing the two agencies to allocate just 15 technology hubs. Any future technology generation awards from DOD and SBA can be directed to one of these 15 hubs. If Congress wishes to maintain its current strategy, the “hub” title should be retracted, and funding should be awarded as part of a regional technology grant program. Regardless of how Congress reshapes the program, grants should only be allocated to regions focusing on key technology areas, such as those in the Hamilton Index.
Host an Annual National Economic Development Summit
Each state has its own Department of Commerce with competitiveness and development strategies independent of the federal government. It should be the job of the federal Commerce Department and, namely, the secretary of the Treasury to coordinate these strategies in an annual conference between himself, other top federal economic development officials, and the economic development leaders of each state. This short conference would allow state officials to coordinate with federal economic strategy, discussing problems, opportunities, and possible solutions in rules and regulations. This forum would also serve as an opportunity to develop and rework grant and assistance programs between federal and state governments and discuss potential interstate cooperation.[15]
Conclusion
China’s industrial and innovative capabilities, at least in terms of LQ, significantly exceed the United States’. In this position, the United States has placed itself at risk in economic and national security, making itself vulnerable to weakened supply chains, trade manipulation, and economic instability. The results of the State Hamilton Index reveal that 19 states over-perform in advanced industries when compared with the national average, only 4 over-perform globally, and just 1 outperforms China.
Across-the-board tariffs on most countries and industries are not likely to do much to change this, in large part because most advanced industries rely on foreign markets for a considerable portion of sales, and aggressive U.S. trade protection will lead to an equal response from foreign nations, reducing many of these firms’ foreign sales. As such, to reclaim leadership in advanced industries, the United States must adopt a comprehensive, coordinated industrial strategy that aligns federal and state policies toward a common goal: strengthening domestic production in key sectors. This requires states to end counterproductive incentives for Chinese firms, target investments in strategic industries, and reimagine regional economic development. A more focused and coordinated effort will be critical to reversing America’s industrial decline.
The time for a piecemeal approach to industrial strategy has passed. Without decisive action, the United States risks falling further behind. By leveraging comparative advantages at the state level, fostering innovation clusters, and committing to sustained investment in advanced industries, the United States can rebuild its industrial foundation and reassert itself as a dominant force in the global economy.
Acknowledgments
The author would like to thank Robert Atkinson for his advice and guidance with this report. Any errors or omissions are the author’s sole responsibility.
About the Author
Meghan Ostertag is a research assistant at ITIF. She was previously an intern with the Federal Deposit Insurance Corporation. She earned her bachelor’s degree in economics from American University.
About ITIF
The Information Technology and Innovation Foundation (ITIF) is an independent 501(c)(3) nonprofit, nonpartisan research and educational institute that has been recognized repeatedly as the world’s leading think tank for science and technology policy. Its mission is to formulate, evaluate, and promote policy solutions that accelerate innovation and boost productivity to spur growth, opportunity, and progress. For more information, visit itif.org/about.
Endnotes
[1]. Robert D. Atkinson, “Computer Chips vs. Potato Chips: The Case for a U.S. Strategic-Industry Policy” (ITIF, January 2022), https://itif.org/publications/2022/01/03/computer-chips-vs-potato-chips-case-us-strategic-industry-policy/.
[2]. Cameron Davis et al., “Building Innovation Ecosystems: Accelerating Tech Hub Growth” (McKinsey & Company, February 2023), https://www.mckinsey.com/industries/public-sector/our-insights/building-innovation-ecosystems-accelerating-tech-hub-growth.
[3]. Karyn Morrissey, “A Location Quotient Approach to Producing Regional Production Multipliers for the Irish Economy,” Papers in Regional Science, vol. 95, no. 3 (2016): 491–507, https://doi.org/10.1111/pirs.12143.
[4]. United States Census Bureau (County Business Patterns: 2022), accessed October 2024, https://www.census.gov/data/datasets/2022/econ/cbp/2022-cbp.html.
[5]. The 2023 Hamilton Index analyzes 10 advanced industries rather than 7. This report does not analyze output in basic metals, chemicals, or fabricated metals.
[6]. Mariya Pominova et al., “The Stability of Location Quotients,” The Review of Regional Studies, no. 52, (2022): 296–320, http://dx.doi.org/10.52324/001c.66197.
[7]. Ibid.
[8]. Organization for Economic Cooperation and Development (OECD), Trade in Value Added (TiVA), 2022 ed. Principal Indicators (accessed September 5, 2023), https://stats.oecd.org/Index.aspx?DataSetCode=TIVA_2022_C1.
[9]. The output of states is measured using employment data from 2022, while the global output is measured using value-added data from 2020. These differences are due to the constraints of the available data.
[10]. Robert D. Atkinson, “China is Rapidly Becoming a Leading Innovator in Advanced Industries” (ITIF, September 2024), https://itif.org/publications/2024/09/16/china-is-rapidly-becoming-a-leading-innovator-in-advanced-industries/.
[11]. Robert D. Atkinson, “State and Local Government Need to Stop Subsidizing Chinese Companies,” The Hill, April 21, 2022, https://thehill.com/opinion/finance/3275383-state-and-local-governments-need-to-stop-subsidizing-chinese-companies/.
[12]. Fran Hagarty, “Key US States Emerge in Domestic Reshoring of Semiconductor Manufacturing,” S&P Global, October 26, 2023, https://www.spglobal.com/market-intelligence/en/news-insights/research/us-states-win-domestic-reshoring-semiconductor-manufacturing.
[13]. Robert D. Atkinson et al., “The Case for Growth Centers: How to Spread Tech Innovation Across America” (ITIF and Brookings, December 2019), https://www2.itif.org/2019-growth-centers.pdf.
[14]. Robert D. Atkinson and Trelysa Long, “Tech Hubs or Tech Dispersion?” (ITIF, January 6, 2025), https://itif.org/publications/2025/01/06/tech-hubs-or-tech-dispersion/.
[15]. Robert D. Atkinson, “Secretary Raimondo Should Host a National Economic Development Summit with Her State Counterparts” (ITIF, May 2023), https://itif.org/publications/2023/05/30/secretary-raimondo-should-host-a-national-economic-development-summit/.
