

The 2026 US-India Subnational Innovation Competitiveness Index
For policymakers to bolster regional competitiveness in the global economy, they first must know where they stand. This report—coauthored by ITIF and the Institute for Competitiveness, India—benchmarks the 87 regions of India and the United States using 12 commonly available indicators of strength in the knowledge economy, globalization, and innovation capacity.
KEY TAKEAWAYS
Key Takeaways
Contents
U.S.-India Innovation Landscape: Divergent Capabilities, Emerging Interdependencies 41
Introduction
In this report, two member think tanks of the Global Trade and Innovation Policy Alliance (GTIPA) analyze the subnational innovation competitiveness of the states and regions of two nations: India and the United States.[1]
India’s economic and technological footprint has expanded considerably over the past two decades. Although the country still accounts for only about 3 percent of global gross domestic product (GDP), its economy has grown rapidly, with real GDP increasing at an average annual rate of 6.5 percent from 2008 to 2019 and 7.7 percent from 2022 to 2025.[2] At the same time, India’s population has grown to more than 1 billion people, providing the country with an enormous domestic market and labor force.[3] Its economy is also becoming increasingly technology intensive: High-tech products increased from 10 percent of India’s manufactured exports in 2009 to 19 percent in 2024.[4] Together, these trends illustrate India’s growing economic scale and its increasing potential to compete in innovation-driven industries.
The Indian government has sought to build on this momentum through its goal of achieving developed-economy status by 2047.[5] Reaching that objective will depend in part on India’s ability to raise productivity, attract investment, expand advanced industries, and strengthen its technological capabilities. These efforts have become particularly important as firms and governments reconsider supply chains and economic relationships amid growing tensions between the United States and China. India’s combination of economic growth, market size, and expanding technological capabilities positions it as an increasingly important participant in this changing global economic landscape.
India already possesses considerable strengths in technology and services. Its established information technology sector and large pool of technical workers have encouraged multinational companies such as Google, Meta, and Oracle to establish and expand operations in the country, including work related to artificial intelligence, virtual reality, and data mining.[6] India has similarly attracted substantial foreign investment, receiving $36.1 billion in fiscal year 2013 to 2014 and $94.5 billion by fiscal year 2025 to 2026.[7] Continued investment could help the country build on its traditional strengths in information technology (IT) services while establishing a larger presence in advanced manufacturing and other innovation-intensive industries.
India’s improving performance in international innovation rankings reflects this broader transition. In the Global Innovation Index 2025, India ranked 38th among 138 economies, compared with 3rd for the United States.[8] The difference highlights the substantial innovation gap that remains between the two countries, particularly given the United States’ strengths in research and development (R&D), technological infrastructure, research institutions, and human capital. At the same time, India has made considerable progress, rising from 81st in 2015 to 38th in 2025.[9] This improvement reflects expanding innovation capacity, a growing start-up ecosystem, and greater emphasis on technology-driven economic development.
Yet, national-level indicators tell only part of the story. India’s economic and innovative capabilities vary substantially across its states and territories, with investment, talent, R&D, entrepreneurship, and advanced industries concentrated in particular regions. Examining these subnational differences provides a clearer picture of where India’s innovation economy is strongest, where significant gaps remain, and what will be required for the country to sustain its economic and technological progress.
This is why developing a national innovation and competitiveness strategy is so important. For a country to grow into a significant player in the global economy, its capacity to nurture an educated workforce, increase productivity, transfer knowledge, and develop and adopt new, innovative technologies is vital. Understanding these subnational factors is crucial for a comprehensive assessment of innovation capabilities. By exploring specific regional influences, stakeholder interactions, and local policies, we can gain deeper insights into how effective public policy can contribute to national innovation performance. This nuanced perspective can enrich our understanding of national rankings and inform targeted strategies for enhancing innovation ecosystems tailored to the unique contexts of various regions.
The Institute for Competitiveness (IFC) has released three editions of the India Innovation Index, which evaluates the innovative capacity of subnational regions in India. That initiative has been done in collaboration with NITI Aayog, a public-policy think tank of the government of India. Similar to the U.S.–India Subnational Innovation Competitiveness Index (SICI), this report employs a comprehensive approach to assess innovation based on broader dimensions. The Index ranks regions using a robust methodology and seeks to highlight the opportunities and potential of fostering innovation in each Indian state and union territory. Relevant stakeholders within state governments utilize insights from the Index to formulate policies that promote innovation. The report also aims to encourage the spirit of competitive federalism in India.[10] In line with the India Innovation Index, the Information Technology and Innovation Foundation (ITIF) has contributed significantly to the literature on this topic with a series of in-depth subnational innovation competitiveness reports, which provide nuanced insights into the intricate relationships between innovation, economic development, and regional competitiveness, offering valuable perspectives for policymakers, businesses, and researchers alike. This series includes reports such as ITIF’s “State New Economy Index,” which assesses the innovative structures of U.S. states to determine to what extent these structures drive innovation.[11] Additionally, ITIF, in collaboration with GTIPA, has produced the Balkan SICI in 2026, one of the latest in a series of reports examining the role subnational regions play in domestic and international innovation networks.[12]
This report does not serve as a ranking of innovation between American and Indian states, but rather offers a critical comparison. Significant gaps exist between the most-innovative U.S. states and Indian states and territories, with even the most-innovative Indian region falling behind the least-innovative U.S. state. By examining the strategies undertaken by innovation leaders such as California and Massachusetts, India can develop innovation-driven policy to replicate the factors that have led to these states becoming the forefront of innovation. This study aims to showcase the existing innovation networks in the United States and India, informing both U.S. states on ways in which they could improve and Indian regions of potential directions that could be taken to overcome innovation gaps and come closer to reaching the frontier of innovation.
The Index
The U.S.-India SICI captures the innovation performance of 87 regions across India (36 states and territories) and the United States (50 states and the District of Columbia). To simplify the comparative analysis, this report refers to all subnational entities as “regions.”
This report considers 12 indicators (which were found to be commonly available across the 87 regions of these two countries) representing the relevant determinants of a thriving innovation ecosystem, grouped into three dimensions:
▪ Knowledge Economy. Indicators measured professional, technical, and scientific (PTS) services employees; manufacturing labor productivity; and share of workers employed in STEM (science, technology, engineering, and math) jobs.
▪ Globalization. Indicators measured foreign direct investment (FDI) and high-tech exports.
▪ Innovation Capacity. Indicators measured the existence of an AI policy, renewable energy consumption, households with Internet facility, R&D personnel, R&D intensity, the number of active businesses, and patent output.
The most important dimension of the U.S.–India SICI is innovation capacity, which has a weight of 44.4 percent, while the knowledge capacity indicators have a weight of 44.3 percent, and the globalization indicators have a weight of 11.3 percent.
Overall Scores and Rankings
Table 1: Table 1: U.S. states’ performance in the U.S.–India SICI
|
Overall Rank |
State |
Overall Score |
Knowledge |
Globalization |
Innovation |
|||
|
Score |
Rank |
Score |
Rank |
Score |
Rank |
|||
|
1 |
District of Columbia |
67.92 |
74.13 |
1 |
19.70 |
20 |
57.95 |
4 |
|
2 |
Massachusetts |
66.55 |
62.73 |
5 |
37.03 |
2 |
62.16 |
2 |
|
3 |
California |
65.51 |
62.11 |
6 |
34.16 |
4 |
61.42 |
3 |
|
4 |
Washington |
59.87 |
55.53 |
10 |
7.28 |
47 |
63.43 |
1 |
|
5 |
Maryland |
56.03 |
65.23 |
4 |
11.29 |
37 |
44.99 |
9 |
|
6 |
Delaware |
55.38 |
57.86 |
8 |
24.28 |
15 |
47.74 |
7 |
|
7 |
New Mexico |
54.63 |
51.23 |
17 |
51.96 |
1 |
45.82 |
8 |
|
8 |
Virginia |
53.68 |
66.86 |
3 |
13.84 |
33 |
37.99 |
24 |
|
9 |
Oregon |
52.98 |
48.80 |
20 |
32.50 |
5 |
49.85 |
5 |
|
10 |
Wyoming |
52.81 |
68.46 |
2 |
15.84 |
30 |
34.14 |
38 |
|
11 |
Michigan |
50.44 |
50.89 |
18 |
26.13 |
10 |
44.26 |
10 |
|
12 |
New Jersey |
50.02 |
56.35 |
9 |
14.36 |
32 |
40.96 |
15 |
|
13 |
Connecticut |
49.29 |
53.09 |
12 |
25.15 |
14 |
40.00 |
18 |
|
14 |
New Hampshire |
49.09 |
44.46 |
31 |
23.54 |
16 |
48.62 |
6 |
|
15 |
Colorado |
48.94 |
52.81 |
13 |
17.93 |
24 |
41.42 |
13 |
|
16 |
Texas |
47.55 |
55.29 |
11 |
19.09 |
22 |
35.84 |
31 |
|
17 |
Illinois |
47.32 |
52.43 |
14 |
28.44 |
6 |
35.85 |
30 |
|
18 |
Arizona |
47.29 |
49.93 |
19 |
34.95 |
3 |
36.63 |
28 |
|
19 |
North Carolina |
47.19 |
51.79 |
15 |
18.37 |
23 |
38.80 |
22 |
|
20 |
Minnesota |
46.98 |
46.77 |
26 |
26.43 |
9 |
41.34 |
14 |
|
21 |
Indiana |
46.30 |
51.56 |
16 |
19.67 |
21 |
36.89 |
26 |
|
22 |
Utah |
45.84 |
47.71 |
22 |
17.02 |
27 |
40.48 |
17 |
|
23 |
New York |
45.46 |
48.75 |
21 |
8.54 |
43 |
40.83 |
16 |
|
24 |
Pennsylvania |
45.12 |
46.84 |
24 |
27.93 |
8 |
37.12 |
25 |
|
25 |
Louisiana |
44.14 |
59.59 |
7 |
10.44 |
39 |
26.86 |
49 |
|
26 |
Idaho |
43.65 |
41.19 |
42 |
16.89 |
28 |
42.59 |
12 |
|
27 |
Georgia |
43.13 |
47.09 |
23 |
17.30 |
26 |
35.57 |
33 |
|
28 |
Montana |
42.52 |
43.88 |
33 |
8.36 |
45 |
39.82 |
19 |
|
29 |
Vermont |
42.34 |
40.20 |
45 |
25.26 |
13 |
38.83 |
21 |
|
30 |
Wisconsin |
42.13 |
40.38 |
44 |
26.11 |
11 |
38.00 |
23 |
|
31 |
Kansas |
42.11 |
45.09 |
29 |
12.00 |
35 |
36.85 |
27 |
|
32 |
Maine |
41.75 |
42.80 |
35 |
8.81 |
42 |
39.22 |
20 |
|
33 |
Alabama |
41.16 |
45.51 |
28 |
6.04 |
50 |
36.03 |
29 |
|
34 |
Iowa |
41.08 |
43.23 |
34 |
15.76 |
31 |
35.67 |
32 |
|
35 |
Missouri |
41.01 |
46.81 |
25 |
11.06 |
38 |
33.15 |
39 |
|
36 |
South Dakota |
40.99 |
37.18 |
49 |
9.73 |
41 |
43.07 |
11 |
|
37 |
Ohio |
40.90 |
44.55 |
30 |
13.61 |
34 |
34.55 |
36 |
|
38 |
Rhode Island |
40.45 |
40.63 |
43 |
21.68 |
19 |
35.50 |
34 |
|
39 |
Tennessee |
40.33 |
42.35 |
37 |
27.96 |
7 |
31.94 |
41 |
|
40 |
Nebraska |
39.23 |
46.43 |
27 |
11.52 |
36 |
29.83 |
42 |
|
41 |
Oklahoma |
39.04 |
40.08 |
46 |
17.54 |
25 |
34.25 |
37 |
|
42 |
Nevada |
38.76 |
37.38 |
48 |
22.79 |
17 |
35.06 |
35 |
|
43 |
South Carolina |
38.73 |
42.63 |
36 |
10.05 |
40 |
32.99 |
40 |
|
44 |
North Dakota |
38.28 |
42.10 |
40 |
25.27 |
12 |
28.75 |
45 |
|
45 |
Florida |
38.09 |
42.27 |
39 |
21.70 |
18 |
29.08 |
43 |
|
46 |
West Virginia |
35.42 |
42.32 |
38 |
7.14 |
48 |
27.38 |
48 |
|
47 |
Kentucky |
35.42 |
41.55 |
41 |
8.42 |
44 |
27.79 |
46 |
|
48 |
Arkansas |
33.91 |
37.46 |
47 |
7.83 |
46 |
28.99 |
44 |
|
49 |
Mississippi |
33.58 |
36.16 |
50 |
16.35 |
29 |
27.46 |
47 |
|
50 |
Alaska |
32.62 |
44.12 |
32 |
0.70 |
51 |
21.55 |
51 |
|
51 |
Hawaii |
31.03 |
35.97 |
51 |
6.59 |
49 |
24.99 |
50 |
Table 2: Indian regions’ performance in the U.S.–India SICI
|
Overall Rank |
State |
Overall Score |
Knowledge |
Globalization |
Innovation |
|||
|
Score |
Rank |
Score |
Rank |
Score |
Rank |
|||
|
1 |
Chandigarh |
27.16 |
37.16 |
1 |
3.22 |
16 |
16.86 |
7 |
|
2 |
Maharashtra |
26.79 |
13.24 |
10 |
41.85 |
3 |
30.17 |
1 |
|
3 |
Delhi |
25.30 |
14.77 |
7 |
45.04 |
2 |
24.83 |
2 |
|
4 |
Puducherry |
22.54 |
34.14 |
2 |
2.68 |
17 |
10.68 |
14 |
|
5 |
Karnataka |
22.06 |
17.96 |
5 |
51.50 |
1 |
13.47 |
10 |
|
6 |
Haryana |
19.99 |
9.88 |
13 |
37.29 |
4 |
20.97 |
3 |
|
7 |
Tamil Nadu |
19.94 |
14.55 |
8 |
18.88 |
6 |
20.89 |
4 |
|
8 |
Telangana |
17.89 |
15.62 |
6 |
20.15 |
5 |
15.36 |
8 |
|
9 |
Gujarat |
15.54 |
7.22 |
19 |
18.23 |
7 |
19.50 |
5 |
|
10 |
Goa |
15.06 |
21.45 |
3 |
3.43 |
15 |
8.08 |
19 |
|
11 |
Rajasthan |
12.65 |
4.79 |
25 |
5.99 |
9 |
19.19 |
6 |
|
12 |
Kerala |
12.43 |
18.94 |
4 |
4.01 |
13 |
5.14 |
32 |
|
13 |
Sikkim |
11.42 |
13.98 |
9 |
0.16 |
26 |
9.04 |
17 |
|
14 |
Punjab |
11.20 |
8.53 |
15 |
4.95 |
10 |
12.80 |
11 |
|
15 |
Uttar Pradesh |
9.42 |
2.92 |
32 |
4.91 |
11 |
14.83 |
9 |
|
16 |
Odisha |
9.32 |
7.33 |
18 |
0.84 |
23 |
11.26 |
13 |
|
17 |
West Bengal |
9.22 |
6.31 |
22 |
2.35 |
19 |
11.70 |
12 |
|
18 |
Andhra Pradesh |
9.00 |
11.08 |
12 |
4.40 |
12 |
5.96 |
30 |
|
19 |
Himachal Pradesh |
8.14 |
7.86 |
17 |
3.94 |
14 |
7.57 |
21 |
|
20 |
Uttarakhand |
8.07 |
6.71 |
20 |
1.46 |
20 |
9.20 |
16 |
|
21 |
Dadra & Nagar Haveli and Daman & Diu |
7.98 |
6.07 |
23 |
0.61 |
24 |
9.87 |
15 |
|
22 |
Nagaland |
7.27 |
8.48 |
16 |
0.03 |
29 |
6.18 |
29 |
|
23 |
Lakshadweep |
7.17 |
11.71 |
11 |
- |
31 |
2.77 |
36 |
|
24 |
Andaman & Nicobar Islands |
6.97 |
9.12 |
14 |
- |
32 |
4.95 |
34 |
|
25 |
Madhya Pradesh |
6.90 |
4.89 |
24 |
1.25 |
22 |
8.72 |
18 |
|
26 |
Manipur |
6.58 |
3.61 |
30 |
8.57 |
8 |
7.49 |
22 |
|
27 |
Jharkhand |
5.64 |
4.58 |
26 |
0.48 |
25 |
6.68 |
25 |
|
28 |
Meghalaya |
5.43 |
6.70 |
21 |
- |
33 |
4.26 |
35 |
|
29 |
Jammu & Kashmir |
5.42 |
3.99 |
27 |
1.40 |
21 |
6.58 |
26 |
|
30 |
Chhattisgarh |
5.38 |
3.68 |
29 |
2.53 |
18 |
6.52 |
27 |
|
31 |
Arunachal Pradesh |
5.10 |
3.86 |
28 |
- |
34 |
6.44 |
28 |
|
32 |
Ladakh |
4.72 |
1.62 |
36 |
- |
36 |
7.89 |
20 |
|
33 |
Bihar |
4.70 |
2.09 |
34 |
0.06 |
28 |
7.38 |
23 |
|
34 |
Mizoram |
4.27 |
3.37 |
31 |
- |
35 |
5.24 |
31 |
|
35 |
Tripura |
4.16 |
1.65 |
35 |
0.03 |
30 |
6.73 |
24 |
|
36 |
Assam |
3.85 |
2.59 |
33 |
0.12 |
27 |
5.14 |
33 |
Index Scoring System
American regions lead in this index of subnational competitiveness, with all 50 states and the District of Columbia ranking higher than all 36 regions in India. The United States has slightly more regional variability in scoring than India does. (See figure 1.) While the United States has a range of about 37 points between the highest and lowest subnational scores, India has a range of about 23 points.
Figure 1: Maximum, minimum, quartile, and median overall Index scores[13]
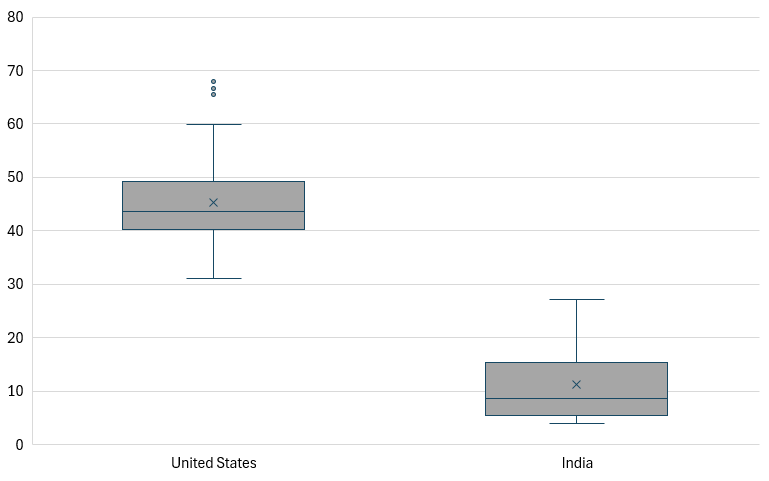
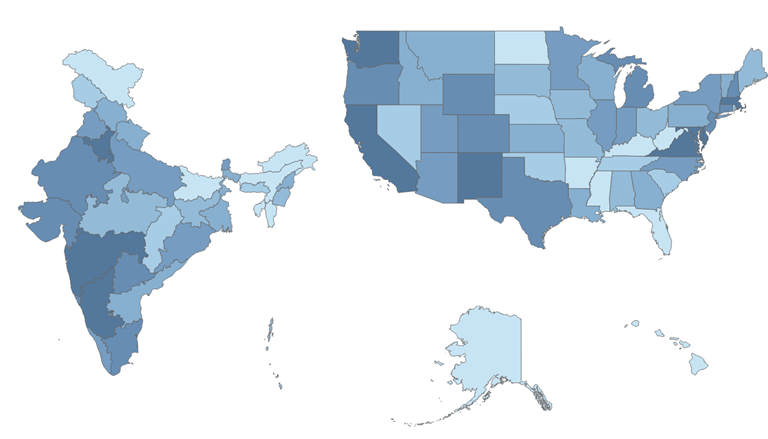
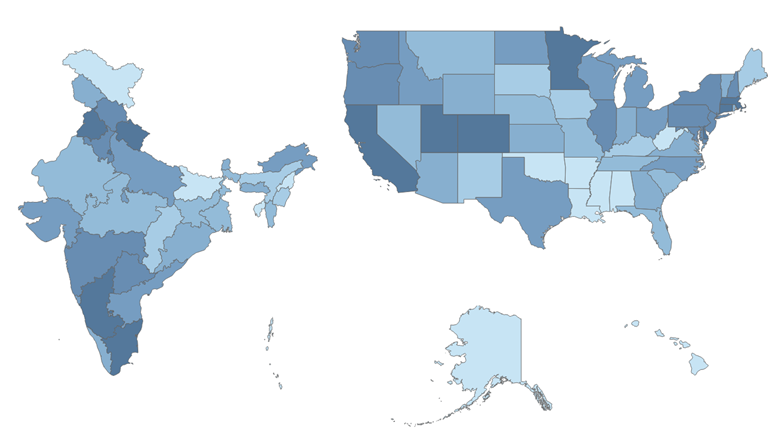
The regions of the United States and India were compared to their country counterparts in order to capture regional innovation performance within each national context rather than making direct cross-country comparisons. Due to the role that economic prosperity plays in a region’s innovation, this index provides a side-by-side ranking of subnational innovativeness within the nations. As such, this approach provides a nuanced view of each region’s innovation competitiveness and highlights areas where innovation leadership or growth potential is most prominent within each country. The leading regions in the United States with the highest overall innovation competitiveness score are the District of Columbia with a score of 67.9, Massachusetts at 66.6, and California at 65.5. The leading regions in India with the highest scores are Chandigarh with a score of 27.2, Maharashtra at 26.8, and Delhi at 25.3.
Figure 2: Overall innovation competitiveness scores (highest-performing regions in darker shades)[14]
Knowledge Economy
Professional, Scientific, and Technical Employees
Why is this important? This indicator measures the share of employees working in professional, scientific, and technical activities in each region. This includes, for example, engineers, researchers, doctors, and lawyers. PTS services include those needed to facilitate the development, implementation, and commercialization of innovations. Automation and globalization also make high-value-added professional services increasingly important to the modern economy. These occupations are highly knowledge intensive and therefore harder to offshore, and they also pay significantly higher-than-average wages.[15]
Figure 3: PTS services employees as a share of total employees, 2023[16]
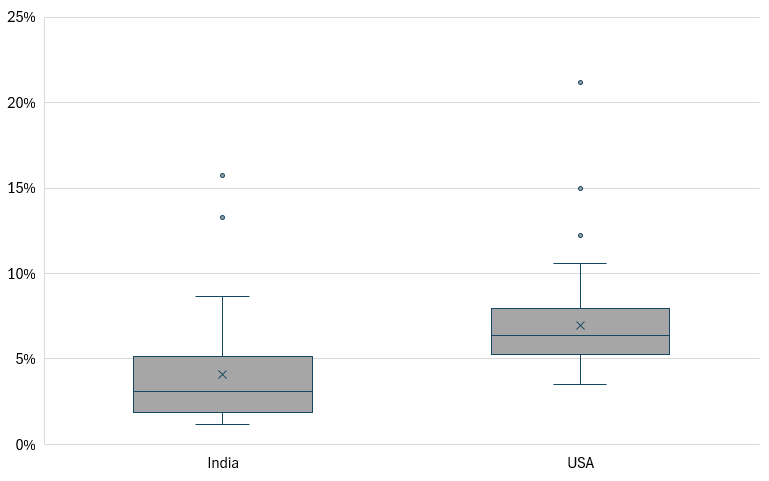
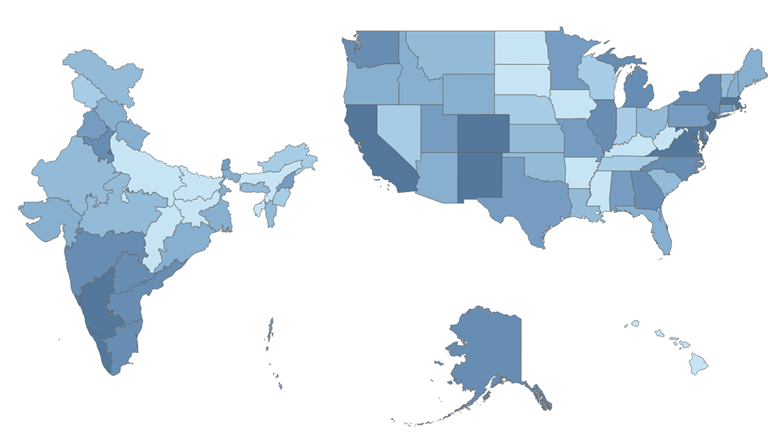
PTS employment tends to cluster in major urban areas and regions with large concentrations of highly educated workers, research institutions, technology firms, and other knowledge-intensive industries. Leading India, Chandigarh has the highest PTS employees’ share of total employees at 15.8 percent. Following behind, Puducherry has 13.3 percent while Goa has 8.63 percent. Meanwhile at the bottom, Uttar Pradesh’s PTS employees only accounted for 1.5 percent of all employees, Tripura only 1.5 percent, and Bihar only 1.2 percent.
In the United States, the leading regions with the highest PTS employee share of total employees tend to have large metro areas with a highly urbanized population. Indeed, the leading region is the District of Columbia at 21.2 percent followed by Virginia at 15 percent and Maryland at 12.2 percent. In contrast, the regions with the lowest PTS employee shares tend to be smaller with less urban centers and more rural populations. The regions with the lowest PTS employee shares are South Dakota at 3.7 percent, Arkansas at 3.6 percent, and Mississippi at 3.5 percent. Overall, the PTS employee shares have greater variability than India—U.S. regions range from 3.5 to 21.2 percent compared with India’s 1.2 percent to 15.8 percent.
The majority of regions in India and the United States cluster in a similar range of PTS employee share. (See figure 3.) However, both nations have regional outliers for this indicator. India’s two positive outlier regions are Chandigarh and Puducherry. The three U.S. regions with outliers are the District of Columbia, Virginia, and Maryland. For both nations, the high PTS employee shares suggest that these regions with urbanized and metropolitan centers also have large numbers of innovation and research jobs that draw PTS workers to relocate to there.
Figure 4: PTS services employees (highest-performing in darker shades)[17]
Manufacturing Productivity
Why is this important? Within manufacturing, high-value-added firms are most often capital intensive, producing more technologically complex products and organizing their workers to take better advantage of their skills. They are typically more productive, pay higher wages, and generate greater value for each hour worked. All else being equal, firms with higher value-added levels are more likely to be able to meet global competitiveness challenges. In this context, gross value added (GVA) measures the contribution to GDP made by an individual producer, industry, or sector. This indicator focuses on the manufacturing sector, and it measures the average GVA per worker on a purchasing power parity (PPP) basis.
Figure 5: PPP-adjusted GVA per worker in the manufacturing sector, 2025[18]
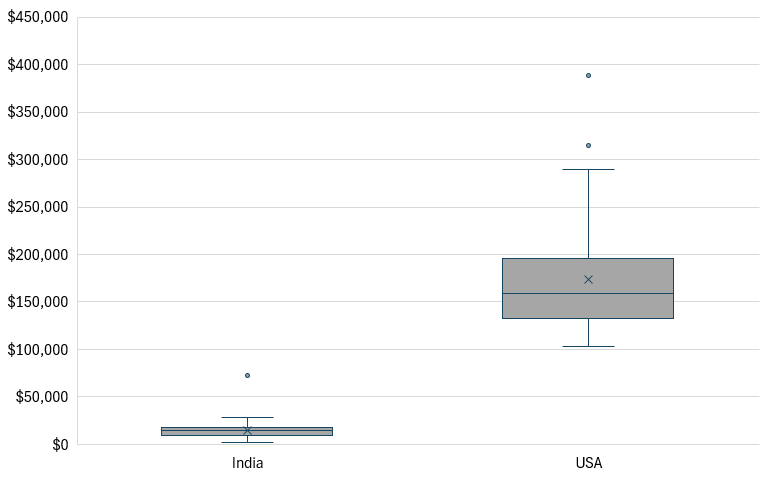
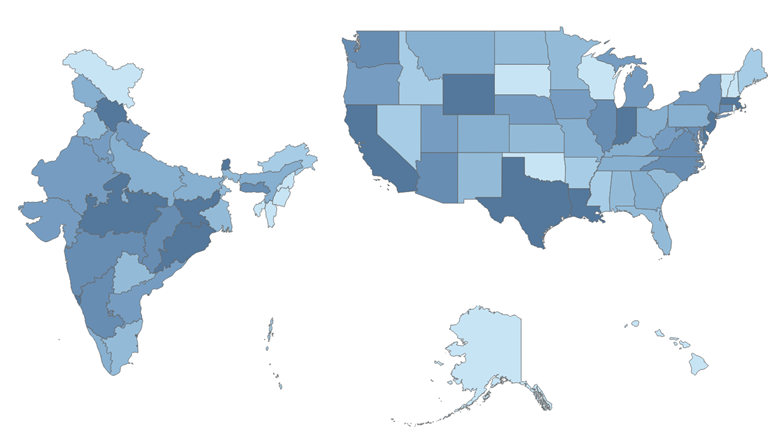
U.S. regions leading in manufacturing GVA show minimal similarity, with states such as Wyoming ($388,942), Louisiana ($314,503), and Texas ($246,806) among higher-tech regions such as California ($289,052) and Massachusetts ($229,943). This data is partially skewed due to the prevalence of costly energy commodities such as oil and gas in Louisiana, Wyoming, and Texas. Manufacturing hubs such as Michigan ($166,336) and Ohio ($158,399) fall in the middle of U.S. state rankings, while tourism-driven Hawaii ($120,000) and less-industrial South Dakota ($103,364) and Oklahoma ($116,251) fall behind the majority of the U.S. states.
In India, Sikkim, Jharkhand, and Odisha are the leaders in manufacturing productivity, boasting GVA per employee figures of $72,826, $28,630, and $25,088, respectively. However, of the three regions, Sikkim’s manufacturing productivity far exceeds the second- and third-highest regions and also significantly outperformed others in the country. Indeed, while Sikkim has a manufacturing productivity of $72,826, most regions report productivity levels ranging from $2,000 to $29,000 per employee. Indeed, in stark contrast, Nagaland ($2,160) and Mizoram ($2,092) rank as the lowest among Indian states with available data, highlighting a substantial productivity gap in these areas. (See figure 6.)
Though India has experienced growth in overall productivity in recent years, manufacturing GVA has struggled to keep pace with the growth of service industries. Manufacturing in India as a share of total GVA has been declining for years, with the industry accounting for 14.7 percent in 2022–2023, the lowest since 1968–1969.[19] For states lagging behind in manufacturing GVA, it is imperative that they increase their GVA; regions must attract high-value industries, such as in vehicle production, pharmaceuticals, chemicals, and electronics. Though the most productive states in the United States are all fossil-fuel reliant, behind those states are technology hubs such as Massachusetts and California. Regions must utilize incentives, tax breaks, and the potential for a robust and highly educated workforce to attract high-value firms, which can increase GVA for Indian regions.
Figure 6: Performance in manufacturing productivity (highest-performing in darker shades)[20]
Workers in STEM Jobs
Why is this important? This indicator measures the share of employees working in STEM occupations in each region. This includes, for example, engineers, researchers, and computer scientists. STEM jobs represent a vital component of R&D in all fields, and are essential to increasing productivity in all industries. The number of occupations in STEM fields has grown rapidly over the past several decades, and increasing demand for these jobs continues to be driven by globalization and automation. STEM jobs are expected to grow two times faster than all other occupations through 2029 in the United States.[21]
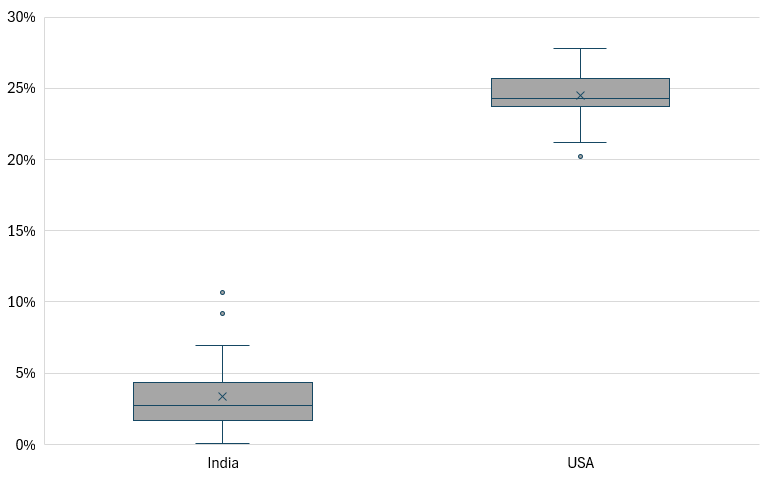
Figure 7: Share of workers employed in STEM occupations, 2021[22]
India has the world’s highest number of STEM graduates, which showcases a robust potential workforce with specialized skills. As per All India Survey on Higher Education (AISHE) data, female STEM graduates accounted for 42.6 percent of total STEM graduates in the 2021–2022 academic year, which is an encouraging sign of progress toward gender parity in Indian education. However, translating this educational success into actual workforce participation remains a challenge.[23]
Despite producing a large number of STEM graduates, India’s labor market does not fully utilize this talent. Data from the Periodic Labour Force Survey (PLFS) indicates that regions such as Puducherry and Chandigarh have the highest proportions of the STEM workforce, with 10.6 percent and 9.2 percent, respectively. However, these figures are still lower than the percentage of STEM employment in the United States. Despite being urbanized and economically advanced, Delhi, India’s capital, has a surprisingly low STEM workforce engagement rate of just 2.2 percent. This highlights a disconnect between educational achievements and labor market integration.
At least 12 out of 36 states in India have a STEM workforce of less than 2 percent, which further underscores the existing gaps in the current workforce. By addressing the barriers that prevent these individuals from entering the workforce, India can harness this potential and make strides toward a more inclusive and innovative future.
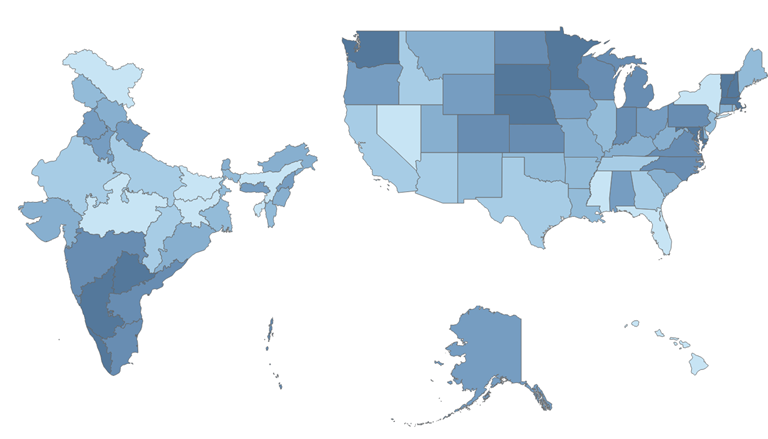
U.S. states exhibit little diversity in the share of people employed in STEM occupations. Technology hubs or states with large high-tech manufacturing sectors, such as New Hampshire (27.8 percent) and Washington (27 percent), lead the United States. Hawaii and Nevada, service economies, and Washington DC round out the United States with 21.2 percent, 20.3 percent, and 20.2 percent, respectively. California, despite being a hub for innovation, science, and engineering, falls near the bottom of the list for U.S. states, with 23.3 percent of its workforce employed in STEM occupations. (See figure 8.)
India has no shortage of eligible STEM employees; however, the deficit comes in the number of STEM professionals actually in the workforce. India can only increase its STEM employment by attracting innovative and growing multinational firms. By attracting these firms, regions can become hubs for industries dense in STEM positions, and other firms will be attracted to or created in these regions. For Instance, in New Hampshire, incentives have attracted STEM-intensive firms to the state. A key example of one such incentive is the Build Back Better Regional Challenge administered by the U.S. Economic Development Administration. As a winner of this challenge, New Hampshire earned $1 billion to grow its bio-fabrication cluster, a small biotechnology subsector, which is poised to experience an increase in jobs and funding due to this award. In addition to this grant, New Hampshire has attracted other large biotechnology firms, such as Pfizer and Merck, with its low taxes and strong technology workforce.[24]
Local, regional, and national governments in India should create financial incentives for cities and regions looking to develop regional clusters with the intent to attract more STEM jobs. By leveraging strong corporate incentives and their highly educated workforces, leading Indian states can begin to bring the share of workers employed in STEM occupations closer to that of U.S. states.
Figure 8: Performance in employment in STEM occupations (highest-performing regions in darker shades)[25]
Globalization
Inward FDI
Why is this important? Inward FDI is critical to spurring domestic economic activity and facilitating technology transfer between foreign-owned enterprises and local establishments. Foreign firms may also introduce domestic firms to new international markets and help regions carve out positions in global supply chains. Inward FDI has also been associated with greater economic growth in market economies and tends to be more productive, inducing greater investment by domestic firms.[26] This indicator measures the inward FDI a region receives from a foreign-based entity to purchase, establish, or expand enterprises relative to the region’s GDP.
Figure 9: Inward FDI flow as a share of GDP, 2025[27]
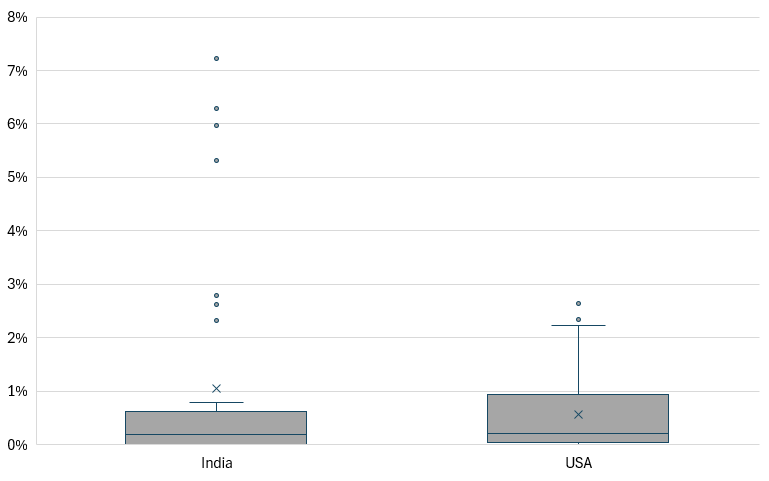
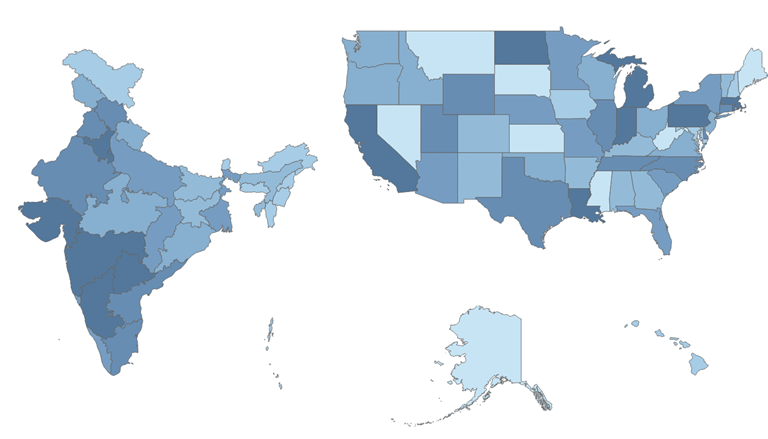
Significant variation exists in the amount of FDI received by Indian regions, with Karnataka (7.2 percent) and the capital Delhi (6.3 percent) having the highest inward FDI as a share of GDP. Two other regions also come close to the top two regions. These regions are Maharashtra at 6 percent and Haryana at 5.3 percent. Several other states receive over 2 percent of their GDP in FDI, including Telangana at 2.8 percent, Gujarat at 2.6 percent, and Tamil Nadu at 2.3 percent. The rest of the regions receive less than 1 percent of their GDP in FDI. Like the United States, many Indian states, most of which are rural or remote, receive a very small amount of inward FDI. FDI inflow into India is both highly variable and significantly concentrated. As per the FDI data maintained by India’s Department for Promotion of Industry and Internal Trade (DPIIT) since 2020, the top five regions attracted 81 percent of the total FDI in the country, leaving just 19 percent for the remaining 31 regions, in 2025. As a result, even regions that seem to draw considerable investment, such as Telangana, receive only 4.6 percent of the total FDI in India.
In the United States, there is very little variability in the amount of FDI earned by states, with a range of 2.6 percentage points separating the leaders from the bottom. North Dakota (2.6 percent) and Massachusetts (2.3 percent) receive the most inward FDI, with other manufacturing and tech hubs such as Michigan, Indiana, and California also ranking near the top of the list (2.1 percent, 1.5 percent, and 1.4 percent, respectively). Eleven U.S. states receive an infinitesimally small amount of FDI, including Alaska, Montana, and West Virginia receiving zero FDI. (See figure 9.)
India has had little trouble attracting FDI to the country as a whole, with sectors such as telecoms and IT helping to make it the eighth-largest recipient of FDI internationally in the 2022–2023 financial year. However, more than just five regions should benefit from these international investments. For Indian states that are attracting little FDI, developing a welcoming business environment and a cluster economy is key. Indian states that wish to attract more foreign industries must find their niche in an industry and develop market rules that incentivize international firms to join.[28]
Figure 10: Performance in inward FDI (highest-performing regions in darker shades)[29]
High-Tech Exports
Why is this important? This indicator measures a region’s exports in the machinery manufacturing, computer and electronic products manufacturing, and electrical equipment, appliances, and components manufacturing industries (North American Industry Classification System [NAICS] 333–335, or equivalent) as a share of total exports. High-value-added manufactured goods such as these are crucial to the modern global economy, as they support supply chains for advanced and national power industries.[30] A region’s exports of these goods as a share of total exports show to what extent a region has a comparative advantage in high-tech production and exportation.
Figure 11: High-tech exports (NAICS 333–335) as a share of total exports, 2025[31]
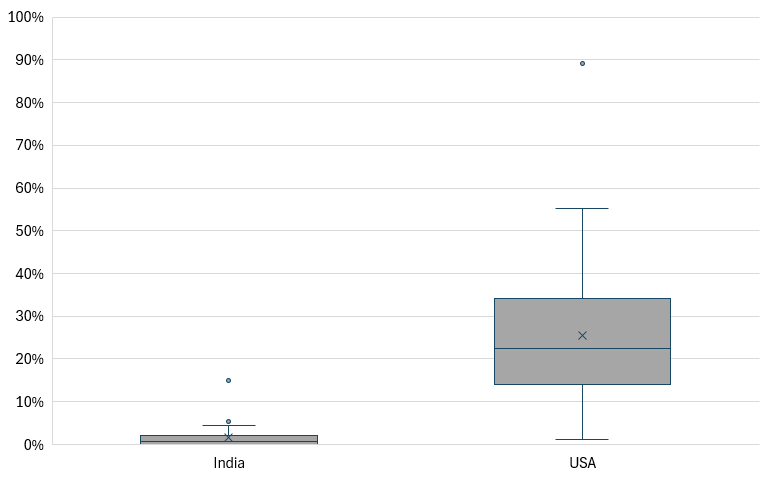
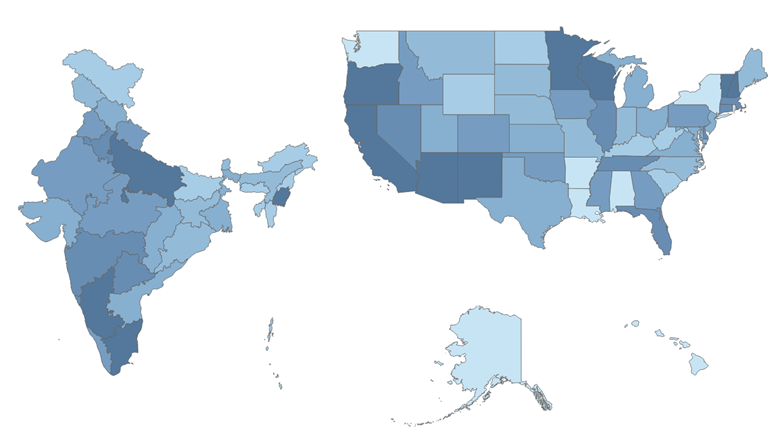
High-tech exports from Indian regions vary widely, with the state of Manipur exporting far more than any other region when compared to its total exports. Manipur’s share in high-tech exports relative to its total exports is the highest, at 15 percent. In comparison, most states have less than a 6 percent share of high-tech exports in total exports. Tamil Nadu is the second-largest exporter at 5.4 percent, about one-third of Manipur’s share. Seven of the 36 regions exported no high-tech goods during the year. These regions include Tripura, Mizoram, and Meghalaya. The lack of high-tech exports in these regions suggests that they rely on other exports, such as services. In order to bolster their economy, these regions should incentivize more high-tech manufacturing firms to relocate to them and thus increase their high-tech exports.
High-tech exports in U.S. regions also vary widely, ranging from about 1 percent of total exports for the state ranked at the bottom and 89 percent for the state ranked at the top. Indeed, New Mexico’s high-tech exports as a share of total exports is 89 percent. This is because New Mexico’s largest manufacturing export category is computer and electronic products, which account for $12.9 billion of $14.9 billion of New Mexico’s exported manufactured products.[32] Coming in second and third place but nowhere near New Mexico’s share, Arizona’s and Oregon’s high-tech export shares are 55 percent and 54 percent, respectively. Despite some states exporting a high share of high-tech exports, other states lag significantly behind. For instance, Louisiana’s and Alaska’s high-tech exports shares are only 1 percent each. (See figure 11.) In other words, while certain states focus significantly on exporting high-tech goods, other states specialize in manufacturing and exporting non-high-tech products. These states, which rely on services and oil, have a significant gap to close.
Figure 12: Performance in high-tech exports (highest-performing regions in darker shades)[33]
Innovation Capacity
AI Policy
Why is this important? AI is the defining technology of this generation, with the power to substantially increase labor productivity—a necessity given the lackluster productivity growth in much of the Organization for Economic Cooperation and Development (OECD) over the past decade.[34] However, the safe and effective implementation of AI in government and industry requires a well-thought-out strategy to ensure that AI has the greatest positive impact on education, employment, and economic growth while avoiding undue negative consequences. This indicator measures whether a region has implemented a regional AI strategy, be it through the creation of an AI working group, an advisory council, a whole-of-government adoption strategy, or another method.
Figure 13: Performance in AI preparedness (highest-performing regions in darker shades)[35]
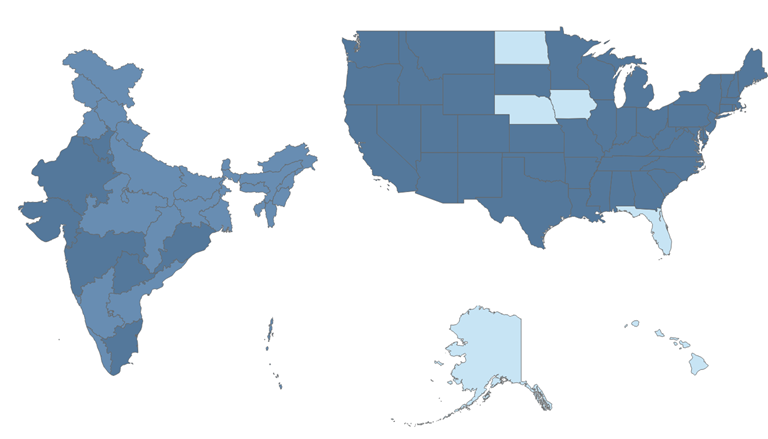
The implementation of AI policy at the regional level is highly dependent on multiple factors, such as whether a regional-level government has enough resources to develop an AI policy for that region and whether a regional government finds AI as an important contributing factor in the future of its economic well-being. In the United States, some of the top AI companies have released new products that have brought AI usage to the forefront of attention for policymakers—and many of these AI products are often found to be beneficial to the economy.[36] As a result, 45 regions in the United States have an AI strategy, including large states such as California and Texas as well as smaller states such as Oklahoma and Pennsylvania.
Although India has fewer large AI companies than the United States does, some regional governments still find that having an AI strategy for the region is important. Indeed, 7 of 36 regions in India have a regional AI policy: Gujarat, Haryana, Maharashtra, Odisha, Rajasthan, Tamil Nadu, and Telangana. Despite many regions not having an AI strategy, India does have a national AI strategy. The national strategy published by NITI Aayog, a public policy think tank of the government of India, provides guidance on AI for the nation.[37]
Renewable Energy
Why is this important? Renewable energy consumption is an important indicator of a region’s transition toward a cleaner and more sustainable energy system. Greater reliance on renewable energy sources, such as solar, wind, hydropower, and geothermal energy, can reduce dependence on fossil fuels, lower greenhouse gas emissions, and improve energy security by diversifying the sources used to meet energy demand. Renewable energy can also support the development of clean-energy industries and encourage investment in new energy technologies and infrastructure. This indicator measures total renewable energy consumption as a share of total energy consumption in a region.
Figure 14: Renewable energy consumption as a share of total energy consumption, 2024[38]
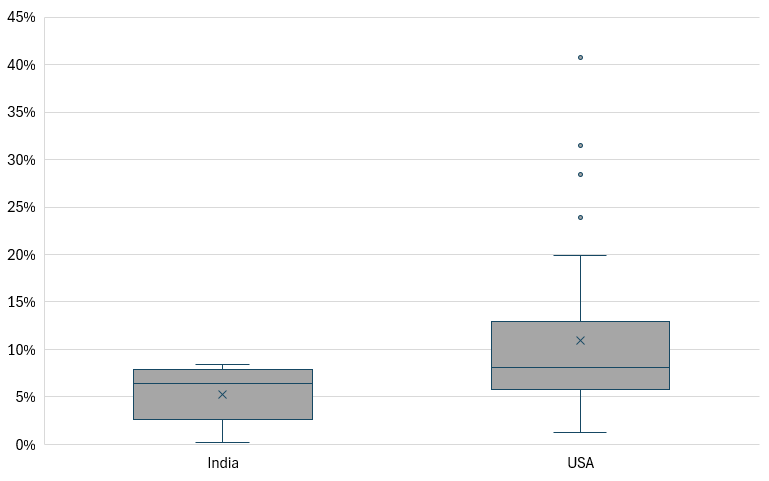
U.S. regions vary considerably in their reliance on renewable energy, with a variability score of 39.4. South Dakota (40.7 percent), Iowa (31.5 percent), and Oregon (28.5 percent) have the highest renewable energy consumption as a share of total energy consumption. These states benefit from abundant renewable energy resources and significant investments in renewable generation. South Dakota and Iowa, for example, have favorable conditions for wind energy. Indeed, the Energy Information Administration found that wind turbines generated 63 percent of Iowa’s electricity in 2024, while the Missouri River provides South Dakota with abundant hydroelectric resources.[39] In contrast, Delaware (2.9 percent), the District of Columbia (2.1 percent), and Alaska (1.3 percent) have the lowest renewable energy consumption shares. (See figure 14.) These regions generally have more limited renewable resource availability or greater dependence on fossil fuels and imported electricity, contributing to renewable energy accounting for a smaller portion of their overall energy consumption.
Indian regions display substantially less variation in renewable energy consumption, with a variability score of 8.2. Lakshadweep has the highest renewable energy consumption share at 8.4 percent, closely followed by Puducherry and the Andaman & Nicobar Islands, both at 8.3 percent. At the other end of the distribution, Himachal Pradesh (0.8 percent), Jammu & Kashmir (0.5 percent), and Sikkim (0.2 percent) report the lowest shares. The relatively narrow range between most Indian regions suggests that renewable energy consumption remains a comparatively small component of total energy consumption across much of the country. Moreover, differences in renewable energy shares can reflect regional variation in energy demand, renewable resource availability, infrastructure, and the composition of energy consumption.
Expanding renewable energy consumption can help regions diversify their energy supplies, reduce dependence on fossil fuels, and lower greenhouse gas emissions while supporting the growth of clean-energy industries. Regions with relatively low renewable energy consumption can increase their shares by expanding renewable generation capacity, investing in transmission and energy-storage infrastructure, and creating a policy environment that encourages private investment in renewable energy. However, the appropriate renewable energy mix will differ across regions depending on their natural resources: regions with strong wind resources can prioritize wind generation, while those with abundant sunlight or suitable water resources can expand solar or hydropower generation.
Figure 15: Performance in renewable energy (highest-performing regions in darker shades)[40]
Household with Internet Facility
Why is this important? This indicator measures the share of households in a region with Internet access, including households not subscribed to the Internet but that still have access. The Internet represents an essential good for prosperity, productivity, health, and economic mobility and is now vital to full participation in today’s increasingly digitalized global economy. The COVID-19 pandemic vividly demonstrated how crucial widespread Internet adoption is to societies, enabling telework, tele-education, telehealth, etc. Access to the Internet increases access to employment and to information, and thus leads to economic growth.[41]
Figure 16: Percentage of households with access to the Internet, 2021–2022[42]
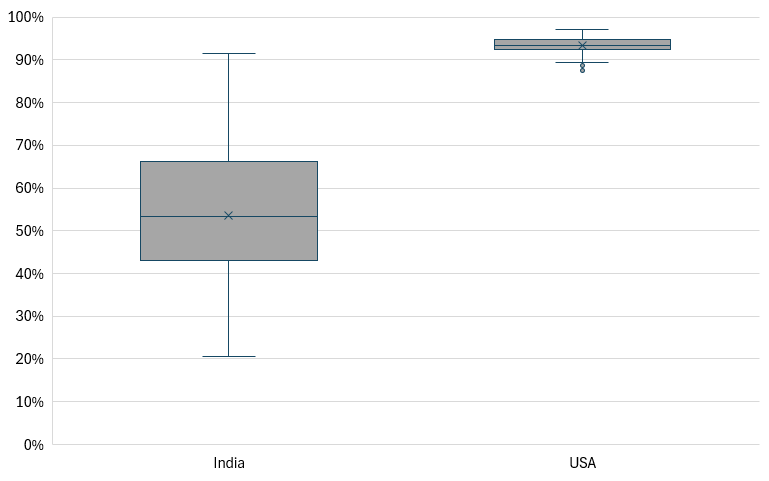
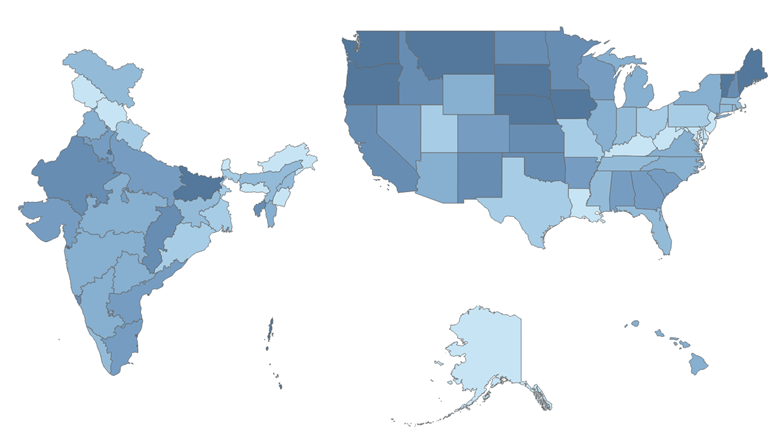
In India, Chandigarh has the highest percentage of the population with access to the Internet, at 91 percent. It is followed by Delhi and Sikkim, where around 79 percent each of households have access to Internet facilities. Most regions in India have Internet access rates ranging from 43 to 66 percent. However, areas such as Kerala (27 percent) and Lakshadweep (20 percent) indicate that there is significant room for improvement in digital infrastructure. (See figure 16.)
Access to Internet in the United States is a given in most states, with at least 87 percent of the population in every state having access to this vital technology. Utah, New Hampshire, and Washington have the greatest Internet distribution, with 97, 96, and 96 percent, respectively, of the population with access. These three states also have significant tech and information sectors. The states with the weakest rollout of Internet, Arkansas (89 percent), Louisiana (89 percent), and Mississippi (87 percent), are all located in the southeastern United States and have small tech sectors, as well as some of the weakest labor-force participation rates for individuals with a bachelor’s degree.
Figure 17: Performance in Internet access (highest-performing regions in darker shades)[43]
R&D Personnel
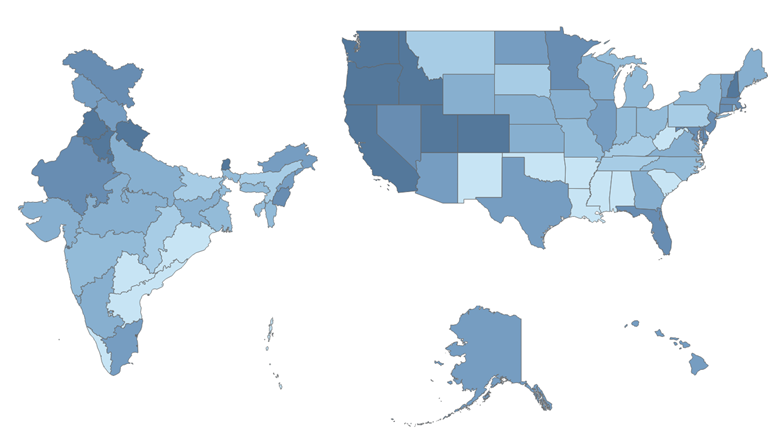
Why is this important? R&D personnel are important for conducting R&D activities and turning investments into productivity-enhancing knowledge and commercializable technologies. The R&D workforce also creates spillovers, because as workers move to other jobs, their frontier knowledge is applied beyond the research itself.[44] This indicator measures the number of R&D personnel as a share of each region’s total labor force. U.S. data on R&D personnel is from 2021, while India’s data is from 2022 to 2023.
Figure 18: R&D personnel as a share of all employees, 2021–2022[45]
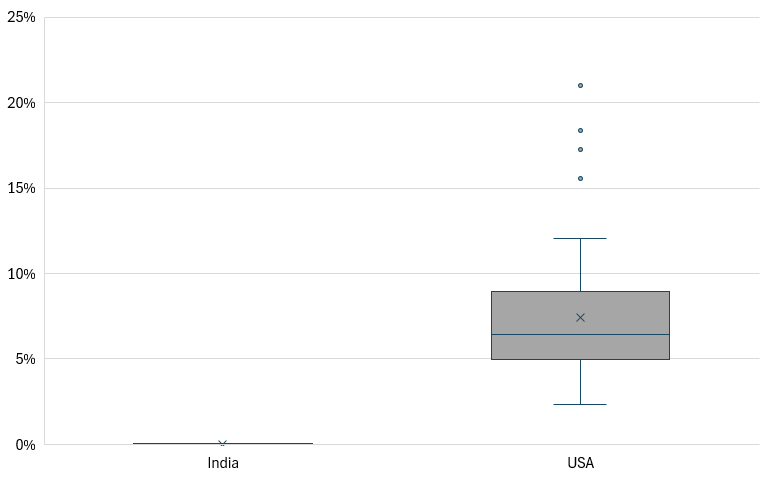
U.S. states with the highest rates of R&D personnel are those with large technology and innovation centers and large highly educated populations. Washington (21 percent), Massachusetts (18.4 percent), and California (17.2 percent) lead the list. There is a significant gap between the states with the largest proportion of R&D personnel and the smallest, with 18.7 percentage points separating Washington from Mississippi, the state with the smallest R&D workforce (2.3 percent). Kentucky (2.6 percent) and Arkansas (2.4 percent) also fall to the bottom of the list. (See figure 18.)
On the other hand, the workforce engaged in R&D constitutes a minimal portion of the total workforce in India. This situation reflects the limited R&D activity in the country. Across all Indian states, including those with higher rates of STEM employment or greater R&D intensity, less than 1 percent of the workforce is dedicated to R&D personnel. Uttarakhand, one of the fastest-growing states in India, has the highest percentage of its workforce dedicated to R&D, at 0.06 percent. The Andaman & Nicobar Islands and Delhi also have 0.06 percent each of their total workforce employed in R&D.
Figure 19: Performance in R&D personnel (highest-performing regions in darker shades)[46]
R&D Intensity
Why is this important? R&D expenditure constitutes a critical innovation input, as it measures the overall investment in new knowledge and the early stages of technological development within a region. While not all innovation is R&D based, R&D expenditure is highly correlated with innovation performance, as it reflects investments in advancing scientific and technological frontiers. Additionally, R&D investment has been positively correlated with the number of patent applications filed by a firm, the establishment and growth rate of start-ups, and the ability of a firm to export.[47] This indicator measures R&D expenditures by all funding sources (business, government, and higher education) in a region relative to its GDP.
Figure 20: R&D expenditures as a share of GDP, 2023–2024[48]
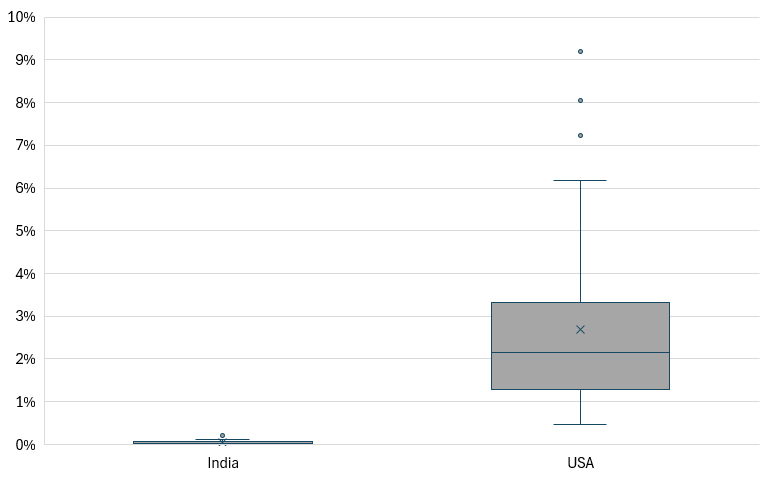
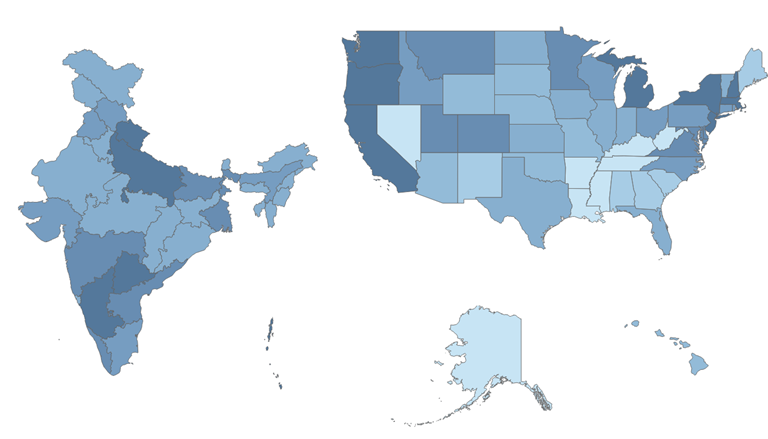
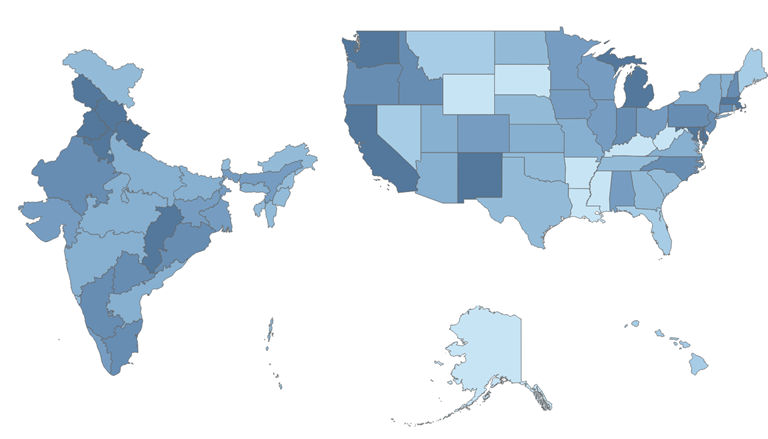
U.S. regions vary considerably in R&D intensity, with a variability score of 8.7. Massachusetts (9.2 percent), New Mexico (8.0 percent), Washington (7.3 percent), and California (7.2 percent) have the highest R&D expenditures as a share of GDP. These states have particularly research-intensive economies because they host concentrations of technology companies, research universities, federal laboratories, and other research institutions. The composition differs across states. Massachusetts and California have major technology and life sciences clusters and extensive university research, while Washington is home to a large technology sector. Meanwhile, New Mexico is home to federal research institutions, including Los Alamos and Sandia National Laboratories. In contrast, Louisiana (0.61 percent), South Dakota (0.60 percent), and Wyoming (0.50 percent) have the lowest R&D intensities. (See figure 20.) These states have economies that are less concentrated in R&D-intensive industries and have fewer large technology clusters, research institutions, and federal research facilities than do leading states.
Indian regions display substantially less variation in R&D intensity, with a variability score of just 0.28. Himachal Pradesh has the highest R&D intensity at 0.28 percent, followed by Punjab at 0.20 percent and Jammu & Kashmir at 0.12 percent. Despite having the highest R&D intensity, these three regions only accounted for 15.5 percent of total R&D spending in India. At the other end of the distribution, 13 Indian regions report R&D intensity at or near zero, including Adaman & Nicobar Islands, Delhi, Chandigarh, Sikkim, Puducherry, Dadra & Nagar Haveli and Daman & Diu, Ladakh, Arunachal Pradesh, Nagaland, Goa, Tripura, Mizoram, and Lakshadweep. The low R&D intensity of almost one-third of the Indian regions suggests that research and innovation capacity remains highly underdeveloped and unevenly distributed across the country.
Indian regions and lower-performing U.S. states should therefore prioritize policies that expand both public and private R&D investment. Regions can strengthen universities and research institutions, provide incentives for firms to establish R&D facilities, and develop partnerships among universities, industry, and government laboratories that help translate scientific research into commercial technologies. Regions should also focus these investments on areas where they have existing or emerging competitive strengths, using R&D funding to build clusters in advanced industries such as semiconductors, biotechnology, advanced manufacturing, clean energy, and information technology. Increasing R&D intensity ultimately requires not only greater public research funding but also an economic environment capable of attracting innovative firms, skilled researchers, and private investment.
Figure 21: Performance in R&D intensity (highest-performing regions in darker shades)[49]
Business Creation
Why is this important? Newcomer firms capable of challenging incumbents are essential for a business environment that rewards innovation and competitiveness. Start-up businesses often drive outside-the-box thinking in both established and emerging industries, accelerating the development of new technologies.[50] This indicator measures the share of a region’s business enterprises that were established over the previous year; however, this indicator is limited, as it does not capture business turnover, does not differentiate among industries with low or high knowledge intensity, and does not distinguish between subsistence-driven and competition-driven start-ups. Absent a better alternative at the cross-national regional level, this indicator reflects a region’s overall economic resilience and regional competitiveness.
Figure 22: Enterprise birth rate, 2023[51]
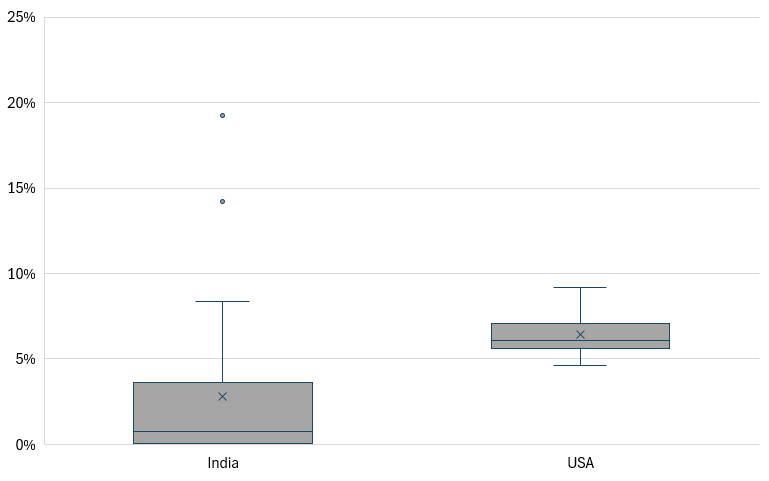
U.S. regions display moderate variation in business creation, with a 4.5 percentage-point difference between the highest- and lowest-performing states. Florida (9.2 percent), Wyoming (8.9 percent), and Delaware (8.8 percent) have the highest shares of businesses established over the previous year. These states generally offer relatively favorable environments for starting businesses, including business-friendly tax and regulatory structures and relatively low barriers to entry. Indeed, both Wyoming and Delaware have been ranked as some of the most favorable states to start a new business.[52] In contrast, Pennsylvania (5.1 percent), Iowa (4.9 percent), and West Virginia (4.6 percent) have the lowest rates of business creation. (See figure 22.) Slower population and economic growth in these areas can constrain the expansion of local markets and reduce opportunities for new firms relative to faster-growing states.
Indian regions display considerably greater variation in business creation, with a 19.2 percentage-point difference between the highest- and lowest-performing regions. Maharashtra leads Indian regions, with 19.3 percent of its businesses established over the previous year, followed by Delhi (14.2 percent) and West Bengal (8.4 percent). Maharashtra and Delhi contain some of India’s largest urban and commercial centers, providing entrepreneurs with access to large consumer markets, skilled workers, financial institutions, infrastructure, and established business networks. Maharashtra, in particular, includes Mumbai, India’s financial center, as well as a large and diverse industrial base. At the other end of the distribution, Ladakh, Lakshadweep, and Sikkim have business-creation rates near zero. These regions have much smaller populations and markets, limiting the scale of local demand, access to capital and workers, and opportunities for new businesses.
Low-performing U.S. states and Indian regions should seek to reduce unnecessary regulatory and administrative barriers to starting businesses, improve entrepreneurs’ access to financing, and invest in infrastructure and workforce development. Regions can also strengthen entrepreneurship by supporting connections between start-ups, universities, investors, and established firms. However, simply increasing the number of new businesses should not be the sole objective. Policymakers should foster an environment that enables productive and innovative firms to enter the market, scale, and compete over the long term.
Figure 23: Performance in business creation (highest-performing regions in darker shades)[53]
Patent Applications
Why is this important? A patent is an innovation output that protects or licenses an invention. Patents also secure private returns on investment in R&D activities, which are necessary to incentivize these activities and their socially desirable spillover effects. Patent applications per million inhabitants of a region measure the “inventiveness” of its residents. This indicator focuses on internationally filed patents under the Patent Cooperation Treaty (PCT) to mitigate differences in patent qualifications between countries’ patent offices.[54]
Figure 24: PCT patent applications per million inhabitants, 2022[55]
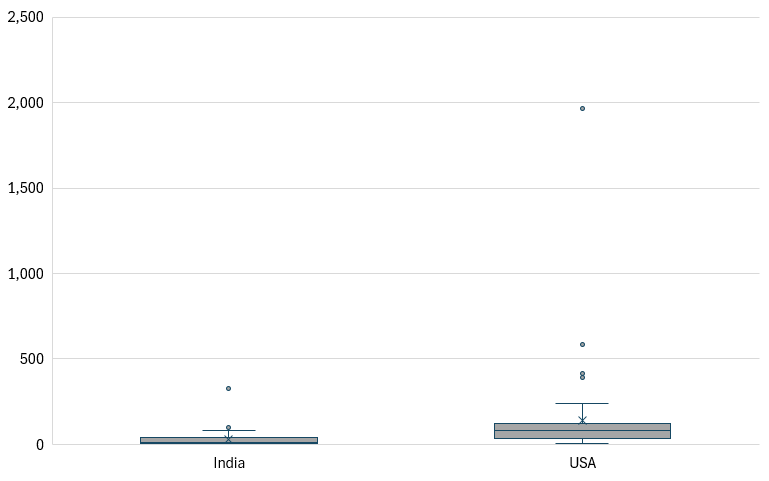
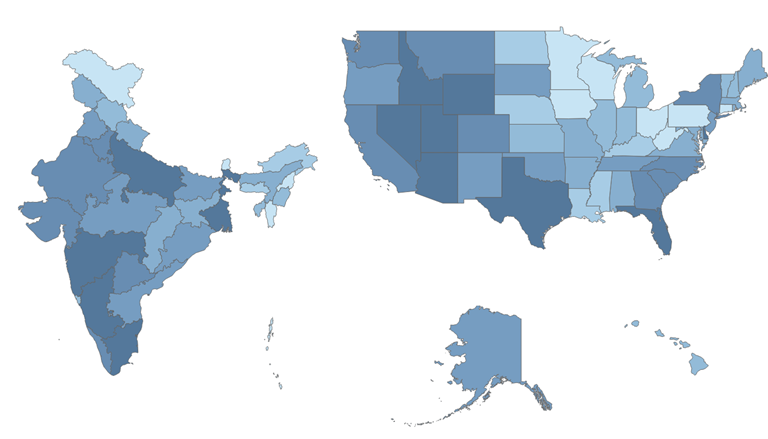
U.S. regions display substantial variation in patenting activity, with a difference of approximately 1,963 patent applications per million residents between the highest- and lowest-performing regions. The District of Columbia leads with 1,966 patent applications per million residents, followed by Massachusetts (587) and California (416). These regions benefit from dense concentrations of research universities, technology firms, highly skilled workers, and research institutions that generate and commercialize new technologies. Massachusetts and California, in particular, contain some of the country’s most prominent technology and life sciences clusters and consistently rank among the most R&D-intensive states. The District of Columbia’s unusually high rate may also partly reflect its small population and the concentration of research, government, and other knowledge-intensive institutions in the region (perhaps also because of filers identifying themselves as DC domiciled for patent-filing reasons). In contrast, Arkansas (15.2), Mississippi (8.2), and Alaska (3.5) exhibit the lowest rates of patent applications per million residents. (See figure 24.) These states have smaller technology sectors and fewer concentrations of R&D-intensive firms, research institutions, and highly skilled scientific and technical workers, limiting the ecosystems that typically generate patentable inventions.
Indian regions also display significant variation in patenting activity, with a difference of 330 patent applications per million residents between the highest- and lowest-performing regions. Chandigarh leads with 330 patent applications per million residents, followed by Delhi (100) and Punjab (79). Chandigarh and Delhi benefit from concentrations of universities, research institutions, and businesses, which provide stronger environments for generating and commercializing new ideas. At the other end of the distribution, Ladakh and Lakshadweep report no patent applications. Both regions have small populations and relatively limited industrial and research bases, reducing the number of institutions and firms engaged in patent-generating activities.[56] More broadly, approximately half of Indian regions report 10 or fewer patent applications per million residents. This suggests that inventive activity remains relatively limited and geographically concentrated across India, with many regions lacking the dense innovation ecosystems found in the country’s leading regions.
Low-performing U.S. states and Indian regions should strengthen the underlying innovation ecosystems that enable researchers and firms to develop patentable technologies. Regions can increase investments in R&D, strengthen research universities and institutions, attract R&D-intensive companies, and develop stronger partnerships between universities and industry to facilitate the commercialization of research. They can also support entrepreneurs and researchers in navigating the patenting and commercialization process and expand the supply of scientists, engineers, and other highly skilled workers. Ultimately, increasing patenting activity requires more than encouraging inventors to file patents; regions need to develop the research capabilities, innovative firms, skilled workforces, and institutions that generate commercially valuable inventions in the first place.
Figure 25: Performance in patent applications (highest-performing regions in darker shades)[57]
Distance to the Frontier
The distance to the frontier (DTF) analysis offers insights into the drivers of innovative competitiveness by quantifying how far each state is from the leading innovator: the District of Columbia (whose score is 67.92). For instance, Massachusetts ranks second with an overall index of 66.55, so its DTF is 1.37. In contrast, Chandigarh’s overall score on the index is 27.16, ranking it 52nd. A lower DTF indicates a closer proximity to the leading innovator.
Table 3: DTF performance
|
Country |
State |
Distance to Frontier |
|
United States |
Massachusetts |
1.37 |
|
United States |
California |
2.41 |
|
United States |
Washington |
8.05 |
|
United States |
Maryland |
11.89 |
|
United States |
Delaware |
12.54 |
|
United States |
New Mexico |
13.29 |
|
United States |
Virginia |
14.24 |
|
United States |
Oregon |
14.94 |
|
United States |
Wyoming |
15.10 |
|
United States |
Michigan |
17.48 |
|
United States |
New Jersey |
17.90 |
|
United States |
Connecticut |
18.63 |
|
United States |
New Hampshire |
18.83 |
|
United States |
Colorado |
18.97 |
|
United States |
Texas |
20.37 |
|
United States |
Illinois |
20.60 |
|
United States |
Arizona |
20.63 |
|
United States |
North Carolina |
20.73 |
|
United States |
Minnesota |
20.93 |
|
United States |
Indiana |
21.62 |
|
United States |
Utah |
22.08 |
|
United States |
New York |
22.46 |
|
United States |
Pennsylvania |
22.80 |
|
United States |
Louisiana |
23.78 |
|
United States |
Idaho |
24.27 |
|
United States |
Georgia |
24.79 |
|
United States |
Montana |
25.39 |
|
United States |
Vermont |
25.58 |
|
United States |
Wisconsin |
25.79 |
|
United States |
Kansas |
25.81 |
|
United States |
Maine |
26.17 |
|
United States |
Alabama |
26.76 |
|
United States |
Iowa |
26.84 |
|
United States |
Missouri |
26.91 |
|
United States |
South Dakota |
26.93 |
|
United States |
Ohio |
27.02 |
|
United States |
Rhode Island |
27.47 |
|
United States |
Tennessee |
27.59 |
|
United States |
Nebraska |
28.69 |
|
United States |
Oklahoma |
28.88 |
|
United States |
Nevada |
29.16 |
|
United States |
South Carolina |
29.19 |
|
United States |
North Dakota |
29.63 |
|
United States |
Florida |
29.83 |
|
United States |
West Virginia |
32.50 |
|
United States |
Kentucky |
32.50 |
|
United States |
Arkansas |
34.01 |
|
United States |
Mississippi |
34.34 |
|
United States |
Alaska |
35.30 |
|
United States |
Hawaii |
36.88 |
|
India |
Chandigarh |
40.76 |
|
India |
Maharashtra |
41.13 |
|
India |
Delhi |
42.62 |
|
India |
Puducherry |
45.38 |
|
India |
Karnataka |
45.86 |
|
India |
Haryana |
47.93 |
|
India |
Tamil Nadu |
47.98 |
|
India |
Telangana |
50.03 |
|
India |
Gujarat |
52.38 |
|
India |
Goa |
52.86 |
|
India |
Rajasthan |
55.27 |
|
India |
Kerala |
55.49 |
|
India |
Sikkim |
56.50 |
|
India |
Punjab |
56.72 |
|
India |
Uttar Pradesh |
58.50 |
|
India |
Odisha |
58.60 |
|
India |
West Bengal |
58.70 |
|
India |
Andhra Pradesh |
58.92 |
|
India |
Himachal Pradesh |
59.78 |
|
India |
Uttarakhand |
59.85 |
|
India |
Dadra & Nagar Haveli and Daman & Diu |
59.94 |
|
India |
Nagaland |
60.65 |
|
India |
Lakshadweep |
60.75 |
|
India |
Andaman & Nicobar Islands |
60.95 |
|
India |
Madhya Pradesh |
61.02 |
|
India |
Manipur |
61.34 |
|
India |
Jharkhand |
62.28 |
|
India |
Meghalaya |
62.49 |
|
India |
Jammu & Kashmir |
62.50 |
|
India |
Chhattisgarh |
62.54 |
|
India |
Arunachal Pradesh |
62.82 |
|
India |
Ladakh |
63.20 |
|
India |
Bihar |
63.22 |
|
India |
Mizoram |
63.65 |
|
India |
Tripura |
63.76 |
|
India |
Assam |
64.07 |
U.S. states exhibit robust and consistent performance in innovative competitiveness, clustering closer to the frontier. Massachusetts is only 1.37 points behind the District of Columbia while California is only 2.41 points behind, indicating nearly equivalent competitiveness in their innovative ecosystems. Similarly, Washington (third) and Maryland (fourth) fall behind the frontier by only 8.05 and 11.89 points, respectively, indicating strong innovation ecosystems but with varying degrees of strength. Even the lowest-performing U.S. state, Hawaii, has a DTF of 36.88 points, suggesting that despite inter-state disparities, U.S. states remain generally competitive and closer to the innovation frontier, underscoring their overall strength in innovation.
Indian states have substantially greater gaps from the innovation frontier, with Chandigarh, the most innovative Indian region, showing a 40.76-point difference from the District of Columbia, exceeding the gap of the least innovative U.S. state. This trend continues with Maharashtra (41.13) and Delhi (42.62), reflecting a significant gap in innovative ecosystems and capacities while also highlighting the areas that need improvement. Most of the northeastern and eastern states, such as Arunachal Pradesh, Bihar, and Mizoram, have a 63- to 64-point gap to the District of Columbia, revealing a critical divide in innovation readiness.
The DTF analysis reveals stark contrasts between U.S. and Indian states regarding innovation capacity. Despite internal variations, U.S. states are generally well aligned with global innovation benchmarks. Even the states with lower scores remain within 37 points of the innovation frontier, indicating a solid foundation nationwide. This can be attributed to established innovation ecosystems, robust R&D spending, and favorable business environments that enable subnational competitiveness. This is not to say that there isn’t room for growth for U.S. states, as there is still a 37-point gap between the weakest and strongest states. Rather, U.S. states are positioned to close innovation gaps when concerted innovation-centric policy is introduced. In contrast, Indian states face much wider gaps despite high potential with their demographic-dividend and knowledge-based economies, with Chandigarh already 41 points behind the District of Columbia and the differences widening as one moves down the list. The substantial DTF differences for Indian states indicate that their innovation ecosystems are still factor driven or not at the innovative-driven stage, especially compared with the U.S. states.
Indian regions must focus on developing a robust triple helix innovation ecosystem to move closer to the frontier of innovation. California and Massachusetts have cities with many significant research institutions, attracting substantial federal funding for research. These grants go on to produce basic research, which is, in turn, used to develop products by firms located around the universities. This cycle of interaction between universities, firms, and the government has been proven to produce constant innovation and strong research ecosystems.
In California, universities such as the University of California-Berkeley and Stanford have become the center of these innovation hubs. World-renowned researchers from these universities have created some of the world’s most influential technology companies, including Elon Musk, founder of the two wildly innovative firms Tesla and SpaceX. Many of these companies are headquartered in and around the San Francisco/Silicon Valley area, making it the technology and innovation hub it is today. The same can be said about Massachusetts, where universities such as MIT and Harvard have attracted billions of dollars in research funding and become the bedrock of the innovation hub that is Cambridge, Massachusetts.
To help Indian states progress toward the frontier, embracing a triple helix structure that fosters collaboration among government, academia, and industry is essential. Significant advancements can be achieved by increasing private sector investment in R&D and enhancing employment opportunities in STEM fields. State governments can play a pivotal role by incentivizing R&D in both public institutions and private enterprises, as well as in universities and innovative start-ups. While it may take more than a decade to bridge the DTF, the commitment to investing in research will yield substantial benefits. This approach will enhance innovative capacity and propel Indian regions closer to the frontier and toward a more prosperous future.
Why Does Measuring Subnational Innovation Competitiveness Matter?
As countries intensify efforts to boost their competitiveness in the age of AI, they cannot overlook innovative capacity at the subnational level. Focusing on improving innovative competitiveness while ignoring disparities in innovative capacity across subnational regions will widen disparities in the prosperity landscape as drivers of innovation continue to concentrate in a few provinces.
National averages and aggregate scores often mask substantial differences in the distribution of research institutions, skilled workers, productive firms, capital, and innovation resources. A comprehensive understanding of competitiveness and innovation therefore requires examining not only differences across countries but also disparities within them.
The Transatlantic Subnational Innovation Competitiveness and U.S.-India Competitiveness indices have helped bridge evidence gaps at the subnational level and enabled regions to compare themselves with a wider set of international peers. The United States provides a particularly useful global reference point. Massachusetts, California, Delaware, Maryland, and Washington have led across both indices, with those indices pointing to highly developed regional innovation ecosystems and providing useful reference cases for regions seeking to strengthen their own competitiveness.
Beyond the frontier, the results also underline the scale of regional disparity. Germany’s scores range from 73.5 for Baden-Württemberg to 34.5 for Mecklenburg-Western Pomerania, while Sweden ranges from 74.9 for the Greater Metropolitan Region to 35.9 for North Middle Sweden.[58] The concentration is more pronounced in certain countries. For example, in Hungary, Budapest scores 58.1 compared with 18.24 for Southern Transdanubia, while in Poland, Warszawski Stołeczny scores 69.1 compared with 23.8 for Mazowiecki Regionalny.[59]
In India, we see a similar disparity in the subnational innovation competitiveness landscape: Chandigarh (27.16), Maharashtra (26.79), Delhi (25.30), Puducherry (22.54), and Karnataka (22.06) are top performers, while many states and union territories recorded substantially lower scores. Across India’s 36 states and territories, the median score is 8.57, and 61 states and territories score below 10. Although the two indices use different parameters, weights, and data, making their scores not directly comparable, they assess the same pillars and, together, reveal a broader pattern. Innovation leadership is concentrated in particular regions, while substantial gaps persist elsewhere, including in India and other countries seeking to catch up with the innovation frontier. This creates considerable scope for cross-country learning while highlighting that innovation policies must respond to differing regional capabilities rather than treat the national economy as a uniform innovation ecosystem.
U.S.-India Innovation Landscape: Divergent Capabilities, Emerging Interdependencies
The innovation landscapes of the United States and India reflect distinct levels of technological development, research capacity, and industrial specialization. The United States has an established innovation ecosystem spanning frontier scientific research, advanced technology development, venture capital, and the commercialization of intellectual property. India has built significant capabilities in software, engineering, pharmaceuticals, digital technologies, and technology-enabled services, alongside an expanding manufacturing and research base. Yet, differences in research intensity, private-sector investment, and the depth of advanced technology ecosystems continue to shape the two countries’ positions in the global innovation landscape.
AI brings a contrast in innovation capacity into particular focus. The United States approaches AI from an established position in the technological frontier. Its 2025 America’s AI Action Plan explicitly frames AI leadership as an economic and national security objective and is organized around three priorities: creating AI innovation, building domestic AI capacity, and leading international AI diplomacy and security.[60] Independently, the strategy seeks to support the American AI technology stack, including hardware, models, software, and standards, to allies and partners, reflecting the United States’ existing position as a major producer of frontier AI technologies.
Meanwhile, India is approaching the same technological transition from a different starting point. Its 2018 National Strategy for Artificial Intelligence emphasizes AI for all, research, scaling, and diffusion of AI across priority sectors. While the India AI Mission Launch 2024 has moved toward building more of the underlying ecosystem through centralized compute, datasets, combined models, start-up support, and application development, the difference reflects their respective positions in the AI ecosystem; the difference is there for both ability and strategic options.[61] The United States seeks to defend and extend an existing frontier position while India pursues technological catch-up, building greater domestic capability and accelerating adoption across its economy.
India’s efforts to build AI capabilities also highlight the distinction between access to computing infrastructure and control over the technologies that underpin it. The IndiaAI Mission has established a shared computing facility, with more than 38,000 graphical processing units (GPUs) onboarded by February 2026 to expand access for researchers, start-ups, and other users.[62] However, access to GPUs does not, in itself, translate into domestic semiconductor manufacturing, ownership of advanced computing infrastructure, or the capacity to train frontier models at the scale of leading U.S. firms. India’s AI ecosystem is therefore developing through a combination of domestic infrastructure, application-led innovation, and efforts to strengthen indigenous research and model development.
The two countries’ innovation systems are increasingly interconnected through technology, capital, talent, and research networks, but the relationship remains asymmetric. U.S. firms and institutions bring advanced computing, foundational technologies, investment, and established research ecosystems, while India contributes software and engineering capabilities, a large technical workforce, and a growing market for technology deployment. The U.S.–India TRUST initiative, launched in 2025, seeks to deepen cooperation in AI, semiconductors, quantum technologies, and other critical technologies.[63] At the same time, the AI boom is reshaping semiconductor supply chains: rising demand for memory chips and other components used in AI infrastructure has contributed to “chipflation,” increasing cost pressures across technology-intensive industries.[64] For India, which relies on imported semiconductor components, these pressures underscore the economic implications of dependence on critical technologies. The extent to which bilateral cooperation strengthens India’s domestic research capabilities, indigenous intellectual property and technology-owning firms will shape the longer-term distribution of capabilities and value between the two countries.
These capabilities are also embedded in geographically concentrated innovation clusters. In the United States, established technology hubs such as Silicon Valley in California, the Boston–Cambridge innovation ecosystem in Massachusetts, and the technology corridor spanning Austin and Dallas in Texas bring together research universities, advanced technology firms, venture capital, and specialized labor markets. In India, Bengaluru, Hyderabad, and Delhi–NCR have emerged as major centers of technology and AI activity, while Gujarat, Tamil Nadu, and Karnataka are developing semiconductor ecosystems.[65] Yet, the presence of firms and investment alone does not establish a self-sustaining innovation cluster. The depth of research networks, specialized suppliers, skilled labor markets, and university–industry linkages determines whether these regions can generate and commercialize technologies locally. Differences in these underlying capabilities help explain the uneven distribution of innovation across and within the two countries.
The central challenge for India is to translate its growing participation in global innovation networks into deeper domestic technological capabilities. Expanding access to AI infrastructure and attracting investment can accelerate this process, but sustained innovation will depend on strengthening research institutions, developing indigenous technologies, deepening advanced manufacturing capabilities, and enabling domestic firms to capture greater value from innovation. The evolution of the U.S.–India relationship will therefore be shaped by not only the scale of bilateral cooperation but also how effectively each country’s innovation clusters convert talent, research, and investment into technological capabilities and economic value.
Policy Recommendations
United States
Knowledge Economy
U.S. states should prioritize developing and retaining highly skilled workers while helping firms raise productivity. States with relatively low shares of STEM workers and PTS services employees should strengthen STEM education at universities and community colleges, expand apprenticeships and industry-recognized technical training, and build stronger partnerships between educational institutions and employers. States should also make it easier to retain graduates and attract highly skilled workers from elsewhere in the country and abroad.
These policies are particularly important given the growing role of STEM workers in the U.S. economy. The U.S. STEM workforce grew from 29 million workers in 2014 to 37 million in 2024, an increase of roughly 28 percent.[66] By 2024, STEM workers accounted for 26 percent of the entire U.S. workforce.[67] Of these workers, 27 percent were employed in science and engineering occupations, 37 percent in science- and engineering-related occupations, and 35 percent in STEM middle-skill occupations.[68] This broad distribution underscores that states need not only scientists and engineers with advanced degrees but also technicians and other middle-skill workers who support technology-intensive industries. Skilled workers help firms develop new technologies, adopt more sophisticated production processes, and move into higher-value-added activities. States that cannot develop or attract these workers may struggle to build and retain advanced industries, particularly as competition for technical talent intensifies across the United States.
States should also focus on increasing manufacturing labor productivity by encouraging investment in automation, advanced machinery, digital technologies, and workforce training. This is particularly important given the long-term weakness in U.S. manufacturing productivity. Manufacturing labor productivity fell from an index level of 102.8 in 2013 to 99.3 in 2025 (2017=100), meaning manufacturing workers produced slightly less output per hour in 2025 than they did more than a decade earlier.[69] At the same time, manufacturing value added accounted for approximately 9.5 percent of U.S. GDP in 2025, making improvements in the sector’s productivity consequential for the broader economy.[70]
Technical assistance can be particularly valuable for small and medium-sized manufacturers that may lack the resources or expertise to adopt new technologies on their own. Higher manufacturing productivity is important because long-term improvements in wages and living standards ultimately depend on workers and firms producing more value with the resources available to them. Raising productivity also allows U.S. manufacturers to compete more effectively with lower-cost foreign producers without relying primarily on lower wages or other cost reductions.
Globalization
U.S. states should seek to attract FDI that complements their existing and emerging industrial strengths. Rather than competing primarily through tax incentives, states should improve the underlying factors that make locations attractive to globally competitive companies, including skilled labor, transportation and digital infrastructure, reliable energy, research institutions, and efficient permitting. State economic-development agencies can also target foreign investment in industries that reinforce existing regional clusters.
Attracting FDI is important because foreign investment can bring capital, technology, managerial expertise, and connections to international markets into state economies. The employment footprint of foreign-owned companies is already substantial: in 2022, majority-owned U.S. affiliates of foreign multinational enterprises employed 8.35 million workers in the United States, equivalent to roughly 5 percent of total U.S. employment.[71] Foreign firms can also generate benefits for domestic companies when they purchase from local suppliers, hire and train local workers, or collaborate with universities and research institutions. States should therefore complement investment attraction with programs that connect foreign investors with domestic firms and help ensure that more of the economic benefits remain within the states.
States should simultaneously help domestic firms expand into international markets. Export assistance can help small and medium-sized businesses identify foreign customers, navigate international regulations, meet technical standards, and participate in global supply chains. The importance of exports extends well beyond exporting firms themselves: in 2022, U.S. exports directly and indirectly supported an estimated 10.2 million jobs, equivalent to 6.7 percent of total U.S. employment.[72] States with particularly low high-tech export shares should therefore focus on strengthening advanced industries such as machinery, electronics, electrical equipment, aerospace, semiconductors, and other technology-intensive manufacturing sectors.
Increasing high-tech exports is important because access to global markets allows innovative firms to sell beyond the limits of their local and national markets, achieve greater economies of scale, and support high-value production and employment at home. A stronger presence in internationally traded advanced industries can also make state economies more competitive in sectors where technological capabilities and productivity are particularly important.
Innovative Capacity
U.S. states should strengthen their ability to generate new knowledge and translate it into commercially valuable technologies. States with low R&D intensity or relatively few R&D personnel should support university research, public-private research partnerships, and programs that help universities and businesses compete for federal research funding. States can also encourage greater private-sector R&D through appropriately designed incentives and programs that reduce the cost and risk of developing new technologies.
R&D is important because technological innovation is a major source of long-term productivity and economic growth. The scale of the U.S. research enterprise illustrates its importance. Indeed, the United States invested approximately $1.01 trillion in R&D in 2024, up from $940 billion in 2023.[73] However, research spending alone does not guarantee economic benefits. States also need mechanisms that move discoveries from laboratories to the marketplace. Universities should employ effective technology-transfer programs, while entrepreneurs should have access to incubators, accelerators, laboratories, early-stage financing, and other resources necessary to commercialize new technologies. Strengthening these institutions can help translate R&D into patents, new firms, products, and employment.
States with low rates of business creation should also examine regulatory, financial, and institutional barriers that make it difficult to start and scale new firms. Entrepreneurship is important because new firms can introduce new technologies and business models, increase competition, and create new sources of economic growth. Similarly, increasing patenting can indicate that researchers and firms are generating potentially commercially valuable inventions, although policymakers should focus on improving the underlying conditions for invention rather than simply maximizing the number of patents.
States should also ensure widespread access to high-speed Internet. Broadband has become essential infrastructure for businesses, workers, students, and households participating in an increasingly digital economy. The economic benefits of greater connectivity can be substantial: economists at Telecom Advisory Services estimate that increased broadband adoption and faster speeds contributed $1.3 trillion to U.S. GDP between 2010 and 2020.[74] They estimate that faster broadband speeds accounted for 11.5 percent of U.S. GDP growth during the decade, while increased broadband adoption accounted for another 10.9 percent.[75] Closing remaining gaps in Internet access is therefore particularly important for rural and underserved communities, where inadequate connectivity can restrict access to employment, education, entrepreneurship, and digital services.
In addition, states without one should develop a comprehensive AI strategy that addresses research, technology adoption, workforce development, infrastructure, and appropriate government use of AI. Such strategies are increasingly important because AI has the potential to positively affect productivity and competitiveness across a wide range of industries. Recent research examining firms during the first two years after AI adoption finds that companies making intensive use of AI increased total employment by 10.2 percent, while firms that adopted AI only sparingly experienced no statistically significant increase in employment.[76] A recent National Bureau of Economic Research study similarly finds positive labor-productivity gains from AI across sectors, with the effects expected to strengthen as adoption matures.[77] As a result, economists at Goldman Sachs estimate that widespread AI adoption could increase annual U.S. productivity growth by 0.3 to 3.0 percentage points, with a midpoint estimate of 1.5 percentage points.[78] A state strategy can help policymakers identify local economic opportunities, prepare workers for changing skill requirements, encourage adoption among businesses, and coordinate investments across government agencies.
Taken together, these policies are important because innovation does not result from any single input. Talent supports research, research produces new knowledge, entrepreneurship and technology transfer help commercialize that knowledge, investment allows firms to scale, and access to domestic and international markets allows successful firms to grow. U.S. states should therefore treat knowledge development, globalization, and innovative capacity as interconnected components of state competitiveness rather than as separate policy objectives.
India
Knowledge Economy
India’s demographic advantage will translate into innovation competitiveness across states only if a much larger share of its workforce can participate in knowledge- and technology-intensive activities. NITI Aayog (National Institution for Transforming India) notes that India’s median age is about 28 years but still argues that the country’s skill architecture needs substantial reorientation toward changing labor market demand.[79]
The Institute of Competitiveness’s Skills for the Future: Transforming India’s Workforce Landscape report, using PLFS 23-24 data, finds that 88 percent of India’s workforce is concentrated in low-competency occupations, while only 10 percent to 12 percent is employed in high-competency roles.[80] This challenge is reflected in the job index.[81] These challenges persistently reflect at the regional level, for instance, PTS employment ranges from 1.16 percent in Bihar to 15.75 percent in Chandigarh. STEM employment also varies sharply across states.
The policy implication extends beyond expanding standalone skill mission programs. The underlying challenge concerns the connection between education, skills, and the creation of high-productivity jobs. India now needs to address the education–skill continuum problem, which will help it move toward creating high-productivity jobs, not just lower-skill jobs. It will also enable it to create pathways through which India’s demographic dividend becomes a high-productivity, capable workforce.
Globalization
Indian states’ globalization challenges increasingly concern concentration rather than the amount of FDI. The index already shows large differences in FDI exposure across states. Karnataka records FDI equal to 7.2 percent of GDP, while several states record little or no FDI. More general evidence suggests that concentration extends well beyond the state level using FDI data.
At the district level, India received $57.2 billion in FDI equity in 2024, of which Mumbai and Bangalore Urban accounted for 37.5 percent and 23 percent, respectively. Delhi, Ahmedabad, and Gujarat were the next-three-leading locations, while 90 percent of FDI is concentrated in just 12 of the country’s more than 780 districts.[82] This suggests that attracting additional FDI is only part of the issue. A broader policy question is how more regions can develop capabilities that make investment economically viable. Skilled labor, reliable infrastructure, supply networks, and institutional sector clusters are essential foundations. Investment promotion incentives can complement these capabilities but cannot substitute for them. Accordingly, policy in lagging regions should focus on fostering investment, strengthening regional integration, and connecting domestic firms to global value chains.
Innovative Capacity
India’s innovation capacity challenge is not simply to accelerate AI adoption, but also to strengthen its position in the underlying technology that increasingly defines the global innovation frontier. India is a large and rapidly growing user of AI, but it does not yet possess a frontier AI ecosystem comparable in scale and capability to those built around firms such as OpenAI in the United States or DeepSeek and Alibaba in China.
Stanford’s “2026 AI Index” shows that leading model development remains concentrated in the United States and China, even as participation broadens elsewhere.[83] The India AI mission represents an important effort to narrow this gap through shared compute, datasets, start-up financing, and support for indigenous foundation models. India has launched domestic models and selected multiple teams for development, and the government itself recognizes continuing capability gaps across compute, semiconductors, foundation models, and advancements. These efforts should therefore be understood as part of closing that gap rather than evidence that technology maturity has already been achieved.[84]
India must pursue frontier catch-up and domestic diffusion simultaneously. Stronger U.S.–India collaboration in research, computing, academia, talent, and commercialization can expose Indian firms and researchers to leading capabilities as local capacity grows. India should also invest in compute infrastructure, datasets, research institutions, start-ups, and model development. Catch-up must address regional gaps in R&D, patents, entrepreneurship, connectivity, and AI policy. The goal is not isolation, but rather stronger strategic capabilities through international collaboration, wider AI integration, and increased R&D intensity for universities, MSMEs (micro, small, and medium enterprises), and regional ecosystems, not just major firms and cities.
Conclusion
Developing a strong innovation ecosystem is key to sustained economic growth and prosperity in the 21st century. This report has analyzed 12 indicators that assess regional innovation competitiveness across the United States and India, revealing significant strengths and disparities within both countries. While leading U.S. states and Indian states and union territories demonstrate considerable innovation capacity, many regions continue to lag behind in areas such as knowledge-based employment, globalization, and innovation capacity. Understanding these regional differences can help policymakers in both countries identify where targeted policies and investments can strengthen competitiveness. Ultimately, the long-term economic success of the United States and India will depend in part on their ability to expand innovation and productivity beyond their leading regions and build more competitive innovation ecosystems throughout their economies.
Appendices
Appendix A: Composite and Category Scores Methodology
Since each indicator is measured using a different unit with large variations in scale, indicator values were converted to a standardized score with a mean of zero and a standard deviation of one. Indicator data was normalized using either GDP or population to enable relative state comparison.
We modified all the indicators in the final set such that a greater value corresponds to a higher score for the state or province. Therefore, we applied transformations to ensure a positive impact. We did not invert any indicators during the index assessment.
To determine the compatibility of each indicator, an exploratory factor analysis was undertaken to test the underlying factors among the set of selected indicators in each category. Cronbach’s alpha was then calculated to measure internal consistency. The alpha value is expressed as a number between 0 and 1, where an alpha value above 0.7 for any logical grouping of variables indicates consistency and guarantees validity.[85] Cronbach’s alpha, α, can be defined as:
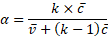
Wherein  denotes the number of scale indicators,
  denotes the average of all covariances between indicators, and
  denotes the average variance of each indicator.
The Kaiser-Meyer-Olkin (KMO) measure of sampling adequacy evaluates the goodness of fit after calculating each pillar. The KMO index ranges from 0 to 1, where a KMO score over 0.5 indicates validity.[86] Table 4 displays the results of this analysis. The alpha and KMO score for all pillars is above the set standards.
Table 4: Cronbach’s alpha and KMO scores of three categories
|
Pillar |
Alpha |
KMO |
|
Knowledge Economy |
0.83 |
0.63 |
|
Innovative Capacity |
0.86 |
0.80 |
|
Globalization |
0.81 |
0.71 |
The Principal Component Analysis (PCA) calculates the weights of indicators within a pillar and the overall index score. PCA is a statistical technique that reduces the number of variables in an analysis by describing a series of uncorrelated linear combinations of the variables that contain the most variance. Indicator weights can be found in table 6.
The last step in determining the pillar score involves transforming the values to a 0-to-100 scale. In addition to using regional indicator data, scores are calculated using the best and worst scenario data, which are the best- and worst-case values from the dataset or adopted from the subnational data.

Here,  denotes the weightage of each indicator.
This method enhances comparability and comprehensiveness across the dataset. We use the following formula for the calculation:

 represents the raw pillar values.
The overall index score is calculated as a weighted sum of the category scores. Each dimension’s contribution to the overall index will be based on both the PCA-derived dimension weights and an additional set of external weightings reflecting its relative importance.
Each dimension score is calculated as a weighted sum of its normalized pillar scores:

The overall index is then calculated as a weighted sum of the dimension scores using the external weightings shown in table 5.
Table 5: Dimension weights in the overall index
|
Dimension |
Weight |
|
Knowledge Economy |
0.4432 |
|
Globalization |
0.1125 |
|
Innovation Capacity |
0.4442 |

Appendix B: Indicator Methodologies and Weights
Table 6: U.S.-India SICI Indicator Information
|
Pillar |
Indicator |
Description |
Year |
Weight |
|
Knowledge Economy |
Professional, scientific, and technical services employees |
Share of employees in professional, technical, and scientific activities sector |
2023 |
0.29 |
|
Knowledge Economy |
Manufacturing Labor Productivity |
PPP-adjusted GVA per worker in the manufacturing sector |
2025 |
0.36 |
|
Knowledge Economy |
Share of workers employed in STEM jobs |
Share of workers employed in STEM activities |
2021 |
0.35 |
|
Globalization |
Inward FDI |
FDI inflow as a share of GDP |
2025 |
0.5 |
|
Globalization |
High tech Exports share |
Exports in NAICS codes 333–335 (or equivalent) as a share of total exports |
2025 |
0.5 |
|
Innovative Capacity |
AI policy |
Yes/No: Does the state have a policy plan/strategy regarding AI? If yes, provide year of plan enactment and link to plan |
Latest |
0.14 |
|
Innovative Capacity |
Renewable energy share |
Renewable energy consumed as a share of total energy consumed |
2024 |
0.11 |
|
Innovative Capacity |
Internet Access Households with Internet facility |
Percentage of households with access to Internet |
2021–22 |
0.15 |
|
Innovative Capacity |
R&D Personnel |
R&D personnel as a share of total employees |
2021–22 |
0.18 |
|
Innovative Capacity |
R&D Intensity |
R&D expenditures as a share of GDP |
2023–24 |
0.17 |
|
Innovative Capacity |
Business Creation |
Enterprise birth rate as a share of employer enterprises |
2023 |
0.14 |
|
Innovative Capacity |
Patent Applications |
PCT patent applications per million residents |
2022 |
0.11 |
About the Authors
Amit Kapoor, Ph.D., is honorary chairman at the Institute for Competitiveness, India (IFC). He is an affiliate faculty member at Harvard Business School’s Institute of Strategy and Competitiveness, where he teaches courses on the Microeconomics of Competitiveness and Value-Based Health Care Delivery. He is also an instructor with Harvard Business Publishing in the area of Strategy, Competitiveness, and Business Models, and a lecturer at Stanford University, where he teaches courses on Reimagining Capitalism, Innovation and Competitiveness, and Understanding Modern India.
Stephen Ezell is executive vice president for global innovation policy at ITIF and director of ITIF’s Center for Life Sciences Innovation. He also leads the Global Trade and Innovation Policy Alliance.
Trelysa Long is a policy analyst for ITIF’s global innovation policy team.
Sheen Zutshi is a research manager at IFC.
About ITIF
The Information Technology and Innovation Foundation (ITIF) is an independent 501(c)(3) nonprofit, nonpartisan research and educational institute that has been recognized repeatedly as the world’s leading think tank for science and technology policy. Its mission is to formulate, evaluate, and promote policy solutions that accelerate innovation and boost productivity to spur growth, opportunity, and progress. For more information, visit itif.org/about.
About IFC
Institute for Competitiveness, India (IFC) is the Indian knot in the global network of the Institute for Strategy and Competitiveness at Harvard Business School. IFC is an international initiative centered in India, dedicated to enlarging and purposeful disseminating of the body of research and knowledge on competition and strategy, as pioneered over the last 35 years by Professor Michael Porter of the Institute for Strategy and Competitiveness at Harvard Business School. For more information, visit competitiveness.in.
Endnotes
[1]. The Global Trade and Innovation Policy Alliance, “About,” https://gtipa.org/.
[2]. Omar Farrag and Patrice Robitaille, “India and the Global Economy,” Board of Governors of the Federal Reserve System, April 8, 2026, https://www.federalreserve.gov/econres/notes/feds-notes/india-and-the-global-economy-20260408.html.
[3]. Omar Farrag and Patrice Robitaille, “India and the Global Economy,” Board of Governors of the Federal Reserve System, April 8, 2026, https://www.federalreserve.gov/econres/notes/feds-notes/india-and-the-global-economy-20260408.html.
[4]. “High-technology exports (% of manufactured exports) – India,” World Bank, https://data.worldbank.org/indicator/TX.VAL.TECH.MF.ZS?locations=IN.
[5]. “Competitiveness Roadmap for India@100” (Institute for Competitiveness, August 24, 2022), https://competitiveness.in/wp-content/uploads/2022/08/Report_Competitiveness_Roadmap-25_August_2022_Web_Version.pdf.
[6]. Ellen Glover, “41 Technology Companies in India to Know,” Built In, September 20, 2024, https://builtin.com/articles/technology-companies-in-india.
[7]. “The India FDI Story: Top Sectors Attracting Foreign Investment,” Invest India, July 10, 2026, https://www.investindia.gov.in/india-fdi-investment-key-sectors.
[8]. “Global innovation Index 2025: innovation at a Crossroads,” WIPO, 2025, https://www.wipo.int/web-publications/global-innovation-index-2025/assets/89507/global-innovation-index-2025-en.pdf.
[9]. “Global Innovation Index 2015,” World Intellectual Property Organization, https://www.wipo.int/publications/en/details.jsp?id=3978.
[10]. Amit Kapoor and Neeraj Sinha, India Innovation Index (Institute for Competitiveness and NITI Aayog, 2021), https://www.niti.gov.in/sites/default/files/2022-07/India-Innovation-Index-2021-Web-Version_21_7_22.pdf.
[11]. Robert D. Atkinson and Caleb Foote, “The 2020 State New Economy Index, Benchmarking Economic Transformation in the States” (ITIF, Updated March 2021), https://www2.itif.org/2020-state-new-economy-index.pdf.
[12] Meghan Ostertag et al., “Balkan Subnational Innovation Competitiveness Index” (ITIF, May 2026), https://itif.org/publications/2026/05/26/balkan-subnational-innovation-competitiveness-index/.
[13]. Authors’ calculation. For further information please see our methodology in the Appendices section.
[14]. Ibid.
[15]. “Professional, Scientific, and Technical Services,” DataUSA, accessed May 6, 2026, https://datausa.io/profile/naics/professional-scientific-technical-services.
[16]. U.S. Census Bureau, County Business Patterns (professional, scientific, and technical employees and total employees in 2023), accessed 2026, https://data.census.gov/table/CBP2023.CB2300CBP?q=CBP2023.CB2300CBP&g=040XX00US01,02,04,05,06,08,09,10,11,12,13,15,16,17,18,19,20,21,22,23,24,25,26,27,28,29,30,31,32,33,34,35,36,37,38,39,40,41,42,44,45,46,47,48,49,50,51,53,54,55,56,72&codeset=naics~00&nk.; Authors’ calculations based on unit-level data from the Periodic Labour Force Survey (PLFS), Calendar Year 2023 (January–December 2023), National Sample Survey Office (NSSO), Ministry of Statistics and Programme Implementation (MoSPI), Government of India. Occupational groups are identified using the National Classification of Occupations (NCO) codes available in the PLFS unit-level data.; Ministry of Statistics and Programme Implementation, “Periodic Labour Force Survey (PLFS), Calendar Year 2023 (Jan23 Dec23),” https://microdata.gov.in/NADA/index.php/catalog/208.
[17]. Ibid.
[18]. “Manufacturing Productivity by State (2025-2026),” Manufacturing Lead Generation, updated April 15, 2026, https://manufacturingleadgeneration.com/manufacturing-productivity-by-state/.; Washington DC data retained from previous version of U.S.���India Subnational Index.; Authors’ calculations based on GVA and Total Persons Engaged from the Annual Survey of Industries (ASI) 2023–24, National Statistics Office (NSO), Ministry of Statistics and Programme Implementation (MoSPI), Government of India.; Ministry of Statistics and Programme Implementation, “Annual Survey of Industries,” 2024, https://www.mospi.gov.in/annual-survey-industries.
[19]. Suyash Rai and Anirudh Burman, “Is the Make in India Initiative Working? | Mihai Varga on World Bank-Led Land Reforms in Eurasia” (Carnegie India, October 4, 2023), https://carnegieendowment.org/india/ideas-and-institutions/is-the-make-in-india-initiative-working-or-mihai-varga-on-world-bank-led-land-reforms-in-eurasia?lang=en.
[20]. Ibid.
[21]. “Why STEM?” University of Texas at Austin STEM Starts, accessed October 16, 2024, https://stemstarts.utexas.edu/why-stem-matters/.
[22]. National Center for Science and Engineering Statistics (NCSES) (Geographic Distribution of the STEM Workforce), accessed September 2024, https://ncses.nsf.gov/pubs/nsb20245/geographic-distribution-of-the-stem-workforce.; Authors’ calculations from PLFS July 2020–June 2021 unit-level data, NSO, MoSPI, Government of India, based on NCO occupational classifications.; Ministry of Statistics and Programme Implementation, “Unit Level Data of Periodic Labour Force Survey (PLFS) July 2020-June 2021,” https://microdata.gov.in/NADA/index.php/catalog/206.
[23]. Shreya Mitra, "Women and STEM: The Inexplicable Gap Between Education and Workforce Participation” (Observer Research Foundation, November 1, 2024), https://www.orfonline.org/expert-speak/women-and-stem-the-inexplicable-gap-between-education-and-workforce-participation/.
[24]. U.S. Economic Development Administration, “U.S. Department of Commerce Invests Approximately $44 Million to Establish Biofabrication Cluster in Southern New Hampshire Through Regional Challenge,” news release, September 2, 2022, https://www.eda.gov/news/press-release/2022/09/02/us-department-commerce-invests-approximately-44-million-establish.
[25]. Ibid.
[26]. Eduardo Borensztein, Jose De Gregorio, and Jong-Wha Lee, “How Does Foreign Direct Investment Affect Economic Growth?” NBER Working Paper Series, No. 5057 (March 1995), https://www.sciencedirect.com/science/article/abs/pii/S0022199697000330; W.N.M. Azman-Saini, Ahmad Zubaidi Baharumshah, and Siong Hook Law, “Foreign Direct Investment, Economic Freedom and Economic Growth: International Evidence,” Economic Modelling No. 27 (2010): 1079–1089, https://www.sciencedirect.com/science/article/abs/pii/S0264999310000635.
[27]. U.S. Bureau of Economic Analysis, International Data Direct Investment and MNE (data on new foreign direct investment in the United States, 2025), accessed 2026, https://apps.bea.gov/iTable/?reqid=2&step=3&isuri=1&step1prompt1=1&step2prompt3=1&step1prompt2=3&_gl=1*131euv*_ga*MjU1MTMyNzA5LjE3ODYzNzU2MzQ.*_ga_J4698JNNFT*czE3ODgyOTA5NDkkbzEwJGcxJHQxNzg4MjkyMzc5JGo1JGwwJGgw#eyJhcHBpZCI6Miwic3RlcHMiOlsxLDIsMyw0LDUsNyw.; U.S. Bureau of Economic Analysis, Regional Data GDP and Personal Income (SAGDP1 State annual GDP summary for 2025), accessed 2026, https://apps.bea.gov/itable/?ReqID=70&step=1&_gl=1*1uaiiz4*_ga*MjU1MTMyNzA5LjE3ODYzNzU2MzQ.*_ga_J4698JNNFT*czE3ODgyOTA5NDkkbzEwJGcxJHQxNzg4MjkyNTUxJGoyOCRsMCRoMA..#eyJhcHBpZCI6NzAsInN0ZXBzIjpbMSwyOSwyNSwzMSwyNiwyNywzMF0sImRhdGEiOltbIlRhYmxlSWQiLCI1MzEiXS.; Department for Promotion of Industry and Internal Trade (DPIIT), “FDI Statistics” (India: DPIIT, 2023).; “State-wise FDI Equity Inflow During Calendar Year 2025 From January to December 2025,” https://www.dpiit.gov.in/static/uploads/2026/07/b25ac5a352a095f64db66ea8c480fe97.pdf.
[28]. Mark Arend, “‘Strategically, the Right Location’” (Team Kentucky, Cabinet for Economic Development, 2024), https://siteselection.com/strategically-the-right-location/.
[29]. Ibid.
[30]. Robert D. Atkinson, “Marshaling National Power Industries to Preserve America’s Strength and Thwart China’s Bid for Global Dominance” (ITIF, November 17, 2025), https://itif.org/publications/2025/11/17/marshaling-national-power-industries-to-preserve-us-strength-and-thwart-china/.
[31]. United States Census Bureau, USA Trade (333-335 exports by state in 2025 and total exports by state), accessed 2026, https://usatradeonline.census.gov/buildReport.; Directorate General of Commercial Intelligence and Statistics (DGCI&S) (Kolkata, India: DGCI&S, 2026).), https://www.dgciskol.gov.in/.
[32]. “New Mexico,” Office of the United States Trade Representative, 2025, https://ustr.gov/countries-regions/united-states-trade-data/new-mexico.
[33]. Ibid.
[34]. “OECD Compendium of Productivity Indicators 2026” (Organization for Economic Cooperation and Development; Paris, France, June 23, 2026), https://www.oecd.org/en/publications/oecd-compendium-of-productivity-indicators-2026_734a5e68-en/full-report/productivity-growth-in-a-challenging-global-environment_d888e417.html.
[35]. Information on regional AI preparedness plans was pulled from primary source documents describing regional AI strategies.
[36] . Tania Babina et al., “Canaries in the Gold Mine: Early Productivity Gains from Artificial Intelligence Creating Organizational Capital” (working paper 35684, National Bureau of Economic Research, Cambridge, Massachusetts, August 2026), https://www.nber.org/system/files/working_papers/w35684/w35684.pdf.
[37]. “National Strategy for Artificial Intelligence” (NITI Aayog, June 2018), https://www.niti.gov.in/sites/default/files/2023-03/National-Strategy-for-Artificial-Intelligence.pdf.
[38]. U.S. Energy Information Administration (total energy consumption and renewable energy consumption by state for 2024), accessed 2026, https://www.eia.gov/state/seds/seds-data-complete.php?sid=US#Consumption.; Authors’ calculations. Ministry of Statistics and Programme Implementation (solar power for 2026 by regions), https://esankhyiki.mospi.gov.in/macroindicators?product=mnre.; Reserve Bank of India (Table 143: State-wise Total Installed Capacity of Grid Interactive Renewable Power, December 11, 2025), https://www.rbi.org.in/scripts/PublicationsView.aspx?id=23592.
[39]. “South Dakota: Analysis,” U.S. Energy Information Administration,” September 18, 2025, https://www.eia.gov/states/SD/analysis.; “Iowa: End-use Energy consumption 2024, estimates,” U.S Energy Information Administration, https://www.eia.gov/states/ia/overview.
[40]. Ibid.
[41]. Danielle Nelson, “Digital Connectivity: The Benefits of Inclusive Internet Access” (U.S. Global Leadership Coalition, August 2022), https://www.usglc.org/blog/digital-connectivity-the-benefits-of-inclusive-internet-access/; Indian data is from 2021, while the U.S. data is from 2022.
[42]. U.S. Census Bureau, American Community Survey (Presence and Types of Internet Subscriptions in Household), accessed September 2024, https://data.census.gov/table/ACSDT1Y2022.B28002?q=internet%20access&g=010XX00US$0400000.; Internet facility Government of India, Ministry of Health and Family Welfare, National Family Health Survey (NFHS-5), 2019-21 (Deonar, Mumbai, India: International Institute for Population Sciences, March 2022), https://dhsprogram.com/pubs/pdf/FR375/FR375.pdf.
[43]. Ibid.
[44]. Anders Akerman and Kerstin Holzheu, “The Role of Workers In Knowledge Diffusion Across Firms” (Science Po Economics Discussion Paper, no. 2024-04, November 6, 2024), https://www.sciencespo.fr/department-economics/sites/sciencespo.fr.department-economics/files/2024_v2_akerman_holzheu_the_role_of_workers_in_knowledge_diffusion_across_firms.pdf; Victoria Castillo et al., “The Effects of Knowledge Spillovers Through Labor Mobility” (MPRA Paper 69141, University Library of Munich, Germany, 2016), https://ideas.repec.org/p/pra/mprapa/69141.html.
[45]. National Center for Science and Engineering Statistics (NCSES) (Domestic Employment and R&D employment, by state: 2021), accessed September 2024, https://ncses.nsf.gov/surveys/business-enterprise-research-development/2021#data.; R&D personnel employed share Ministry of Statistics and Programme Implementation (MoSPI), “Periodic Labour Force Surveys” 2021-22, https://www.mospi.gov.in/Periodic-Labour-Surveys.
[46]. Ibid.
[47]. Meghan Ostertag, “How Reducing Federal R&D Reduces GDP” (ITIF, September 15, 2025), https://itif.org/publications/2025/09/15/how-reducing-federal-rd-reduces-gdp-growth/.
[48]. National Science Foundation, “U.S. R&D expenditures, by state, performer, and source of funds: 2023,” https://ncses.nsf.gov/data-collections/national-patterns/2023-2024#data.; Department of Science & Technology, Ministry of Science & Technology, S&T Indicators Tables (New Delhi, India: Department of Science & Technology, July 2026), https://dst.gov.in/sites/default/files/ST%20INDICATORS%20TABLES%202025-26.pdf.; Ministry of Statistics and Programme Implementation (gross domestic product by industry, 2022-23), https://esankhyiki.mospi.gov.in/macroindicators?product=nas.
[49]. Ibid.
[50]. Miranda Fraraccio, “How Startups Contribute to Innovation in Emerging Industries,” US Chamber, April 15, 2024, https://www.uschamber.com/co/start/strategy/startup-ingenuity-and-innovation.
[51]. United States Census, BDS Explorer (number of establishments age 0 years and total establishments by state in 2023), accessed 2026, https://bds.explorer.ces.census.gov/?year=2023&xaxis-id=state&xaxis-selected=01,02,04,05,06,08,09,10,11,12,13,15,16,17,18,19,20,21,22,23,24,25,26,27,28,29,30,31,32,33,34,35,36,37,38,39,40,41,42,44,45,46,47,48,49,50,51,53,54,55,56&group-id=fage&group-sele.; “10th Annual report on the Working and Administration of the Companies Act, 2013 Year Ending 31.02.2024” (report by the Ministry of Corporate Affairs Government of India, 2024), https://www.mca.gov.in/bin/dms/getdocument?mds=M9TlbHj0yMDOiwerQgBywQ%253D%253D&type=open.
[52]. ‘Why Delaware?” Delaware.gov, https://firststeps.delaware.gov/why-delaware/.; “Why Wyoming?” Wyoming Business Council, https://wyomingbusiness.org/why-wyoming/.
[53]. Ibid.
[54]. “PCT – The International Patent System,” WIPO, https://www.wipo.int/en/web/pct-system.
[55]. Organization of Economic Cooperation and Development, Regions and Cities Data Visualization (patents per million of inhabitants), accessed 2026, https://regions-cities-atlas.oecd.org/TL2/x/x/REGION_DEMOGR-T-T/2023,; “Annual Report 2021-22,” Patents The Office of the Controller General of Patents, Designs, Trademarks and Geographical Indications (CGPDTM), 2024, https://ipindia.gov.in/storage/uploads/docs-operator/0606437e-cb87-445d-9da3-7f6cab788ade.pdf.
[56]. “India: Demographics,” Data Commons by Google, https://datacommons.org/place/country/IND?category=Demographics.
[57]. Ibid.
[58]. Meghan Ostertag et al., “Transatlantic Subnational Innovation Competitiveness Index 3.0” (ITIF, September 2026), https://itif.org/publications/2026/09/08/transatlantic-subnational-innovation-competitiveness-index-3-0/?.
[59]. Ibid.
[60]. “Winning the Race: America’s AI Action Plan,” The White House, July 2025, https://www.whitehouse.gov/wp-content/uploads/2025/07/Americas-AI-Action-Plan.pdf.
[61]. “National Strategy for Artificial Intelligence,” NITI Aayog, June 2018, https://www.niti.gov.in/sites/default/files/2023-03/National-Strategy-for-Artificial-Intelligence.pdf.; “Government Expands Sovereign AI Infrastructure Through IndiaAI Mission and Semiconductor Initiatives,” Ministry of Electronic and IT, August 6, 2026, https://www.pib.gov.in/PressReleasePage.aspx?PRID=2295477&utm_source=chatgpt.com®=48&lang=2.
[62]. “In less than 24 months, India AI Mission has Set up a Foundation for Development of AI Ecosystem in the Country,” Ministry of Electronics and IT, February 13, 2026, https://www.pib.gov.in/PressReleasePage.aspx?PRID=2227612&lang=1®=3.
[63]. “Winning the Race: America’s AI Action Plan,” The White House.
[64]. Siddarth Upasani, “‘Chipflation’: Electronics see years of price hikes replicated in 6 months,” The Indian Express, August 24, 2026, https://indianexpress.com/article/business/chipflation-electronics-see-years-of-price-hikes-replicated-in-6-months-10846655/.
[65]. Sujai Shivakumar and Shruti Sharma, “Semiconductor clusters in the making: India’s push for global competitiveness,” Center for Strategic and International Studies, September 23, 2025, https://www.csis.org/analysis/semiconductor-clusters-making-indias-push-global-competitiveness.
[66]. “The States of U.S. Science and Engineering 2026,” National Science Foundation, https://ncses.nsf.gov/pubs/nsbsep20261/stem-talent-education-training-and-workforce-2#the-stem-workforce.
[67]. Ibid.
[68]. Ibid.
[69]. “Manufacturing Sector: Labor Productivity (Output per Hour) for All Workers,” Federal Reserve Bank of St. Louis, https://fred.stlouisfed.org/series/OPHMFG.
[70]. “Value Added by Industry: Manufacturing as a Percentage of GDP,” Federal Reserve Bank of St. Louis, https://fred.stlouisfed.org/series/VAPGDPMA#.
[71]. “Export and investment promotion,” U.S. Department of Commerce, https://www.commerce.gov/issues/export-and-investment-promotion.; U.S. Bureau of Labor Statistics, “The share of workers who worked full time, year round rose to 71.0 percent in 2022,” TED: The Economics Daily, February 5, 2024, https://www.bls.gov/opub/ted/2024/the-share-of-workers-who-worked-full-time-year-round-rose-to-71-0-percent-in-2022.htm.
[72]. “Export and investment promotion,” U.S. Department of Commerce, https://www.commerce.gov/issues/export-and-investment-promotion.
[73]. Meghan Ostertag, “China Overtakes the United States in R&D Investment” (ITIF, May 6, 2026), https://itif.org/publications/2026/05/06/china-overtakes-the-united-states-in-rd-investment/.; National Science Foundation, “Discovery: R&D Activity and Research Publications,” https://ncses.nsf.gov/pubs/nsb20257.
[74]. Raul Katz and Juan Jung, “The Contribution of Fixed Broadband to the Economic Growth of the United States Between 2010 and 2020” (Telecom Advisory Services LLC, 2022), https://network-on.org/wp-content/uploads/2022/08/Broadband-and-the-Economy_2022.pdf.
[75]. Ibid.
[76]. Trelysa Long, “New Evidence Contradicts Myth that AI Is Destroying Jobs” (ITIF, June 30, 2026), https://itif.org/publications/2026/06/30/new-evidence-contradicts-myth-that-ai-is-destroying-jobs/.
[77]. Trelysa Long, “AI Is a Productivity Engine for the US Economy” (Center for Data Innovation, May 18, 2026), https://datainnovation.org/2026/05/ai-is-a-productivity-engine-for-the-us-economy/.
[78]. Ibid.
[79]. “Reimagining Skilling for Viksit Bharat@2047,” NITI Aayog, https://www.niti.gov.in/node/2397?.
[80]. “Skills for the Future: Transforming India’s Workforce Landscape” (Institute for Competitiveness, 2025), https://competitiveness.in/wp-content/uploads/2025/06/Report_Skill_Roadmap_Final_Compressed.pdf.
[81]. Ibid.
[82]. “Amit Kapoor and Mukul Anand, “India’s FDI divide: From states to districts,” The Sunday Guardian, September 27, 2026, https://sundayguardianlive.com/editors-choice/indias-fdi-divide-from-states-to-districts-293497/.
[83]. “The 2026 AI Index Report” (Stanford University Human Centered Artificial Intelligence, 2026), https://hai.stanford.edu/ai-index/2026-ai-index-report.
[84]. “In less than 24 months, India AI Mission has Set up a Foundation for Development of AI Ecosystem in the Country,” Ministry of Electronics and IT, February 13, 2026, https://www.pib.gov.in/PressReleasePage.aspx?PRID=2227612&lang=1®=3.
[85]. Joes M. Cortina, “What is coefficient alpha? An examination of theory and applications” Journal of Applied Psychology Vol. 78, Issue 1 (1993): 98–104, https://doi.org/10.1037/0021-9010.78.1.98.
[86]. Brett Williams et al., “Exploratory Factor Analysis: A Five-Step Guide for Novices” Australasian Journal of Paramedicine Vol. 8 (January 2010): 1–13, https://doi.org/10.33151/ajp.8.3.93.
Editors’ Recommendations
Related
November 15, 2024
US-India Subnational Innovation Competitiveness Index
September 14, 2023
Transatlantic Subnational Innovation Competitiveness Index 2.0
November 14, 2022
