

The Hamilton Index, 2026: China’s Dominance in Advanced Industries Is Growing

China now produces nearly one-quarter of global output in the 10 advanced industries that make up ITIF’s Hamilton Index, outpacing all other nations. America and the West must recognize that China’s gains are coming at the expense of their techno-economic and national power.
KEY TAKEAWAYS
Key Takeaways
Contents
Introduction
Advanced industries sit at the core of modern economic growth. They drive productivity gains across the broader economy, support high-wage employment, and generate export revenues that underpin strong currencies and favorable terms of trade. And because these sectors are deeply embedded in global supply chains and characterized by scale, nations that secure leadership in advanced industries tend to lock in durable advantages. Winning in innovation alone in these industries is not enough; without domestic or allied production capacity, countries forfeit much of the economic value of discovery, lose critical knowledge, and weaken the ecosystems that translate research into commercial and strategic power. These industries are what the Information Technology and Innovation Foundation (ITIF) calls “national power industries.”[1]
China’s rapid ascent into advanced industry production has fundamentally altered the global landscape. It has not become more specialized in these advanced sectors over the past decade (because the rest of its economy has also grown), but its absolute output and share of global production in these advanced industries has grown steadily. Indeed, China has moved from a peripheral manufacturer to a central player and, in some sectors, a global leader in advanced industries. This shift poses a direct challenge to the United States and the broader Western alliance bloc. As advanced industries increasingly underpin defense supply chains, digital infrastructure, and economic growth, China’s gains are often coming at the expense of U.S. and allied capacity. The result is a more fragile industrial base, making the United States increasingly vulnerable to the coercive pressures from China.
Methodology
To assess U.S. and other nations’ performance, ITIF has examined changes in global shares of value-added output in 10 advanced industry sectors aggregated into the Hamilton Index of Advanced-Technology Performance: information technology (IT) and information services; computers, electronics, and optical products; chemicals (not including pharmaceuticals); machinery and equipment; basic metals; motor vehicles; fabricated metals; pharmaceuticals; electrical equipment; and other transportation equipment. This report serves as the second update of the Hamilton Index, following the first edition published in 2022 and the second published in 2023.[2] To conduct this analysis, ITIF uses value-added data from the Organization for Economic Cooperation and Development’s (OECD’s) trade in value added dataset, which covers the period from 1995 to 2022.[3] ITIF’s analysis focuses on 39 countries included in that dataset. Because of problems with how Ireland’s output is reported, it is not included in the analysis or in EU-wide aggregate data.[4]
The 10 industries included in the Hamilton Index together accounted for nearly $12 trillion in global production in 2022 (figure 1). The information technology (IT) and information services industry (which includes software, Internet services, and data processing) is the largest of the 10, accounting for 20 percent of global advanced industry output.
Figure 1: Global output from industries included in the Hamilton Index, 2022 ($11.9 trillion, total)
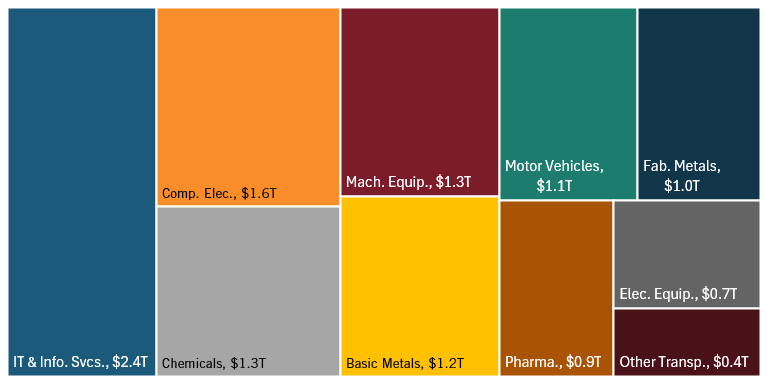
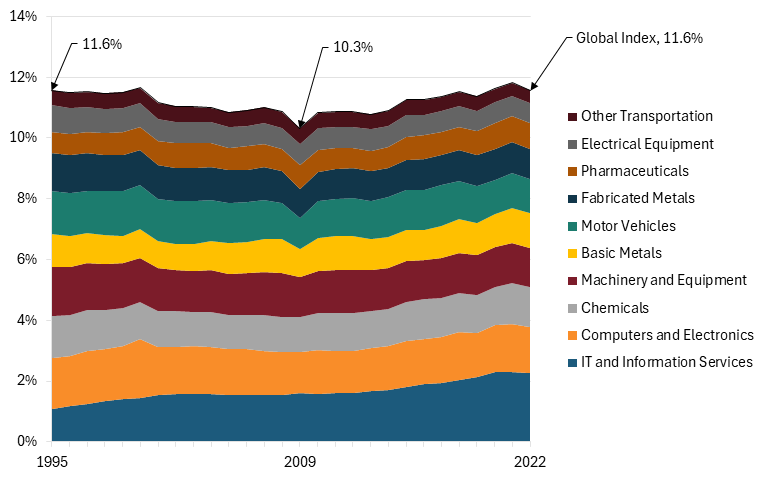
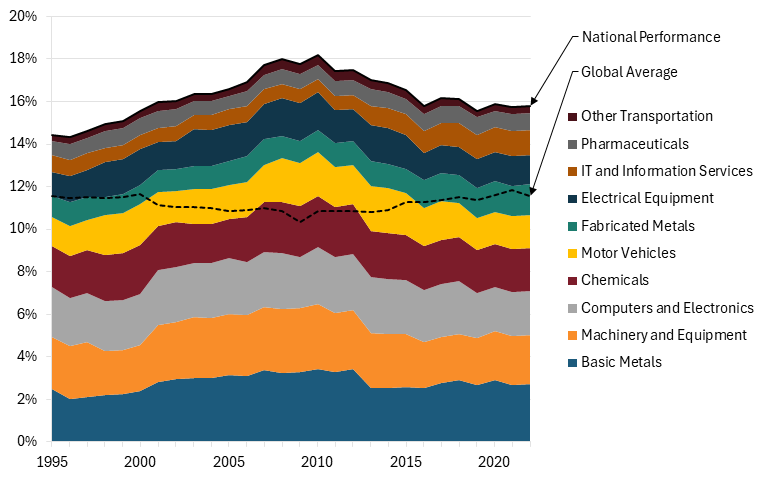
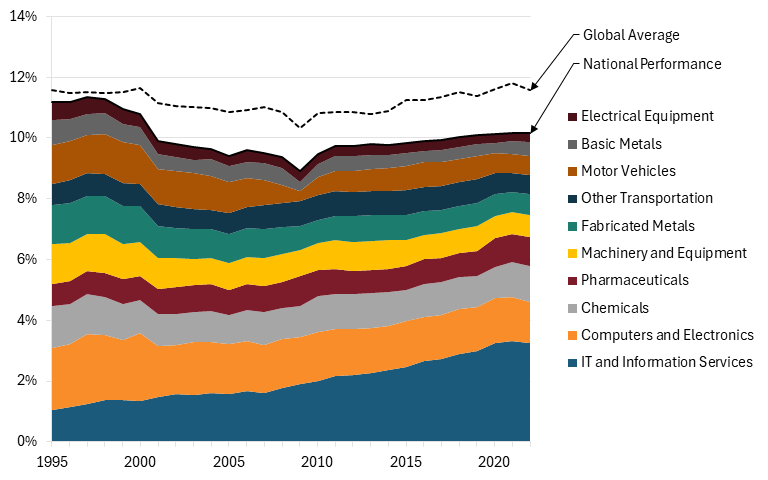
The aggregate production of the 10 industries equaled 11.6 percent of the global economy in 2022, the same as in 1995, rebounding from a nadir of 10.3 percent in 2008, when advanced industry production declined more than the overall gross domestic product (GDP). (See figure 2.) However, the output of each individual industry has changed, with IT and information services’ share of the global economy growing 45 percent since 2002. The fact that the overall share of advanced industry output in the global economy has not changed underscores the zero-sum competition between nations.
Nations are, or at least should be, competing for a greater share of this fixed pie, as China has shown itself to be. The United States, the world’s dominant techno-economic power for over 125 years, has allowed itself to stand on the sidelines of this global competition as China and the rest of the world capture growing slices of market share, and is now at risk of losing this race—and a loss would be catastrophic, turning the United States into a deindustrialized economy with weak economic growth and innovation capabilities. Time is short. The first half of this decade was one in which China proved its prowess in dominating advanced industries, moving from simply a copier to an innovator. The second half of this decade will be the time for the United States to demonstrate its willingness and ability to turn around U.S. advanced industry fortunes because, once China gains sufficient global market share, allied and U.S. production risks being permanently weakened.
This report is one of a series published by ITIF addressing the Chinese national techno-economic power industry challenge and will demonstrate the decline in U.S. advanced industry production over the past 27 years and China’s rise as a global leader. Future reports in this series will lay out in great detail the specific policy actions needed to better combat Chinese dominance.
Figure 2: Hamilton industry shares of the global economy, 1995–2022
Of course, global market shares of advanced industries cannot serve as the only metric of national competitiveness because nations have different-sized economies. To assess nations’ relative performance in strategically important industries, ITIF uses an analytical statistic known as a “location quotient” (LQ), which measures any region’s level of industrial specialization relative to a larger geographic unit—in this case, a nation relative to the rest of the world.
The LQ is calculated as an industry’s share of a country’s economy divided by the global industry’s share of the global economy, or as a country’s share of global output in an industry divided by the country’s overall share of the global economy. Either way, an LQ greater than 1 means the country’s share of global output in an industry is greater than the global average, and an LQ less than 1 means a country’s share is less than the global average. For example, the U.S. motor vehicle industry’s output in 2022 was 13.79 percent of global motor vehicle production, while the U.S. economy overall accounted for 25.39 percent of global GDP. Thus, the U.S. LQ in the motor vehicles industry was 13.79 percent divided by 25.39 percent, or 0.54, meaning the United States significantly underperformed in the industry. Its output was just 54 percent of the level we would expect based on the size of the U.S. economy.
Because LQ measures the importance of an industry relative to the size of a country’s economy, a country’s LQ can decline even if its industries are expanding rapidly, provided the rest of the economy is growing even faster.
The Hamilton Index, 2026: Data Visualization Tools
This report is accompanied by three data visualization tools for the Hamilton Index dataset:
§ “The Hamilton Index, 2026: Industry Visualizations”
Overall Findings
Specialization Rankings
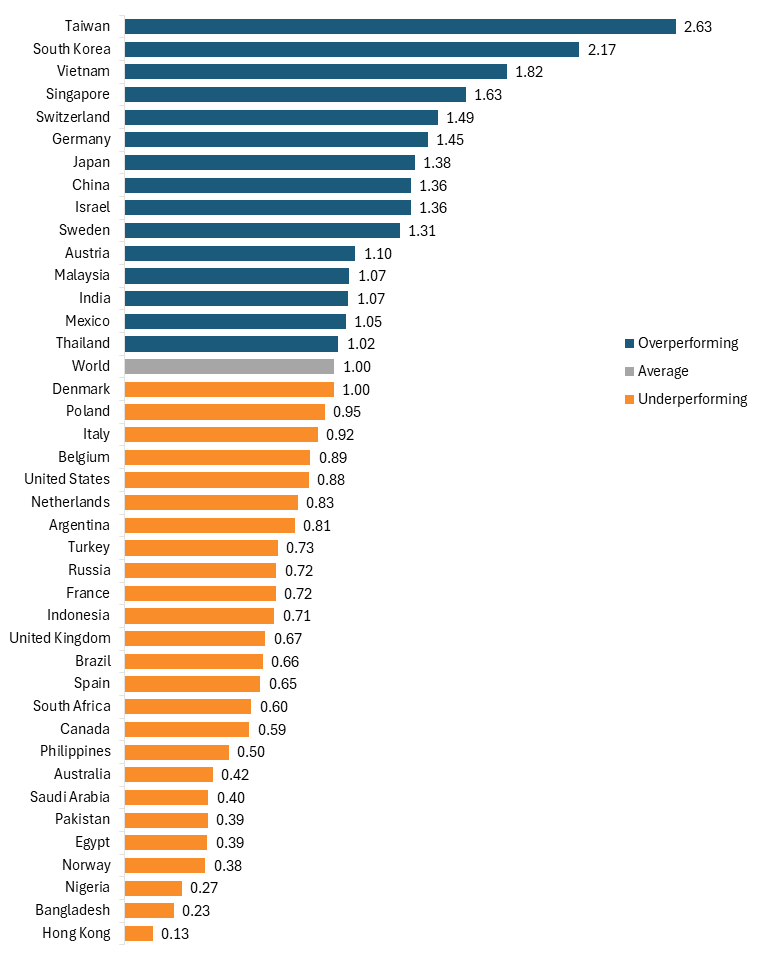
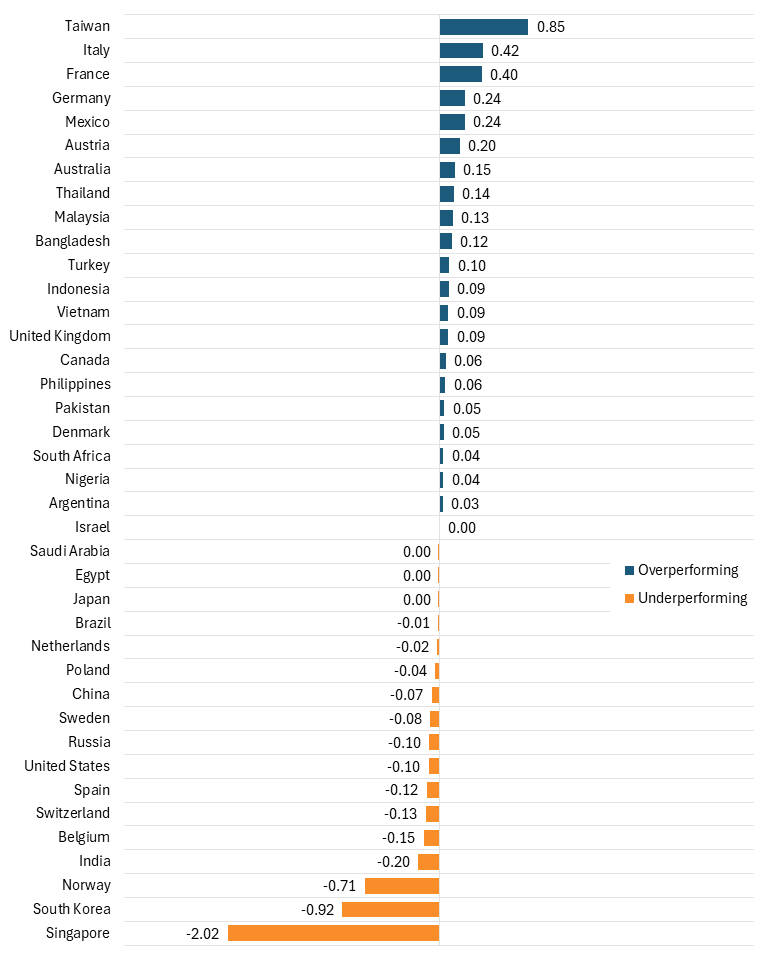
Fifteen countries overperformed in their composite Hamilton Index LQ in 2022, led by Taiwan with an LQ of 2.63 (the large majority of which was driven by the country’s semiconductor industry, which is included under the computer and electronics industry). (See figure 3.) South Korea, Singapore, and Japan, all technologically advanced East Asian nations, ranked second, fourth, and seventh, respectively. These three nations have intensively focused on advanced industry development over the past several decades—a strategy that has been reflected in their LQs and global market shares in industries such as computers and electronics. European nations, including Switzerland, Germany, Sweden, and Austria, rank 5th, 6th, 10th, and 11th, respectively, leading in engineering and chemical-intensive industries.
While most developing nations underperformed with LQs significantly below 1, Vietnam stands out as an outlier, ranking third overall with an LQ of 1.82. This marks a rapid rise in relative performance, driven primarily by its growth in the computers and electronics industry. Other developing nations that overperformed include Malaysia, India, Mexico, and Thailand.
The United States’ LQ was 0.88, meaning that as a share of GDP, U.S. Hamilton industries’ value added was lower than the global average. For the United States to achieve an LQ of 1, advanced industry output would have needed to be $370 billion greater in 2022, a 14 percent increase. This would be equivalent to more than doubling the output of the computer and electronics industry in the United States last year.
Some will argue that it’s acceptable or even normal for the U.S. LQ to be this low because it is a large economy and one in which the share of GDP that is globally traded is below average. But LQ is not a measure related to trade; it’s a measure related to production. Moreover, there was a small but positive correlation between national GDP and LQ in 2022 (0.05), suggesting that the U.S. score should not be below average and, if anything, should be above average. The reality is America’s low LQ reflects failure, not success.
The United States’ LQ was 0.88. For the United States to achieve an LQ of 1.00, advanced industry output would have needed to be $370 billion greater in 2022, equivalent to more than doubling the output of the computer and electronics industry last year.
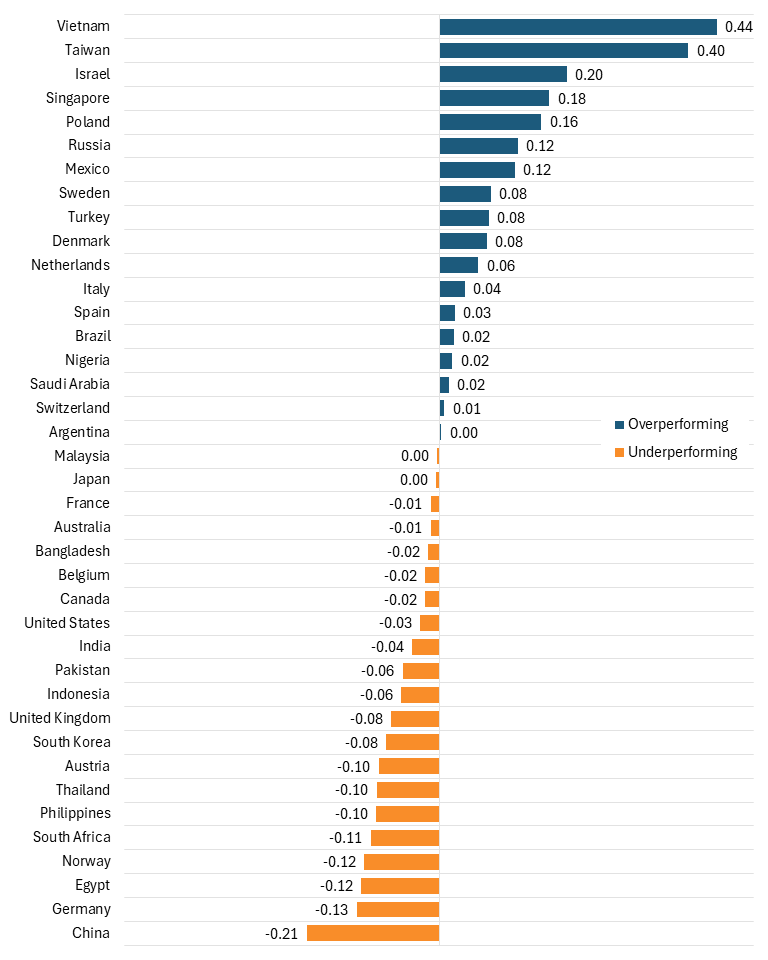
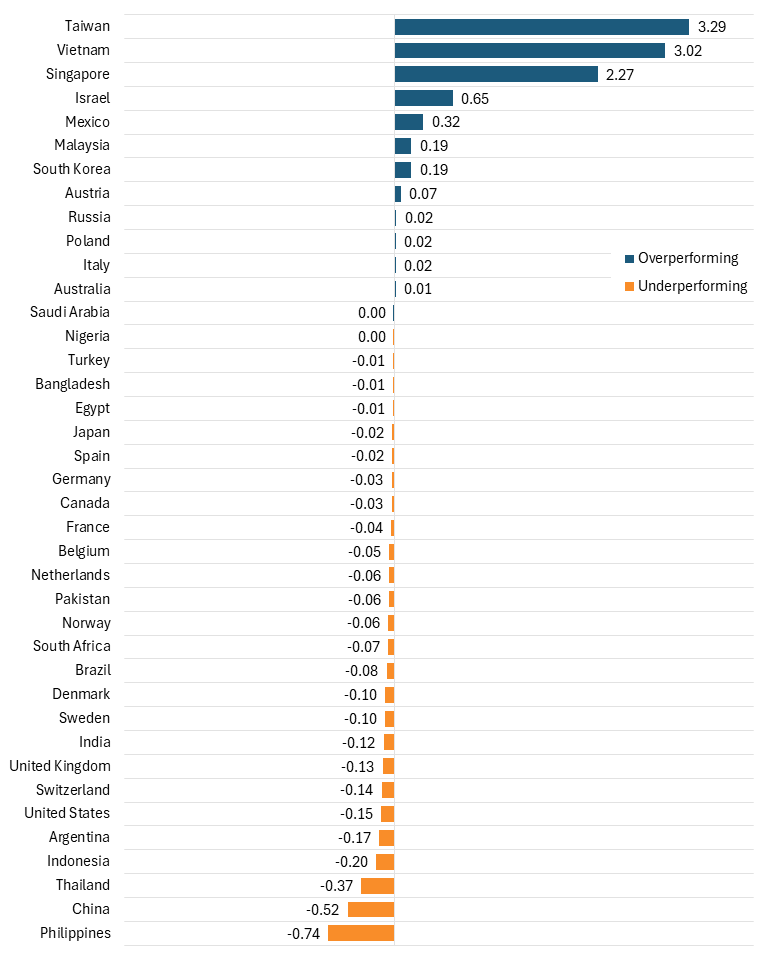
China, which ranked eighth, has perhaps focused more than any other country on cultivating advanced industries, becoming a top performer in several Hamilton industries, including basic metals, machinery and equipment, and electrical equipment. Yet, over the past decade, China experienced the largest decline in overall LQ among countries in the sample, falling by 21 percentage points. (See figure 4.) Importantly, this decline does not reflect a weakening of China’s advanced industry production. China’s output in these industries grew by 7.3 percent annually over the previous decade—faster than the United States, OECD, or the global average. Instead, it reflects China’s extraordinary economic growth, with GDP growing nearly 9 percent annually over the same period, meaning the rest of the economy expanded even faster than advanced industries did. As a result, advanced industries make up a slightly smaller share of China’s economy even as China continues to capture growing global market share and remains a dominant force in these sectors. China also continues to overperform in the Hamilton Index, with its LQ being 36 percent higher than the world average.
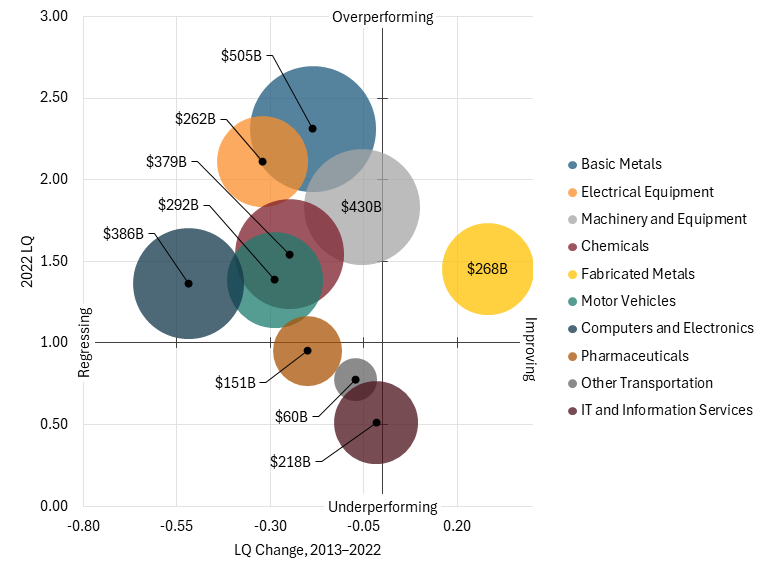
Figure 3: Relative national performance in the composite Hamilton Index (2022 LQ)
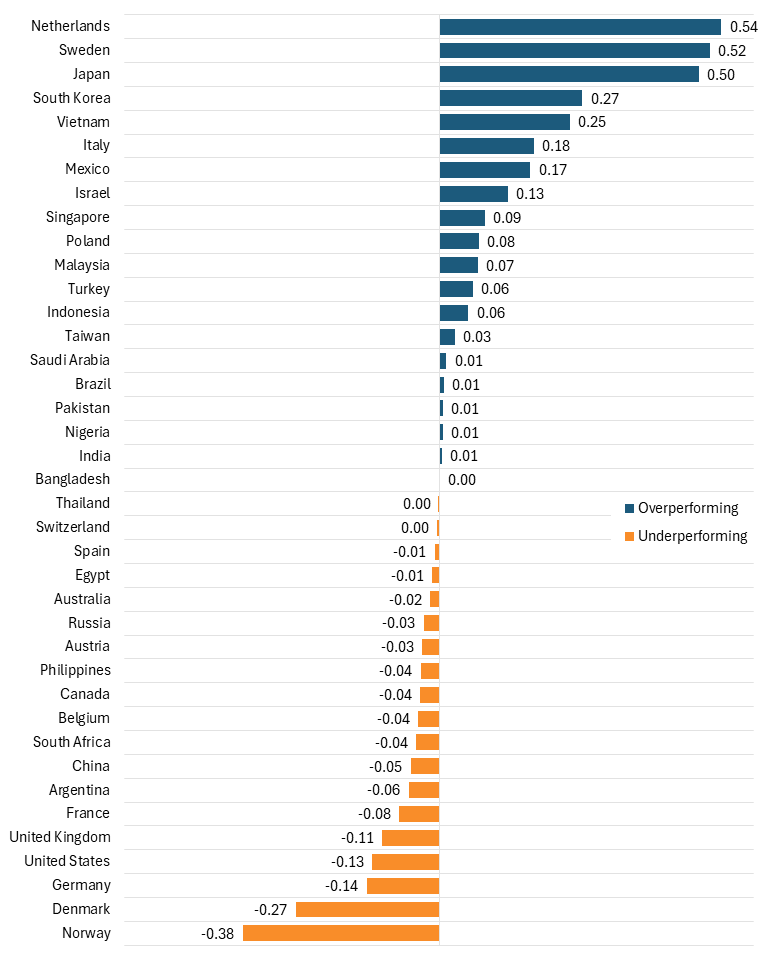
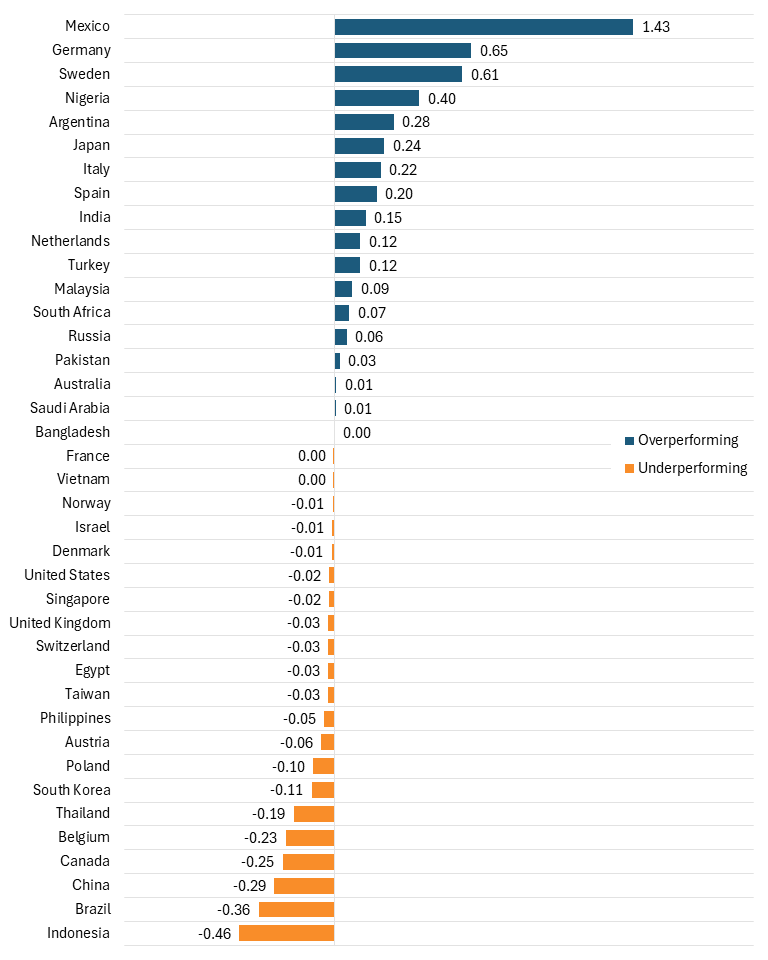
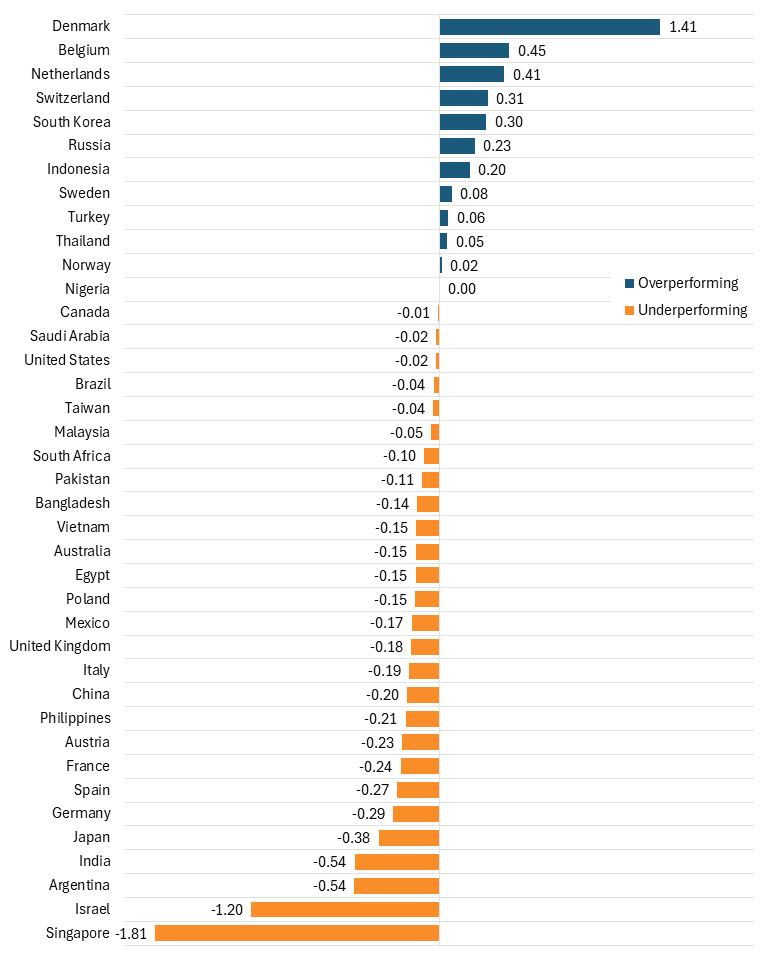
Vietnam saw the largest increase in LQ, rising by 44 percentage points, followed by Taiwan and Israel. Several developing nations saw a moderate rise in LQ, including Poland, Mexico, and Turkey, while the United States, Canada, and Japan were among the nations that experienced moderate declines.
Figure 4: Change in relative national performance in the composite Hamilton Index (LQ difference, 2013–2022)
For many countries that overperform on the LQ measure, that strong performance is driven by one or two dominant industries. For example, nearly two-thirds of Taiwan’s and Vietnam’s advanced industry output is from the computer and electronics industry. Countries such as these dominate specific niches but have limited influence over the broader advanced industry ecosystem. By contrast, countries with capabilities spread across multiple advanced industries can exert influence over several supply chains, shaping multiple segments of global trade.
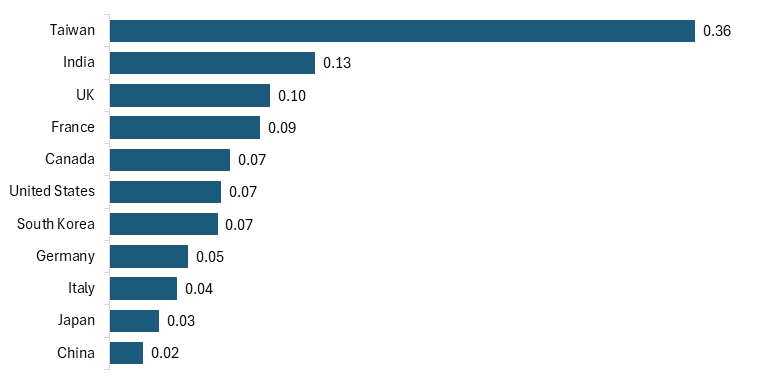
Figure 5 shows the specializations of the largest advanced industry producers using a normalized Herfindahl-Hirschman Index ranging from 0 to 1, wherein 0 indicates an equal distribution of output across all 10 Hamilton industries, while a 1 indicates complete concentration in a single industry (a detailed explanation can be found in appendix D). An index score of 0 to 0.06 indicates that output is broadly distributed across industries, a score of 0.06 to 0.17 indicates moderate specialization, and a score above 0.17 indicates strong specialization.
Unsurprisingly, Taiwan is the most specialized among the top producers, with the majority of its advanced industry output concentrated in a single industry. India, the United Kingdom, France, Canada, the United States, and South Korea all exhibit moderate specialization, with about one-third of advanced industry output originating from their largest sector. China’s relatively low specialization score highlights the broad distribution of its advanced industry production across the full range of Hamilton industries. Even China’s largest advanced industry by output, basic metals, accounts for only 17 percent of its advanced industry output, significantly less than other peer countries’.
China’s dominance differs structurally from that of the United States, and its breadth of capability across industries poses a more systemic challenge. Rather than leading in a narrow set of industries, China is simultaneously building strength across a number of critical sectors. This broad-based industrial capacity enables China to shape multiple supply chains, creating dense industrial ecosystems that reinforce its long-term technological and manufacturing leadership.
Figure 5: Specialization Index Rankings, 2022
And just like countries, some industries are more concentrated than others. For example, South Korea, the country most specialized in chemical manufacturing, has an LQ of 2.16, the lowest among the leading countries, while Taiwan leads in the computer and electronics industry with an LQ of 12.88, the highest among the leading countries. In many industries, a high LQ is reflective of the size of a nation’s economy, with smaller economies, such as those of Taiwan, Israel, Mexico, and Indonesia, more likely to have a single industry that dominates each country’s economy. But in other cases, it is because industries such as machinery, chemicals, and electrical equipment are much broader and have wider arrays of subindustries.
Without IT and information services, the United States has failed to measurably increase its market share in advanced industries over the past decade. The same cannot be said for China.
In terms of absolute production, China is far and away the leader in almost every industry, capturing the largest share of the global market in 7 of 10 advanced industries and holding nearly 25 percent of global market share across Hamilton Industries.
Table 1: Hamilton Index leaders by industry, 2022
|
Industry |
Global Output (Billions) |
Leading Producer |
Leader’s Share |
Relative Leader |
Leader’s LQ |
|
IT and Information Services |
$2,333 |
USA |
36.1% |
Israel |
3.39 |
|
Computers and Electronics |
$1,551 |
China |
24.9% |
Taiwan |
12.88 |
|
Chemicals |
$1,347 |
China |
28.2% |
South Korea |
2.16 |
|
Machinery and Equipment |
$1,287 |
China |
33.4% |
Japan |
2.43 |
|
Basic Metals |
$1,197 |
China |
42.1% |
China |
2.31 |
|
Motor Vehicles |
$1,155 |
China |
25.3% |
Mexico |
3.94 |
|
Fabricated Metals |
$1,013 |
China |
26.7% |
Indonesia |
3.16 |
|
Pharmaceuticals |
$872 |
USA |
28.5% |
Switzerland |
5.62 |
|
Electrical Equipment |
$680 |
China |
38.5% |
South Korea |
2.68 |
|
Other Transportation |
$423 |
USA |
38.5% |
Taiwan |
2.87 |
|
Composite Hamilton Index |
$11,858 |
China |
24.9% |
Taiwan |
2.63 |
Top 10 Producers
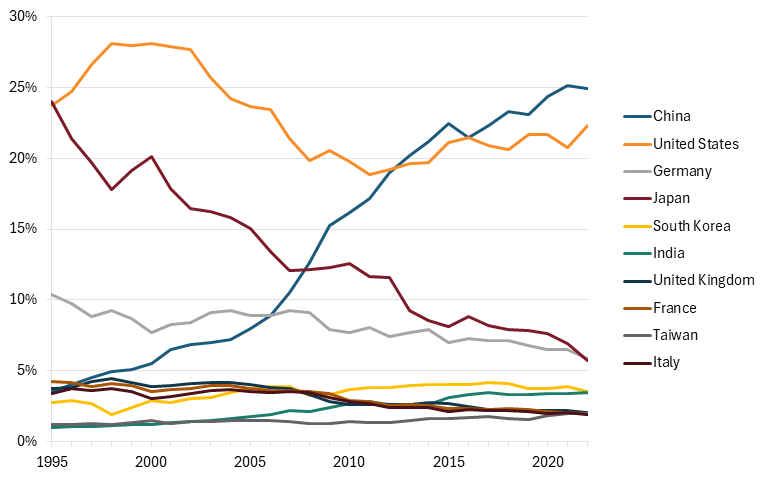
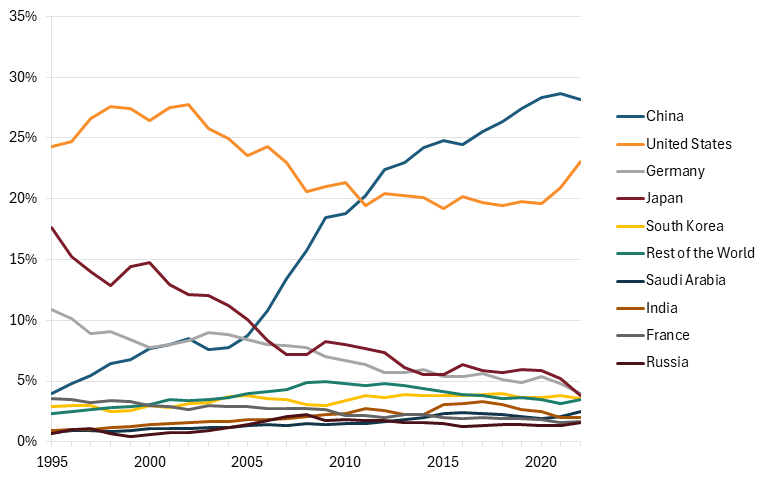
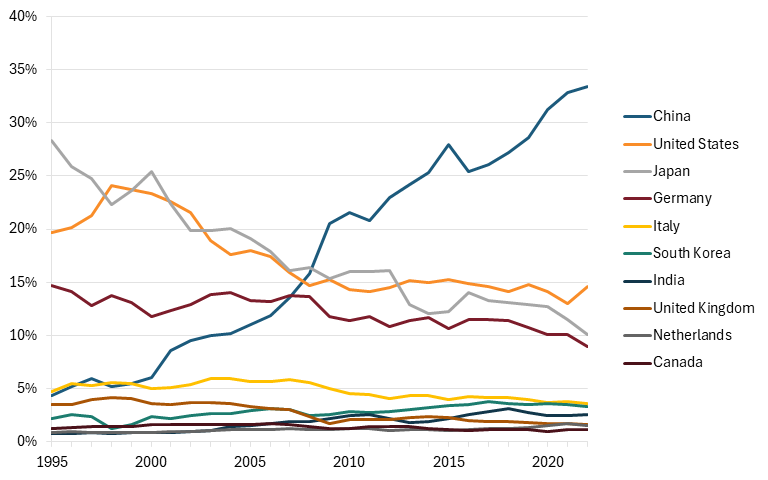
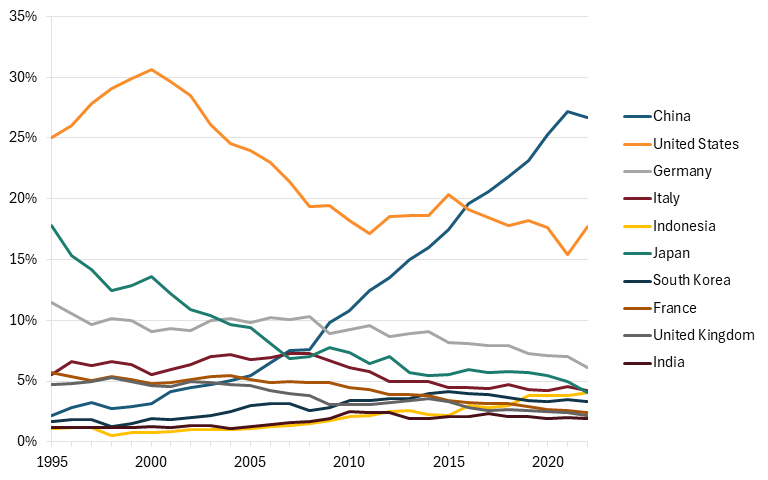
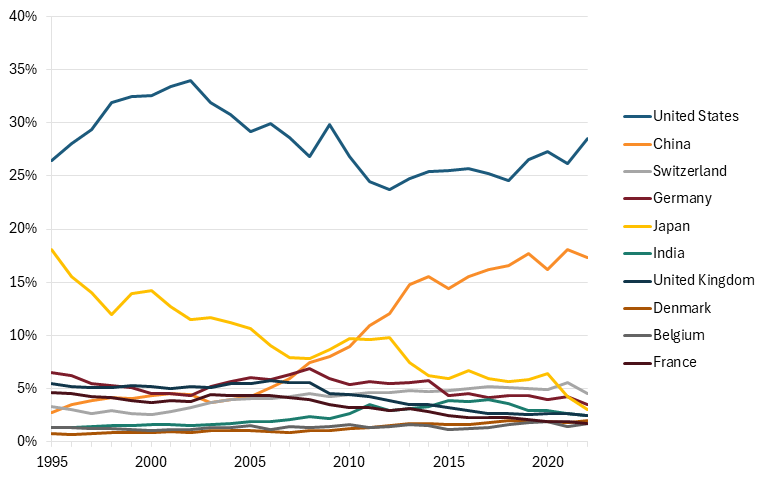
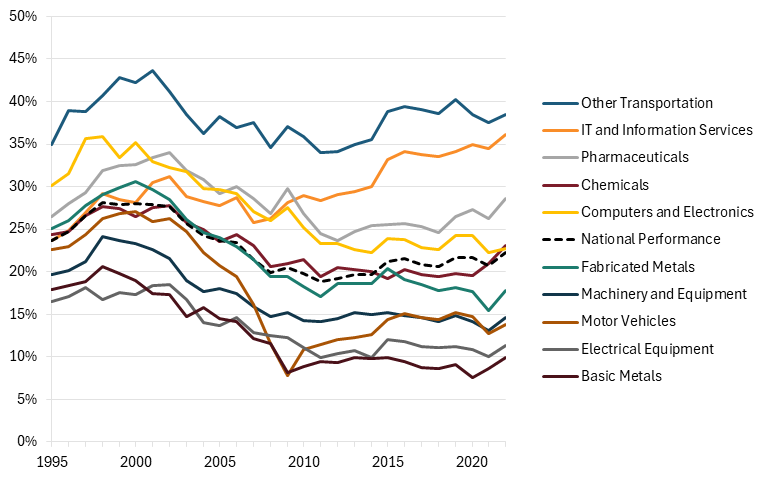
From 1996 to 2012, the United States was the leader in advanced industry output, holding the largest slice of global market share in these 10 industries. However, China’s accession to the World Trade Organization (WTO) in 2001 opened the floodgates to Chinese dominance. Since 2012, China has taken the lead from the United States, currently holding 24.9 percent of global market share, while the United States has fallen to 22.3 percent. Advanced industries being the zero-sum game that they are, the rise of China has been coupled with the decline of several other once-dominant countries. Japan, which led the world in advanced industry market share in 1995, regressed to fourth by 2022, a decline of more than 18 percentage points. Germany, while not declining as much as Japan, also fell by about 5 percentage points. The United Kingdom, France, and Italy have also seen their shares of the global market fall over the past 27 years.
Figure 6: Top 10 producers’ historical shares of global output in Hamilton industries, 1995–2022
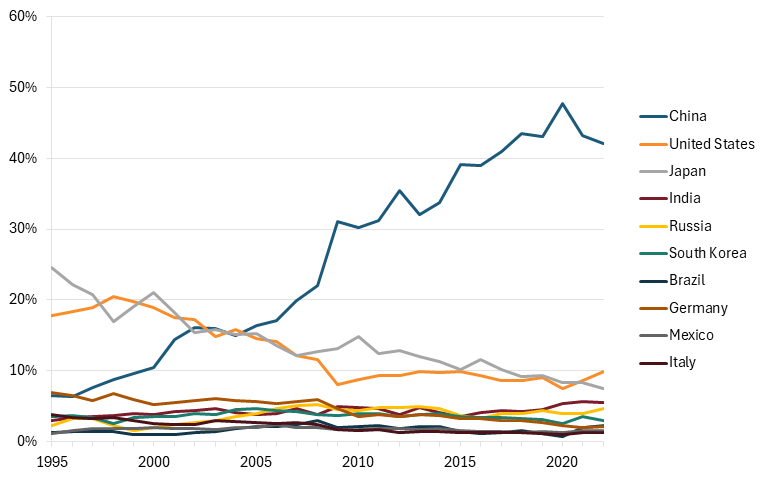
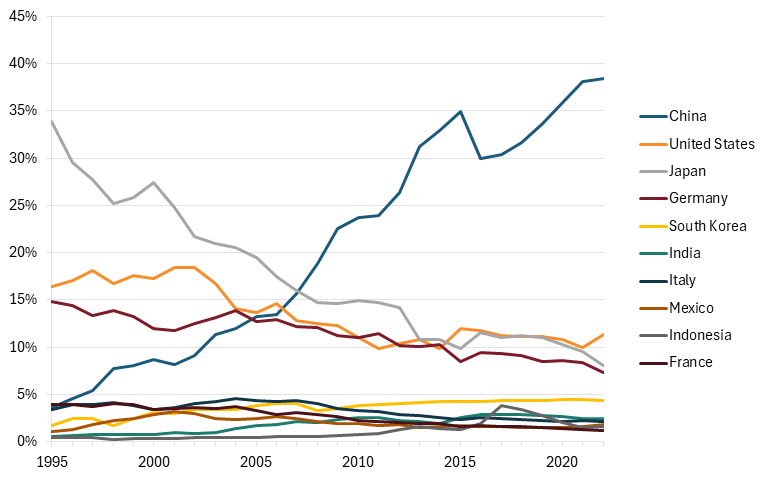
China’s dominance is even more evident when the IT and information services industry is removed from the equation. IT and information services is the largest advanced industry in the United States by a large margin (it made up 32 percent of U.S. advanced industry output in 2022), but it is one of the smallest in China, making up just 7 percent of its output.
When excluding IT, China became the world’s largest producer of advanced industries in 2010, surpassing the United States, and its share has continued to grow rapidly. By 2022, it held nearly 29 percent of the global market share. The United States, on the other hand, has seen its share of these nine industries fall rapidly and then stagnate. Between 2000 and 2011, U.S. market share declined from a high of 28.1 percent to a low of 17.2 percent, and in the years since, it has hovered between 17 and 19 percent. (See figure 7.) Without IT and information services, the United States has failed to measurably increase its market share in advanced industries over the past decade. The same cannot be said for China.
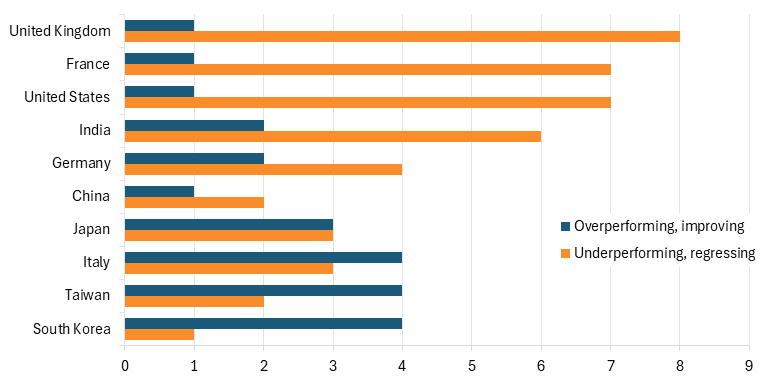
Later in this report, each country is assessed on its LQ in each industry based on whether it is overperforming or underperforming and whether it has improved or regressed since 2013. Both measures taken together are important because having industries that are overperforming but also regressing is not a sign of a strong advanced economy, but rather of a weakening one, while industries that are underperforming but also improving exemplify a developing economy. Figure 8 shows the two extremes, the number of industries that are both overperforming and improving, which will be referred to as strong and growing industries, and underperforming and regressing, which are weak and declining, for the top 10 performers in this Hamilton Index. The countries are organized by the number of industries that are strong and growing relative to those that are weak and declining. South Korea leads the top producers with four strong and growing industries and only one, IT and information services, that is weak and declining. Italy and Taiwan also have four strong and growing industries, but have two and three weak and declining sectors, respectively. These three countries are also the only 3 in the top 10 to have more strong and growing industries than weak, declining ones.
The United States and China have the same number of industries that are strong and growing: just one. However, where they differ is the number of weak industries they have. China has just two industries that fit this classification, whereas the United States has seven. The United Kingdom performs the worst with eight industries that are weak and declining and only one that is strong and growing.
Figure 7: Top 10 producers’ historical shares of global output in Hamilton industries minus IT, 1995–2022
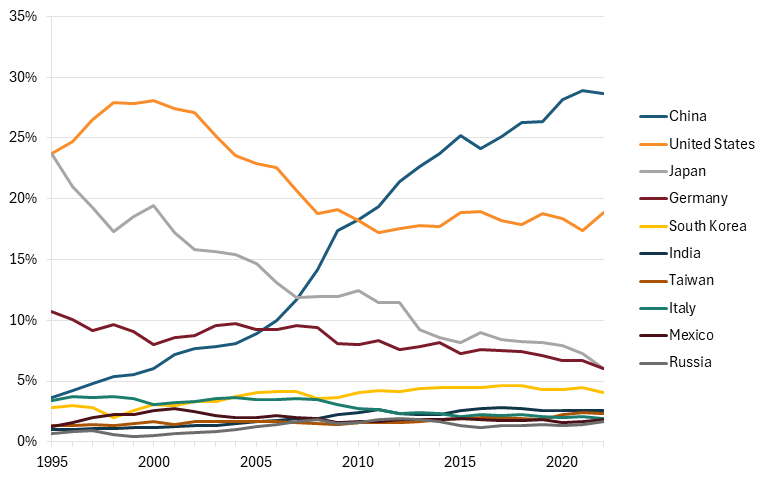
Figure 8: Numbers of comparatively strong and weak industries in the top 10 producer nations
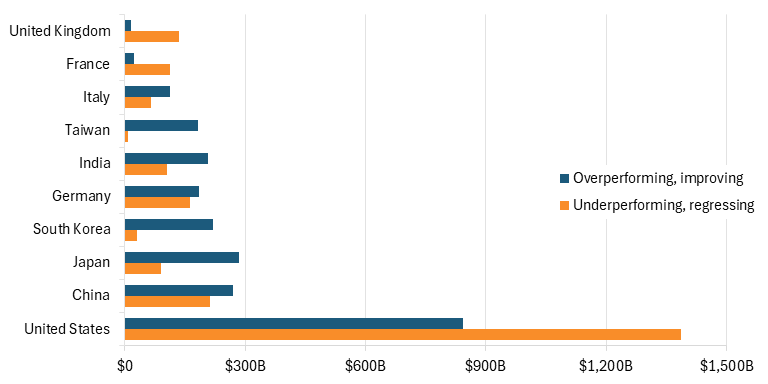
Looking at the value added of these industries, the one industry in which the United States overperformed and improved was the IT and information services industry, with an output of over $800 billion. (See figure 9.) However, the value of industries in which the United States underperformed and regressed was much higher, at $1.4 trillion. Aside from the United States, weak and regressing industries outvalued strong and improving industries only in France and the United Kingdom.
Figure 9: Value-added output by comparatively strong and weak industries in the top 10 producer nations
The China Juggernaut
If there is one takeaway from the past 27 years of advanced industry analysis it is that China is not a normal competitor. Its output across all advanced industries has grown at rates unmatched by any other nation, making it the leader in almost every industry.
China’s share of global advanced industry output has increased by over 21 percentage points, from 3.5 percent in 1995 to nearly 25 percent in 2022. In every advanced industry, China’s output has increased by at least 1,750 percent, with the average increase over 2,200 percent. Compare that with the United States, where output, on average, increased by just 200 percent.
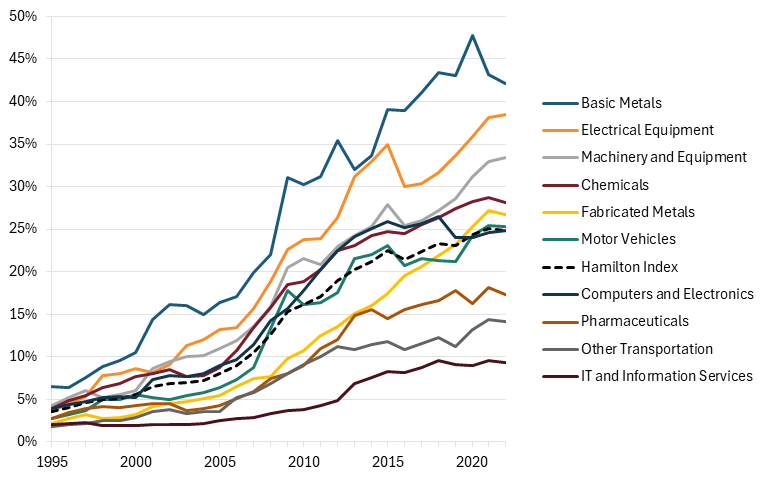
As previously discussed, advanced industry output as a share of GDP has been stable over the 27-year period analyzed in this report, meaning that when one country gained market share, other countries lost it. China’s market share in every advanced industry has grown threefold or more over the past 27 years, leaving it with more than a quarter of global market share in several industries, including fabricated and basic metals, chemicals, machinery, and electrical equipment. (See figure 10.)
Figure 10: China’s global market shares in Hamilton industries, 1995–2022
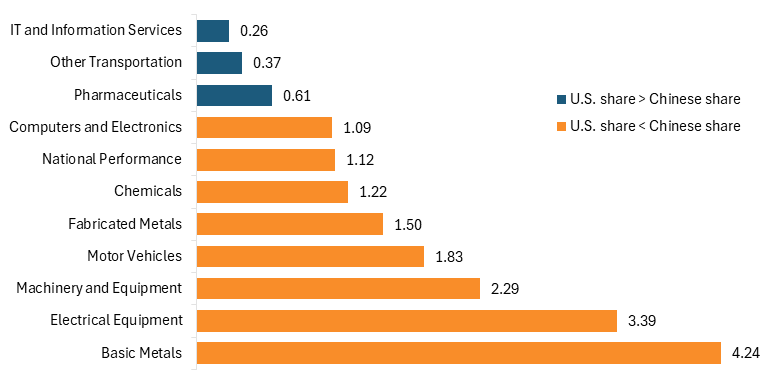
China leads the world in 7 out of the 10 Hamilton industries and therefore leads the United States. Excluding IT and information services, other transportation, and pharmaceuticals, China holds a greater share of the global market than the United States does. Figure 11 shows the ratio of China’s global market share in 2022 to the United States’ share, meaning that industries with a value greater than one are industries in which China holds a larger share of the global market. Though the United States is close to China’s market share in some industries, such as computers and electronics and chemicals, in other industries, such as basic metals, China has a clear and definitive lead.
Figure 11: Ratio of Chinese to U.S. global market share in Hamilton industries, 2022
In the years immediately after its accession to the WTO and up to 2011, China’s advanced industries underwent their most rapid growth in history, with output in these sectors increasing by up to 34 percent annually in some years and by 18 percent on average. Since then, China’s growth has cooled moderately, but it is still one of the fastest-growing advanced industry economies in the world. Overarching industrial strategies, such as the Made in China 2025 Plan, and sector-specific industrial policies have led advanced industries in China to continue growing at unprecedented speed. For example, China’s fabricated metals industry output increased by over 9 percent annually between 2018 and 2022, while output for the rest of the world grew by just 2 percent.
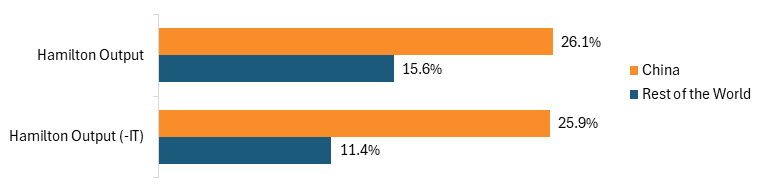
Overall, China’s output in Hamilton industries has increased by over 26 percent since 2018, while the rest of the world’s output has grown by only 15.6 percent. When removing IT and information services, an industry in which the United States and OECD perform strongly, the picture is even grimmer. China’s output increased by 25.9 percent; the rest of the world’s output increased by only 11.4 percent.
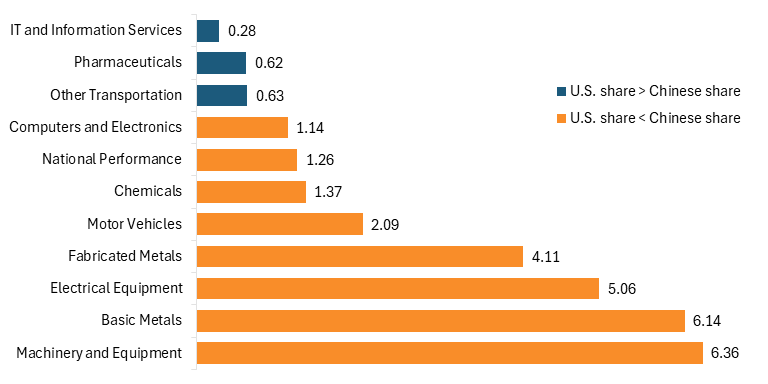
Looking more closely, China’s output has increased faster than the United States’ in seven Hamilton industries. Figure 12 shows the change in China’s output in advanced industries divided by the change in U.S. output. Industries with a value of 1 or more are industries in which China’s output has grown faster than the United States’. In all but IT and information services, other transportation, and pharmaceuticals, China’s output has grown at a greater rate than the United States’, with industries such as basic metals and machinery and equipment growing six times more than that of the United States.
Figure 12: Change in China’s output as a share of the change in U.S. output in Hamilton industries, 2013–2022
To appreciate the enormity of the gap between the United States and China, consider that, in order to match the advanced-industry share of China’s economy, the United States would have needed to increase its output by nearly $1.5 trillion in 2022, a 56 percent increase. An increase of this kind would have required almost doubling output in IT and information services, quadrupling output in computers and electronics, or increasing pharmaceutical output by a factor of six.
Figure 13: Nominal change in output from 2018 to 2022, China vs. the rest of the world
The Fall of the OECD
China’s rise as the leader in advanced industries meant that OECD nations that were once leaders were now followers, and the OECD as a whole no longer had the economic power it once did. Between 1995 and 2022, OECD nations’ market share in advanced industries fell from 86 percent to 58 percent, a 28 percentage-point decline. Put another way, in 1995, more than 8 out of every 10 dollars of value added in advanced industries originated in the OECD; now that figure is down to less than 6. China’s gains in global market share across all Hamilton industries were strongly correlated with the OECD’s losses, with a correlation coefficient of -0.94.
The OECD’s market share declined in every Hamilton industry, but these losses were not distributed evenly. The largest declines for the OECD came in basic metals, where the bloc’s market share fell by 44 percentage points, and in electrical equipment, which declined by 42 percentage points. However, the losses in the basic metals industry appear to have mitigated over the past two years, as the OECD has begun to regain market share (4 percentage points) since 2020. Although not a large jump, the gain represents the first time since 1995 that the OECD’s market share in basic metals has increased for two years in a row. In fact, basic metals is the only industry in which the OECD has increased its market share since 2020. Perhaps unsurprisingly, China ceded market share in this industry between 2020 and 2022. Notably, China still leads the world, controlling 42 percent of the basic metals market.
Figure 14: OECD’s global market share in Hamilton Industries, 1995–2022
It would be one thing if China’s performance in advanced industries were proportional to the size of its own economy, but over the period from 1995 to 2022, that was not the case. China made a concerted effort to overperform in these industries, recognizing their importance from a geopolitical and economic standpoint, perhaps before many other leading countries. And these efforts largely succeeded. In 2022, China’s value-added output was 36 percentage points more than the global average, while the OECD’s was 2 percentage points less than the global average.
The United States and OECD vs. China and the Rest of the World
The growth of China, while coupled with the decline of the West, has also occurred alongside another geopolitical trend: the rise of the Global South and the developing world. Through programs such as the Belt and Road Initiative, China has leveraged large-scale infrastructure investment worldwide to entrench trade dependencies, reinforce strategic partnerships, and cultivate export markets. Not every non-OECD country takes part in the Belt and Road Initiative; however, the initiative is just an example of how China has used its economic and political power to strengthen the economies of historically economically weaker countries.
In 1995, more than 8 out of every 10 dollars of value added in advanced industries originated in OECD; now that figure is down to less than 6.
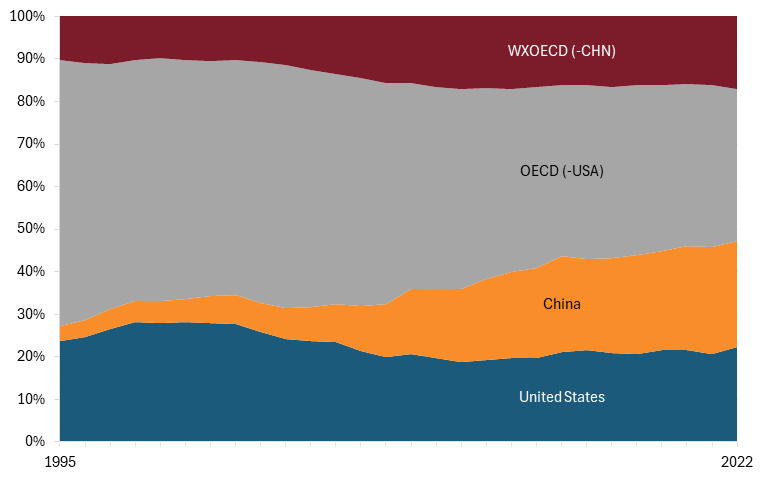
The global market share of non-OECD countries increased by 28.2 percentage points between 1995 and 2022, but most of that increase was driven by China’s growth. Excluding China from the calculation, non-OECD countries still experienced a sizeable increase in market share, rising by 6.9 percentage points. (See figure 15. The bloc of non-OECD countries without China is shown as WXOECD (-CHN).)
Most of the industries that non-OECD economies, excluding China, excelled in include traditional heavy manufacturing industries, such as basic and fabricated metals and electrical equipment. These industries saw their market shares increase between 7 and 8.5 percentage points. However, the industry in which the bloc experienced the greatest increase was computers and electronics, where its global market share rose by 14 percentage points, driven by Vietnam’s growth as a hotspot for electronics manufacturing.
Figure 15: Global market shares of Hamilton industries for the United States, OECD, China, and non-OECD countries, 1995–2022
The push for China-Plus-One or China-Plus-Many strategies, wherein companies diversify manufacturing by opening operations in other countries with favorable labor costs, may mean that non-OECD countries could see a greater increase in market share in the near future.
In terms of LQ, both China and non-OECD countries have seen their LQs improve since 1995, though non-OECD nations still underperformed relative to the world average as of 2022 (figure 16). Between 1995 and 2022, non-OECD nations, excluding China, saw their LQ increase by 7 points, while China’s increased by 12 points. In comparison, OECD and the United States declined in relative performance, with their LQs falling by 9 and 3 points, respectively, further demonstrating the shift from Western world dominance to closer parity in advanced industry production between developed and developing nations.
Figure 16: Net performance in Hamilton industries since 1995 (scaled to 2022 output)

China’s growth as a leader in advanced manufacturing and its ability to capture large swaths of market share over the past 27 years have meant that many developing nations have not been able to become strong advanced manufacturing hubs when they otherwise may have. However, the tensions around China have driven companies toward China-Plus-One or China-Plus-Many strategies, in which they diversify manufacturing by opening operations in other countries with lower labor costs. These strategies may mean that non-OECD countries will see a greater increase in market share in the near future.
Industry Profiles
Data Visualizations for Each Advanced Industry
Use the data visualization tool to browse the complete dataset for all 10 advanced industries and the composite index: “The Hamilton Index, 2026: Data Visualization for Industries.”
IT and Information Services
IT and information services includes several IT services subindustries, such as software development (including artificial intelligence (AI)), cloud computing, Internet services, and data processing and hosting. It is strategically important due to its high wages and international trade volume and is recognized as a key driver of innovation, as seen in the AI industry in recent years.
The industry has grown substantially over the past 27 years, with output rising 592 percent in nominal U.S. dollars from 1995 to 2022, making it the largest advanced industry in the world since 2003. The industry also grew by more than two times global GDP over the same period: 229 percent. Unlike most other advanced industries, the IT and information services industry is concentrated in the OECD, accounting for 74 percent of global market share. However, the OECD’s dominance in this industry has declined slightly, falling from a peak of 90 percent in 2003.
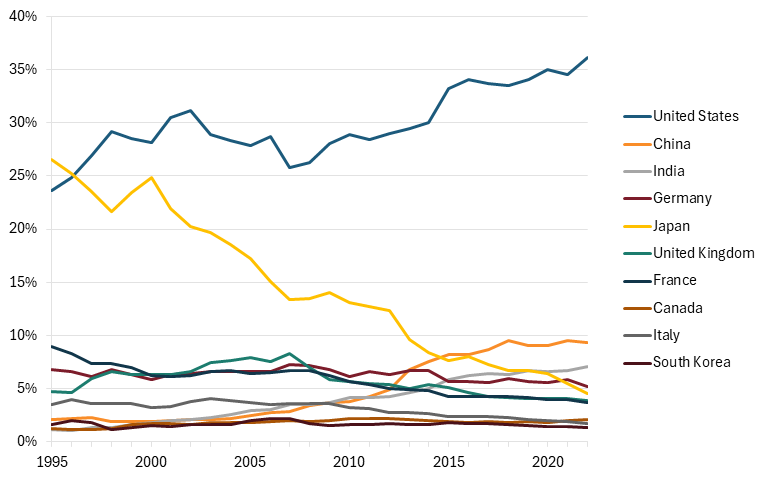
The United States leads as the top individual nation, holding 35 percent of global market share in the industry, up from 24 percent in 1995. U.S. dominance in IT and information services has been driven by the emergence and growth of key technology companies, including Amazon, Google, Meta, and, more recently, leading AI firms such as OpenAI and Anthropic. (See figure 17.) Considering the United States’ continued dominance in AI through 2026, it is likely the United States will maintain its leadership in the industry for the next several years. The next highest-ranking nations are China (9.3 percent), India (7 percent), and Germany (5.2 percent). The EU, not including Ireland, has seen its share fall by 6 percentage points since 1995 as its reliance on U.S. and Chinese information systems has grown.
The OECD’s dominance in the IT services industry has declined slightly, falling from a peak of 90 percent in 2003 to 74 percent in 2022. The market share of non-OECD countries increased to 38.4 percent in 2022.
Countries that saw the greatest growth in their global market share of the IT industry over the 27-year period include the United States, which increased its lead by 12.5 percentage points, China (7.3 percentage points), and India (5.9 percentage points). Non-OECD countries collectively saw their global market share increase by more than 13 percentage points, to 38.4 percent, as of 2022. Conversely, Japan, which led the world in this industry through 1996, experienced a 22 percentage-point decline, the largest among any nation. The United Kingdom also saw its share fall by over 5 percentage points.
Figure 17: Top 10 producers’ historical shares of global output in IT and information services, 1995–2022
Looking at relative performance, Israel leads the world with an LQ of 3.39, driven by high investment and technology crossover from its well-funded military and defense industry. Other strong relative performers include India (LQ of 2.16), Sweden (2.10), the United States (1.42), France (1.35), Switzerland (1.30), the Netherlands (1.29), and Germany (1.28). Several European nations make up the top 10, with others, including Belgium, Austria, Denmark, and Spain, performing well, with LQs of 0.9 or higher. Collectively, the EU boasts an LQ of 1.23, not far behind the United States, which it targets with nontariff attacks such as substantial fines on U.S. tech firms. The EU has recently reignited rhetoric pushing for “digital sovereignty”—a costly mission that is sure to damage European firms and consumer connectivity more than improve European technology production.
China has an LQ of 0.51, the lowest of all its advanced industries, putting it on par with other developing and low-income nations, including Argentina, Russia, and Malaysia. Despite its high global market share, China’s output in this industry is relatively low relative to the size of its economy. It is likely that, as China continues to invest more in AI development and pushes toward digital and technological sovereignty, China’s LQ in this industry will increase. It has already begun elevating national champions such as start-up DeepSeek and Alibaba, both of which have developed high-level AI tools. Lagging nations include Pakistan, Egypt, Indonesia, and Mexico, which have LQs of 0.2 or lower. (See figure 18.)
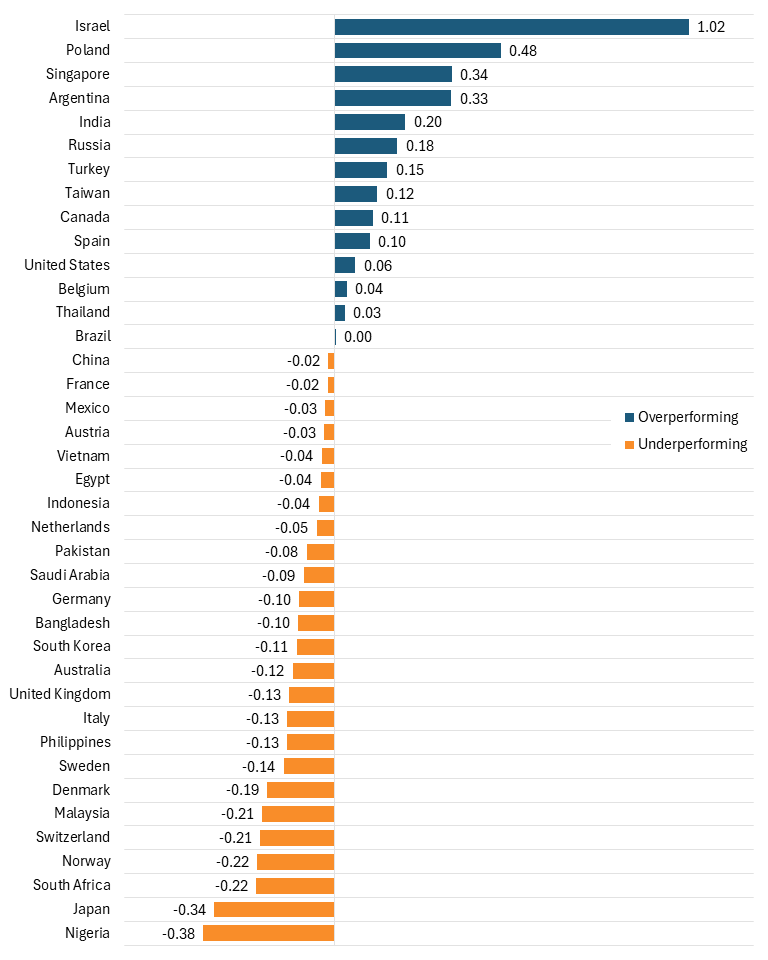
As well as having the highest LQ, Israel has experienced the greatest growth in LQ over the past decade, increasing by 102 percentage points from 2013 to 2022. Other highly improved nations include Poland (48 points increase), Singapore (34 points), Argentina (33 points), and India (20 points). The U.S. LQ increased by 6 points over this period, rising slowly but steadily each year, while China’s LQ declined by 2 points. Nigeria experienced the greatest decline in its LQ, with a fall of 38 points, just slightly more than the next-greatest decline, Japan. This coincides with the substantial decline in Japan’s global market share over the same period.
Figure 18: Relative performance in IT and information services (2022 LQ)
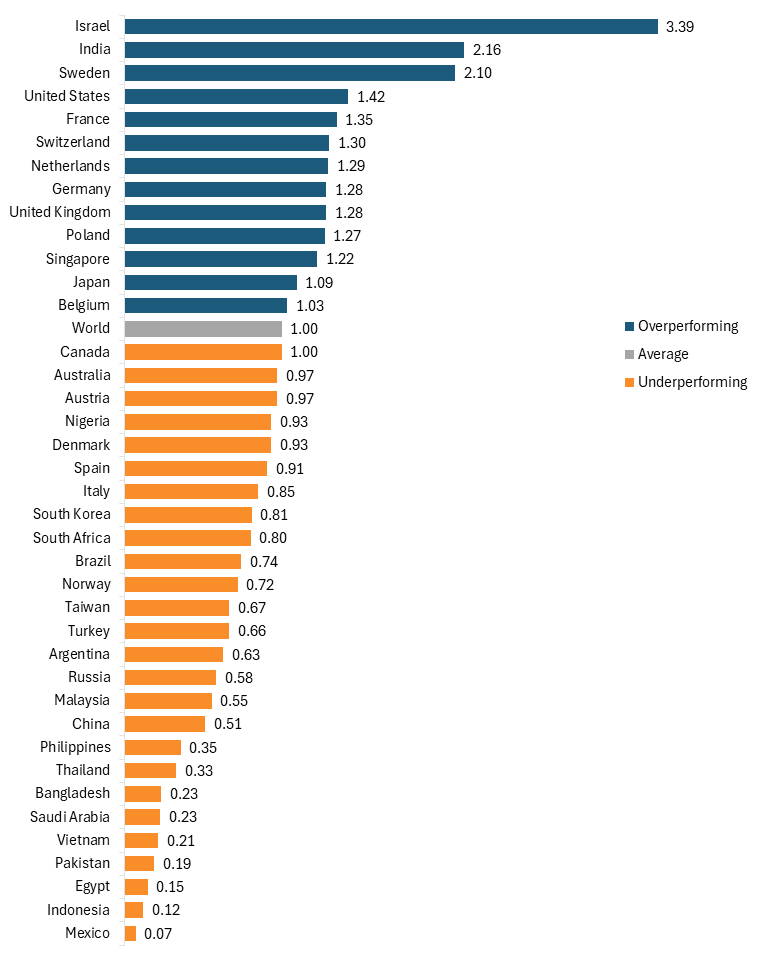
Figure 19: Net change in relative performance in IT and related services (LQ difference, 2013–2022)
Computers, Electronics, and Optical Products
The computers, electronics, and optical products industry includes the production of displays, electronic hardware, and semiconductors. As such, it’s a fiercely contested industry today.
This industry has nearly tripled in output since 1995, growing by 198 percent globally, making it worth over $1.5 trillion. However, this has still been less than the growth of global GDP, which has grown 229 percent. This industry is highly concentrated in South and Southeast Asia, where industry leaders such as Huawei, Taiwan Semiconductor Manufacturing Corporation (TSMC), Samsung, and LG are located, all of which dominate their respective markets. However, China stands out as the clear leader among these countries. Controlling nearly 25 percent of the global market share, China has become the global leader in electronics manufacturing through concerted national development plans designed to empower national leaders, such as Huawei and SMIC, the leading Chinese semiconductor manufacturer. In its “Made in China 2025” Plan, China has provided these firms with substantial subsidies and explicitly pushed for technological sovereignty, encouraging Chinese firms to purchase only domestically produced hardware and capital, thereby further driving China’s dominance.
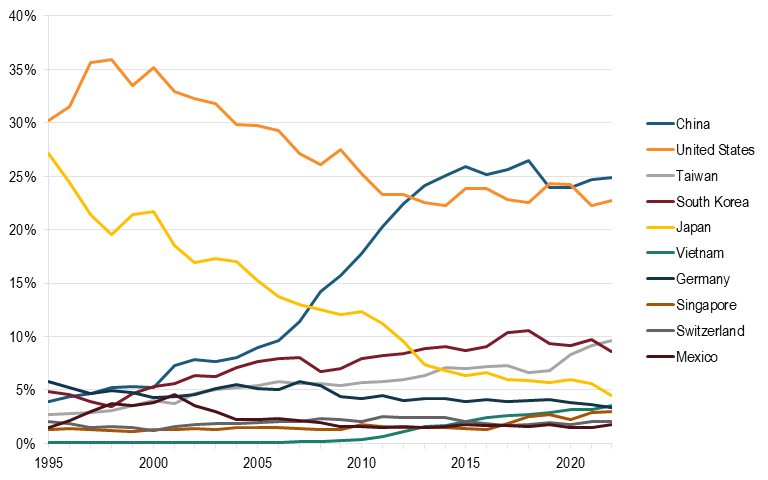
China’s rise has been coupled with the United States’ fall. The United States has gone from the global leader to second place, declining from 30 percent of global market share to 22.7 percent. Behind the United States are Taiwan (9.6 percent), South Korea (8.9 percent), Japan (4.5 percent), Vietnam (4.5 percent), and Germany (3.5 percent). The EU has also lost significant market share, most of which can be attributed to the EU-17—the original members of the EU that joined before 2004. The EU held 7.8 percent of global market share in 2022, a fall from 15.3 percent in 1995.
Controlling nearly 25 percent of the global market share, China has become the global leader in electronics manufacturing through concerted national development plans.
China’s global market share has increased by nearly 21 percentage points since 1995, the most of any country in the Hamilton Index and three times more than the next closest country. Other countries that have experienced high levels of growth include Taiwan (6.9 percentage points), Korea (3.7 percentage points), Vietnam (3.5 percentage points), and Singapore (1.7 percentage points). Non-OECD countries collectively have seen their global market share increase by 34.9 percentage points, while the OECD has declined by the same amount, leaving OECD nations to hold 52.3 percent of global market share. Like IT services, Japan has experienced a sizeable fall from grace, with its global market share falling by 22.7 percentage points.
Figure 20: Top 10 producers’ historical shares of global output in computers and electronics, 1995–2022
Taiwan is the leader in relative performance in computer and electronic manufacturing with an LQ of 12.88, meaning its production in this industry is nearly 12 times larger than expected based on the size of its economy. Taiwan is the world’s largest manufacturer of advanced logic chips, led by TSMC.[5] Other countries with leading LQs include Vietnam (8.73), Singapore (6.06), South Korea (5.27), Malaysia (3.34), and Israel (2.95). In contrast, the United States is underperforming in this industry with an LQ of 0.90, along with several European nations, including Germany (0.83), Austria (0.77), Denmark (0.50), and the Netherlands (0.46).
Taiwan underwent the most dramatic increase over the past decade. Its LQ in this industry increased by 329 percentage points, a dramatic increase reflective of its transformation into one of the largest electronics exporters in the world.[6] Vietnam also grew significantly over this period (302 percentage points), followed by Singapore (227 points), and Israel (65 points). Both the United States and China LQ fell over this period by 15 and 52 points, respectively.
Geopolitically, the Belt and Road Initiative overperforms in this industry with an LQ of 1.29, a decrease of 8 percentage points since 2013. At the same time, the OECD and the EU have both seen a decline in relative performance in this industry over the same time period, with OECD and the EU declining by 3 percentage points each, giving them LQs of 0.88 and 0.48, respectively, in 2022.
Figure 21: Relative performance in computers and electronics (2022 LQ)
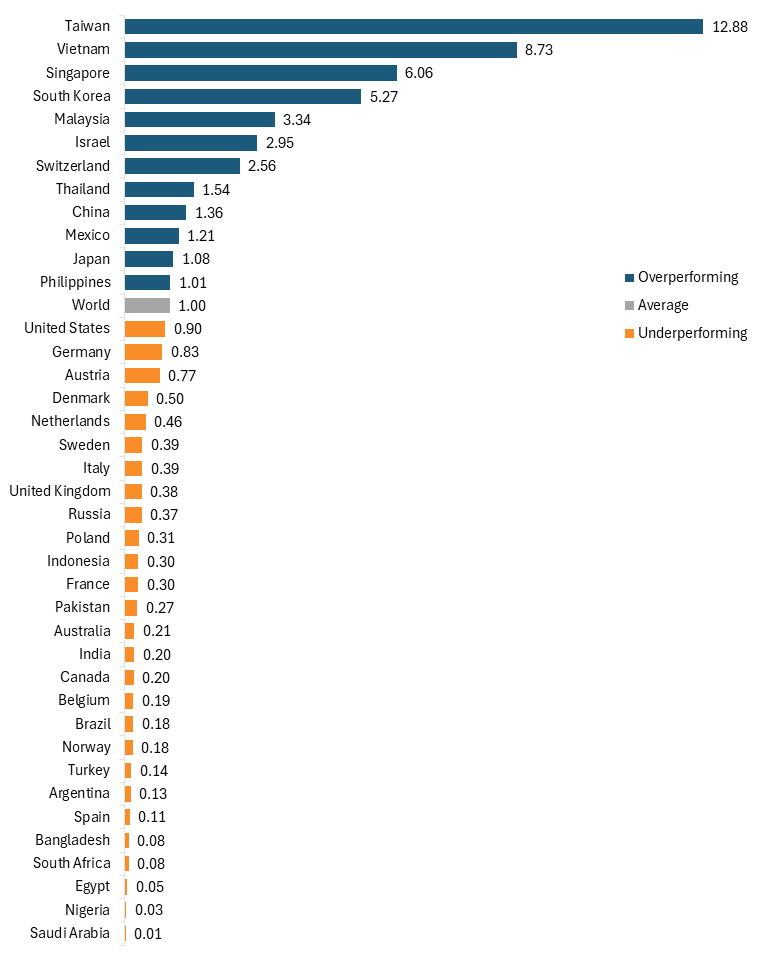
Figure 22: Net change in relative performance in computers and electronics (LQ difference, 2013–2022)
Chemicals
The chemicals industry includes both specialty chemicals and commodity chemicals, though it does not include any products made by the pharmaceutical industry. This sector produces critical inputs to national power industries such as electronics and defense industries.
Globally, this industry has grown by 211 percent in nominal U.S. dollars since 1995, but at a slower pace than global GDP, which has grown by 229 percent. The industry’s value-added output in 2022 reached $1.3 trillion. This industry is highly concentrated between the United States and China, with the two countries collectively making up over half the global market. China leads the world with 28 percent of global market share, followed by the United States, which holds 23 percent. However, it was once the United States that led this industry by a large margin, holding 24 percent of global market share while China held just 4 percent. OECD, which once controlled 82 percent of the global market in 1995, held 52 percent as of 2022.
Outside the two leaders, this industry is widely dispersed across other nations, with Germany, the third-largest chemical manufacturer, holding 4 percent of the global market, followed by Japan (3.8 percent) and South Korea (3.5 percent). Japan lost the largest slice of global market share over the 27-year period, losing 13.8 percentage points. The EU and the Quad, which includes Australia, Japan, India, and the United States, both declined by about 14 percentage points, sizable losses largely driven by declines in the United States, Japan, and Germany. Saudi Arabia, India, and Russia all increased their global market share by about 1 percentage point.
Figure 23: Top 10 producers’ historical shares of global output in chemicals, 1995–2022
The picture is quite different when it comes to industrial specialization. In 2022, the nation with the highest LQ was South Korea, at 2.16. Other high-ranking countries were Saudi Arabia (2.08), Thailand (1.76), Singapore (1.69), Argentina (1.60), and China (1.54). While it still overperforms, China’s LQ has fallen over the past decade from a high of 1.79 in 2013. Similarly, the United States, which underperforms in the chemical industry with an LQ of 0.91, has also seen its LQ decline since 2008, albeit more moderately, falling from 0.94 in 2013.
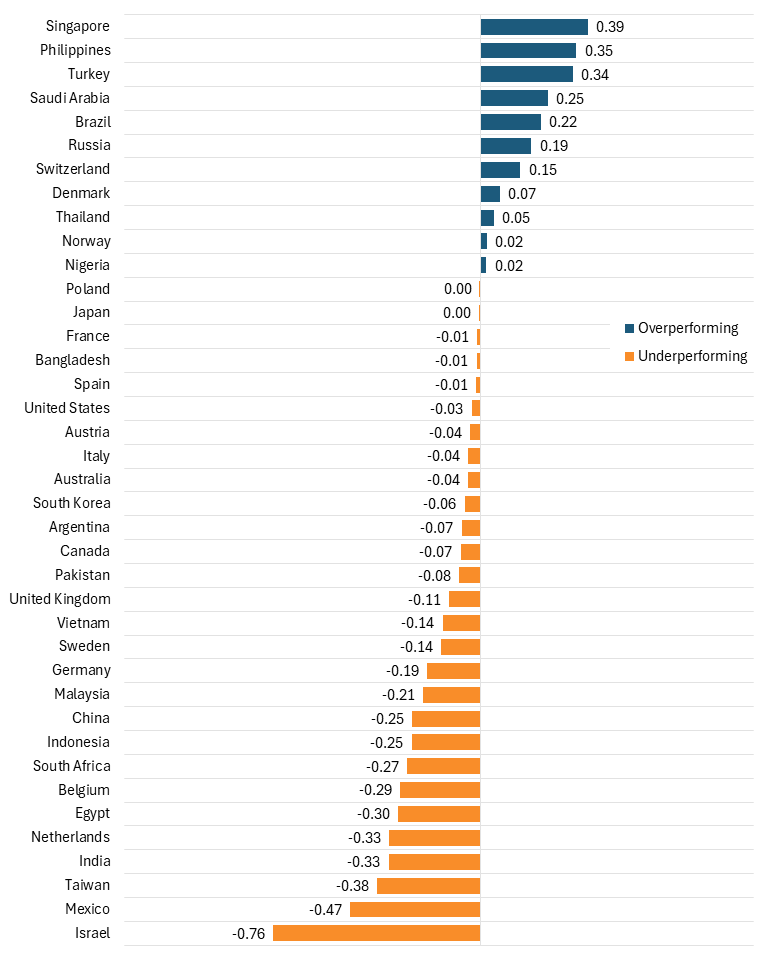
Looking at the change in relative performance, Singapore saw the largest increase in LQ over the period from 2013 to 2022, rising by 39 percentage points. The Philippines (35 percentage points), Turkey (34 percentage points), Saudi Arabia (25 percentage points), and Brazil (22 percentage points) also experienced significant increases in LQ. By contrast, Israel (76 points), Mexico (47 points), Taiwan (38 points), and India (33 points) all experienced a substantial decline in LQ over the 10-year period.
Geopolitically, both the Belt and Road Initiative and the collective non-OECD nations overperformed in chemical production. On the other hand, the OECD moderately underperforms, with an LQ of 0.87, a marked decline from 1995, when its LQ reached 1. Similarly, the EU has an LQ of 0.73, down from 0.99 in 1995.
Figure 24: Relative performance in chemicals (2022 LQ)
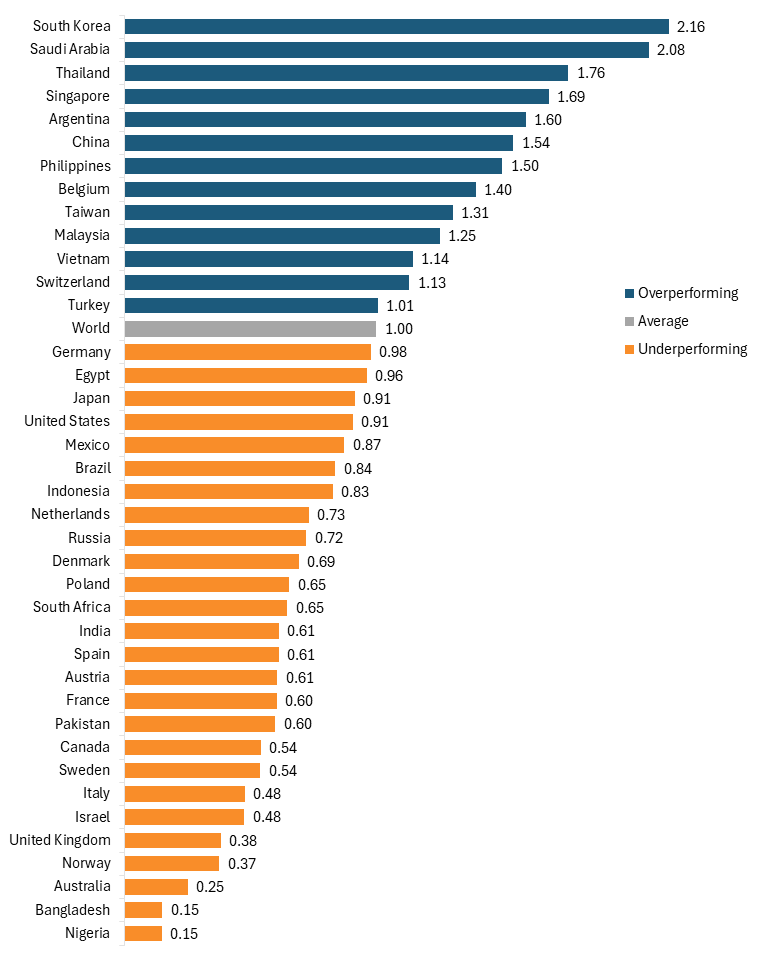
Figure 25: Net change in relative performance in chemicals (LQ difference, 2013–2022)
Machinery and Equipment
The machinery and equipment industry comprises machine tools and mechanical systems, including agricultural machines, engines, turbines, and industrial machines.
Globally, this sector grew by 157 percent in nominal U.S. dollars, though slower than the rate of global GDP growth—229 percent—while total value added output in this industry reached $1.3 trillion in 2022. OECD nations lost significant market share in this industry, falling from holding 89 percent of the global market in 1995 to just 56 percent in 2022.
Looking at individual countries, China leads the world and has done so for nearly a decade and a half. China holds over one-third of global market share, followed, not closely, by the United States, which holds just 14.6 percent. Other high-ranking nations are Japan (10.1 percent), Germany (9 percent), Italy (3.6 percent), and South Korea (3.3 percent).
China’s growth in this industry is unmatched, having captured 29 percentage points of global market share over the past 27 years. This rapid growth has led to a corresponding increase in the Belt and Road Initiative’s global market share, of which China is a part. Japan has suffered the greatest decline in market share, losing 18.2 percentage points, while other OECD countries, such as Germany (5.7 percentage points), the United States (5.1 percentage points), the United Kingdom (1.8 percentage points), and France (1.8 percentage points) have also lost market share.
Figure 26: Top 10 producers’ historical shares of global output in machinery and equipment, 1995–2022
Despite its loss of substantial market share, Japan leads the world in industrial specialization with an LQ of 2.43. In fact, its LQ has actually increased since 1995, from 1.59, due in part to the decline in Japan’s GDP over this period. Germany also exhibits high industrial specialization with an LQ of 2.21, followed by South Korea (2.02), Austria (1.87), China (1.83), and Sweden (1.82). The United States performs poorly in this industry, as much of the heavy manufacturing activity that used to occur in the United States has been offshored. Other developed nations that perform poorly include Belgium (0.62), Canada (0.56), the United Kingdom (0.54), and Australia (0.23).
The Netherlands experienced the largest percentage-point increase in its LQ from 2013 to 2022, rising by 54 percentage points. Other nations that experienced high growth include Sweden (52 percentage points), Japan (50 percentage points), South Korea (27 percentage points), and Vietnam (25 percentage points). The United States and several other developed nations declined over this period, including the aforementioned poor performers, while China’s LQ fell by just 5 percentage points.
Looking at this data with a geopolitical lens, the OECD, when excluding the United States, actually overperforms in this industry with an LQ of 1.21, and, relatedly, the EU (excluding Ireland) also overperforms with an LQ of 1.31. Alliances and trade organizations that include the United States, such as the United States-Mexico-Canada Agreement (USMCA), the Quad, and AUKUS (which includes Australia, the United Kingdom, and the United States), all underperform with LQs of 0.80 or lower.
Figure 27: Relative performance in machinery and equipment (2022 LQ)
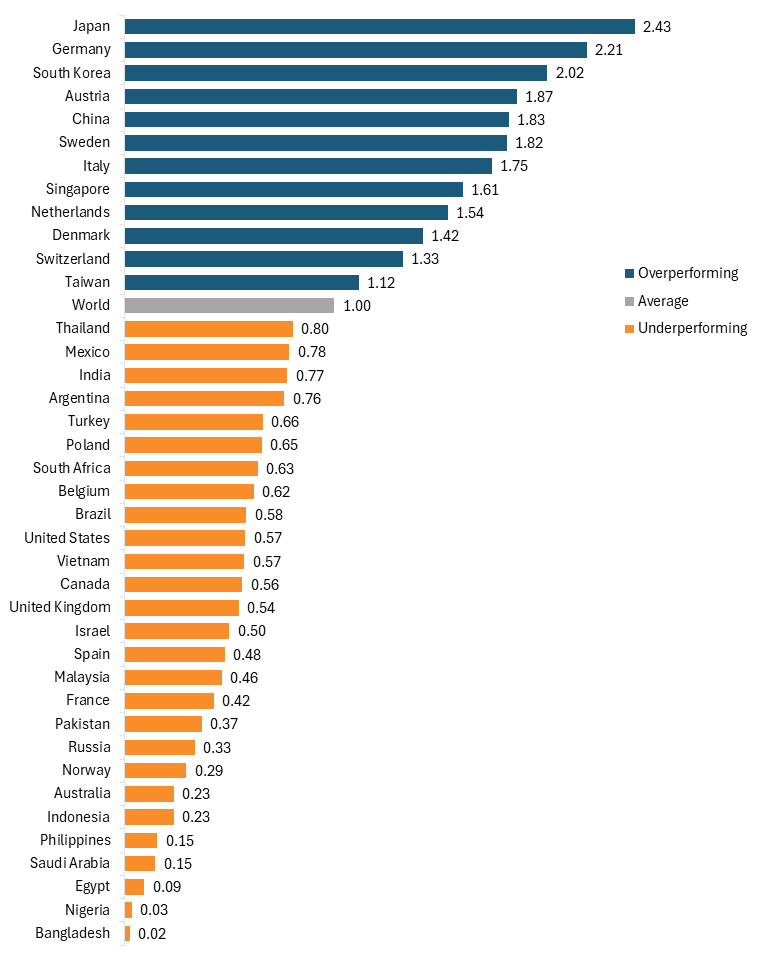
Figure 28: Net change in relative performance in machinery and equipment (LQ difference, 2013–2022)
Basic Metals
The basic metals industry comprises metals commonly used in industrial production, including copper, aluminum, and iron. The sector is strategically important because of its applications across several downstream power industries.
Globally, this industry grew by 253 percent between 1995 and 2022, faster than global GDP, which grew by 229 percent. Total value-added output in this industry reached $1.2 billion globally. China and other non-OECD nations have become the leading producers of basic metals, controlling 66 percent of the global market share; meanwhile, the market share of OECD nations fell by 44 percentage points over this period, from 78 percent to 34 percent.
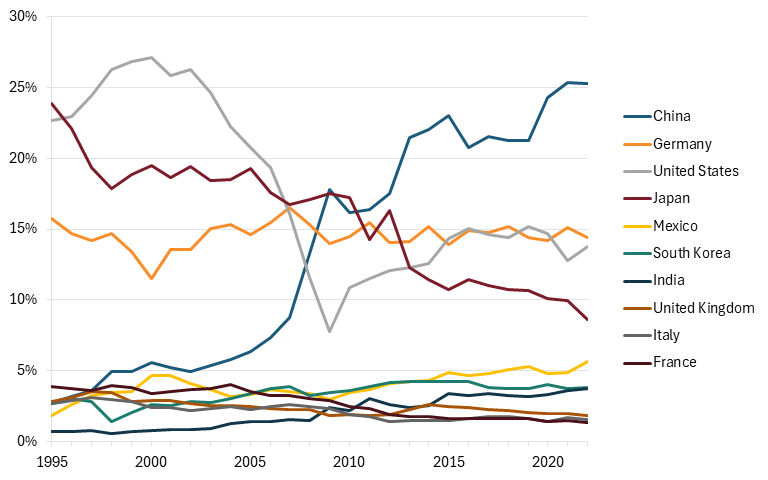
Individually, China leads the world in basic metal production by a wide margin, holding 42 percent of the global market share, up from 6.5 percent in 1995. Other leading producers are the United States (10 percent), Japan (7.5 percent), India (5.6 percent), Russia (4.7 percent), and South Korea (3 percent). Lagging nations in this industry largely include developed nations that are concentrated in more high-tech industries, such as Denmark, Israel, Singapore, and Switzerland.
China and other non-OECD nations have become the leading producers of basic metals, controlling 66 percent of the global market share.
China’s growth in this industry, driven by its push for domestic industrialization and increased manufacturing output following its WTO accession, has come at the expense of almost every other nation. U.S. market share in this industry declined by 7.9 percentage points, while Japan (17.2 percentage points), Germany (4.9 percentage points), Italy (2.5 percentage points), and France (1.8 percentage points) also experienced declines. India and Russia each saw their global market share increase by about 2.5 percentage points.
Figure 29: Top 10 producers’ historical shares of global output in basic metals, 1995–2022
When it comes to industrial specialization, the trends are quite similar. China leads the world with an LQ of 2.31, once again reflecting its absolute leadership in the industry, followed by Russia (LQ of 2.08), South Korea (1.84), Japan (1.79), and India (1.71). Once again, developed nations tend to underperform in this industry, with Spain, Norway, France, the United States, and Australia among a slew of countries with an LQ of 0.50 or below. However, Nigeria has the lowest LQ of 0.07.
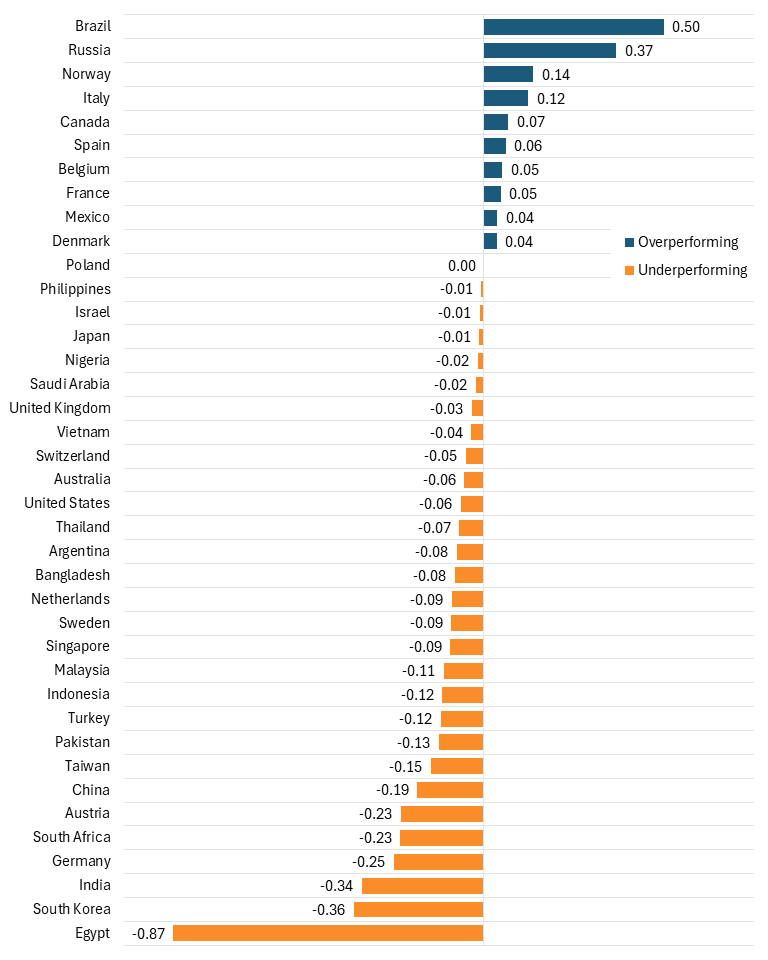
Over the decade from 2013 to 2022, Brazil experienced the greatest increase in LQ, with it increasing by 50 percentage points, more than double the next-most-improved nation of Russia (37 percentage points). Very few other nations saw their LQ increase over this decade, with Norway (14 percentage points), Italy (12 percentage points), Canada (7 percentage points), and Spain (6 percentage points) among the select few.
Despite its leading LQ, China actually exhibited one of the largest declines in relative performance, with its LQ falling 19 percentage points. In fact, China’s LQ fell 110 percentage points between 2002 and 2022, as the growth of China’s economy still outpaced its basic metals industry. South Korea, India, and Taiwan also overperform in this industry but have seen their LQ fall over the past 10 years.
Unsurprisingly, with so many OECD nations underperforming, the OECD collectively underperforms with an LQ of 0.57, having declined by nearly 40 percentage points since 1995. Conversely, non-OECD nations perform far above average, with an LQ of 1.62. The EU has also seen a substantial decline in relative performance, with its LQ declining from 0.84 in 1995 to 0.52 in 2022.
Figure 30: Relative performance in basic metals (2022 LQ)
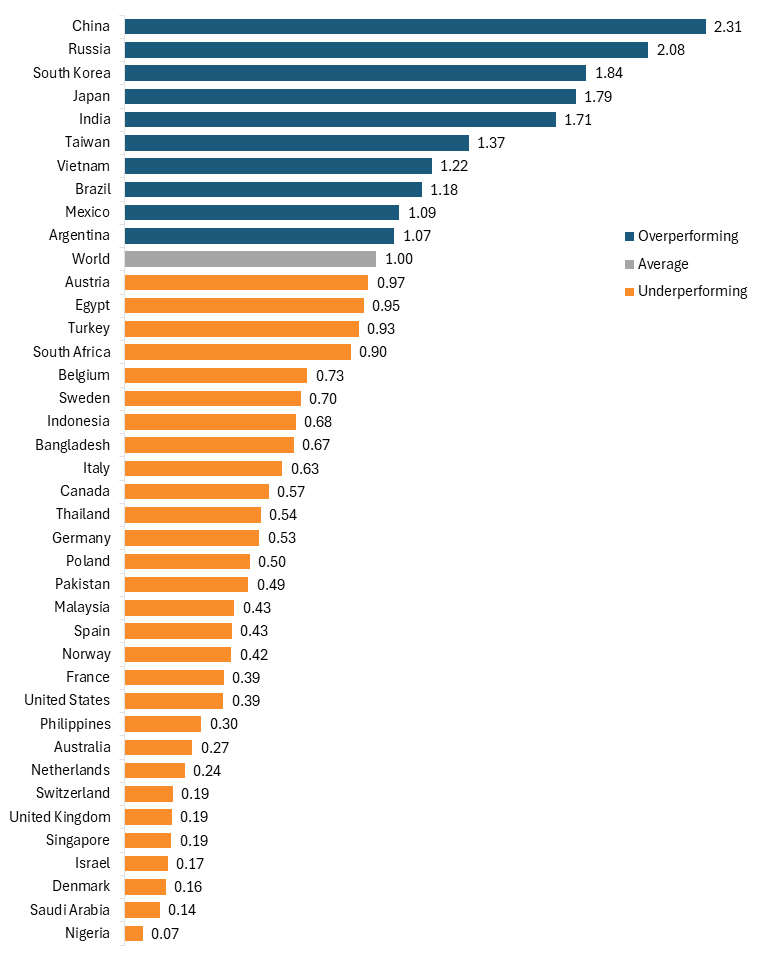
Figure 31: Net change in relative performance in basic metals (LQ difference, 2013–2022)
Motor Vehicles
The motor vehicle industry includes car and truck assemblers and suppliers, as well as motor vehicle parts manufacturing. It has become a more innovative sector due to new developments in electric vehicles (EVs), self-driving cars, and software-defined vehicles.
The sector grew more slowly than the nominal global GDP between 1995 and 2022, with value-added output increasing by 161 percent to $1.2 trillion, while global GDP grew by 229 percent. The industry is highly concentrated among a few key car manufacturing nations, including China (25.2 percent), Germany (14.4 percent), the United States (13.8 percent), and Japan (8.7 percent). The latter three nations are home to the largest and most well-known car brands, including Ford and General Motors in the United States, Nissan and Honda in Japan, and BMW and Volkswagen in Germany. China, on the other hand, has become well known in recent years for its collection of EV companies that have come to dominate the global EV industry, including industry giant BYD. It is the growth of China’s EV industry, spurred largely by generous subsidies from federal and local governments, that has propelled China to the lead in global market share.
Mexico, which holds 5.6 percent of global market share, ranks fifth. It has seen its global market share triple over this period, despite having no domestic car manufacturing companies; rather, it is a key offshoring location for American brands.
Figure 32: Top 10 producers’ historical shares of global output in the motor vehicles industry, 1995–2022
China’s global market share has increased by 22.5 percentage points since 1995, with the largest jump occurring in 2009, when the Chinese government began heavily subsidizing its EV industry.[7] Over the same period, Japan’s market share declined by 15.2 percentage points, the United States’ market share by 8.9 percentage points, and Germany’s market share by 1.3 percentage points. South Korea’s market share increased by 1 percentage point, while India’s, which has become one of the largest car manufacturers by unit in the world, increased by 3 percentage points. The OECD, which held over 88 percent of the global market share in 1995, has seen its share fall to just 60 percent in response to the growth of China and India.
China’s booming EV industry, which has received substantial subsidies from federal and local governments, has propelled it to the lead in global market share. It controls over 25 percent of the global market share.
When it comes to relative performance, Mexico is the leader by a good margin with an LQ of 3.94, meaning Mexico’s output of motor vehicles is 294 percent more than would be expected based on the size of its economy. Other nations with high industrial specializations include Germany (3.54), South Korea (2.33), Japan (2.08), and Sweden (1.98), which is home to Volvo. China overperforms in industrial specialization, with an LQ of 1.39, while the United States’ LQ of 0.54 highlights its weakness in this industry.
Mexico’s LQ increased the most (143 percentage points) over the previous decade due to the growing practice of offshoring American automobile production to Mexico, where labor and capital costs are lower. Germany (65 percentage points), Sweden (61 percentage points), Nigeria (40 percentage points), and Argentina (28 percentage points) experienced the next greatest increases in industrial specialization. The United States’ LQ declined by 2 percentage points over this period; however, comparing the U.S.’s 1995 LQ to 2022, the United States’ relative performance fell by nearly 40 percentage points, demonstrating the trough the U.S. auto industry found itself in during and after the Great Recession. Conversely, China’s LQ declined by 29 points from 2013 to 2022, but increased by 38 percentage points from 1995 to 2022.
Geopolitically, the OECD overperforms in motor vehicle production, with an LQ of 1.02, up 2 percentage points since 2002. The EU-10 (the 10 nations that joined after 2004) is highly specialized in this industry with an LQ of 1.91, while the broader EU-27 has an LQ of 1.53.
Figure 33: Relative performance in motor vehicles (2022 LQ)
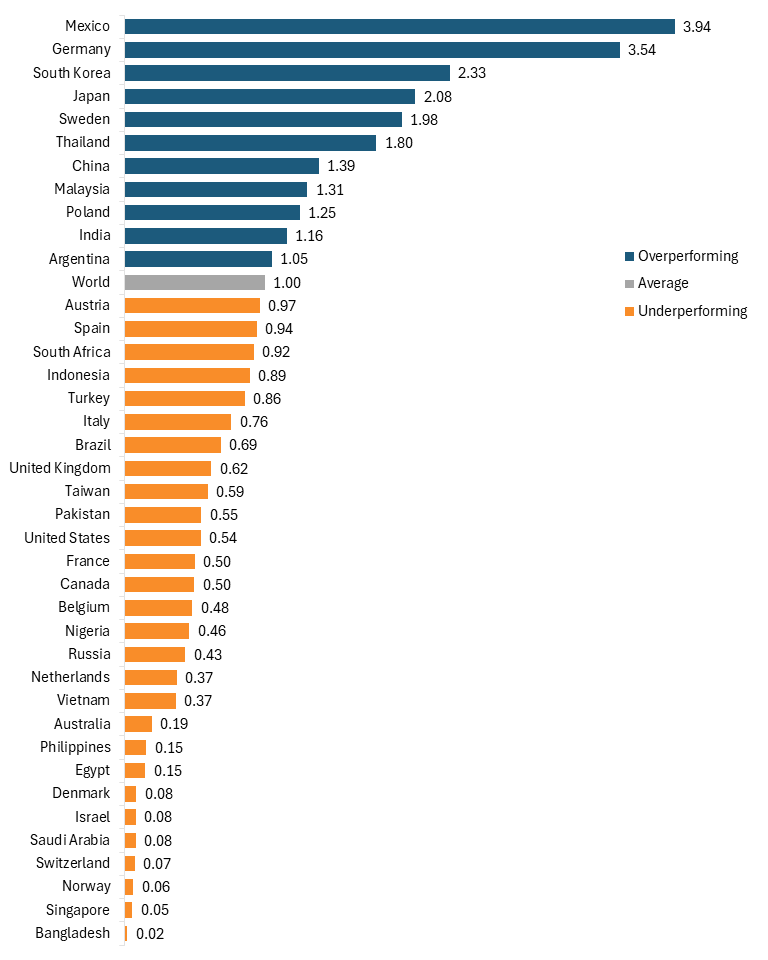
Figure 34: Net change in relative performance in motor vehicles (LQ difference, 2013–2022)
Fabricated Metals
The fabricated metals sector includes the manufacturing of metal parts. It’s a strategically important industry, as its products often act as intermediate goods for manufacturers in other advanced and national power industries.
Internationally, this industry grew by 159 percent between 1995 and 2022, slower than global GDP, which grew by 229 percent. In 2022, value-added output in this industry exceeded $1 trillion. China shot to the top of this industry ahead of the United States in 2016 and now holds 26.7 percent of global market share. Conversely, the United States held 17.7 percent of the global market share in 2022, a marked decline from 1995, when the U.S. market share was 25.1 percent. The OECD’s share of this industry has also declined considerably, with its global market share falling from 87.9 percent in 1995 to 52.6 percent in 2022.
Behind China and the United States are Germany, with 6.1 percent of the global market; Italy, with 4.2 percent; Indonesia, with 4 percent; and Japan, with 4 percent. Several developed nations lag behind in this industry, with the Netherlands, Austria, Sweden, Israel, and Belgium among those each controlling less than 1 percent of global market share.
Many nations in the top 10 lost market share over the 27-year period, with Germany’s market share falling by 5.4 percentage points, Italy’s by 1.4 percentage points, Japan’s by 13.8 percentage points, and France’s by 3.3 percentage points.
Figure 35: Top 10 producers’ historical shares of global output in fabricated metals, 1995–2022
With several OECD countries in the top 10, it’s unsurprising that the OECD still holds the majority of global market share. However, this share has fallen substantially, from 87.9 percent to 56.2 percent. Conversely, the Belt and Road Initiative saw its global market share increase from 16.8 percent in 1995 to just over 50 percent in 2022, a threefold increase. While much of this growth was driven by China, whose market share increased from 2 percent to nearly 27 percent, Indonesia, Russia, and Poland saw their market shares rise by 3 percentage points, 1.4 percentage points, and 1.2 percentage points, respectively.
The picture looks quite different when considering industrial specialization. Indonesia leads the world with an LQ of 3.16, meaning its output of fabricated metals is 216 percent above what would be expected based on its economy’s size. Behind Indonesia are Poland (2.32), Italy (2.04), South Korea (1.97), Austria (1.79), and Taiwan (1.69). China also overperforms in this industry with an LQ of 1.45, while the United States and most European nations underperform. Lagging nations include Singapore, the Philippines, Bangladesh, and Nigeria, all of which have an LQ below 0.25.
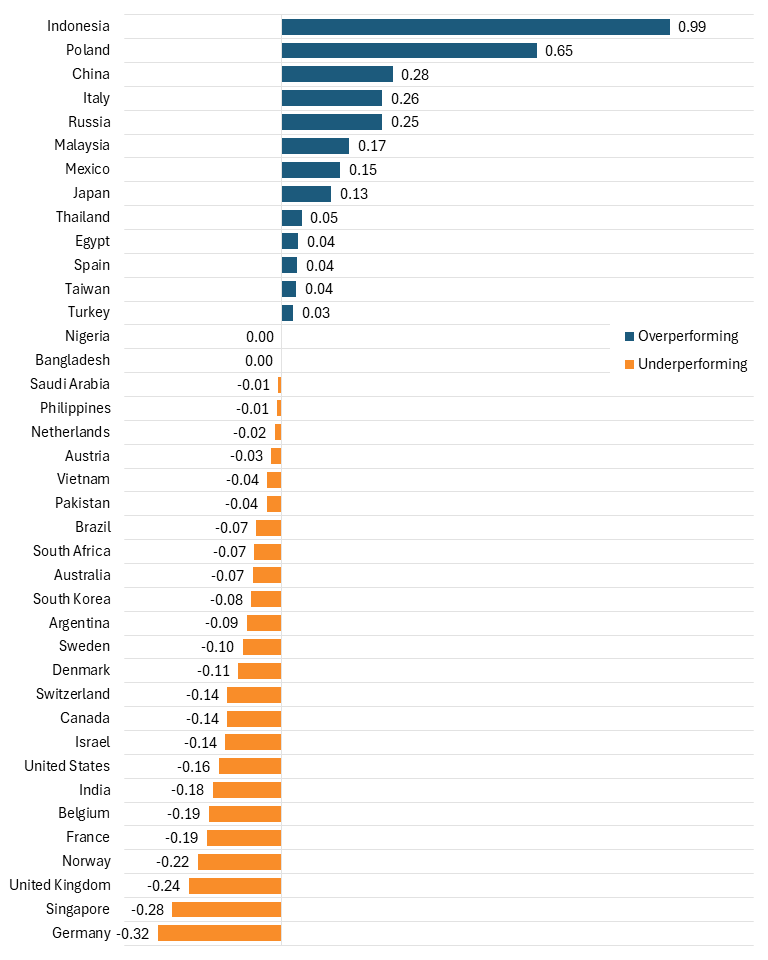
Since 2013, Indonesia has experienced the greatest increase in LQ, increasing from 2.17 in 2013 to 3.16 in 2022, a 99 percentage-point increase. Other countries with a large boost to their LQ include Poland (65 points), China (28 points), Italy (26 points), and Russia (25 points). The U.S. LQ declined over this period, falling 16 percentage points.
Looking at industrial specialization from a geopolitical perspective, the EU-10 highly overperforms, with an LQ of 2.11, up 29 points over the previous decade. The broader EU-27 also overperforms, but to a lesser extent, with an LQ of 1.37, down 6 percentage points over the same period. The OECD, dragged down by the United States’ low LQ, underperforms with an LQ of 0.95.
Figure 36: Relative performance in fabricated metals (2022 LQ)
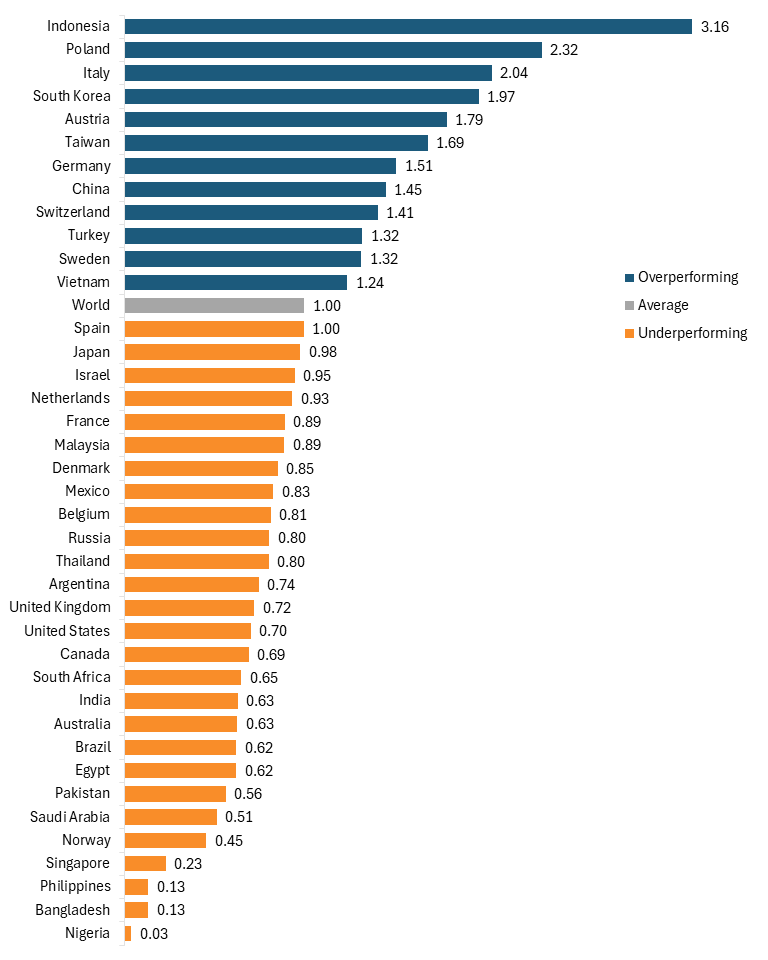
Figure 37: Net change in relative performance in fabricated metals (LQ difference, 2013–2022)
Pharmaceuticals
The pharmaceutical industry includes medicinal chemicals and botanical products. It is a strategically important sector given that much of it is high wage, traded across borders, and a key driver of innovation.
The output of the pharmaceutical industry increased by 312 percent from 1995 to 2022, more than global GDP, which increased by 229 percent over the same period. In 2022, pharmaceutical output was $872 billion. The OECD nations have lost market share, from 84 percent in 1995 to 71 percent in 2022; however, this decline was much more moderate than is apparent in other industries.
The United States is the leader in global market share, led by world-leading companies such as Amgen, Moderna, Pfizer, and Eli Lilly. In 2022, U.S. global market share was 28.6 percent, a moderate increase from 1995, when it was 26.5 percent, although down from a high of 34 percent reached in 2002. China is in second place, holding 17.3 percent of global market share, followed by Switzerland (4.5 percent), Germany (3.5 percent), Japan (3.1 percent), and India (2.5 percent). Lagging nations are nearly all developing countries, such as South Africa, Saudi Arabia, the Philippines, and Malaysia, which all have less than 1 percent of the global market.
Figure 38: Top 10 producers’ historical shares of global output in pharmaceuticals, 1995–2022
China has experienced the most dramatic rise in market share in pharmaceuticals, increasing by 14.6 percentage points. This massive increase has been catalyzed by China’s concerted effort to become the world leader in pharmaceutical production. In 2025, China conducted about 1,000 more clinical trials for pharmaceuticals than did the United States, demonstrating its increase in not just pharmaceutical manufacturing but also pharmaceutical innovation.[8] Switzerland also increased its global market share in this industry by 1.2 percentage points, while Germany lost 3 percentage points in market share and Japan experienced the greatest decline, seeing its share fall by 15.1 percentage points.
In terms of industrial specialization, the story is different. Switzerland led the world in 2022 with an LQ of 5.62, followed by European nations Denmark (5.20), Belgium (2.92), and Sweden (1.83). Argentina, the United States, and South Korea also overperform with LQs above 1. Notably, the OECD overperforms in this industry with an LQ of 1.20, while non-OECD nations underperform collectively, with an LQ of 0.71. Many of the lagging countries are developing nations, such as the Philippines, Malaysia, Saudi Arabia, and Nigeria, all of which had LQs below 0.2. China had an LQ of 0.95, which, while close to the world average, was still underperforming.
China experienced the most dramatic increase in pharmaceutical market share, rising by 14.6 percentage points. This massive increase has been catalyzed by China’s concerted effort to become the world leader in pharmaceutical production.
Looking at the change in industrial specialization, Denmark saw the largest increase in LQ since 2013, rising by 141 percentage points. This is more than triple that of the second-fastest grower, Belgium, which saw its LQ grow by 45 percentage points. By contrast, Singapore saw the largest decline in LQ, falling by 181 percentage points, with the steepest declines occurring between 2018 and 2022. Other nations that saw large declines were India (54 percentage points), Argentina (54 percentage points), and Israel (120 percentage points).
The OECD’s LQ increased by 10 percentage points over this same period, unsurprisingly given the growth of several OECD nations. Conversely, the LQ of the Commonwealth Nations of Australia, Canada, New Zealand, and the United Kingdom fell by 12 points, largely driven by the large decline in the United Kingdom. Despite several highly specialized countries, the EU also saw its LQ decline, falling by 12 percentage points over the previous decade.
Figure 39: Relative performance in pharmaceuticals (2022 LQ)
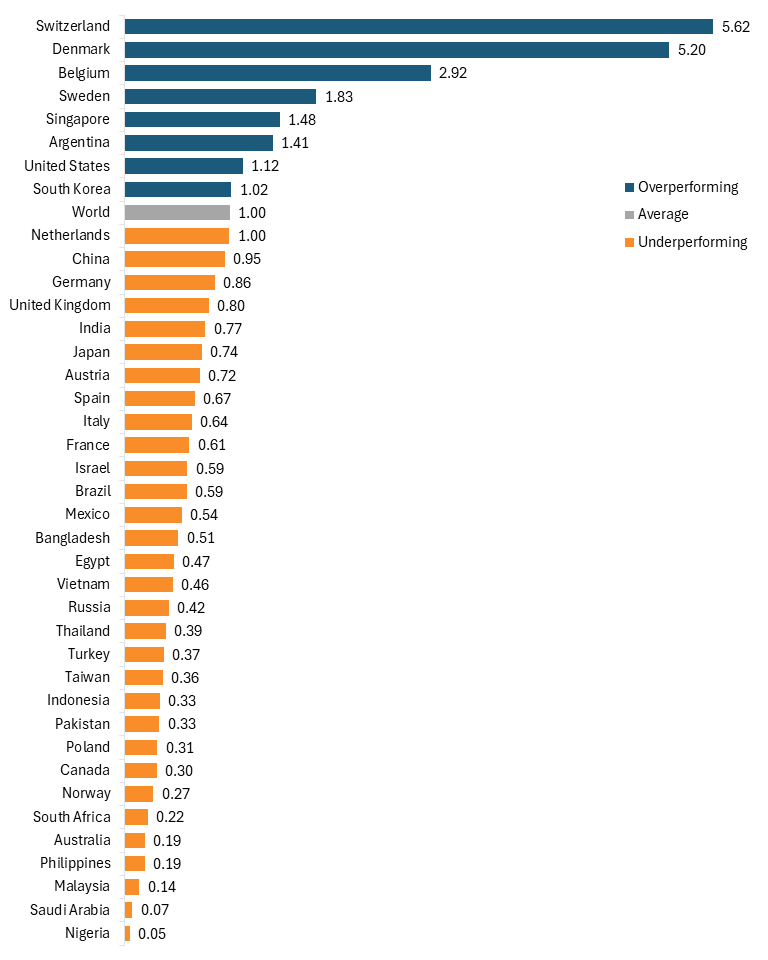
Figure 40: Net change in relative performance in pharmaceuticals (LQ difference, 2013–2022)
Electrical Equipment
The electrical equipment industry includes an array of electrical products, including batteries, electrical cables, relays, switchgears, and household appliances.
Globally, this sector has grown more slowly than GDP, rising 142 percent in nominal U.S. dollars since 1995, compared with 229 percent over the same period. Still, the sector was valued at $680 billion dollars in 2022. The OECD, which was once the overwhelming leader in this industry and held over 89 percent of the global market share, has seen its dominance decline over the 27-year period. In 2022, the OECD controlled just 46.9 percent of the global market share.
China is the leader in the industry in terms of market share, controlling 38.5 percent. The next closest country to China is the United States, which held only 11.3 percent of the market share in 2022. Japan (8 percent), Germany (7.4 percent), South Korea (4.4 percent), and India (2.5 percent) are also leaders in the industry; however, their market influence pales in comparison with China. The EU-27 (excluding Ireland), which once held nearly 30 percent of the global market share, has seen its share fall to 18 percent.
China has been the leader in this industry since 2007, when it passed Japan to become the largest producer of electrical equipment. Over the period from 1995 to 2022, China’s global market share increased from 3.7 percent to 38.5 percent, a total of 34.8 percentage points. Meanwhile, Japan suffered the greatest loss in market share, falling 26 percentage points from the world leader to third place. Though not as dramatic, the German and U.S. market shares also fell by 7.5 and 5.1 percentage points, respectively.
Figure 41: Top 10 producers’ historical shares of global output in the electrical equipment industry, 1995–2022
Although not an absolute frontrunner in the industry, South Korea leads in the industrial specialization of electrical equipment, with an LQ of 2.68. Other high relative performers include Vietnam (2.19), China (2.11), Japan (1.93), and Austria (1.93). The United States significantly underperforms in this industry, with an LQ of just 0.45 in 2022, while most lagging nations are developed, less industrialized countries such as Norway (0.23), Singapore (0.22), and Australia (0.20). Nigeria has almost no electrical equipment manufacturing activity.
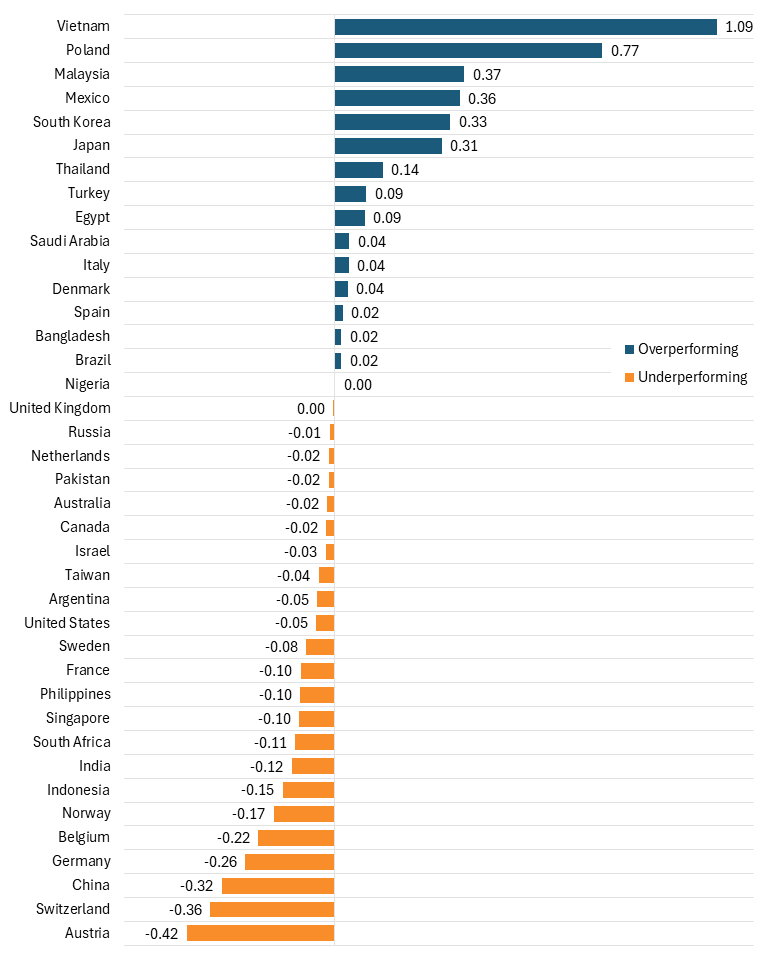
Vietnam experienced the greatest increase in relative performance, increasing by 109 percentage points since 2013. The other nations with the fastest percentage point growth in their LQs over this period were Poland (77 percentage points), Malaysia (37 percentage points), and Mexico (36 percentage points). In aggregate, OECD nations saw a 7 percentage-point decline in their LQs. Among the nations whose LQs declined are Belgium (22 percentage points), Germany (26 percentage points), China (32 percentage points), Switzerland (36 percentage points), and Austria (42 percentage points).
Geopolitically, the EU-10 saw the greatest increase in industrial specialization, with its LQ increasing by 45 points from 1.33 to 1.78. Conversely, the EU-17, which comprises countries with relatively more jobs in the knowledge economy than in manufacturing, saw its LQ fall by 7 points, from 0.92 to 0.85.
Figure 42: Relative performance in electrical equipment (2022 LQ)
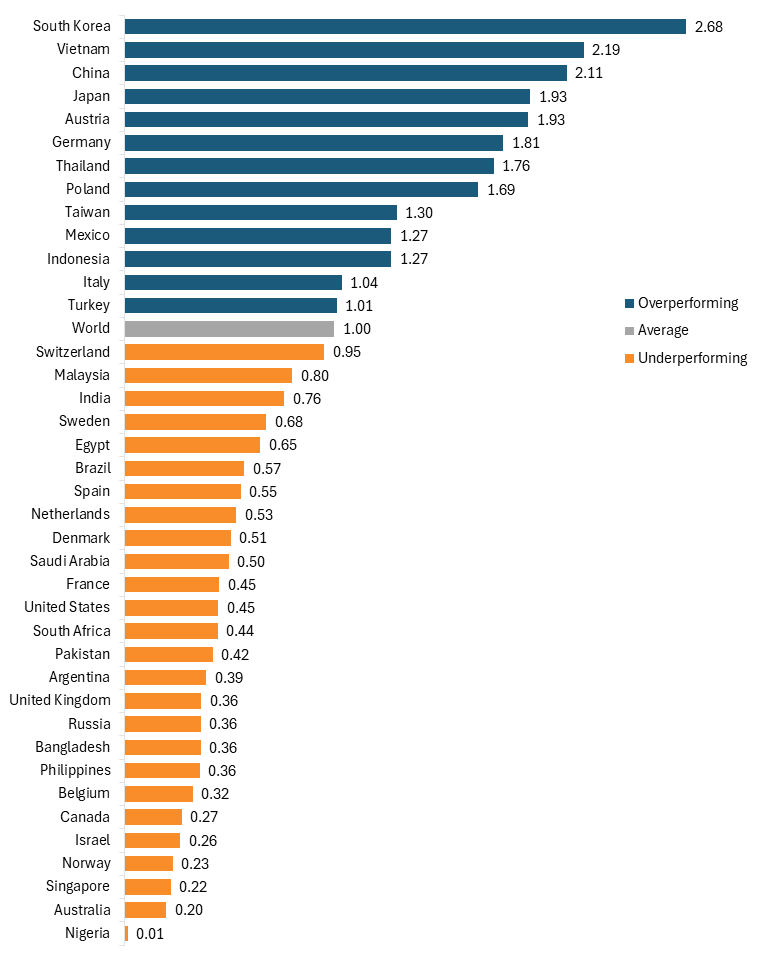
Figure 43: Net change in relative performance in electrical equipment (LQ difference, 2013–2022)
Other Transportation Equipment
The other transportation sector includes all rail, air, and sea transportation equipment.
Between 1995 and 2022, the global other transportation industry’s output increased by 183 percent, reaching $423 billion. However, this growth was slower than the global GDP, which grew by 229 percent. The OECD controlled the vast majority of the global market share in this industry, holding nearly 71 percent.
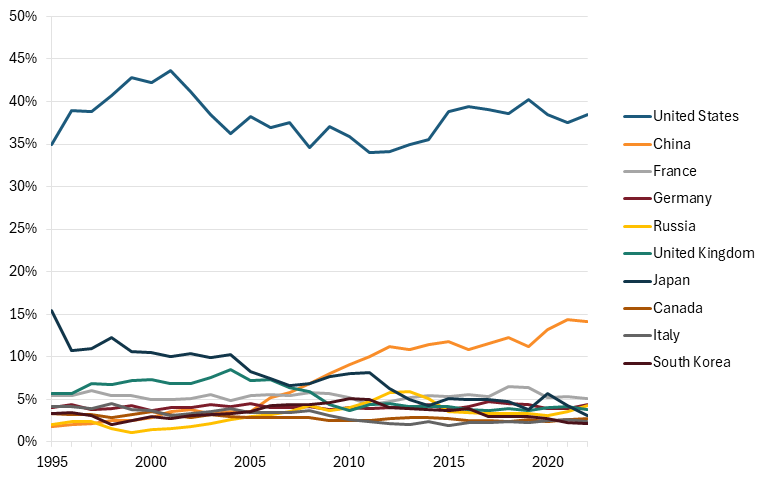
Other transportation is one of the few industries wherein the United States holds a clear majority over China. Largely due to its dominance in the aviation industry, led by defense and commercial manufacturers such as Boeing, Lockheed Martin, and Pratt & Whitney, the United States controls 37.6 percent of the global market share, more than twice China’s 14.2 percent. Other leading nations are France (5.1 percent), Germany (4.4 percent), and Russia (4.3 percent). Japan, which was once second in the world behind the United States, controlled 3.1 percent of global market share, down from 16 percent in 1995.
Though China controls a much smaller share of the global market than the United States, its power in this industry is evident. China’s market share has increased from 1.8 percent in 1995 to 14.2 percent, driven by its expansion in high-speed rail and shipping, and its recent push to become a leader in the aerospace industry through its national firm, COMAC. U.S. market share in this industry has increased by 3.6 percentage points since 1995, though it remains far below its peak of 43.7 percent in 2001.
Figure 44: Top 10 producers’ historical shares of global output in other transportation equipment, 1995–2022
As a group, the OECD’s market share has fallen by nearly 16 points since 1995, from 86.2 percent to 70.2 percent, while the Quad’s market share also has declined by over 8 percentage points. In contrast, the Belt and Road Initiative has gained 12 percentage points, a significant share.
The story is much different when it comes to industrial specialization. Taiwan leads the world with the highest LQ of 2.87, followed by Russia (1.90), France (1.86), Singapore (1.78), and the United States (1.52). While China underperforms with an LQ of 0.78, that is still an increase from 1995, when its LQ was just 0.62. Additionally, given China’s continued dominance across the three other transportation industries, China’s LQ is likely to continue increasing in the coming years.
Led by defense and commercial manufacturers such as Boeing, Lockheed Martin, and Pratt & Whitney, the United States controls 37.6 percent of the global market share in other transportation, more than twice China’s 14.2 percent.
Taiwan is also the nation that has experienced the greatest increase in industrial specialization, with its LQ rising by 85 percentage points since 2013. Following Taiwan is Italy (an increase of 42 percentage points), France (40 percentage points), Germany (24 percentage points), and Mexico (24 percentage points). The U.S. LQ has declined moderately over this period, falling by 10 percentage points.
Looking at the industry from a geopolitical perspective, USMCA nations perform well with an LQ of 1.44, driven by the overperformance of the United States and Canada. The Quad also overperforms with an LQ of 1.29. The EU, while not the best-performing relative to other geopolitical groups, has seen the greatest growth, with its LQ rising by 16 percentage points since 2013.
Figure 45: Relative performance in other transportation equipment (2022 LQ)
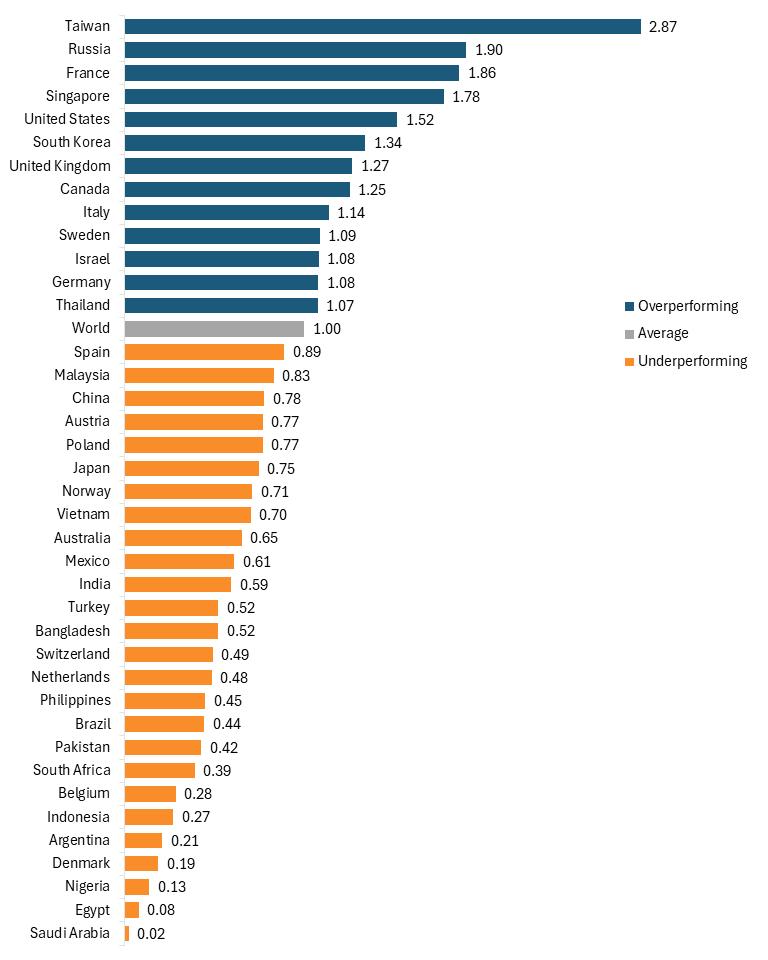
Figure 46: Net change in relative performance in other transportation equipment (LQ difference, 2013–2022)
Top 10 Producer Profiles
This section assesses the top 10 nations in terms of aggregate advanced industry output in 2022, in order of output.
Data Visualizations for All Countries and Regional Groupings
Use the accompanying data visualization tool to browse the complete dataset for every country and regional grouping in this report: “The Hamilton Index, 2026: Data Visualization for Countries.”
China
China has been seeking to become the global leader in advanced industries for over two decades and is close to that goal. In 2013, China overtook the United States as the leader in advanced industry output and has continued to increase its lead. As of 2022, Hamilton Index industries accounted for 15.8 percent of China’s economy, over 4 percentage points more than the world average. (See figure 47.)
Figure 47: Hamilton industries’ shares of China’s economy, 1995–2022
China’s leadership is further evident when considering global market share. Since 1995, China’s advanced industry output has skyrocketed, with every industry undergoing intense growth. Even its smallest industry, IT and information services, has nearly quintupled in size, with China’s market share rising from 2.1 percent to 9.3 percent, making it second in the world. China is either the first- or second-most powerful country in every advanced industry by market share, and in almost every industry, its market share looks on track to continue increasing. (See figure 48.)
Figure 48: China’s global market shares in Hamilton industries, 1995–2022
Looking at relative performance, China overperforms in 7 of the 10 Hamilton Industries, with just pharmaceuticals, other transportation, and IT and information services having LQs below one. However, it’s not unreasonable to assume that these industries (at the very least, pharmaceuticals and other transportation) will be overperforming in the next few years. China’s pharmaceutical industry has grown from a manufacturer to an innovator over the past several years and has shown signs of closing the gap with the United States.[9] Additionally, its other transportation industry is likely to be buoyed by growing federal support and, consequently, by the growth of its state-sponsored aviation firm, COMAC.[10]
China is either the first- or second-most powerful country in every advanced industry by market share, and in almost every industry, its market share looks on track to continue increasing.
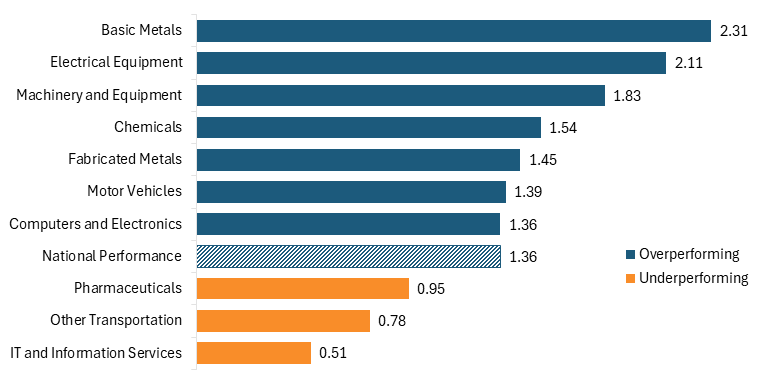
China’s strongest industry is basic metals (LQ of 2.31), including steel production, an industry the Chinese government has subsidized at roughly five times the rate of comparable economies.[11] China has also shown its prowess in other heavy manufacturing industries, including electrical equipment, which includes home appliances, many of which the U.S. government has placed tariffs on since 2018, and machinery and equipment.[12] (See figure 49.)
Figure 49: China’s relative performance in Hamilton Index industries (2022 LQ)
The trends of China’s advanced industries LQs loosely follow an upside-down-U shape, with many peaking around the global financial crisis in 2008 and then declining in the years since. As previously stated, the recent decline in China’s LQs is not a sign that China’s advanced industry output is declining, but rather reflects the fact that its advanced industries are growing more slowly than the overall economy. As evidenced by its across-the-board increase in global market share over the past decade, China’s advanced industries are growing at a rapid pace. However, its economy has grown faster, nearly quadrupling since 2008. So although China has become less specialized in advanced industries since the mid 2000s, it is no less of a dominant leader in advanced industries. Additionally, when considering China’s LQ trend since 1995, China’s LQ has increased significantly, by 12 percentage points, more than the United States or the OECD.
Figure 51 shows the net improvement or regression in the relative performance of China’s Hamilton industries since 2013, scaled to their output in 2022. In this figure, each industry can be assessed by its LQ, change in LQ since 2013, and size, measured by output in 2022. Industries in the upper left quadrant are overperforming, but their LQs have regressed; this quadrant houses the majority of China’s industries, including its biggest industries: basic metals and machinery and equipment. Industries in the upper right quadrant are overperforming and their LQs have increased; only fabricated metals falls into this category. The bottom right quadrant shows industries that are underperforming and improving; no industry is located in this quadrant. And the bottom left shows industries that are underperforming and regressing; this includes China’s pharmaceuticals and other transportation industries, although, as stated previously, these industries are likely to overperform in the next several years.
It’s important to note that, although surprising that the Made in China 2025 plan and previous five-year development plans have not led to an increase in relative performance over the past several years, overall, China’s LQ has still increased since 1995. And what’s more, given China’s LQ of 1.36, China’s output in advanced industries is 36 percent more than what is expected based on the size of its economy.
Figure 50: China’s relative historical performance in Hamilton Index industries (LQ trends, 1995–2022)
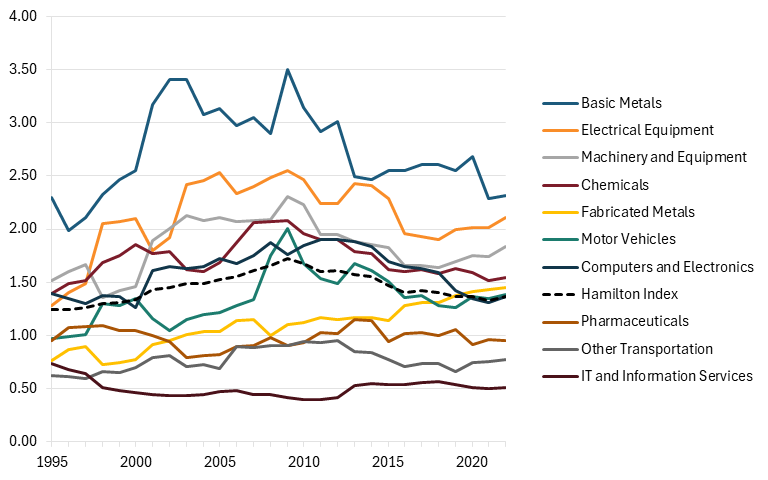
Figure 51: China’s net performance in Hamilton industries since 2013 (scaled to 2022 output)
United States
The United States is no longer the world leader it once was. A lack of industrial policy and a shift from a producer to a services-based economy have left the United States weak in advanced industries. The industries in the Hamilton Index together accounted for 10.2 percent of the U.S. economy in 2022, less than the global average of 11.6 percent and a 9 percent decline from 1995, when Hamilton industries accounted for 11.2 percent of the U.S. economy. (See figure 52.) Although Hamilton Industries’ share of the U.S. economy has been on a steady rise since 2009, almost all of that increase can be attributed to the IT and information services sector, the industry in which the United States is most dominant. Excluding this share, Hamilton industry output as a share of the U.S. economy fell from 7 percent in 2009 to 6.9 percent in 2022.
Figure 52: Hamilton Index industries’ shares of the U.S. economy, 1995–2022
When it comes to global market share, the United States is a story of stagnation, if not decline. Seven of the 10 advanced industries experienced declines, ranging from 1 percentage point (chemicals) to 9 percentage points (motor vehicles). Only IT and information services experienced a marked rise in output and market share, with U.S. global market share in the industry growing nearly 13 percent since 1995.
Figure 53: America’s global market shares in Hamilton industries, 1995–2022
To illustrate the outsized impact IT and information services have on the U.S. advanced industry economy, see figure 54. In terms of overall global market share, U.S. output fell from a peak of 28.1 percent in 2000 to 22.3 percent in 2022. However, from 2011 to 2022, that share increased from a nadir of 18.8 percent, but almost all of that growth was driven by the IT services industry. When excluding this sector, U.S. global shares of advanced industries peaked in 2000 at 28.1 percent and then fell steadily, just as American firms began offshoring to China. Without IT, American global market share reached a low of 17.2 percent in 2011 and then rose slightly to 18.9 percent in 2022. Given this, it’s evident that the United States’ strength in IT services hides a real structural weakness in advanced manufacturing.
A similar trend emerges when examining industrial specialization. The U.S. LQ peaked in 1997 at 0.99 and then gradually declined through 2022, reaching 0.88. However, when IT services were removed from the industries considered, U.S. LQ declined even more sharply. Between 1997 and 2022, the U.S. LQ in advanced industries fell from a high of 0.98 to a low of 0.72 in 2021, before climbing slightly to 0.74 in 2022.
Figure 54: America’s global market share of Hamilton industries with and without IT, 1995–2022
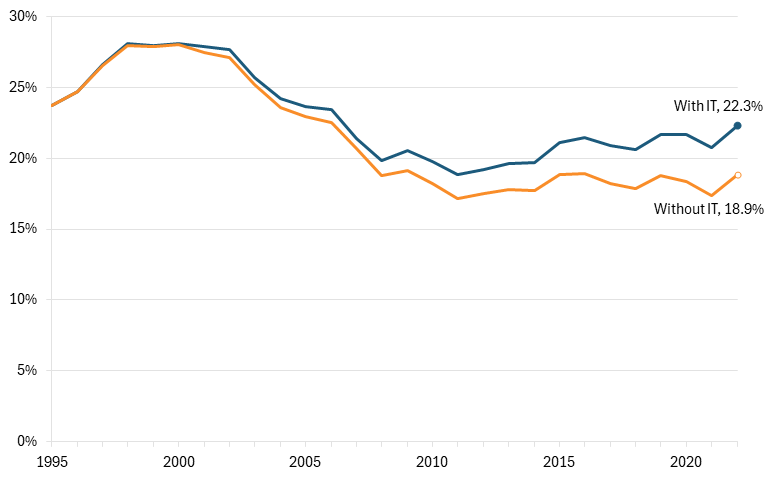
Figure 55: America’s LQ in Hamilton industries with and without IT, 1995–2022
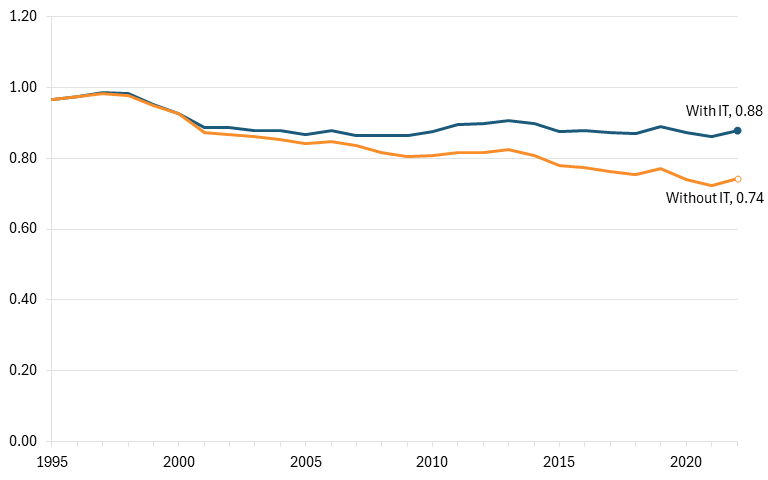
The United States’ strongest industry in terms of relative performance is other transportation, where it had an LQ of 1.52 in 2022, reflecting its strength in aerospace. The only other two industries that the United States overperforms in are IT and information services (1.42) and pharmaceuticals (1.12). The LQs of the chemicals and computers and electronics industries are both close to 1, at 0.91 and 0.90, respectively, while the other five industries have LQs of 0.70 or lower.
Figure 56: America’s relative performance in Hamilton Index industries (2022 LQ)
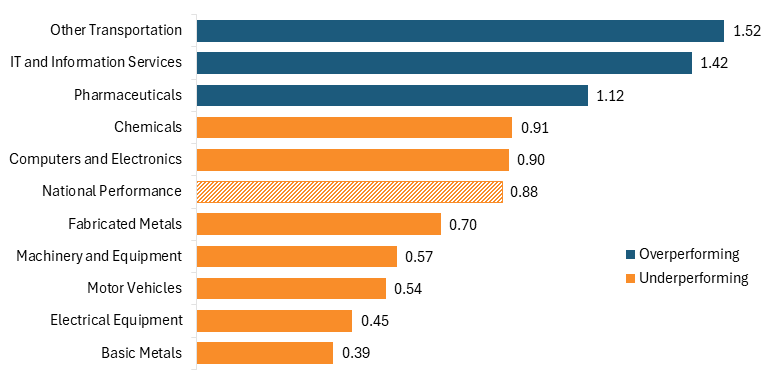
Only one industry saw an increase in its LQ since 2013: IT and information services (6 percentage points. IT and information systems grew in the United States due to the dominance of the U.S. software sector and, more recently, the rapid growth of the AI industry, which is just beginning to be reflected in 2022 data. Should AI continue to be the economic catalyst it has proven to be over the past few years, and should American AI firms continue to lead Chinese competitors, the United States should see continued growth in this industry.
Only one industry in the United States increased its LQ since 2013: IT and information services.
Conversely, the all other advanced industries experienced declines since 2013: fabricated metals (16 percentage points), computers and electronics (15 percentage points), machinery and equipment (13 percentage points), other transportation (10 percentage points), basic metals (6 percentage points), electrical equipment (5 percentage points), chemicals (3 percentage points), pharmaceuticals (2 percentage points), and motor vehicles (2 percentage points) all declined through 2022.
Figure 57: America’s relative historical performance in Hamilton Index industries (LQ trends, 1995–2022)
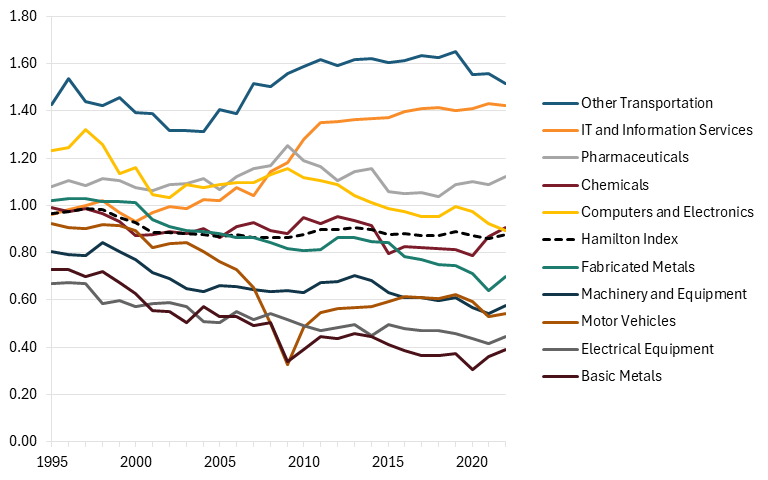
Only IT and information services overperformed in 2022 and experienced an increase in its LQ from 2013 to 2022. (See figure 58.) This industry is the largest in the United States and is subject to intense competition from Chinese competitors, making it critical that it continue to receive public and private support to ensure its continued growth and innovation potential.
Unfortunately, the majority of U.S. industries fall into the underperforming and regressing category. One of those advanced industries, computers and electronics (America’s second largest), has regressed the second most over the previous 10 years, largely due to offshoring to East Asia, leaving the U.S. electronic manufacturing ecosystem gutted. The largest attempt to solve this problem, the CHIPS and Science Act, is expected to reinvigorate this industry by the 2030s through the construction of several semiconductor manufacturing plants and research centers throughout the United States. It’s likely that some of this revival will show up in data beyond 2022. However, these plans, which have already encountered costly regulatory hurdles, are just one step to reviving one industry.[13] The United States needs a coordinated plan with reforms across science and research, education and workforce, investment, manufacturing broadly, and more in order to truly increase advanced manufacturing output.
Figure 58: America’s net performance in Hamilton industries since 2013 (scaled to 2022 output)
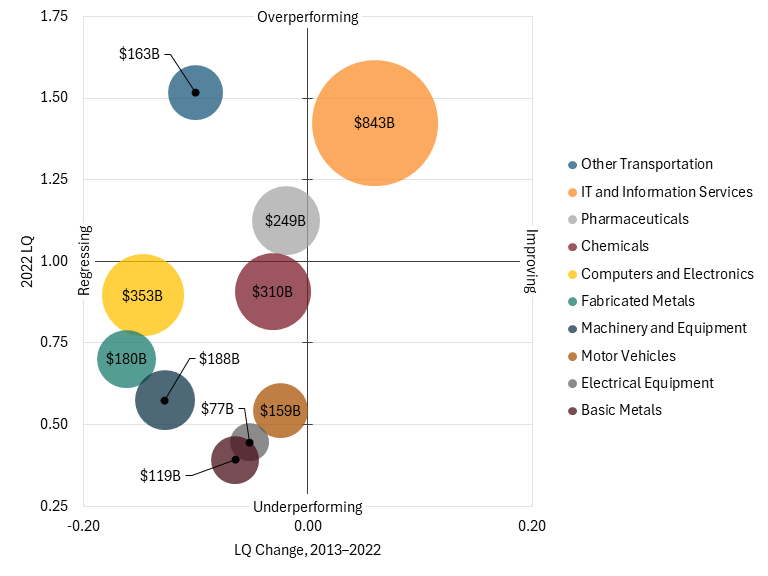
Germany
The story of Germany’s output in advanced industries is one of a long and slow decline, and an unwillingness to view China as the economic and industrial threat it is means that Germany’s future will likely look a lot like its past. China’s growth in advanced industries will soon harm German exports to China, further eroding Germany’s global market share in these sectors. Germany’s share of the global market fell from 10.4 percent in 1995 to just 5.9 percent in 2022. Also, over that period, Germany went from beating China in advanced industry output from 1995 to 2006 to then falling far behind, with China’s output in advanced industries now almost five times higher than Germany’s.
Germany’s marquee industry, motor vehicles, has seen its market share fall by 1.3 percent, a decline driven in recent years by the boom in Chinese EVs in the Chinese domestic market and the Global South.
However, looking at Germany’s domestic economy, advanced industries have become a much more important source of economic activity. Germany’s advanced industry output as a share of its total economy increased from 14.4 percent in 1995 to 17.8 percent in 2017, before settling at 16.9 percent in 2022 (figure 59). Compared with the international average, Germany’s economy is substantially more concentrated in advanced industries. The motor vehicle industry is the largest advanced industry in the German economy, propelled by the success of world-leading car brands BMW, Volkswagen, Mercedes-Benz, and Audi, accounting for 4 percent of German GDP. The IT and information services industry is the second largest, accounting for 2.9 percent.
Figure 59: Hamilton Index industries’ shares of Germany’s economy
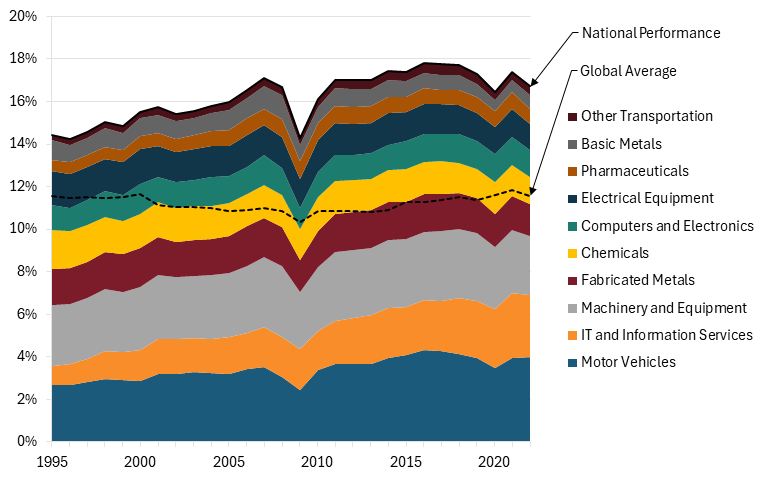
As shown in figure 60, in the global market, almost every German advanced industry has lost market share since 1995. To highlight the largest declines, Germany’s market share in electrical equipment has fallen by 7.5 percentage points, its share of the chemicals industry by 6.9 percentage points, and its machinery and equipment industry by 5.7 percentage points. Even Germany’s marquee industry, motor vehicles, has seen its market share fall by 1.3 percent, a decline driven in recent years by the boom in demand for cheap Chinese EVs in the Chinese domestic market and the Global South. Only other transportation experienced an increase in global market share, but by only 0.3 percentage points.
Germany overperforms in the majority of industries in terms of industrial specialization. (See figure 61.) Once again, Germany’s top industry is motor vehicles, where it has an LQ of 3.54, one of the highest in the world. It is also strong in machinery and equipment, electrical equipment, and fabricated metals, all of which have LQs of 1.50 or higher. Germany underperforms in chemicals, pharmaceuticals, and computers and electronics, although its worst industry is basic metals, with an LQ of 0.53.
Figure 60: Germany’s global market shares in Hamilton industries, 1995–2022
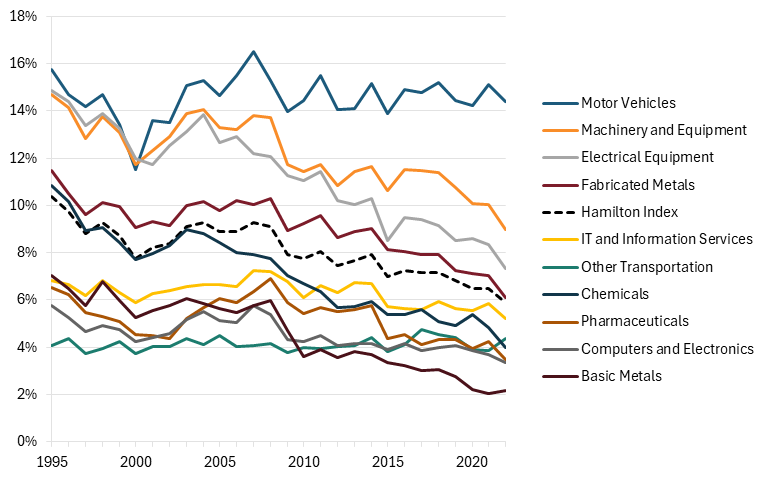
Figure 61: Germany’s relative performance in Hamilton Index industries (2022 LQ)
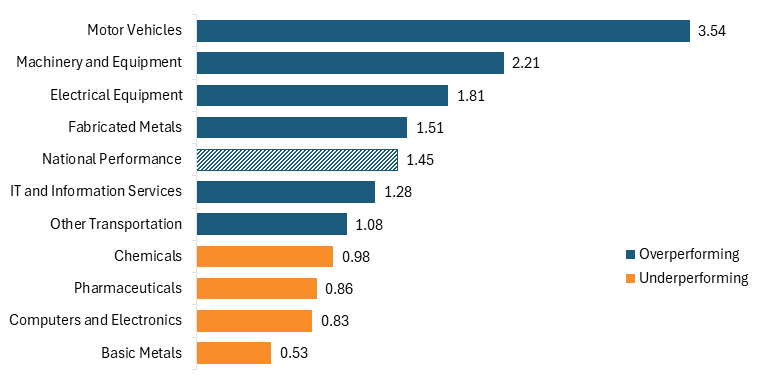
Germany’s industrial specialization has declined in most industries since 2013, with its overall LQ falling 13 percentage points. However, had it not been for the relative growth of Germany’s automobile industry (its LQ increased by 65 percentage points), Germany’s decline would have been even more substantial. Similar to the United States and its IT industry, Germany’s economy has been buoyed by its motor vehicle industry, giving the impression of a rosier story, when the reality is grimmer. Aside from motor vehicles and other transportation, every other industry declined in terms of relative performance, with some falling as much as 32 percentage points.
Figure 62: Germany’s relative historical performance in Hamilton industries (LQ trends, 1995–2022)
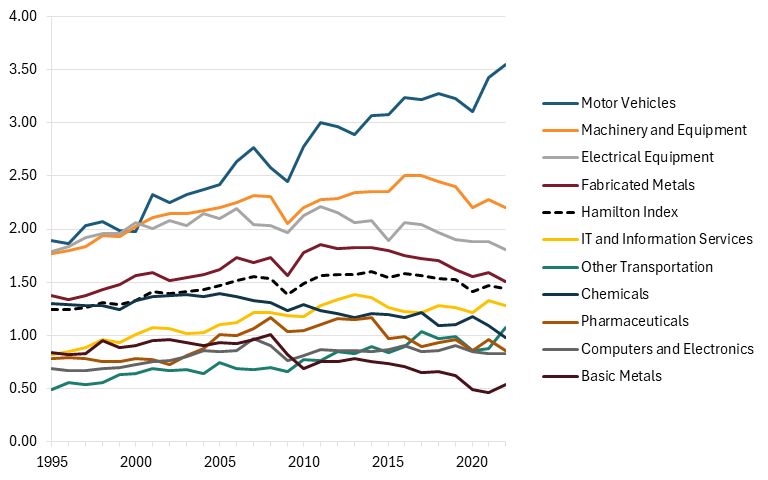
Only the automobile and other transportation industries appear in the top right quadrant of figure 63, demonstrating that they are the only industries in which Germany is both overperforming and has increased its LQ since 2013. Four other industries—machinery and equipment, electrical equipment, fabricated metals, and IT and information services—are also overperforming, but their LQs have declined since 2013. The final four advanced industries—chemicals, pharmaceuticals, computers and electronics, and basic metals—are both underperforming and declining. Though fabricated and basic metals experienced the steepest declines, they are not the sectors that should worry Germany the most, as they are among the smallest advanced industries in the country. Rather, the decline in machinery and equipment (11 percentage points) should be concerning, given the size of the industry and China’s expansion in it since 1995.
Figure 63: Germany’s net performance in Hamilton industries since 2013 (scaled to 2022 output)
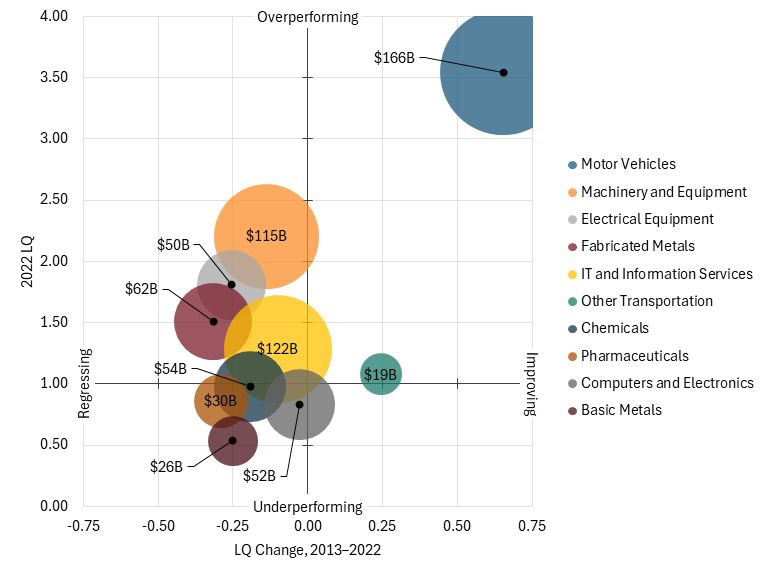
Japan
If Germany’s advanced industry story is one of a long and slow decline, Japan’s is one of a long and rapid decline, in which global market shares in every industry have fallen, leaving open the question of whether Japan can compete in a world dominated by the United States and China.
In 1995, Japan led the world in advanced industry production, holding 24 percent of global market share and, for the last time, exceeding the United States in value-added output ($864 billion compared with $854 billion). But since then, Japan’s global market share has dived, falling 18.2 percentage points to 5.8 percent, the fourth highest in the world. Japan’s decline in advanced industries is a symptom of greater problems within the Japanese economy since the 1990s, which have led to reduced investment and consumption, leaving Japan unable to compete with the growing competition from the United States, China, and elsewhere.
Given this decline in the Japanese economy, Japan’s concentration of advanced industries and its LQs remained quite stable from 1995 to 2022. Japanese advanced industry output as a share of its total economy actually increased from 15.6 percent to 16 percent between 1995 and 2022. Machinery and equipment accounted for the largest share of advanced industry output (3.1 percent), followed by IT and information services (2.5 percent) and motor vehicles (2.3 percent).
Figure 64: Hamilton Index industries’ shares of Japan’s economy, 1995–2022
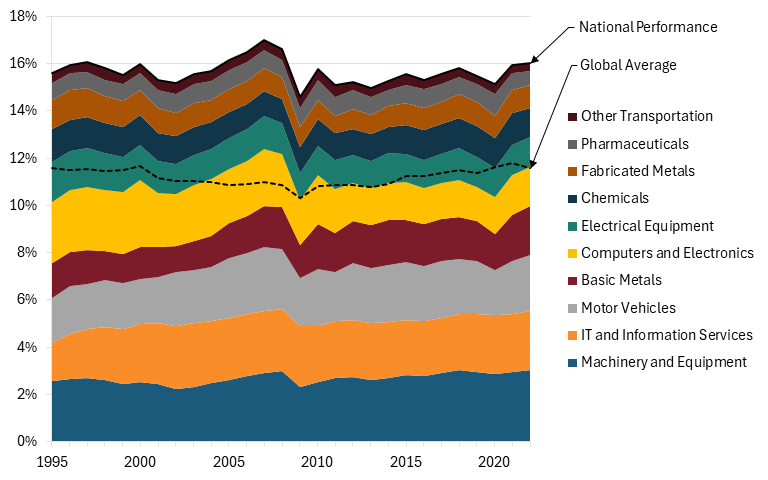
Figure 65: Japan’s global market shares in Hamilton industries, 1995–2022
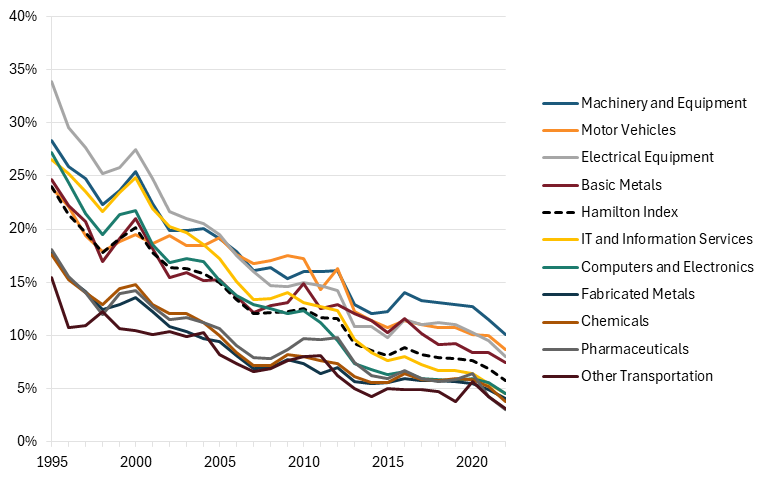
Japan’s global market share declined across all advanced industries by 12 to 26 percentage points. Other transportation, supported by Japan’s strong high-speed rail and shipbuilding industries, declined the least, followed by the fabricated metals and chemicals industries. Conversely, Japan’s electrical equipment industry experienced the starkest decline, falling nearly 26 percentage points from 33.9 percent to 8.1 percent.
In terms of relative performance, Japan overperforms in machinery and equipment, motor vehicles, electrical equipment, basic metals, IT and information services, and computers and electronics. And among the industries in which Japan underperforms, fabricated metals and chemicals are both close to average, with LQs over 0.90. Other transportation and pharmaceuticals are Japan’s weakest industries in terms of relative performance, with LQs of 0.75 and 0.74, respectively. (See figure 66.)
Figure 66: Japan’s relative performance in Hamilton Index industries (2022 LQ)
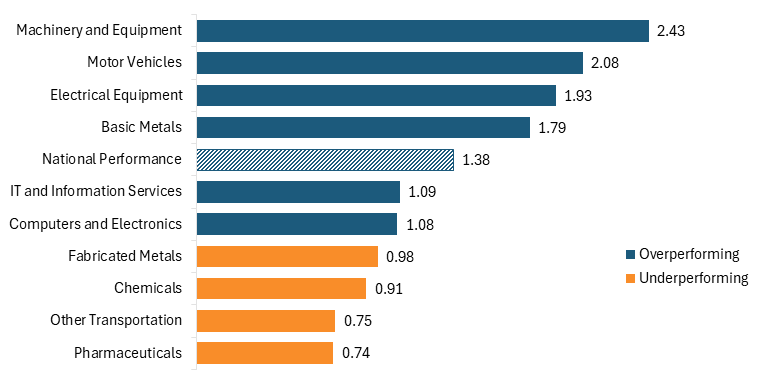
As previously stated, Japan’s LQs have not declined at the same rate as its global market shares have. Since 2013, Japan’s overall Hamilton Index LQ has declined by just 1 percentage point. Yet, several of Japan’s advanced industries have seen an increase in relative performance over this period: machinery and equipment (50 percentage points), electrical equipment (31 percentage points), motor vehicles (24 percentage points), and fabricated metals (13 percentage points) all experienced an increase in LQ.
Figure 67: Japan’s relative historical performance in Hamilton Index industries (LQ trends, 1995–2022)
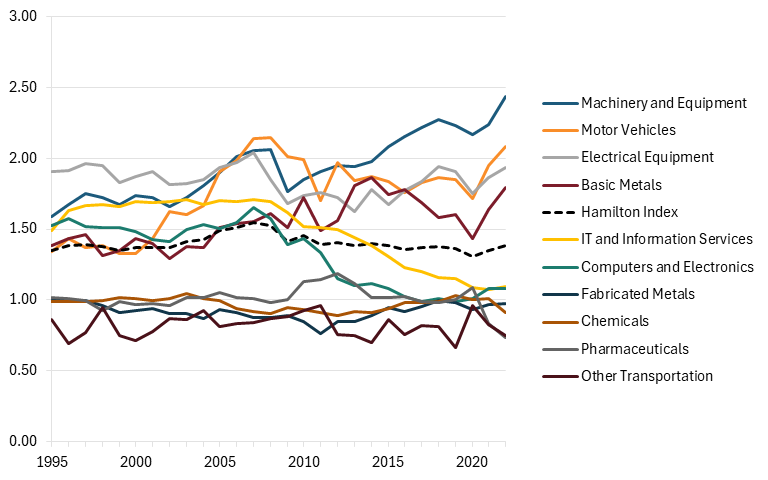
Many of Japan’s largest industries fall into the top right quadrant of figure 68, demonstrating that they are both performing above average and improving. Among these industries is machinery and equipment, Japan’s largest industry by output, valued at $130 billion in 2022, and the motor vehicle industry, which was valued at $100 billion in 2022. Japan’s second-largest industry, IT and information services, is also overperforming, but its LQ has declined by 34 percentage points since 2013, placing it in the top left quadrant. Only one industry, pharmaceuticals, underperformed and saw its LQ decline by 38 percentage points over the previous decade.
The decline of Japan’s computer and electronics industry is also concerning and surprising, given Japan’s historic success in that industry, with firms such as Samsung leading the charge. However, China, South Korea, and Taiwan have proved formidable competitors in recent years, challenging Japan in export markets.
Figure 68: Japan’s net performance in Hamilton industries since 2013 (scaled to 2022 output)
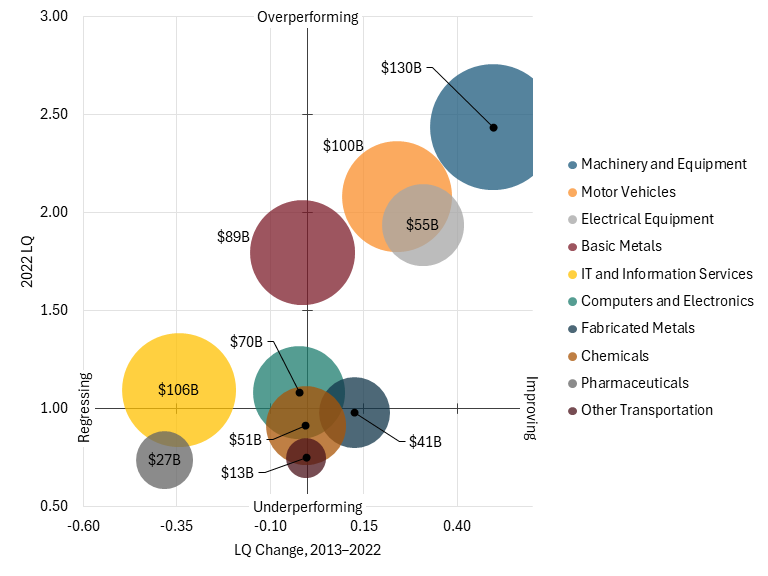
South Korea
After more than two decades of steady increases in output, South Korea’s advanced industries have finally begun to flounder in the face of the China Challenge. Between 1995 and 2018, South Korea’s global market share in Hamilton Industries steadily increased, driven by the country’s outsized strength in computer and electronics manufacturing. But since 2018, South Korea has been in decline, and its ability to properly counter China’s expansion and innovation in the computers and electronics industry is being called into question. For instance, between 2018 and 2022, South Korea’s output in computers and electronics fell by more than $10 billion, while China’s output increased by more than $84 billion.
Notably, Chinese firms have become key competitors with South Korean firms in display technology, an industry once dominated by South Korean firms. China is now the leading global producer of LCD and OLED displays and is a leading innovator in the industry.[14] Additionally, Chinese firm Huawei is in direct competition with Samsung, a Japanese firm with large production operations in South Korea, decreasing South Korea’s share of the global market.
But when considering just the domestic South Korean economy, advanced industries play an outsized role. In 2022, the output of advanced industries accounted for 25 percent of South Korea’s economy, meaning that one out of every four dollars of output in South Korea was attributable to advanced industries. The computers and electronics industry was the largest of these, with industry leaders such as LG, Samsung, and SK Hynix accounting for 8 percent of the total economy. The chemical industry was the second largest, accounting for 2.8 percent of total output.
Figure 69: Hamilton Index industries’ shares of South Korea’s economy, 1995–2022
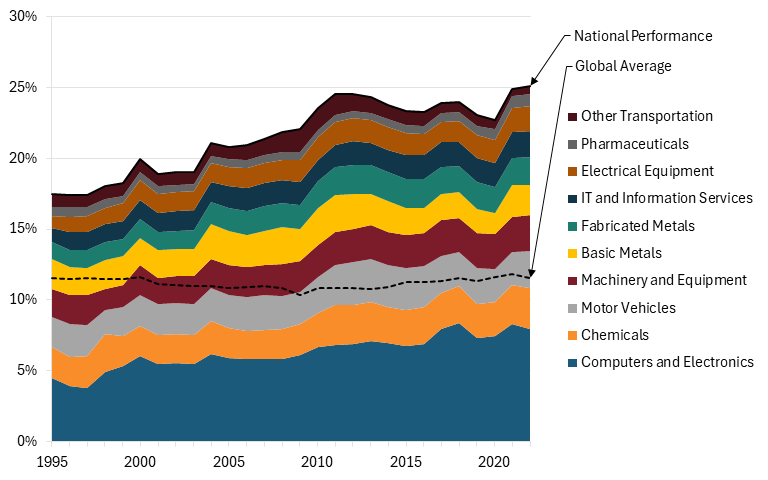
South Korea’s trends in global market share are most easily understood when the data is bifurcated into two periods. The first period, from 1995 to 2018, saw broad and continuous growth across almost every industry. South Korea’s global market share increased in every industry except basic metals, other transportation, and pharmaceuticals, with the largest increase of 5.6 percentage points in computers and electronics. But the trends took a sharp turn from 2018 to 2022. Over this period, every industry except pharma declined, with the largest change again in computers and electronics, wherein South Korea’s global market share fell by 1.9 percentage points.
Despite negative trends in its global market share, South Korea overperforms in almost all Hamilton industries in terms of industrial specialization. South Korea’s top industry is computers and electronics, followed by electrical equipment, motor vehicles, chemicals, and machinery and equipment, all of which have an LQ above 2. South Korea only underperforms in IT and information services, where it has an LQ of 0.81. (See figure 71.)
Between 2013 and 2022, South Korea’s LQs increased in four industries: computers and electronics, electrical equipment, machinery and equipment, and pharmaceuticals. Otherwise, most industries experienced declines, although most were moderate. The motor vehicle, chemical, fabricated metals, and IT and information services industries saw their LQs fall by 11 percentage points or less over the previous decade. Overall, South Korea has seen its LQ decline over this same period, falling by 8 percentage points.
Figure 70: South Korea’s global market shares in Hamilton industries, 1995–2022
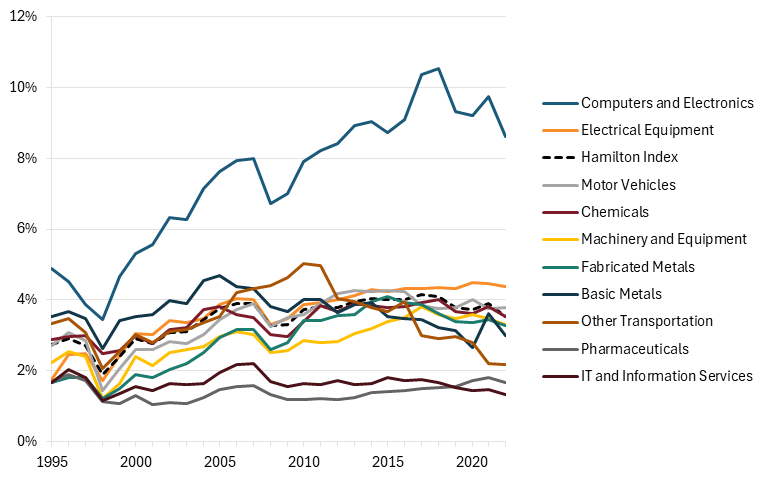
Figure 71: South Korea’s relative performance in Hamilton Index industries (2022 LQ)
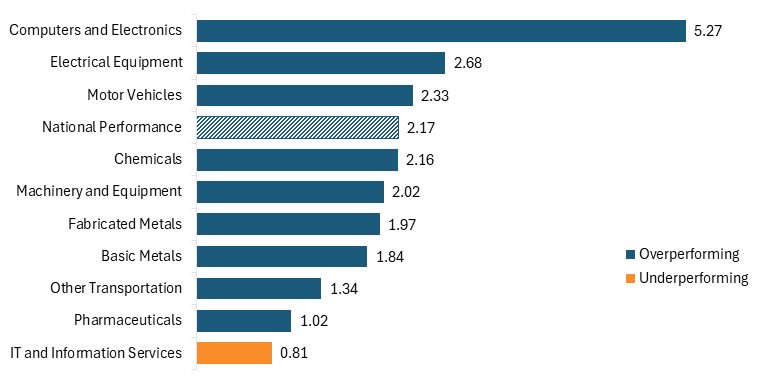
Despite its decline, South Korea is still one of the most specialized nations in the world in advanced industries. With an LQ of 2.17, it is over 100 percent more specialized in advanced industries than would be expected based on the size of its economy.
Figure 72: South Korea’s relative historical performance in Hamilton industries (LQ trends)
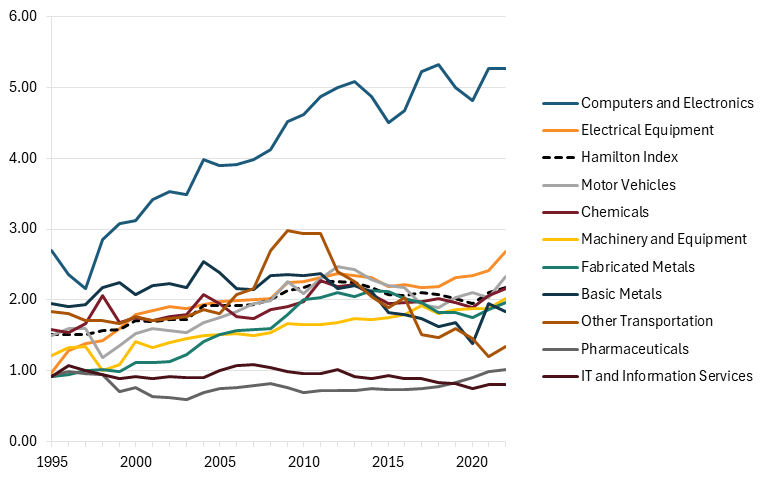
Three of South Korea’s Hamilton Industries can be classified as overperforming and improving, meaning their LQ was above 1 as of 2022, and increased between 2013 and 2022. These industries are located in the top right quadrant of figure 73. Among these industries are two of South Korea’s largest industries: computers and electronics and machinery and equipment. Basic metals, chemicals, motor vehicles, fabricated metals, and other transportation are also in the top left quadrant, meaning they are overperforming, but their LQ has declined since 2013, while IT and information services, the only industry in which South Korea underperforms, is in the bottom left quadrant, demonstrating that South Korea’s output in the industry is not only below average but also regressing.
Figure 73: South Korea’s net performance in Hamilton industries since 2013 (scaled to 2022 output)
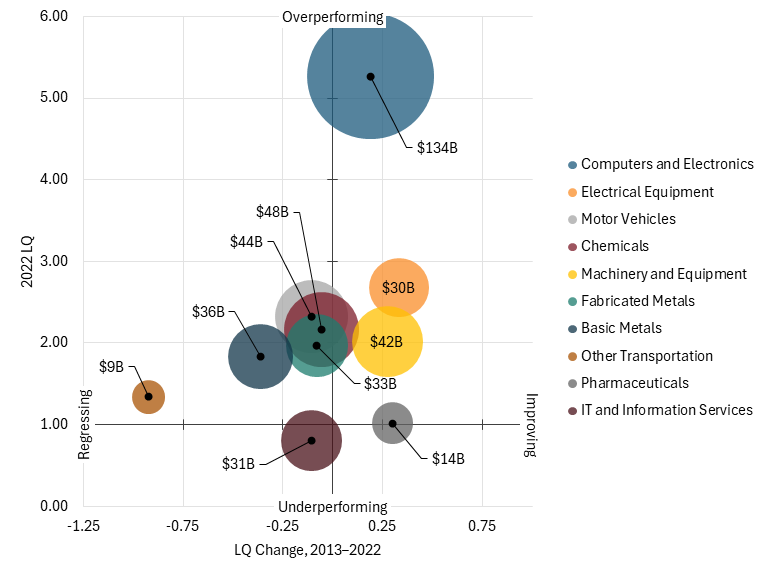
India
India is consistently touted as the next China in terms of industrial production capabilities, but for years, it has failed to meet that high bar. Despite its substantial population, much of which is highly educated, India has failed to become the industrial superstar that policymakers and academics have long expected; instead, it remains a hub for offshored IT services and resource-dependent industries. However, the postulations around India remain, and the nation has shown some progress in recent years toward becoming the industrial giant that it has long wanted to be.
India’s output in advanced industries has increased steadily since 1995, while its global market share has more than tripled, albeit from a low level. As of 2022, India held 3.5 percent of the global market share in advanced industries, up from just 1 percent in 1995. Within India, advanced industries account for 12.3 percent of the national economy, more than the global average of 11.6 percent. (See figure 74.)
Figure 74: Hamilton Index industries’ shares of India’s economy, 1995–2022
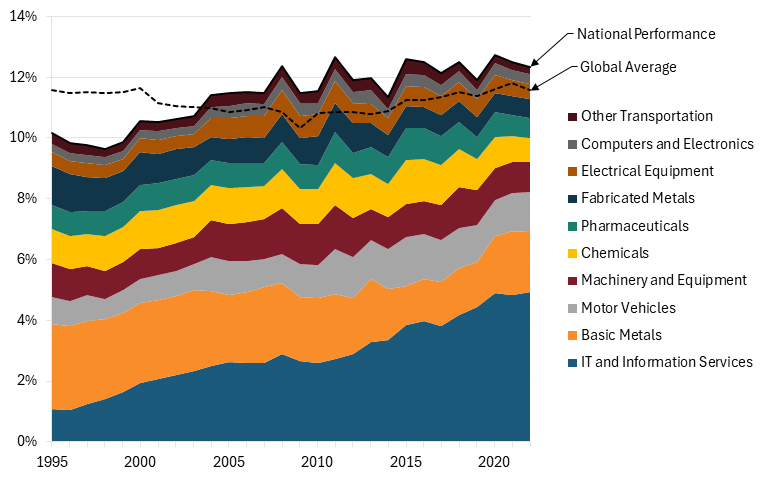
India has also increased its market share in every advanced industry since 1995, with IT and information services seeing the greatest increase of 5.9 percentage points, followed by motor vehicles, basic metals, and electrical equipment. (See figure 75.) Computers and electronics, the industry that includes semiconductors, has experienced the smallest increase (0.8 percentage points). However, given the enormous growth of the global semiconductor industry and the international push to diversify the semiconductor supply chain as Chinese threats to Taiwan’s sovereignty intensify, India looks to be a prime location for greater activity in this industry in the near future.
Figure 75: India’s global market shares in Hamilton industries, 1995–2022
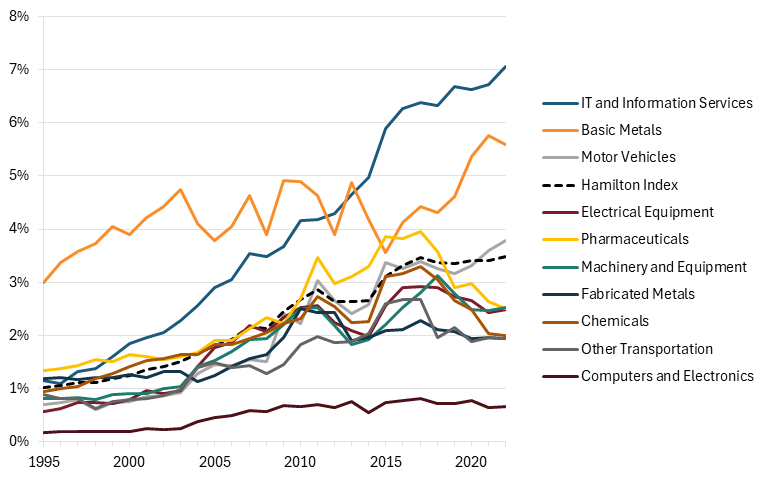
In terms of industry strength, India’s strongest industry is IT and information, where it had an LQ of 2.16 in 2022. India has long been an outsourcing hub for IT services, predominately serving companies headquartered in the United States, Europe, and East Asia. It is also strong in basic metals and motor vehicles, both of which it overperforms in. In contrast, India is below average in the seven other advanced industries, with significant underperformances in fabricated metals, chemicals, other transportation, and computers and electronics, all of which have LQs below 0.65.
Figure 76: India’s relative performance in Hamilton Index industries (2022 LQ)
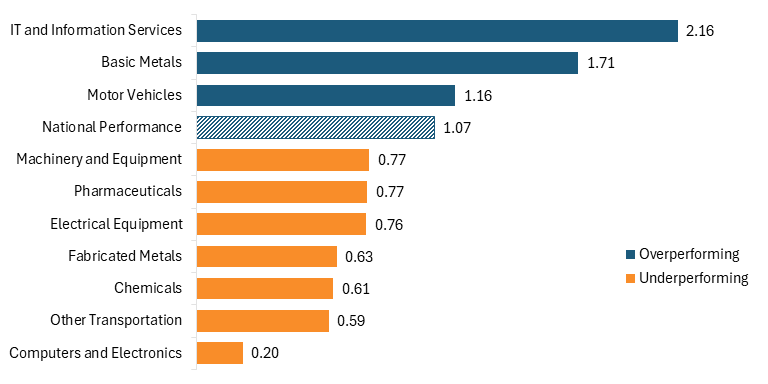
Historically, India’s strongest industry was basic metals, with its LQ peaking at 3.06 in 2003. It then fell decisively below IT and information services in 2014. Between 2013 and 2022, most of India’s industries declined in terms of LQ, with just the IT, motor vehicle, and machinery and equipment industries seeing their LQs increase. Overall, India’s LQ fell 4 percentage points over the past decade.
India has only two industries that both overperformed in 2022 and saw their LQs increase between 2013 and 2022: IT and information services and motor vehicles. These industries are located in the top right quadrant of figure 78. Basic metals, the only other industry in which India overperformed in 2022, saw a decline in LQ, placing it in the top left quadrant. The remainder of India’s industries are in the bottom half of the chart, as they all underperformed in 2022. These are machinery and equipment, pharmaceuticals, electrical equipment, fabricated metals, chemicals, other transportation, and computers and electronics.
India must improve the basics—adequate infrastructure, pro-business policies, business-friendly regulation, IP protections, and a not just highly educated but highly skilled workforce—if it wants to become the alternative to China it has been advertised as for years.
India’s potential as an advanced industry giant is well known and has been for decades, but unlike other countries, which must fight for investment and attention from world-leading countries, India already has their attention; it just needs to give these companies what they want. India must improve the basics—adequate infrastructure, pro-business policies, business-friendly regulation, IP protections, and a not just highly educated but highly skilled workforce—if it wants to become the alternative to China it has been advertised as for years.
Figure 77: India’s relative historical performance in Hamilton industries (LQ trends, 1995–2022)
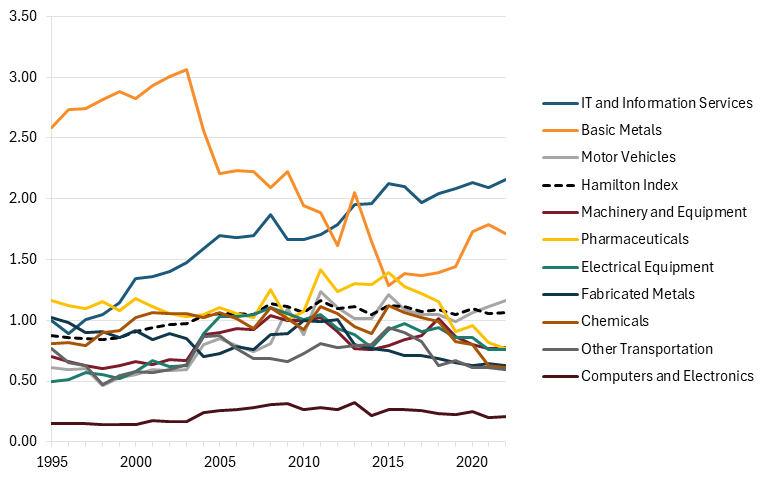
Figure 78: India’s net performance in Hamilton industries since 2013 (scaled to 2022 output)
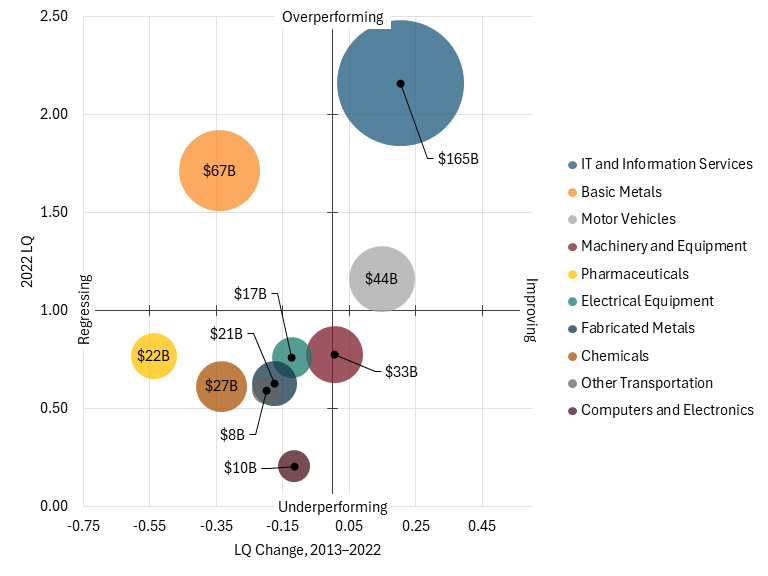
United Kingdom
The United Kingdom was the country that created industrialization, and over the past several decades, it has come to fear it. This fear is evident in the United Kingdom’s advanced industries, which have undergone a long and slow decline, leaving the United Kingdom unable (and frankly unwilling) to compete on the global stage. Like the United States, the United Kingdom’s strongest industry in terms of output is IT and information services, accounting for more than one-third of all advanced industry output in 2022. In fact, IT and info services are the only industry whose output has actually increased relative to the U.K. economy. (See figure 79.) Collectively, advanced industries account for 7.9 percent of the U.K. economy, less than the global average.
The United Kingdom’s global market share in Hamilton industries overall was 2 percent in 2022, down from a high of 4.5 percent in 1998. Additionally, all industries lost market share between 1995 and 2022, with the largest declines in the chemical (3.3 percentage points) and pharmaceutical (3 percentage points) industries. The United Kingdom’s IT and information services industry also lost market share, albeit the least, by 0.8 percentage points. (See figure 80.)
Figure 79: Hamilton Index industries’ shares of the United Kingdom’s economy, 1995–2022
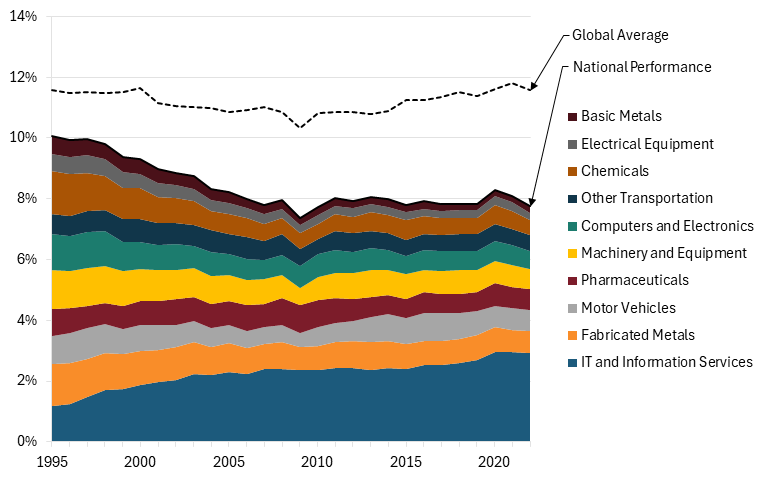
The United Kingdom only performed above average in two industries in 2022: IT and other transportation, with LQs of 1.28 and 1.27, respectively. Its IT sector is a bright spot in the country’s advanced industry ecosystem, driven by the largest fintech sector and the most venture capital funding in Europe. Because of this, the United Kingdom’s software and IT sector has produced more unicorns than has any other European nation and ranks third globally.[15] The United Kingdom’s other transportation industry is also strong, driven by its aerospace sector, which is the second-largest in the world behind the United States’.[16]
Though underperforming across all other industries, the United Kingdom still performs close to average in the pharmaceutical industry, with an LQ of 0.80. The chemical, computers and electronics, electrical equipment, and basic metals industries are the United Kingdom’s weakest, with LQs below 0.4.
Figure 80: The United Kingdom’s global market shares in Hamilton industries, 1995–2022
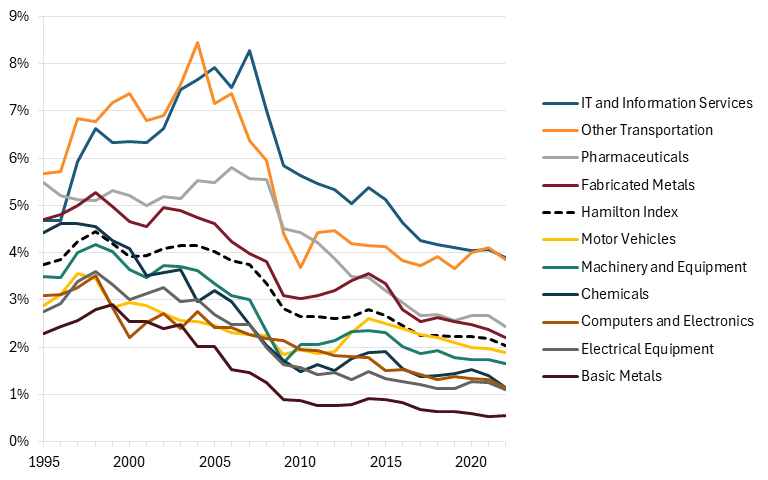
Figure 81: The United Kingdom’s relative performance in Hamilton Index industries (2022 LQ, 1995–2022)
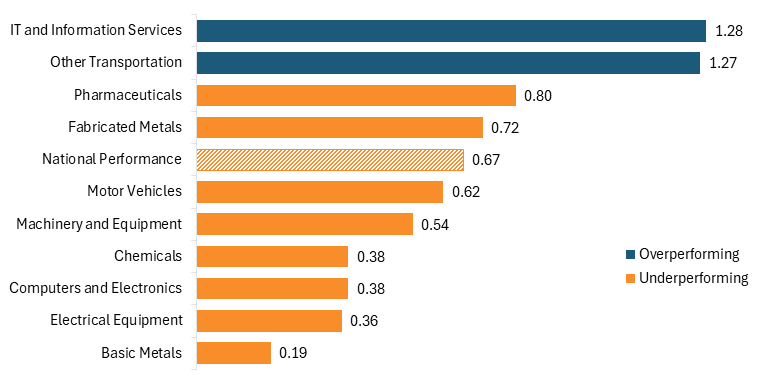
From 2013 through 2022, the LQs for all but one industry declined. That industry, other transportation, saw its LQ increase by 9 percentage points. (See figure 82.) The pharmaceutical industry, traditionally a strong point for the United Kingdom in advanced industries, has faced a steep decline over this period, with its LQ falling by 18 percentage points. In the aggregate, the United Kingdom’s LQ in the Hamilton Index, 0.67, has declined by 7 percentage points since 2013.
Figure 82: The UK’s relative historical performance in Hamilton industries (LQ trends, 1995–2022)
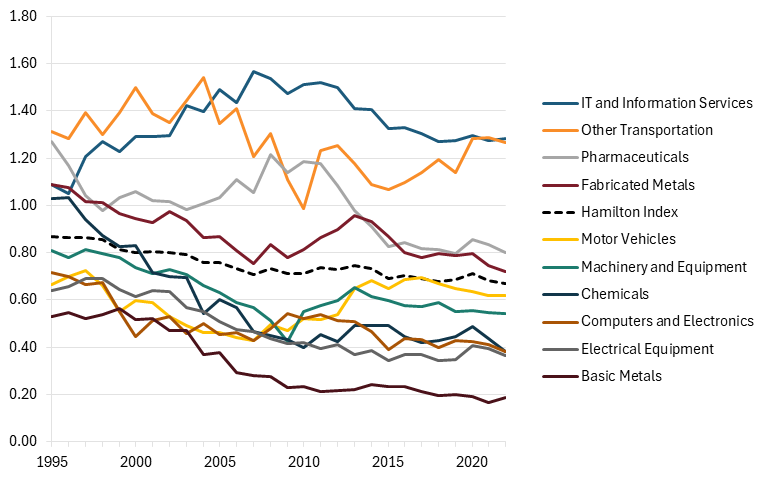
The United Kingdom has gone through a difficult several years in terms of advanced industry development and cultivation, as shown in figure 83. Only one industry was both overperforming in 2022 and has seen its LQ increase since 2013, other transportation, further demonstrating the United Kingdom’s weakness in advanced industries. Almost all other industries are located in the bottom left quadrant, demonstrating that their LQs have both declined and were underperforming in 2022. Fabricated metals, the United Kingdom’s second largest industry in terms of output, is among these industries.
Anti-innovation policies such as the United Kingdom’s Digital Services Tax have made it an unattractive place to do business and have contributed to the 25 percentage-point decline in the its IT and information services LQ.
Perhaps the industry that should be of the greatest concern for the United Kingdom is its IT and information services. The advanced industry, which is the largest in the United Kingdom by a large margin, has seen its LQ fall by 13 percentage points since 2013. The United Kingdom’s recent anti-innovation push in the IT and technology sector is likely behind some of this decline, leading firms to offshore operations away from the United Kingdom. A key example of this anti-innovation policy is the United Kingdom’s Digital Services Tax, passed in April 2020, which places a 2 percent tax rate on social media platforms, Internet search engines, and online marketplaces that derive value from U.K. users. This tax places unnecessary and burdensome costs on large technology companies, with particular penalties for those that have invested heavily in the United Kingdom.[17] Policy measures such as this reduce the United Kingdom’s attractiveness as a place to do business for technology companies and can contribute to a decline in the its LQ.
Figure 83: The United Kingdom’s net performance in Hamilton industries since 2013 (scaled to 2022 output)
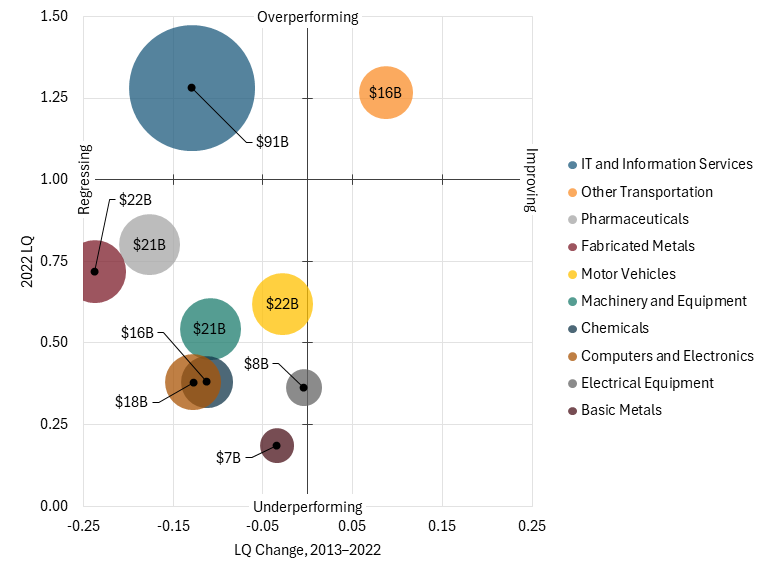
France
France, like the rest of the EU, believes it can regulate itself to success, but the opposite has happened. Success in advanced industries has eluded the French economy for some time, and its global market share has fallen as a result. France’s strongest industry is IT and information services, which accounts for 3.1 percent of its domestic economy. All other industries in the Hamilton index have a relatively small impact on the French economy, accounting for less than 1 percent of GDP. Altogether, advanced industries account for 8.3 percent of the national economy, down from 9.6 percent in 1995. (See figure 84.)
France’s global market share in advanced industries has more than halved since 1995, falling from 4.2 percent to 2 percent, following in the trends of its European neighbors and the EU overall. (See figure 85.) Over this period, every industry in France has declined, losing up to 5.3 percentage points of market share, as has been the case for the IT and information services sector. Other transportation, France’s best industry in terms of global market share (due to the success of Airbus, one of the two largest commercial aircraft manufacturers in the world), has declined the least, falling only 0.3 percentage points—not necessarily something to celebrate.
Figure 84: Hamilton Index industries’ shares of France’s economy, 1995–2022
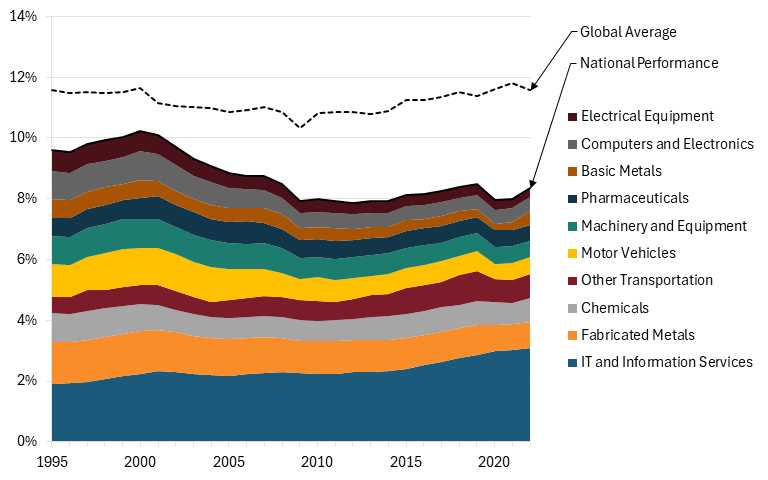
Figure 85: France’s global market shares in Hamilton industries, 1995–2022
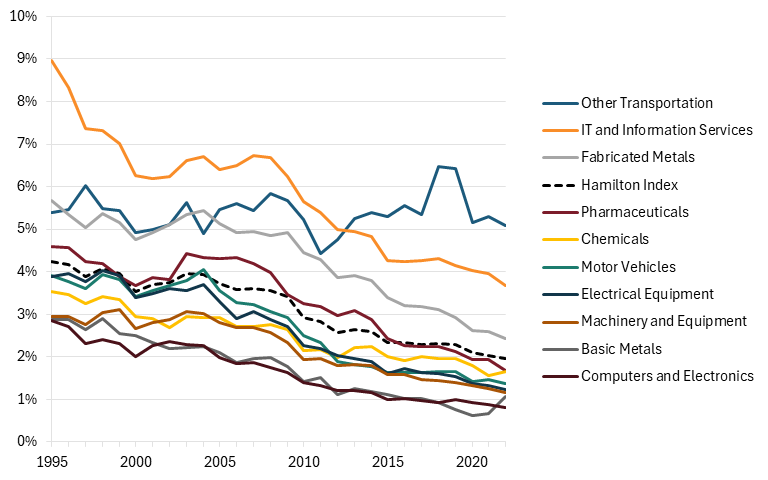
In terms of industry strength, France is above average in only two industries: other transportation and IT and information services. (See figure 86.) It lags behind the most in basic metals and computers and electronics, which have LQs below 0.4.
Figure 86: France’s relative performance in Hamilton Index industries (2022 LQ)
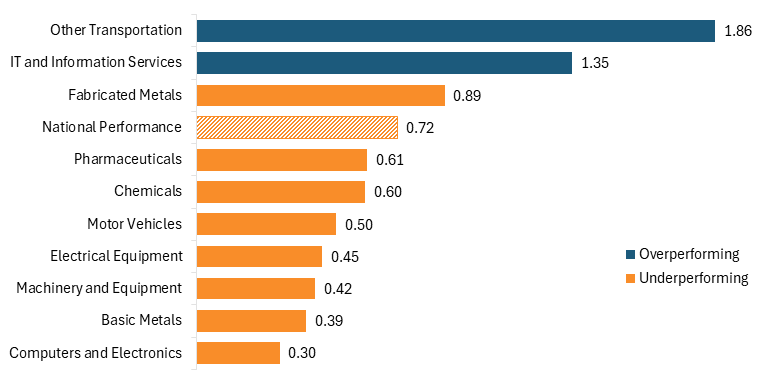
Though its global market share has declined, France’s LQ in other transportation has increased by 40 percentage points since 2013, making it the country’s top advanced industry in terms of industrial specialization. IT and information services, the second-strongest industry, has, conversely, seen its LQ decline by 2 percentage points over this period. However, the industry that has regressed the most is pharmaceuticals, where France’s LQ fell from 0.86 in 2013 to 0.61 in 2022, a 24-point decline.
Figure 88 assesses France’s advanced industries through the size of the industry, the industry’s 2022 LQ, and the change in the industry’s LQ between 2013 and 2022. Other transportation is the only industry that was both overperforming in 2022 and experienced an increase in its LQ. Almost all of France’s other industries, excluding IT and information services and basic metals, fall into the bottom left quadrant of the figure, indicating that they are both underperforming and have declined in the wake of the financial crisis. Excluding fabricated metals, France has failed to overperform in any of those industries since 1995. If France really wants to become a leader in advanced industries, it, along with the rest of the EU, must abandon its strategy of innovating through regulation. Its excessive regulations, including its digital services tax, digital remuneration mandate, and restrictions on cloud services, make operating an advanced industry firm in France unattractive and unaffordable.[18]
Figure 87: France’s relative historical performance in Hamilton industries (LQ trends, 1995–2022)
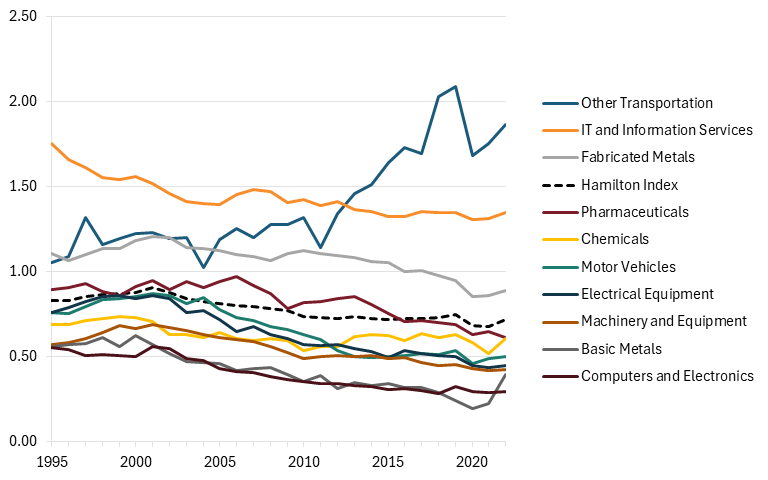
Figure 88: France’s net performance in Hamilton industries since 2013 (scaled to 2022 output)
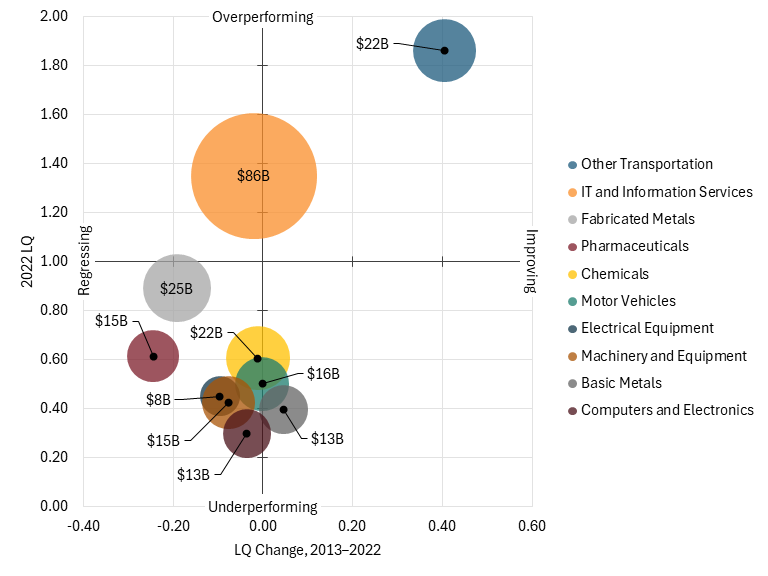
Taiwan
Taiwan is the epitome of a highly specialized nation. The semiconductor giant has the highest LQ in the world, and its lead over China has only grown. Since 2020, Taiwan’s LQ has increased from 2.39 to 2.63, while China’s has decreased from 1.37 to 1.36. However, Taiwan’s formidable industrial strength—especially in computers and electronics—also represents a significant geopolitical vulnerability. Ongoing threats from China to invade Taiwan raise the prospect of severe disruption to the global semiconductor supply chain, with far-reaching consequences for Taiwan’s future economic and industrial trajectory.
To showcase the importance of advanced industries to Taiwan’s economy, one can examine Taiwan’s output of advanced industries relative to its overall economy. In 2022, they accounted for 30.4 percent of Taiwan’s national economy, nearly twice their relative value in 1995. Computers and electronics alone, which includes the semiconductor industry, is equal to 19.5 percent of Taiwan’s domestic economy. (See figure 89.)
Figure 89: Hamilton Index industries’ shares of Taiwan’s economy, 1995–2022
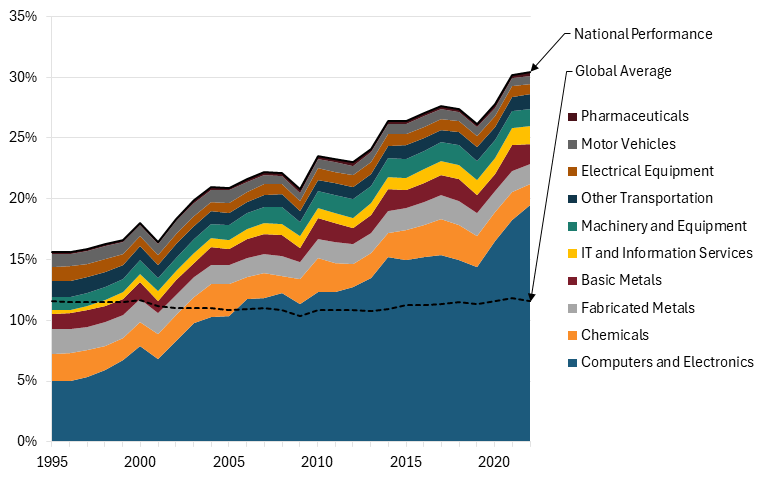
Taiwan’s output in advanced industries is extremely high relative to its economy’s size. However, when considering output in absolute terms, Taiwan’s performance is less outstanding. It holds 2 percent of Hamilton Industries’ global market share, up 0.8 percentage points from 1995. The industry in which it holds the most market share is computers and electronics, where Taiwan holds 9.6 percent, the third most in the world behind China and the United States. Taiwan’s semiconductor industry is primarily driven by TSMC, the the world’s largest advanced chip manufacturer.
Figure 90: Taiwan’s global market shares in Hamilton industries, 1995–2022
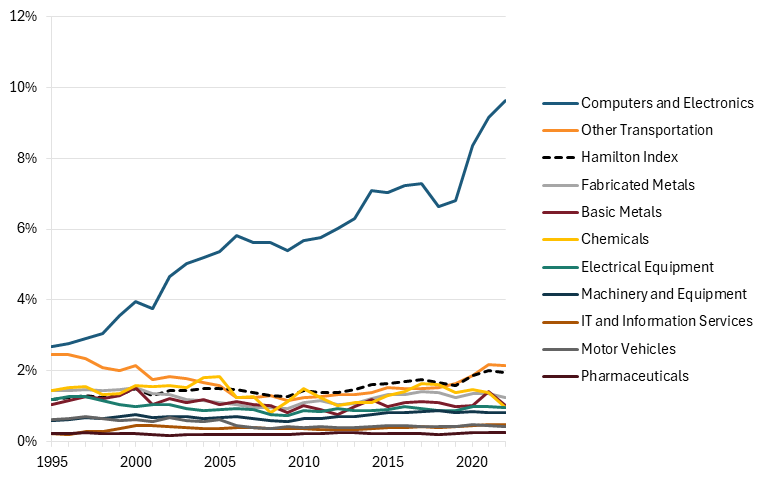
In terms of industry strength, Taiwan is above average in most industries. Its highest LQ is in computers and electronics, at 12.88, meaning Taiwan’s computers and electronics industry has contributed nearly 13 times more to the Taiwanese economy than the global industry contributed to the global economy.
Since 2013, Taiwan’s relative performance in computers and electronics has continued to grow rapidly, rising by 329 percentage points. Other transportation also has experienced a rapid increase in LQ, although significantly smaller in comparison, increasing by 85 percentage points. Aside from these industries, most of Taiwan’s other advanced industries have remained relatively stagnant. Chemicals is the only one of Taiwan’s industries to experience a substantial decline, falling by 38 percentage points between 2013 and 2022.
Figure 91: Taiwan’s relative performance in Hamilton Index industries (2022 LQ)
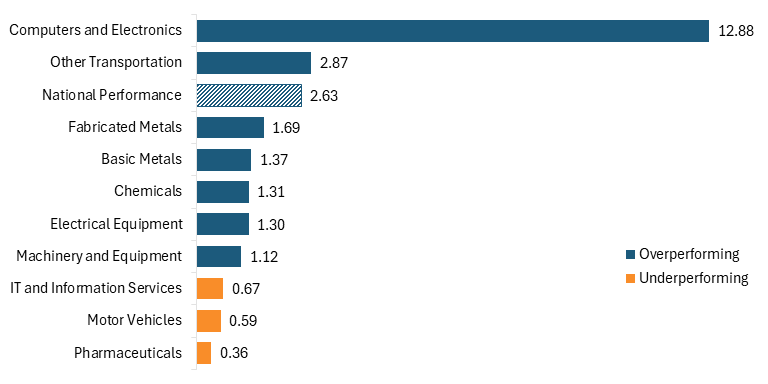
Figure 92: Taiwan’s relative historical performance in Hamilton industries (LQ trends, 1995–2022)
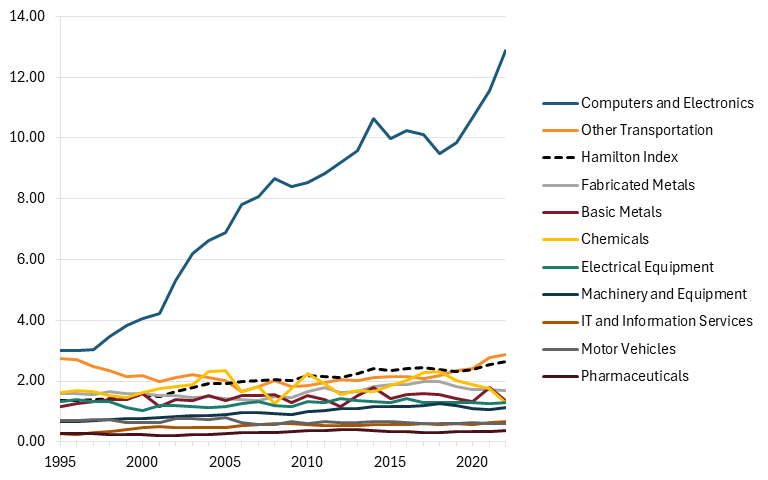
Taiwan has four industries that both experienced an increase in LQ from 2013 to 2022 and overperformed in 2022, placing them in the top right quadrant of figure 93. Of these, computers and electronics is the obvious outlier, with its LQ more than four times larger than the next closest industry (other transportation). Other industries in that quadrant are fabricated metals and machinery and equipment. The basic metals, chemicals, and electrical equipment industries fall in the top left quadrant because they overperformed in 2022 and their LQ declined between 2013 and 2022. Finally, the motor vehicles and pharmaceutical industries are in the bottom left quadrant, as they underperformed in 2022 and saw their LQs decline, while the IT and information services sector, which underperformed in 2022 but saw its LQ increase, is in the bottom right quadrant.
Figure 93: Taiwan’s net performance in Hamilton industries since 2013 (scaled to 2022 output)
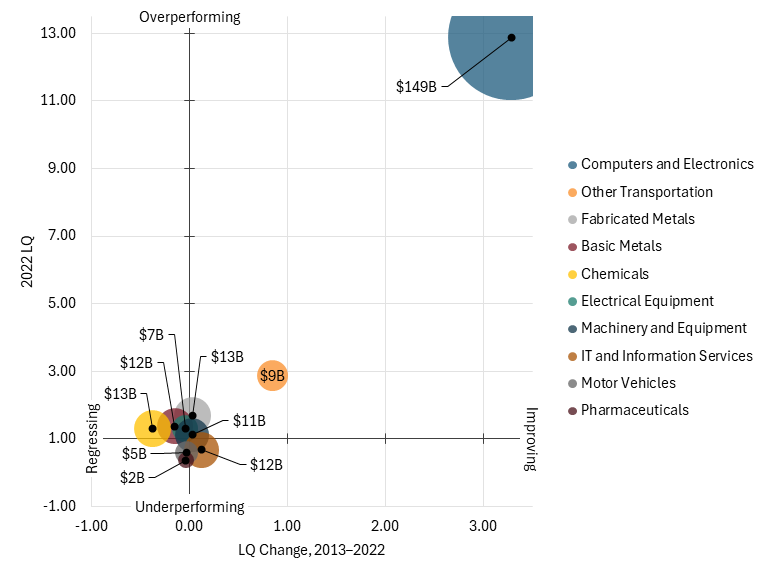
Italy
Italy remains a major manufacturing economy, with longstanding strengths in machinery and metals manufacturing. However, its advanced manufacturing base has failed to generate much growth over the past several years and, as such, has seen its output stagnate. Since 2008, Italy has failed to meaningfully increase output in its advanced industries, and its global market share has fallen as a result.
In Italy’s economy, advanced industries consistently made up 10 to 11 percent of domestic output between 1995 and 2022. Machinery and equipment, fabricated metals, and IT and information services were the three largest advanced industries in the economy, accounting for about 2 percent of domestic output each. (See figure 94.)
After experiencing a boost in output and market share in the early to mid-2000s, most of Italy’s advanced industries have taken a severe hit. Its fabricated metals industry, which held over 7 percent of the global market as recently as 2008, fell to just 4.2 percent in 2022 (figure 95). Similarly, its machinery and equipment industry, which used to control about 6 percent of the global market in the mid-2000s, now controls just 3.6 percent. Overall, Italy’s global market share in advanced industries fell from a high of 3.7 percent in 2004 to 1.9 percent in 2022.
Figure 94: Hamilton Index industries’ shares of Italy’s economy, 1995–2022
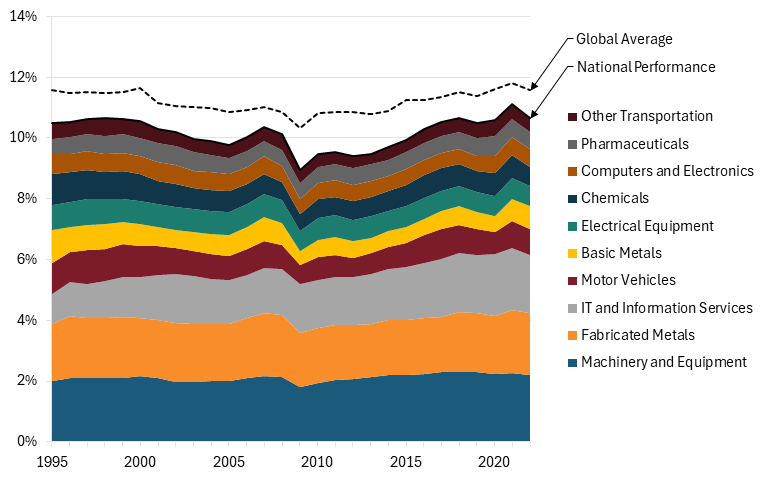
Figure 95: Italy’s global market shares in Hamilton industries, 1995–2022
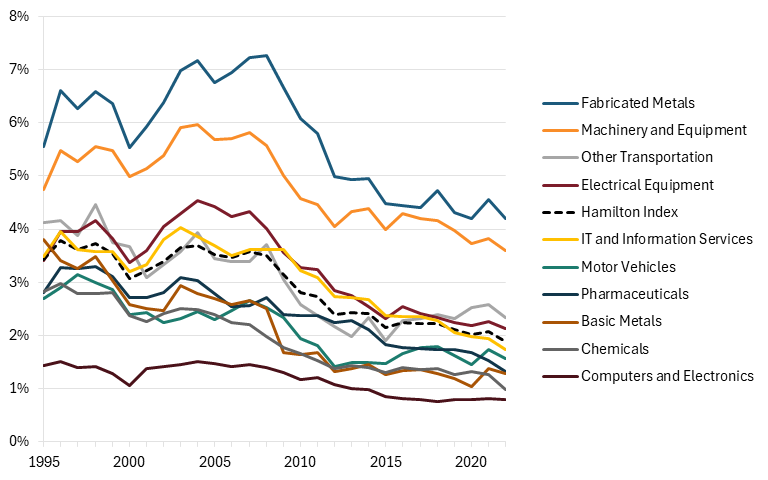
Looking at industrial specialization, Italy is above average in four industries: fabricated metals, machinery and equipment, other transportation, and electrical equipment. (See figure 96.)
Figure 96: Italy’s relative performance in Hamilton Index industries (2022 LQ)
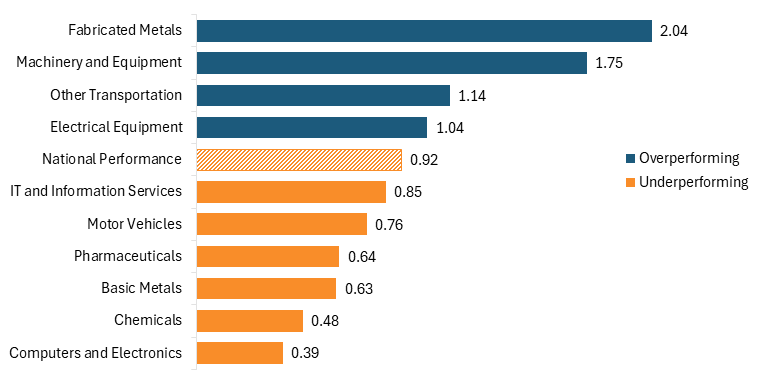
In contrast to its global market share, Italy has seen its LQs increase in many of its largest industries since 2013. Italy’s LQ in the fabricated metals industry increased by 26 percentage points, while in Italy’s second largest industry, machinery and equipment, it increased by 18 percentage points.
Figure 97: Italy’s relative historical performance in Hamilton industries (LQ trends, 1995–2022)
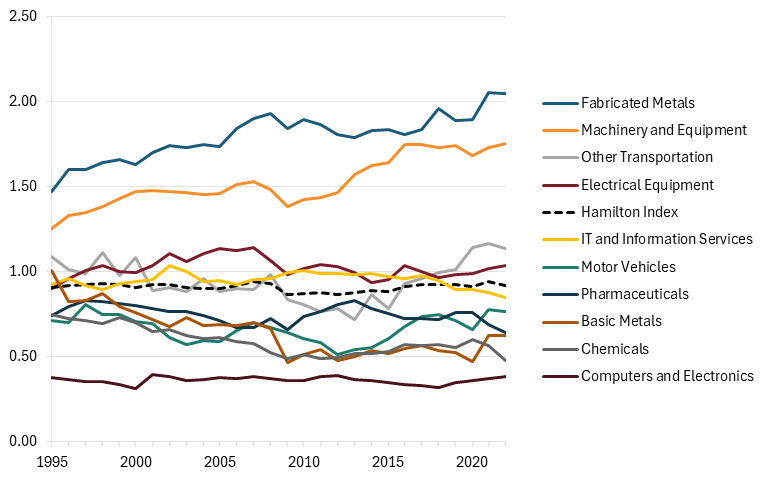
Four of Italy’s advanced industries saw their LQs increase between 2013 and 2022 and overperform in 2022, demonstrating a strong and growing industrial specialization in fabricated metals, machinery and equipment, electrical equipment, and other transportation. These industries are located in the top right quadrant of figure 98. Conversely, three industries saw their LQs decline over this period and underperform in 2022, placing them in the bottom left quadrant.
Figure 98: Italy’s net performance in Hamilton industries since 2013 (scaled to 2022 output)
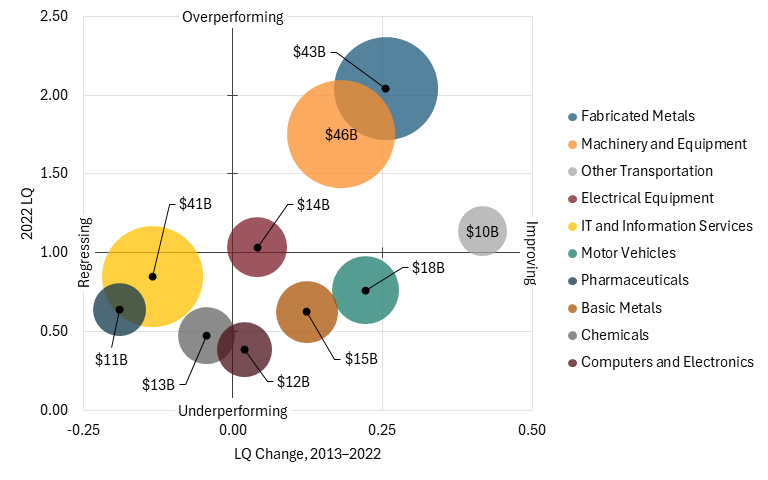
Other Producers
Although the following countries are not among the top 10 global producers, they represent important trade partners, specialized manufacturers, and rapidly developing nations with key roles to play in the global advanced industry ecosystem. The following section examines Canada, Mexico, and Vietnam.
Canada
Canada is the United States’ closest trading partner, but its economy relies on natural resources rather than advanced industries. Canada has, in fact, consistently underperformed relative to the world and continues to lose ground. Between 1995 and 2022, the value of advanced industries as a share of the total Canadian economy declined from 10 percent to just 6.9 percent. Motor vehicles, once Canada’s strongest industry, is now the country’s sixth largest in terms of output. (See figure 99.)
Figure 99: Hamilton Index industries’ shares of Canada’s economy, 1995–2022
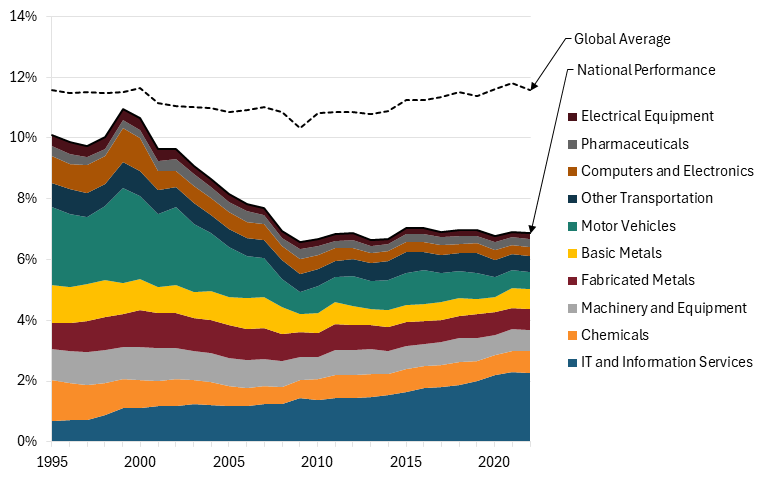
Canada’s global market share in almost every advanced industry declined between 1995 and 2022, with the largest occurring in the motor vehicle industry. Canada had the fifth-highest share of the global motor vehicle market in 1995, at 3.5 percent, but as the integration of the North American economy deepened through the North American Free Trade Agreement (NAFTA), more manufacturing moved to Mexico, and the Canadian auto industry weakened. By 2007, Canada’s global market share had dropped to 2.5 percent, while Mexico’s had increased to 3.5 percent. By 2022, Canada held just 1 percent of the global market, while Mexico held 5.6 percent.
The only industry in which Canada’s global market share meaningfully increased was the IT and information services industry, which gained 0.9 percentage points of global market share between 1995 and 2022.
Figure 100: Canada’s global market shares in Hamilton Industries, 1995–2022
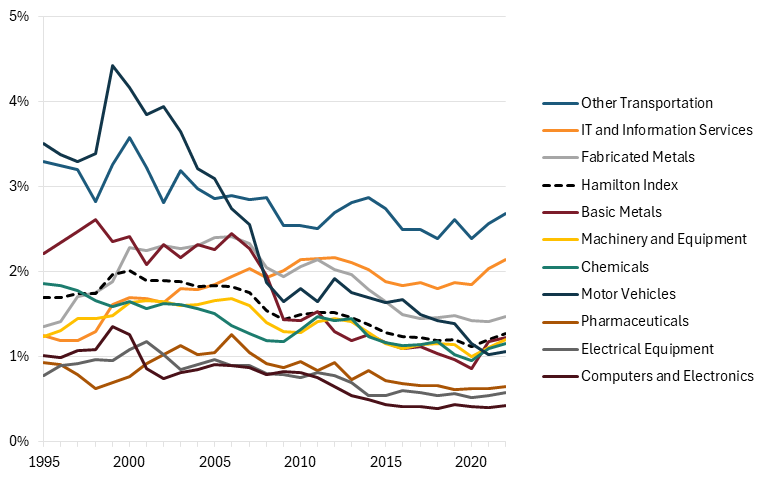
Canada had the fifth-highest share of the global motor vehicle market in 1995, but as the integration of the North American economy deepened through NAFTA, more manufacturing moved to Mexico, and the Canadian auto industry weakened.
In terms of industrial specialization, Canada is above average in only one industry, other transportation, with an LQ of 1.25, likely due to the strength of the Canadian plane manufacturer Bombardier. (See figure 101.) Canada is barely below average in IT and information services, although it has demonstrated that it is willing to follow in the footsteps of European countries in regulating itself away from success in this industry. Although Canada’s digital services tax was rescinded in 2025 under pressure from the Trump administration, Canada has imposed a series of other detrimental digital policies, including a digital remuneration mandate and cross-border data transfer regulations.[19]
Figure 101: Canada’s relative performance in Hamilton Index industries (2022 LQ)
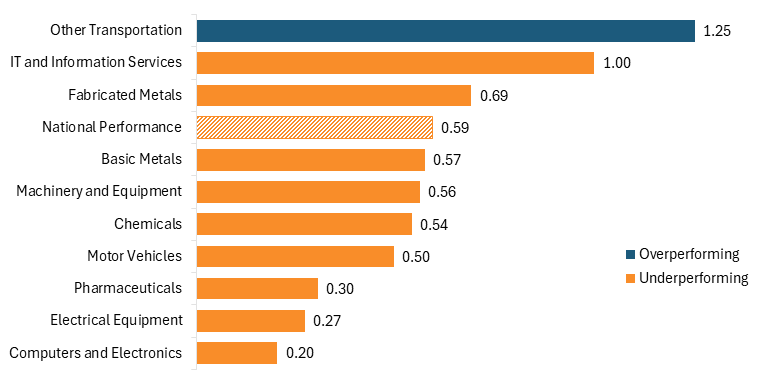
Since 2013, few Canadian industries—IT and information services, other transportation, and basic metals—have increased their LQ (figure 102). Other transportation and IT and information services are the only two industries in Canada that have both overperformed and improved over the previous decade. Most other industries are in the bottom left quadrant of figure 103, indicating that they underperform and their LQs have declined.
Figure 102: Canada’s relative historical performance in Hamilton industries (LQ trends, 1995–2022)
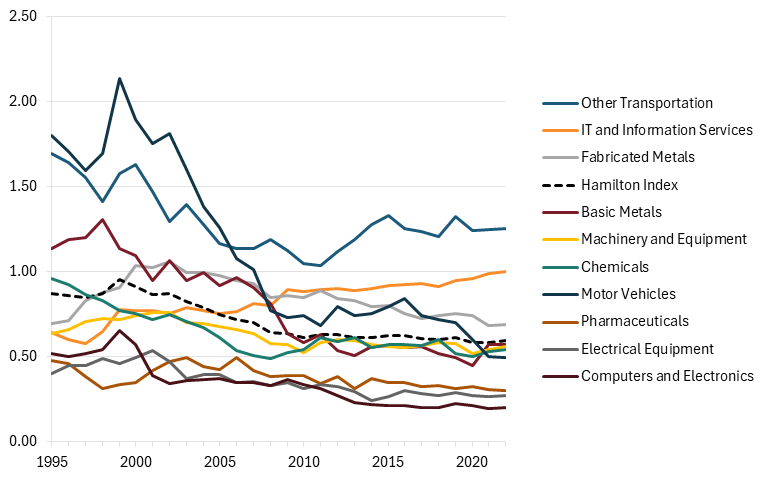
Figure 103: Canada’s net performance in Hamilton industries since 2013 (scaled to 2022 output)
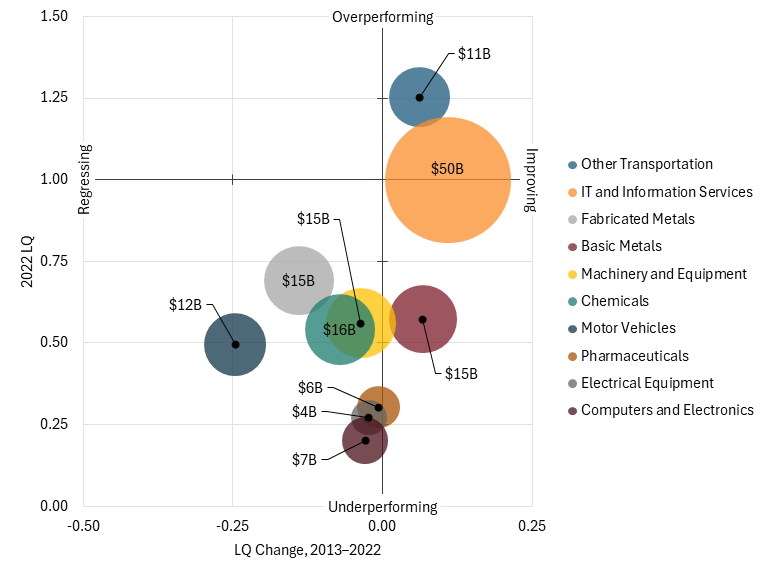
Mexico
Mexico has continued to show its capabilities as having an advanced industrial economy. Although it is highly reliant on its motor vehicle industry, Mexico overperforms in several advanced industries and has continued to increase its LQ, albeit gradually, since the mid-2000s. Its overall LQ of 1.05 in 2022 puts it ahead of the United States, France, the United Kingdom, and Canada, and just slightly behind India.
Advanced industries accounted for about 12.2 percent of Mexico’s economy in 2022, higher than the global average. (See figure 104.) Motor vehicles were the largest industry, accounting for 4.4 percent of the broader economy (the largest of any economy in the world), followed by the computer and electronics industry with 1.8 percent. Mexico has become a hub for offshore manufacturing over the past two decades due to its low labor costs, attracting firms such as Ford, Toyota, and Apple. However, Mexico has few of its own major firms, with no major international electronics or automobile companies headquartered there.
Figure 104: Hamilton Index industries’ shares of Mexico’s economy, 1995–2022
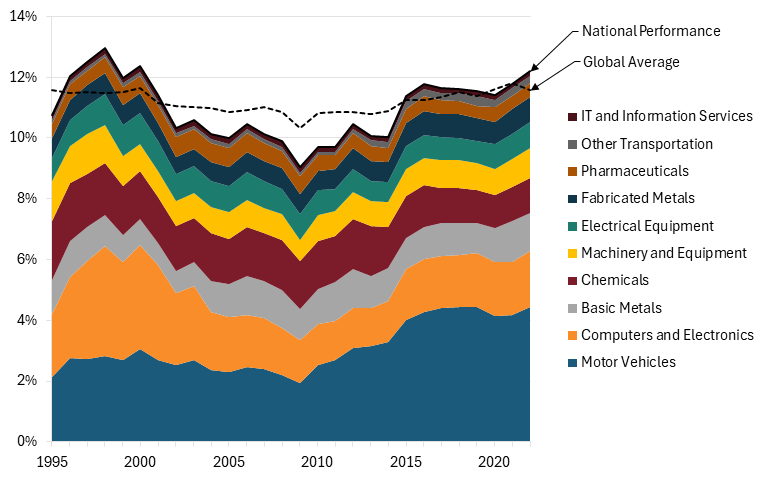
Mexico was the fifth-largest motor vehicle manufacturer in the world by value-added output as of 2022, with 5.6 percent of global market share, up 3.8 percentage points since 1995. (See figure 105.) This is by far Mexico’s strongest industry and the one that has grown the most due to NAFTA, which has led to the relocation of production from the United States and Canada. All other industries either lost market share or saw it increase by less than 1 percentage point. The chemicals, pharmaceuticals, and IT and information services industries lost global market share over this period, while all other industries increased their market share.
In terms of industrial strength, Mexico is above average in four industries: motor vehicles, electrical equipment, computers and electronics, and basic metals. (See figure 106.) Conversely, Mexico is below average in all other industries. Pharmaceuticals and IT are the worst-performing industries, with LQs of only 0.54 and 0.07, respectively.
Figure 105: Mexico’s global market shares in Hamilton Industries, 1995–2022
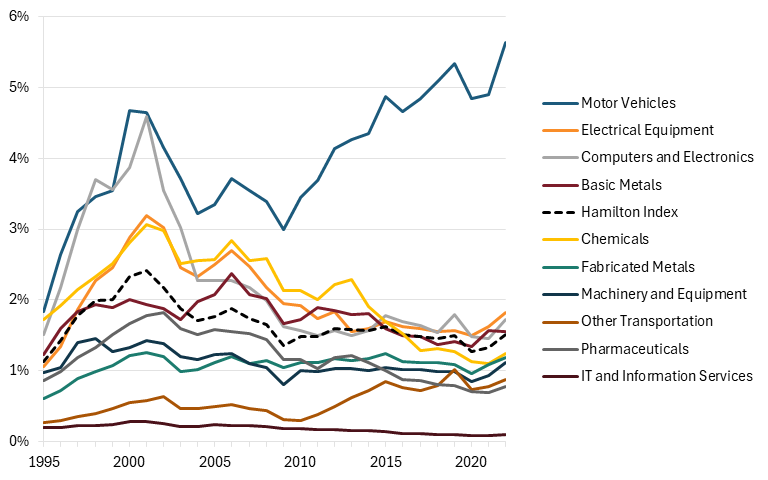
Figure 106: Mexico’s relative performance in Hamilton Index industries (2022 LQ)
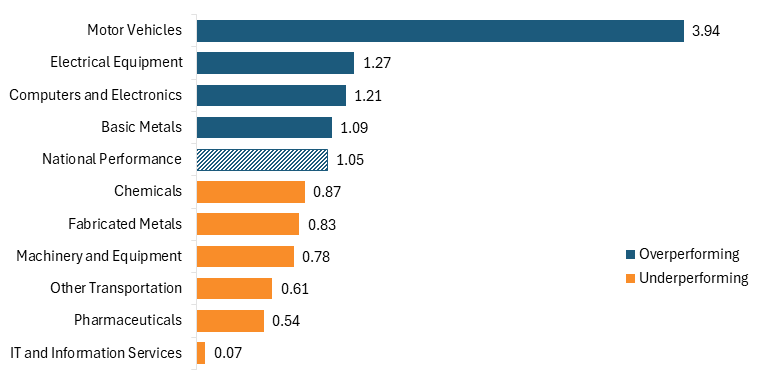
The industry with the largest growth in LQ was also motor vehicles, which saw its LQ increase from 2.51 in 2013 to 3.94 in 2022. Three of Mexico’s other advanced industries—electrical equipment, computers and electronics, and basic metals—saw their LQs increase and overperform, placing them in the top-right quadrant. (See figure 108.). Conversely, chemicals, pharmaceuticals, and IT both underperformed and saw their LQs decline over this same period, placing them in the bottom left quadrant of the figure.
Figure 107: Mexico’s relative historical performance in Hamilton industries (LQ trends, 1995–2022)
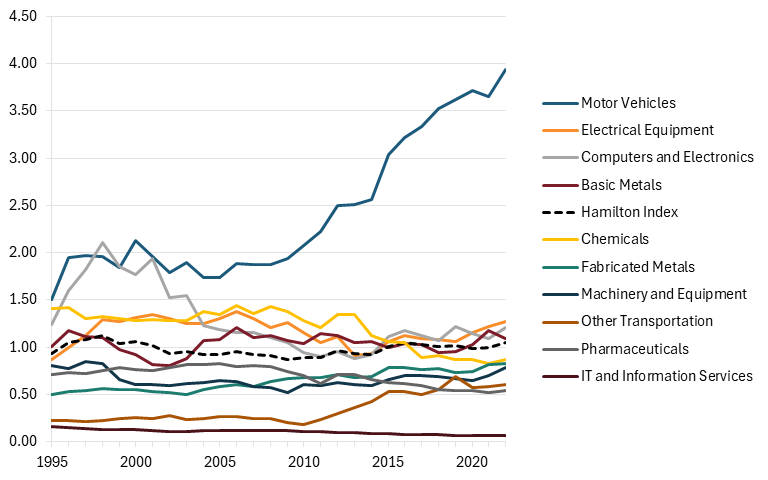
Figure 108: Mexico’s net performance in Hamilton industries since 2013 (scaled to 2022 output)
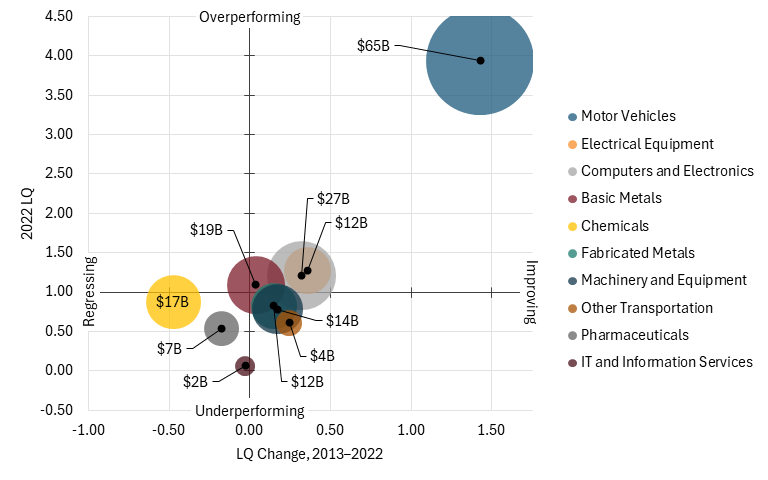
Vietnam
Vietnam’s emergence as a hub for advanced manufacturing, particularly in computers and electronics, is the result of a deliberate, multidecade strategy to court foreign direct investment and integrate into global supply chains. Specifically, Vietnam has attracted investment from some of the largest computer and electronics firms in the world, including Samsung, Intel, and LG. Samsung specifically has transformed the Vietnamese economy, making it its largest global production base for smartphones.[20]
Vietnam has also benefited significantly from China’s economic development, as rising operating costs in Chinese cities have driven a large share of manufacturing to cheaper countries in Southeast Asia, including Vietnam.
Computer and electronics manufacturing alone accounts for over 13 percent of the Vietnamese economy, while advanced industries collectively account for 21.1 percent of economic output. (See figure 109.) This is nearly double the global average.
Vietnam’s global market share in the computers and electronics manufacturing industry was relatively stagnant for the late 1990s and the first half of the 2000s, hovering around 0.1 percent. However, by 2012, its share had increased to over 1 percent, and 10 years later, Vietnam held 3.5 percent of the global market share in the industry. Its next-largest industry, electrical equipment, is comparatively small, accounting for just 0.9 percent of the global market. (See figure 110.)
Figure 109: Hamilton Index industries’ shares of Vietnam’s economy, 1995–2022
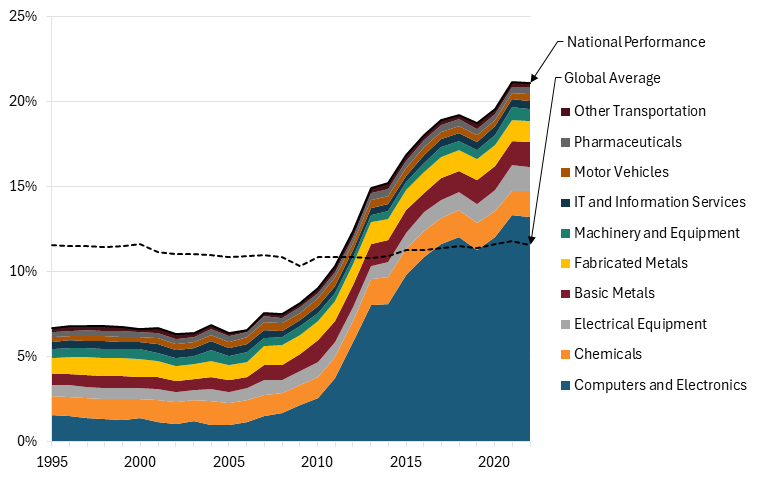
Figure 110: Vietnam’s global market shares in Hamilton Industries, 1995–2022
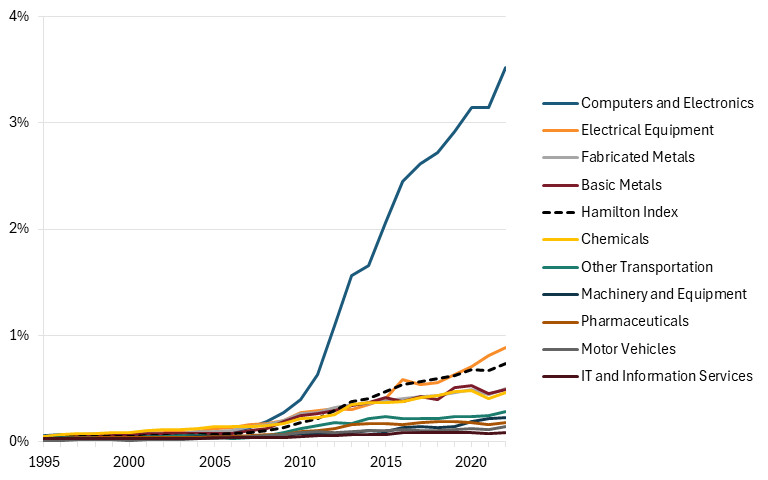
Looking at industrial specialization, Vietnam performs above average in five industries: computers and electronics, electrical equipment, fabricated metals, basic metals, and chemicals. (See figure 111.) Its LQ in computers and electronics, 8.73, is the second highest in the world, behind Taiwan, a semiconductor manufacturing giant. Conversely, Vietnam lags behind in pharmaceuticals, motor vehicles, and IT and information services, all of which have LQs below 0.5.
Figure 111: Vietnam’s relative performance in Hamilton Index industries (2022 LQ)
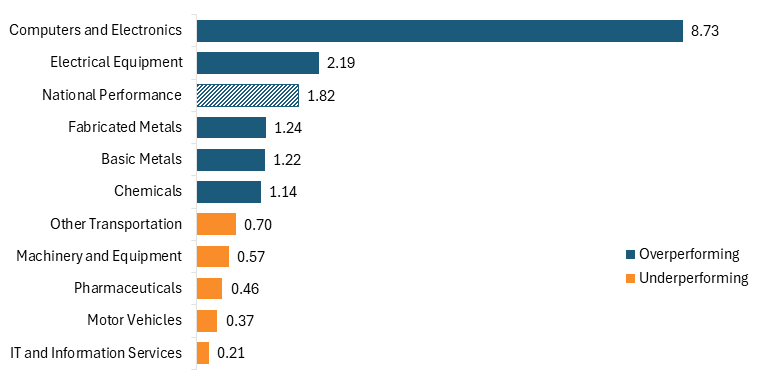
Similar to global market share, the industry that has experienced the greatest growth in LQ is computers and electronics, which saw its LQ increase from 5.71 in 2013 to 8.73 in 2022. Vietnam’s overall LQ also increased rapidly over this time, from 1.38 in 2013 to 1.82 in 2022. (See figure 112.)
Figure 112: Vietnam’s relative historical performance in Hamilton industries (LQ trends, 1995–2022)
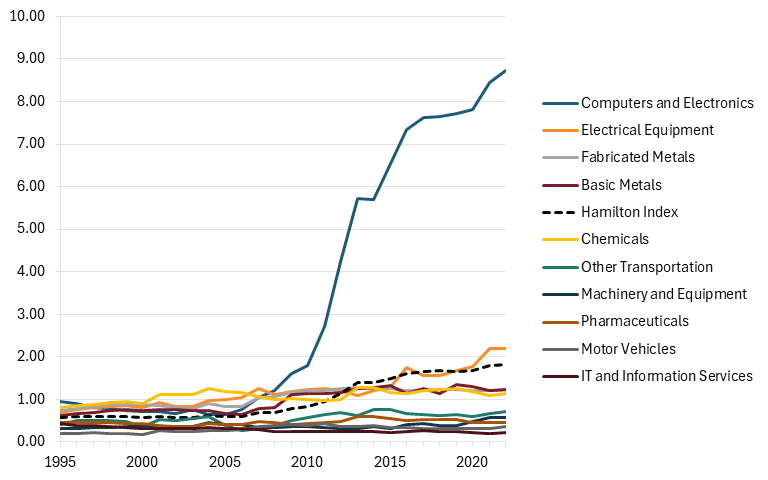
Computers and electronics along with electrical equipment are the only two industries that have seen their LQs increase over the past decade and overperform in 2022 in Vietnam, placing them in the top right quadrant of figure 113. Conversely, three of Vietnam’s advanced industries—pharmaceuticals, motor vehicles, and IT and information services—underperform and have seen their LQs decline. These industries are located in the bottom left quadrant of the figure.
Figure 113: Vietnam’s net performance in Hamilton industries since 2013 (scaled to 2022 output)
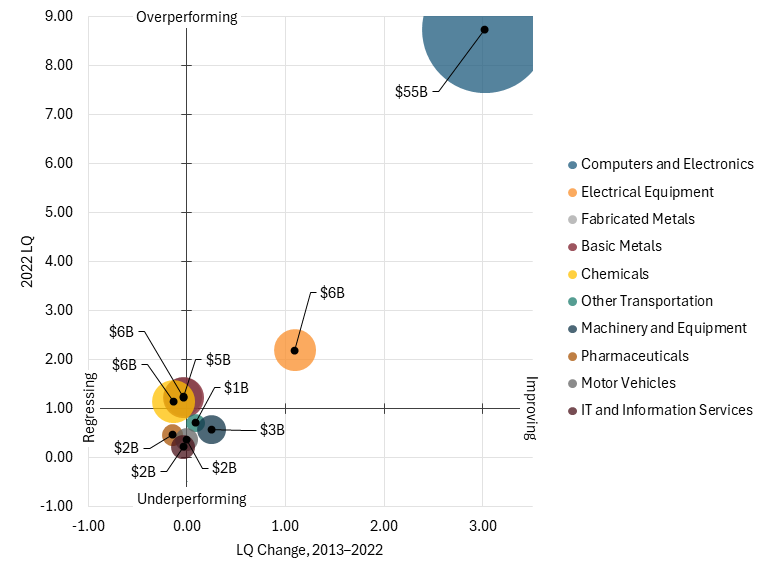
Select Regional Groupings
EU-17
The EU-17 (countries that were EU members prior to 2004) have consistently underperformed in advanced industries compared with the rest of the world and even the EU as a whole. Its overall LQ was 0.83 in 2022, the exact same as in 1995 and only a slight decline from its high of 0.86 in 2017, demonstrating a continued mediocrity among some of Europe’s most developed nations. Advanced industries constitute only 9.7 percent of the EU-17’s economy, below the global average of 11.6 percent.
Figure 114: Hamilton Index industries’ share of EU-17 economies, 1995–2022
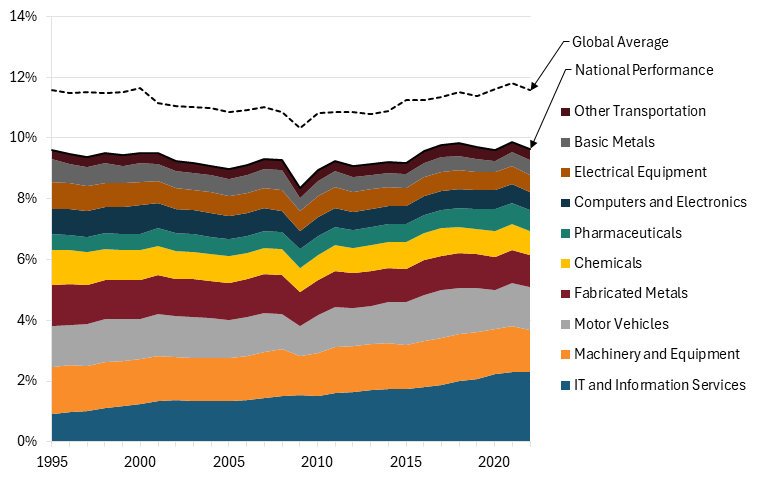
Looking at industry strength, the EU-17 is above average in four industries. (See figure 115.) Driven by Germany, the strongest industry in the EU-17 is motor vehicles, with an LQ of 1.24. Machinery and equipment and fabricated metals are next at 1.12 and 1.07, respectively, followed by the IT and information services sector, which has suffered from protectionist policies in the EU designed to promote “digital sovereignty.” In contrast, the EU-17 is below average in all other advanced industries, with basic metals and computers and electronics being the worst-performing industries.
The EU-17’s overall LQ was 0.83 in 2022, the same as in 1995 and only a slight decline from its high of 0.86 in 2017, showing a continued mediocrity among some of Europe’s most developed nations.
The EU-17 has three industries that both overperformed in 2022 and improved between 2013 and 2022: motor vehicles, machinery and equipment, and other transportation. Motor vehicles experienced the greatest increase of 23 percentage points. The EU-17 overperformed in fabricated metals in 2022 but saw its LQ decline by 10 percentage points.
Five of the EU-17’s advanced industries underperformed and declined between 2013 and 2022. These industries include electrical equipment, pharmaceuticals, chemicals, basic metals, and computers and electronics.
Figure 115: EU-17’s relative historical performance in Hamilton industries, 1995–2022
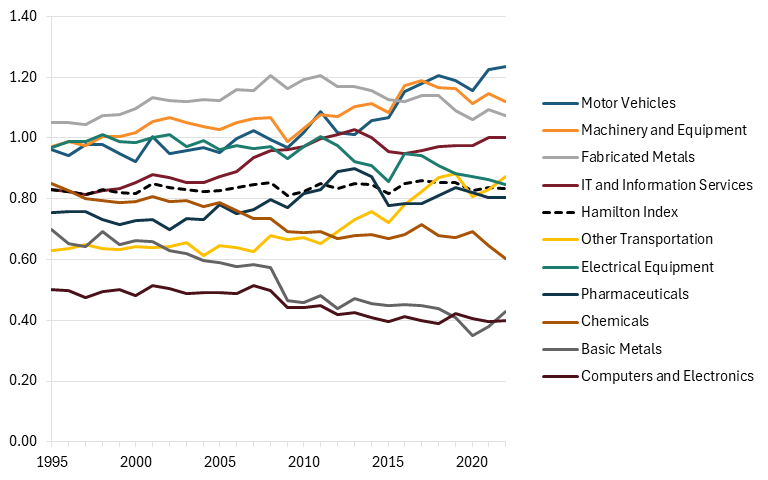
EU-10
The EU-10 (which includes EU members that joined in 2004) previously underperformed relative to the world and to the EU-17. However, it saw significant and sustained improvement between 1995 and 2022. In 1995, its LQ was 0.74, but it increased steadily over the next 27 years, reaching a peak of 1.12 in 2016 before falling slightly to 1.09 in 2022. Still, this is greater than the LQ of the EU-17 and the LQ of the EU-27 (the whole EU excluding Ireland), which stands at 1.02. The EU 10 nations have been able to combine integration into the EU with relatively low business costs and strong workforce skills to gain an advantage in advanced industries. The largest industry for the EU-10 is the IT and information service industry, which accounts for 3.2 percent of the EU-10’s economy. (See figure 116.)
Looking at industrial specialization, the EU-10 is above average in four industries. Its strongest industry is the fabricated metals industry, in which it has an LQ of 2.11, followed by the motor vehicles, electrical equipment, and IT and information services industries, which have LQs of 1.91, 1.78, and 1.40, respectively. In contrast, the EU-10 has failed to get a foothold in the other advanced industries, specifically basic metals and computers and electronics, which both have LQs below 0.5.
Figure 116: Hamilton Index industries’ share of EU-10 economies, 1995–2022
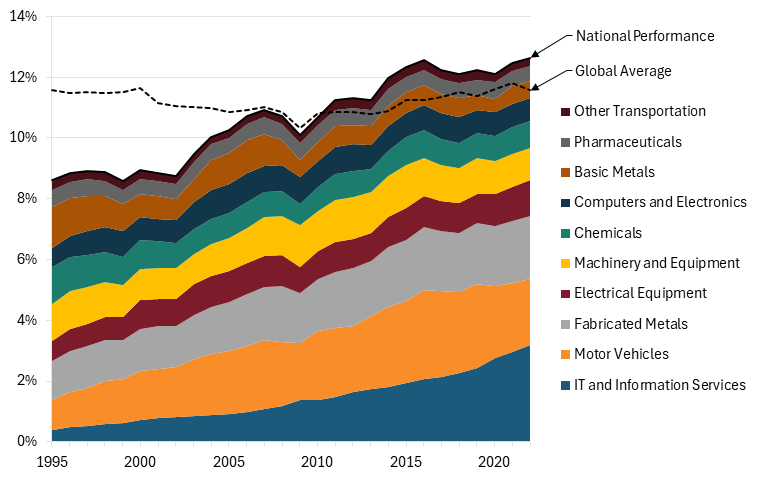
Three industries in the EU-10 both overperformed in 2022 and improved in their LQ between 2013 and 2022: fabricated metals, electrical equipment, and IT and information services. Electrical equipment experienced the greatest increase, with its LQ growing by 45 percentage points. The EU-10 also overperformed in the motor vehicles industry, but its LQ declined by 2 percentage points over the past decade. Meanwhile, two industries—other transportation and chemicals—underperformed in 2022 but improved on their LQ since 2013. All other industries underperformed and saw their LQ decline.
Figure 117: EU-10’s relative historical performance in Hamilton industries, 1995–2022
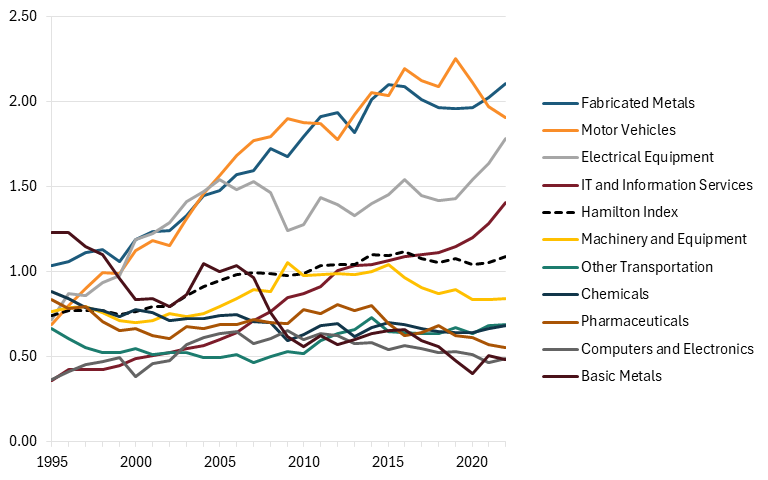
The Commonwealth
The Commonwealth countries of Australia, Canada, New Zealand, and the United Kingdom have consistently underperformed in advanced industries and have only continued to lose ground. The Commonwealth’s overall LQ fell from 0.83 in 1995 to 0.58 in 2022, putting the group behind the EU, OECD, the Belt and Road, and the Quad. None of these countries has pushed to adopt a national industry strategy, relying instead on the invisible hand of neoclassical economics to drive them toward the industries that will promote the most economic prosperity. This, of course, has not driven any of these countries toward industrially strong economies.
The largest advanced industry in the Commonwealth is IT and information services, which accounts for 37 percent of all advanced industry output in these countries. It also accounts for 2.5 percent of the Commonwealth’s GDP. (See figure 118.)
Figure 118: Hamilton Index industries’ share of Commonwealth economies, 1995–2022
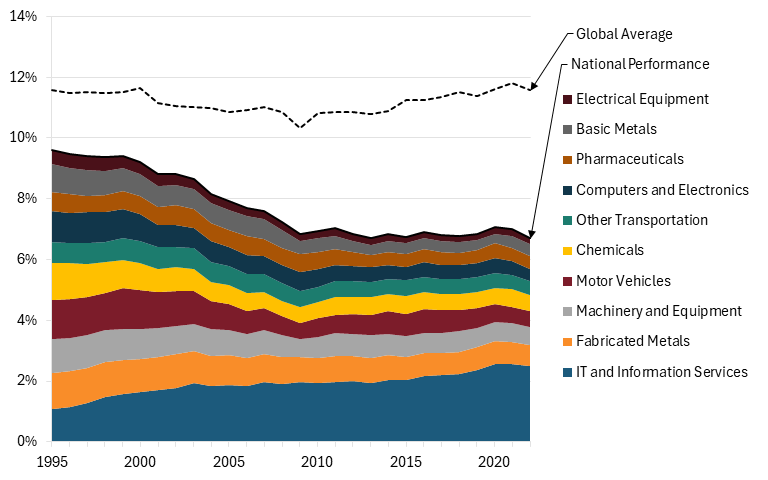
In terms of industry strength, the Commonwealth is above average in only two industries—other transportation and IT services—both of which have an LQ of 1.09. (See figure 119.) Conversely, all other industries are below average. Electrical equipment and computers and electronics are the two weakest industries, each of which have LQs below 0.3.
Looking at the previous 10 years, it’s evident that the Commonwealth has been in a state of decline. Nine advanced industries saw their LQs decline between 2013 and 2022, with the largest drop in the fabricated metals industry. That LQ fell by 16 percentage points. This is not to say that advanced industries in the Commonwealth are not growing in absolute terms, but rather that they are not growing as fast as the overall Commonwealth economy. Only the other transportation industry has seen its LQ increase since 2013.
Figure 119: Commonwealth nations’ relative historical performance in Hamilton industries, 1995–2022
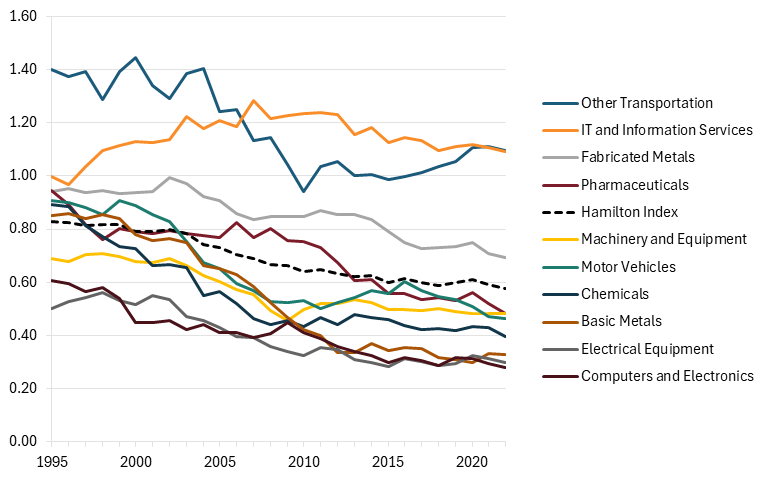
The Quad
The Quad (which includes Australia, India, Japan, and the United States) overperformed in advanced industries between 1995 and 2012, but has since underperformed, with its LQ falling to an all-time low of 0.93 in 2022. This LQ is above that of the Commonwealth and EU-17 but below that of the Belt and Road and the OECD.
IT and information services is the largest industry in the Quad in terms of output, largely driven by the United States’ dominance in the industry. It accounts for nearly one-third of advanced industry output and 3.3 percent of total economic output in the group. (See figure 120.)
Figure 120: Hamilton Index industries’ share of Quad economies, 1995–2022
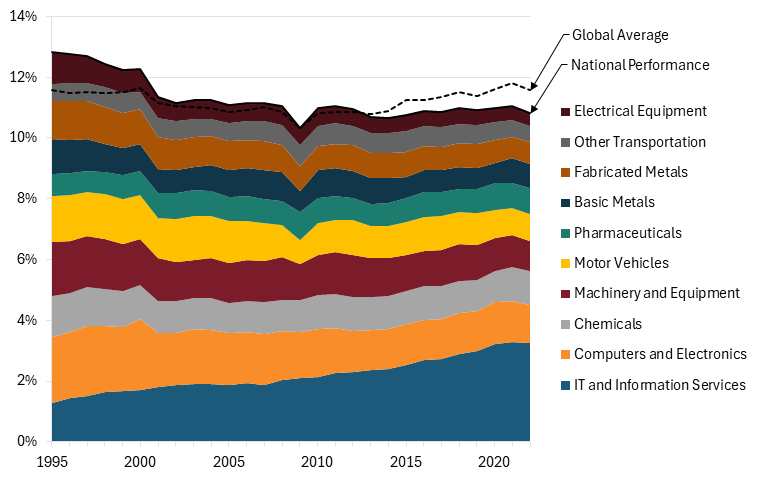
In terms of industry strength, the Quad is above average in only two industries: IT and information services and also other transportation. (See figure 121.) The pharmaceutical industry also just barely underperforms, with an LQ that rounds up to 1.00. The industries that the Quad underperforms in are more heavy manufacturing industries such as fabricated metals, basic metals, and electrical equipment.
The Quad has only improved its LQ in one industry since 2013, IT, which has increased by 3 percentage points. Conversely, the Quad’s LQ has declined in every other industry. Prior to 2008, the Quad actually overperformed in every industry except chemicals, but its persistent decline in industrial strength has left the group underperforming in all but two industries.
Figure 121: Quad nations’ relative historical performance in Hamilton industries, 1995–2022
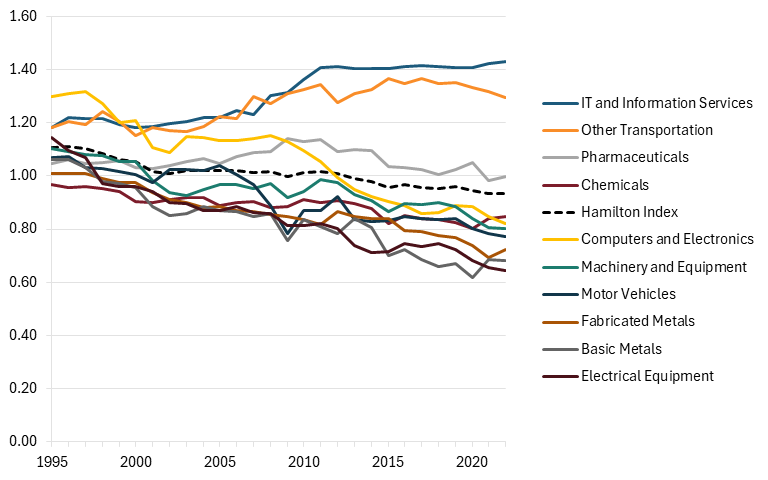
Belt & Road Members
The Belt and Road members previously underperformed relative to the world but have improved to the point that they now collectively overperform compared with the rest of the world, the EU, and OECD. A complete list of countries in the Belt and Road can be found in appendix B. The group’s overall LQ increased from 0.90 in 1995 to 1.14 in 2022. Its strongest industry in terms of absolute output is computers and electronics, which accounted for 2 percent of the group’s overall economic output in 2022. (See figure 122.)
Looking at industrial specialization, the Belt and Road is above average in all but three industries—other transportation, pharmaceuticals, and IT and information services—which have LQs of 0.81, 0.72, and 0.60, respectively. Its strongest industry, basic metals, had an LQ of 1.63 in 2022, followed by the electrical equipment industry, which had an LQ of 1.58. (See figure 123.)
The Belt and Road members previously underperformed relative to the world but now collectively overperform compared with the world, the EU, and OECD.
Five industries in which the Belt and Road has overperformed also saw their LQs improve since 2013; the only industries that overperformed and declined were the computers and electronics industry and the motor vehicles industry. Its largest grower, fabricated metals, saw its LQ increase by 21 percentage points over this period. All industries in which the Belt and Road Initiative underperformed in 2022 also experienced a decline in LQ.
Figure 122: Hamilton Index industries’ share of Belt and Road economies, 1995–2022
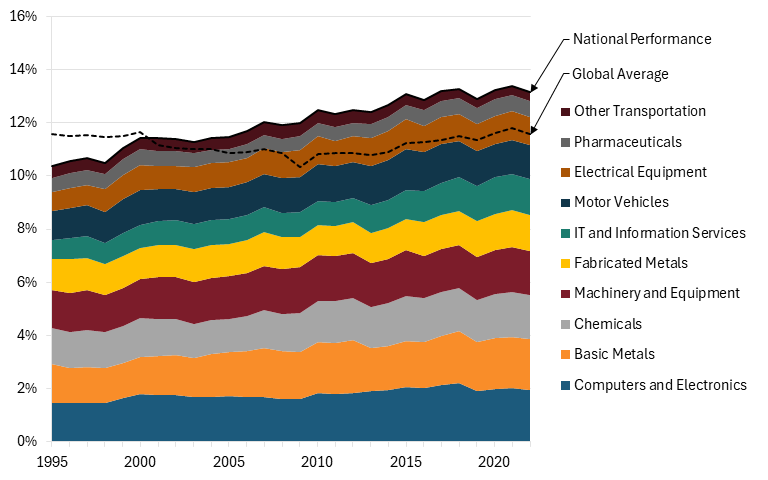
Figure 123: Belt and Road nations’ relative historical performance in Hamilton industries, 1995–2022
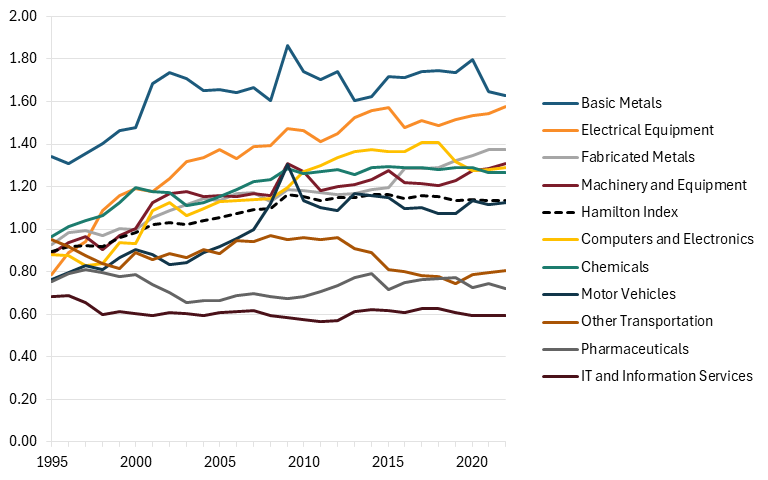
Appendices
Appendix A: Hamilton Index Industries
▪ Pharmaceuticals: Consists of medicinal and botanical products
▪ Electrical equipment: Includes products that generate, distribute, and use electrical power, such as electrical lighting, signaling equipment, and electric household appliances
▪ Machinery and equipment: Includes fixed and mobile or hand-held devices for use in industrial, building and civil engineering, agricultural, or home use; also includes the manufacturing of engines, turbines, and other special-purpose machinery
▪ Motor vehicles: Includes motor vehicles for transporting passengers and freight and the manufacturing of various parts and accessories
▪ Other transportation: Includes aerospace, sea, and rail transportation
▪ Computer, electronic, and optical products: Includes all electronic computers and computer peripheral equipment; specific goods include semiconductors, laptops, smartphones, and consumer electronics (e.g., TVs, virtual reality headsets)
▪ IT and information services: Includes computer programming, software, data processing, and web search portal companies
▪ Chemicals: Includes industrial chemicals, such as those used in agriculture, plastics, and explosives production, and consumer chemicals, such as printing ink, detergents, and perfumes
▪ Basic metals: Includes smelting, refining metals, or both—such as iron, steel, and aluminum—to be used in industrial activities
▪ Fabricated metals: Includes “pure” metal products made from shaping or assembling processes
Appendix B: Country Groupings
This report and the accompanying data visualizations include profiles of selected regional groupings of countries.[21] The members of each of the listed groups is shown as follows:
▪ EU-17: Austria, Belgium, Denmark, Finland, France, Germany, Greece, Italy, Luxembourg, Netherlands, Portugal, Spain, Sweden, United Kingdom, Bulgaria, Croatia, Romania
▪ EU-10: Cyprus, Czech Republic, Estonia, Hungary, Latvia, Lithuania, Malta, Poland, Slovakia, Slovenia
▪ Quad: Australia, India, Japan, United States
▪ Commonwealth: Australia, Canada, New Zealand, United Kingdom
▪ Belt & Road: Austria, Bangladesh, Belarus, Brunei Darussalam, Bulgaria, Cambodia, Cameroon, Chile, China, Costa Rica, Côte d’Ivoire, Croatia, Cyprus, Czech Republic, Egypt, Estonia, Greece, Hungary, Indonesia, Italy, Kazakhstan, Laos, Latvia, Lithuania, Luxembourg, Malaysia, Malta, Morocco, Myanmar, New Zealand, Nigeria, Pakistan, Peru, Philippines, Poland, Portugal, Romania, Russia, Saudi Arabia, Senegal, Singapore, Slovakia, Slovenia, South Africa, South Korea, Thailand, Tunisia, Turkey, Ukraine, Vietnam
Appendix C: Hamilton Index Calculations
|
# |
Metric |
Source |
Calculation |
Example |
|||
|
Country |
Sector |
Year |
Finding |
||||
|
A |
National GDP |
World Bank; IMF |
=(#) |
South Korea |
GDP |
2022 |
$1.7T |
|
B |
Global GDP |
World Bank; IMF |
=(#) |
World |
GDP |
2022 |
$102.4T |
|
C |
National Output, Single Sector |
OECD |
=(#) |
South Korea |
Computers, Electronics |
2022 |
$133.6B |
|
D |
Global Output, Single Sector |
OECD |
=(#) |
World |
Computers, Electronics |
2022 |
$1.6T |
|
E |
National Output, Advanced Total |
ITIF |
=SUM(#:#) |
South Korea |
All Advanced |
2022 |
$420.4B |
|
F |
Global Output, Advanced Total |
ITIF |
=SUM(#:#) |
World |
All Advanced |
2022 |
$11.9T |
|
G |
“Global Mkt Share” |
ITIF |
=(C/D) |
South Korea |
Computers, Electronics |
2022 |
8.61% |
|
H |
“Domestic Mkt Share” |
ITIF |
=(C/A) |
South Korea |
Computers, Electronics |
2022 |
7.98% |
|
I |
“Global GDP Share” |
ITIF |
=(D/B) |
World |
Computers, Electronics |
2022 |
1.51% |
|
J |
“Relative Share” (LQ) |
ITIF |
=(H/I) |
South Korea |
Computers, Electronics |
2022 |
5.27 |
Appendix D: Specialization Index Calculations
The specialization index is calculated using a normalized Herfindahl-Hirschman Index (HHI), which is traditionally used to measure the size of companies relative to the size of the industry they are in. For the specialization index, this formula was applied to measure the size of an advanced industry in another country relative to a country’s total advanced industry output. The HHI for a country was calculated by first finding each industry’s share of advanced output, then squaring these market shares and summing the resulting numbers.
Mathematically, the HHI of a country is calculated as:
![]()
Wherein ![]() denotes the market share of firm
denotes the market share of firm ![]() as a decimal.
as a decimal.
The HHI is then normalized to output a value between 0 and 1 using the following formula:
![]()
Through the normalization of traditional HHI benchmarks, we conclude that a country with a specialization index score below 0.06 has output broadly distributed across industries, a score of 0.06 to 0.17 indicates moderate specialization, and a score above 0.17 indicates strong specialization.
Acknowledgments
This report is part of a series that has been made possible in part by generous support from the Smith Richardson Foundation. (For more, see: itif.org/power-industries.) ITIF maintains complete editorial independence in all its work.
The author would like to thank Robert Atkinson for his guidance and feedback on this report, and Randolph Court and Erica Schaffer for their editorial assistance. Any errors or omissions are the author’s responsibility alone.
About the Author
Meghan Ostertag is a policy analyst for economic policy at the Information Technology and Innovation Foundation. She holds a bachelor’s degree in economics from American University.
About ITIF
The Information Technology and Innovation Foundation (ITIF) is an independent 501(c)(3) nonprofit, nonpartisan research and educational institute that has been recognized repeatedly as the world’s leading think tank for science and technology policy. Its mission is to formulate, evaluate, and promote policy solutions that accelerate innovation and boost productivity to spur growth, opportunity, and progress. For more information, visit itif.org/about.
Endnotes
[1]. Robert Atkinson, “Marshaling National Power Industries to Preserve America’s Strength and Thwart China’s Bid for Global Dominance” (ITIF, November 2025), https://itif.org/publications/2025/11/17/marshaling-national-power-industries-to-preserve-us-strength-and-thwart-china/.
[2]. Robert D. Atkinson, “The Hamilton Index: Assessing National Performance in the Competition for Advanced Industries” (ITIF, June 8, 2022), https://itif.org/publications/2022/06/08/the-hamilton-index-assessing-national-performance-in-the-competition-for-advanced-industries/; Robert D. Atkinson and Ian Tufts, “The Hamilton Index, 2023: China Is Running Away With Strategic Industries” (ITIF, December 13, 2023), https://itif.org/publications/2023/12/13/2023-hamilton-index/.
[3]. Organization for Economic Cooperation and Development (Trade in Value Added 2025 edition: principal indicators, levels), accessed February 25, 2026, https://data-explorer.oecd.org/vis?pg=0&bp=true&tm=%22%28TIVA%29%202025%20edition%22&snb=5&df[ds]=dsDisseminateFinalDMZ&df[id]=DSD_TIVA_MAINLV%40DF_MAINLV&df[ag]=OECD.STI.PIE&df[vs]=1.1&dq=VALU.AUS.C21.W..A&pd=1995%2C2022&to[TIME_PERIOD]=false.
[4]. Because of how companies report income for tax purposes, Ireland appears to have artificially inflated advanced industry output measures.
[5]. Lin Jones, “Recent Developments in Global Semiconductor Industry” (Washington DC: U.S. International Trade Commission, November 2023), https://www.usitc.gov/publications/332/executive_briefings/ebot_recent_developments_in_global_semiconductor_industry.pdf.
[6]. Nguyen Thu, “Vietnam’s Electronics Sector Rising Fast, But Structural Hurdles Remain,” Vietnam Investment Review, July 3, 2025, https://vir.com.vn/vietnams-electronics-sector-rising-fast-but-structural-hurdles-remain-131838.html.
[7]. Stephen Ezell, “How Innovative Is China in the Electric Vehicle and Battery Industries?” (ITIF, July 29, 2024), https://itif.org/publications/2024/07/29/how-innovative-is-china-in-the-electric-vehicle-and-battery-industries.
[8]. Aaron Blotnick, “The Year China Surpassed the USA in Biotech Innovation, Deal Value, and Clinical Output,” Synbiobeta, January 22, 2026, https://www.synbiobeta.com/read/the-year-china-surpassed-the-usa-in-biotech-innovation-deal-value-and-clinical-output.
[9]. Sandra Barbosu, “How Innovative is China in Biotechnology?” (ITIF, July 30, 2024), https://itif.org/publications/2024/07/30/how-innovative-is-china-in-biotechnology/.
[10]. Claude Barfield and Matthew Glavish, “Can the Commercial Aircraft Corporation of China’s Home-Field Advantage Challenge Boeing’s 737?” (American Enterprise Institute, January 23, 2023), https://www.aei.org/technology-and-innovation/can-comacs-home-field-advantage-challenge-boeings-737/.
[11]. “The Drivers and Impacts of Subsidies to Steel Firms” (Paris, France: OECD, October 9, 2025), https://www.oecd.org/en/publications/the-drivers-and-impacts-of-subsidies-to-steel-firms_33e4b097-en.html.
[12]. Erica York and Alex Durante, “Tariff Tracker: Impact of Trump Tariffs & Trade War by the Numbers” (Tax Foundation, February 23, 2026), https://taxfoundation.org/research/all/federal/trump-tariffs-trade-war/.
[13]. Peter S. Goodman, “18,000 Reasons It’s So Hard to Build a Chip Factory in America,” New York Times, last updated December 8, 2025, https://www.nytimes.com/2025/12/04/business/tsmc-phoenix-fab.html.
[14]. Stephen Ezell, “How Innovative Is China in the Display Industry” (ITIF, September 16, 2024), https://itif.org/publications/2024/09/16/how-innovative-is-china-in-the-display-industry/.
[15]. “Digital and Technologies” (London, United Kingdom: UK Department for Business and Trade), accessed February 25, 2026, https://www.business.gov.uk/invest-in-uk/investment/sectors/technology/.
[16]. “United Kingdom Country Commercial Guide” (Washington DC: International Trade Administration), https://www.trade.gov/country-commercial-guides/united-kingdom-aerospace-and-defense.
[17]. “The UK’s Digital Tax Policy” (ITIF, last updated February 5, 2026), https://itif.org/publications/2025/02/11/uk-digital-tax-policy/.
[18]. “Non-Tariff Attack Tracker” (ITIF, accessed February 25, 2026), https://itif.org/publications/knowledge-bases/attack-tracker/.
[19]. Ibid.
[20]. Bao Thanh Nien, “Over 50% of Samsung Phones Globally Are ‘Made in Vietnam’,” Vietnam.vn, July 30, 2023, https://www.vietnam.vn/en/hon-50-dien-thoai-samsung-toan-cau-made-in-vietnam.
[21]. See: “The Hamilton Index, 2026: Country Visualizations” (ITIF, May 2026), https://itif.org/publications/2026/05/06/hamilton-index-2026-country-visualizations/.
