
The Hamilton Index, 2023: China Is Running Away With Strategic Industries

China now dominates the strategically important industries in ITIF’s Hamilton Index, producing more than any other nation in absolute terms and more than all but a few others in relative terms. Its gains are coming at the expense of the United States and other G7 and OECD economies, and time is running short for policymakers to mount an industrial comeback.
KEY TAKEAWAYS
Key Takeaways
Contents
Appendix A: Hamilton Index Industries. 18
Appendix B: Advanced Industries’ Relationship to National Trade Balances. 18
Appendix C: Country Groupings. 19
Appendix D: Hamilton Index Calculations. 20
Introduction
Nations are in a fierce win-lose global competition for market share in advanced, traded-sector technology industries because, for most, winning enables economic and national security. That is especially true for allied nations, as China’s gain usually comes at its loss and vice versa. Winning—not only the competition for innovation leadership but also for production capacity—will boost international competitiveness and economic and national security.
When it comes to U.S. national interest, innovation-based production is key. The United States has a long history of pioneering innovations only to see its production captured by other nations, including China. This reduces growth, weakens the terms of trade (creating a higher trade balance, a weaker dollar, or both), degrades the national security industrial base, and makes America vulnerable to industrial pressure tactics from China.
To assess U.S. and other nations’ performance, the Information Technology and Innovation Foundation (ITIF) has examined changes in global shares of value-added output in 10 advanced industry sectors its Hamilton Center on Industrial Competitiveness has aggregated into the Hamilton Index of Advanced-Technology Performance: pharmaceuticals; electrical equipment; machinery and equipment; motor vehicle equipment; other transport equipment; computer, electronic, and optical products; information technology and information services; chemicals (not including pharmaceuticals); basic metals; and fabricated metals. To conduct this analysis, ITIF uses production data from the Organization for Economic Cooperation and Development’s (OECD’s) dataset on trade in value added, covering the period from 1995 through 2020, and ITIF’s analysis focuses on 40 countries included in that dataset.[1] Because of problems with how Ireland’s output is reported, it is not included in the analysis or in EU-wide aggregate data.[2]
The 10 industries included in the Hamilton Index together accounted for more than $10 trillion in global production in 2020 (figure 1). The information technology (IT) and information services industry (including software and Internet services) is the largest of the 10, accounting for 18 percent of global advanced industry output.
Figure 1: Global output from industries included in the Hamilton Index, 2020 ($10.1 trillion, total)
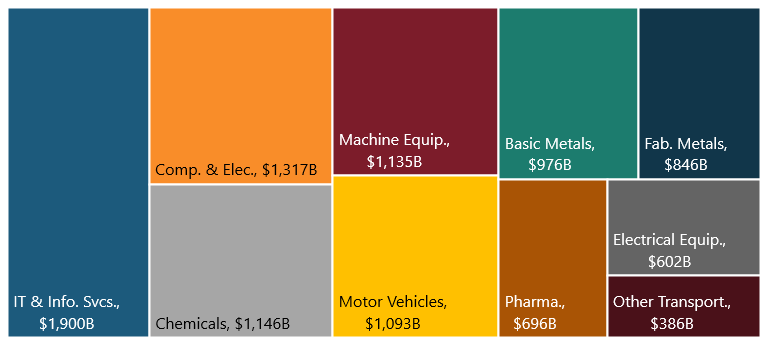
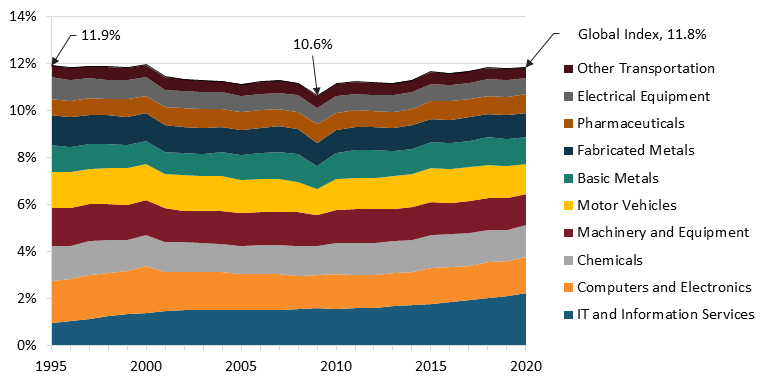
The 10 industries’ collective production represented 11.8 percent of the global economy in 2020, about the same as 25 years prior, having rebounded from a dip to 10.6 percent following the global financial crisis of 2008 that saw steeper declines in goods output than overall gross domestic product (GDP). (See figure 2.) However, the mix has changed, with the IT and information services share growing 34 percent since 2002. The fact that the overall share of the global economy comprising this advanced industry output has not changed underscores the zero-sum competition between nations. Indeed, there is a noticeable correlation between strength in these industries and nations’ balance of trade. (See Appendix B: Advanced Industries’ Relationship to National Trade Balances.) Nations are, or at least should be, competing intensively for a greater share of this fixed pie. China certainly is. For the United States, losing this race, either because policymakers are indifferent to the country’s industrial structure or because they choose to focus on other economic or societal goals, would be catastrophic, as it would turn the United States into a deindustrialized, United Kingdom-like economy. Time is short. The 2020s are likely to be the decisive decade in which to turn around U.S. advanced industry fortunes, because once China gains sufficient global market share, allied and U.S. production risks being permanently weakened.
The fact that the overall share of the global economy comprising this advanced industry output has not changed underscores the zero-sum competition between nations.
In several reports, ITIF has laid out a comprehensive advanced industry strategy.[3] But notwithstanding the passage of the CHIPS Act, the political will in the United States to implement and fully fund such an agenda appears to be relatively low, especially as neither political party wants to address the massive budget deficit to free up needed funding for such a strategy.
Figure 2: Hamilton industry shares of the global economy
Of course, global market shares of the advanced industries cannot serve as the only metric of national competitiveness—or even the primary one—because nations have different-sized economies. To assess nations’ relative performance in strategically important industries, ITIF uses an analytical statistic known as a “location quotient” (LQ), which measures any region’s level of industrial specialization relative to a larger geographic unit—in this case, a nation relative to the rest of the world.
The LQ is calculated as an industry’s share of a country’s economy divided by the global industry’s share of the global economy, or as a country’s share of global output in an industry divided by the country’s overall share of the global economy. Either way, an LQ greater than 1 means the country’s share of global output in an industry is greater than the global average; and an LQ less than 1 means a country’s share is less than the global average. For example, the U.S. motor vehicle industry’s output in 2020 was 14.01 percent of global motor vehicle production, while the U.S. economy overall was 24.71 percent of the global economy. Thus, the U.S. LQ in the motor vehicles industry was 14.01 percent divided by 24.71 percent, or 0.57, meaning the United States significantly underperformed in the industry: Its output (and global market share) was just 57 percent of the level we would expect based on the size of the U.S. economy.
The 2020s are likely the decisive decade in which to turn around U.S. advanced industry fortunes, for once China gains sufficient global market share, allied and U.S. production risks being permanently weakened.
Overall Findings
Specialization Rankings
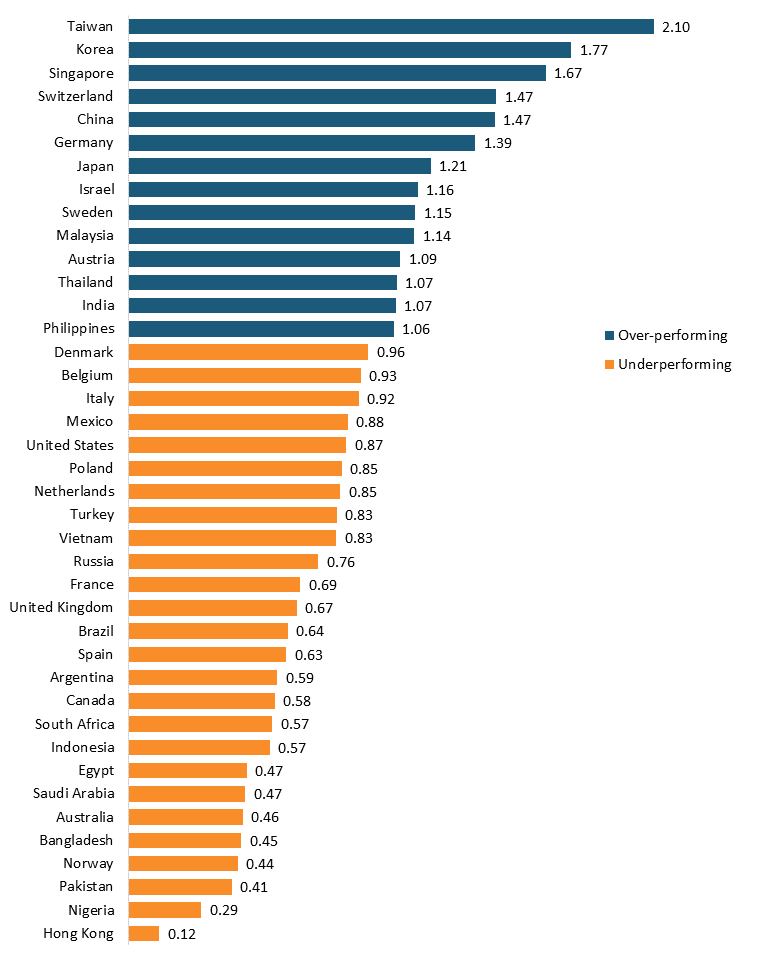
Figure 3 ranks 40 countries by their relative performance (LQ) in the composite Hamilton Index based on the most recent data available from the OECD. Fourteen countries have LQs above average for the composite output of the 10 industries, with Taiwan ranking first at 2.1 (with almost all of that driven by its computer and semiconductor output). Three other East Asian nations—Korea, Singapore, China, and Japan ranked second, third, fifth and seventh, respectively. This in large part reflects the focused and dedicated advanced industry policies these nations have had in place for the last several decades. Engineering and chemical industry-intensive nations of Switzerland, Germany, Sweden, and Austria ranked fourth, sixth, ninth, and eleventh, respectively.
Several developing countries ranked low, with LQs below 0.5, including Egypt, Bangladesh, Pakistan, and Nigeria. In addition, natural resource-intensive nations such as Canada, Saudi Arabia, Australia, and Norway all ranked low.
The United States’ LQ was 0.87, meaning that as a share of U.S. GDP, these industries collectively are smaller than the global average. For the U.S. LQ to be 1.0, advanced industry output would need to expand by $328 billion, or 15 percent. This would be equivalent to doubling America’s computer, electronics, and optical products industry output.
Some will argue that it’s acceptable or even normal for the U.S. LQ to be this low because it is a large economy and one where the share of GDP that is globally traded is below average. But LQ is not a measure related to trade; it’s a measure related to production. Moreover, there is a small, positive correlation between national GDP and LQ (0.12), suggesting that the U.S. score should be above average, not below. The reality is America’s low LQ reflects failure, not success; weakness, not strength.
Figure 3: Relative national performance in the composite Hamilton Index (2020 LQ)
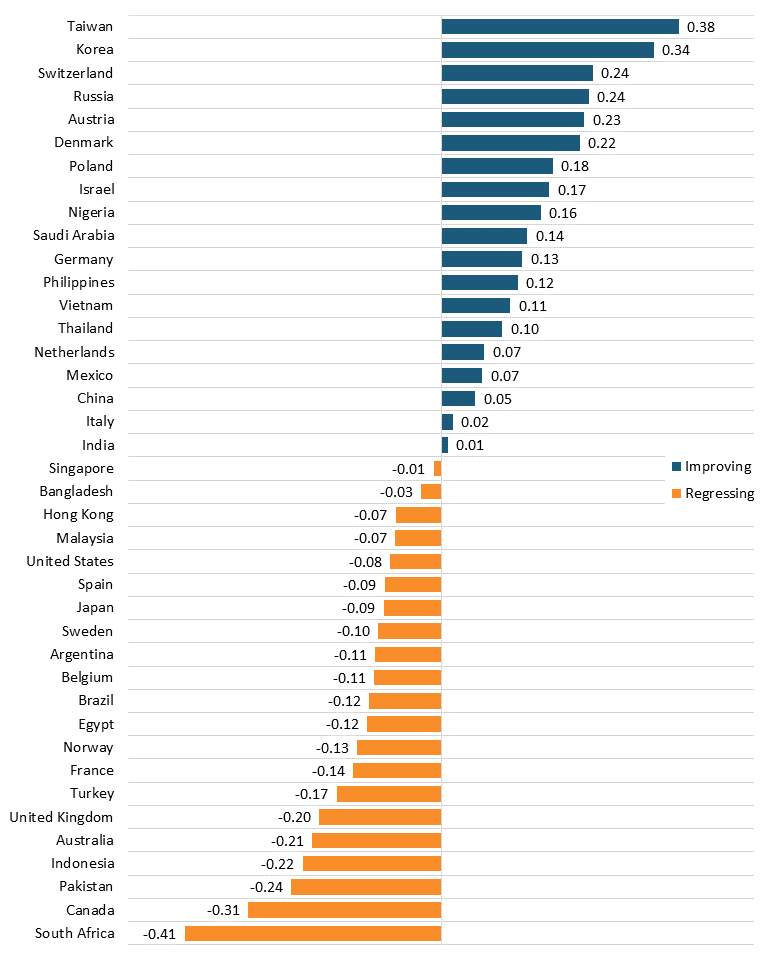
When it comes to relative change in LQ, the story is somewhat different. From 1995 to 2002, Taiwan and Korea led in LQ growth. (See figure 4.) Several European nations also increased significantly, including Switzerland, Austria, Denmark, and Germany. Russia increased its score by almost 25 percentage points as it overthrew the straitjacket of Soviet communism and got out from under export controls that the Western Bloc established during the Cold War. The United States’ LQ fell slightly by 8 percentage points.
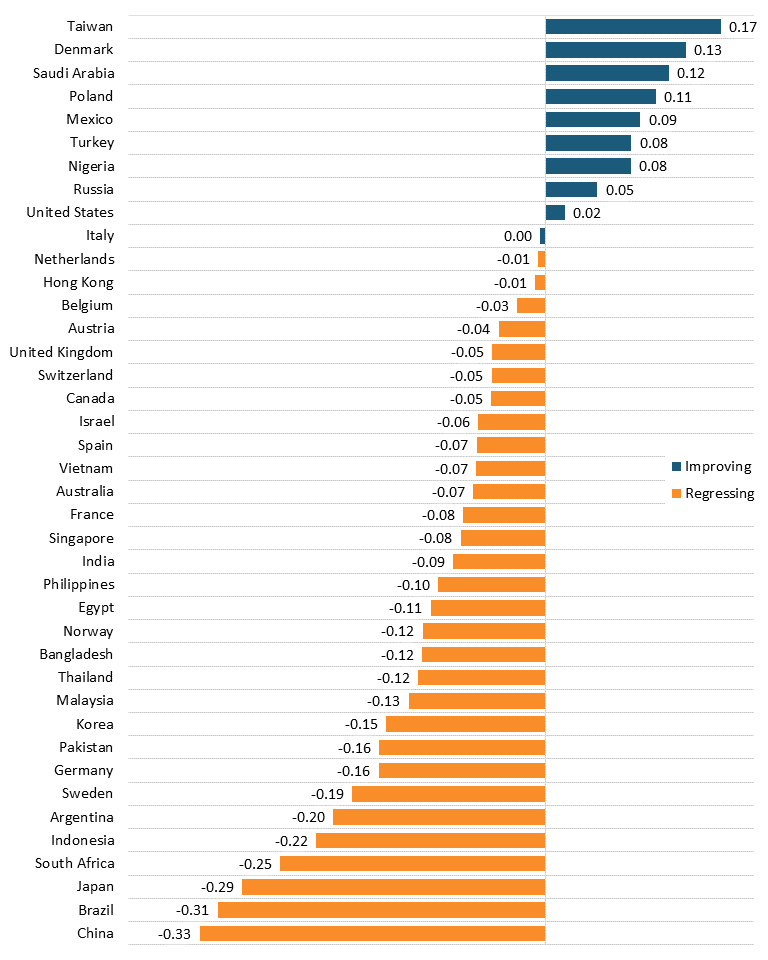
Figure 4: Change in relative national performance in the composite Hamilton Index (LQ difference, 1995–2020)
Some industries are more concentrated than others. For example, the country that is most specialized in machinery and equipment production, Germany, had an LQ of 2.02, whereas Taiwan outperformed even more dramatically in computers and electronics with an LQ of 8.79. (See table 1.) Some of this is because leading specialists such as Taiwan, Switzerland, Singapore, Mexico, and Israel are relatively small, making it easier for an industry they specialize in to dominate their economy. But in other cases, it is because industries such as machinery, chemicals, and electrical equipment are much broader and have wider arrays of sub-industries.
Table 1: Hamilton Index industry leaders, 2020
|
Industry |
Global Output (Billions) |
Leading Producer |
Leader’s Share |
Relative Leader |
Leader’s LQ |
|
IT and Information Services |
$1,900 |
USA |
36.4% |
Israel |
2.89 |
|
Computers and Electronics |
$1,317 |
China |
26.8% |
Taiwan |
8.79 |
|
Chemicals |
$1,146 |
China |
29.1% |
Saudi Arabia |
2.41 |
|
Machinery and Equipment |
$1,135 |
China |
32.0% |
Germany |
2.02 |
|
Motor Vehicles |
$1,093 |
China |
24.3% |
Mexico |
3.14 |
|
Basic Metals |
$976 |
China |
45.6% |
China |
2.64 |
|
Fabricated Metals |
$846 |
China |
25.6% |
Poland |
2.12 |
|
Pharmaceuticals |
$696 |
USA |
28.4% |
Switzerland |
7.26 |
|
Electrical Equipment |
$602 |
China |
36.1% |
Vietnam |
2.36 |
|
Other Transportation |
$386 |
USA |
34.5% |
Singapore |
3.52 |
|
Composite Hamilton Index |
$10,097 |
China |
25.3% |
Taiwan |
2.10 |
Between 2008 and 2020, more countries have declined in their relative specialization, in part because of faster growth outside the 40 nations covered. Taiwan continued to specialize in advanced industries, almost exclusively because of its growth in computers and semiconductors (figure 5). Mexico grew by 9 percentage points, largely due to expansion of its automobile sector. The United States grew slightly, essentially treading waters since it was struck by the China shock of the 2000s. More importantly, rapid growth in the U.S. IT and information services sector more than offset continued decline in manufacturing. In this sense, strong performance in the IT services sector, including firms such as AWS, Google, and Meta, has masked a continued decline in advanced goods production.
Perhaps most surprising is that China ranked last, with its LQ peaking in 2009 and declining by 33 points by 2020. The reason was not necessarily an ineffectiveness of Chinese advanced industry policy, but rather its enormously fast economic growth, which would lead to lower LQs unless advanced industry grew as fast. In fact, China’s advanced industry output grew by 177 percent from 2008 to 2020, more than double the U.S. growth of 78 percent. Only Bangladesh and Vietnam saw greater output growth than did China.
Figure 5: Change in relative national performance in the composite Hamilton Index (LQ difference, 2008–2020)
Relative Momentum
LQs and change in LQs are useful indicators, but they don’t consider differences in industry size. If a small industry’s high LQ (or strong LQ) growth might be completely offset by a large industry with modest LQ. To account for this, ITIF has developed a momentum index. (See figure 6.) This is the sum of the 10 industries’ value-added output divided by their GDP, after first multiplying each industry’s 2020 output by its 2020 LQ and the percentage change in its LQ since 2008 (added to 1).
The U.S. momentum score since 2008 was slightly below the global average, with 53 percent of its score coming from IT and information services.
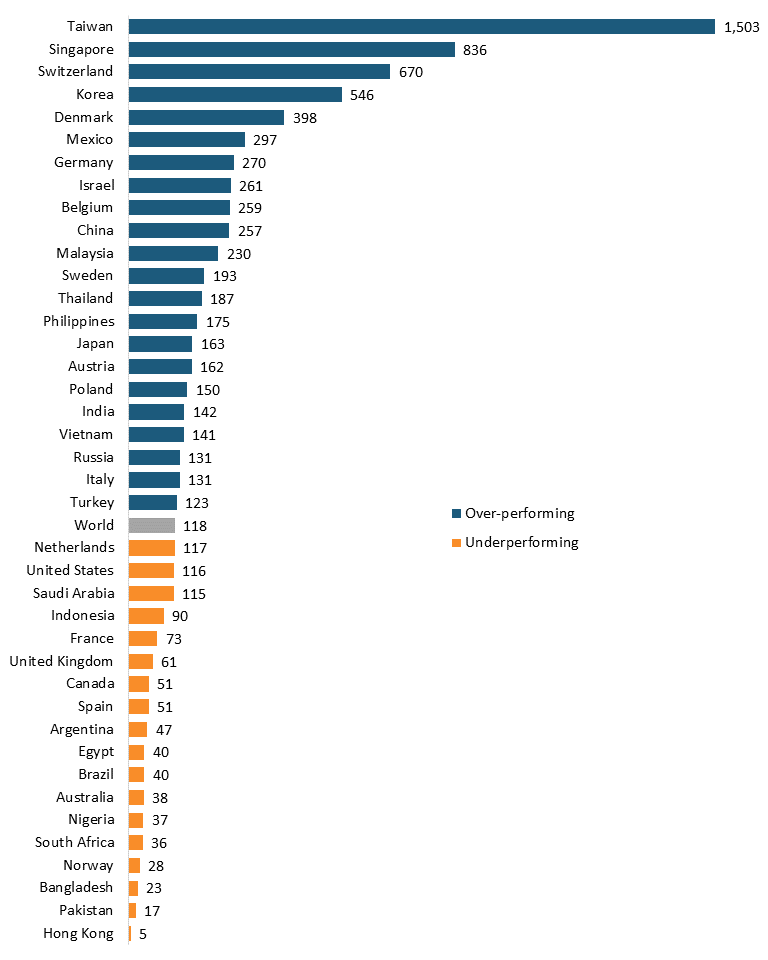
The results are striking. Taiwan far exceeds any other nation, with an index of momentum of 1,503, almost double Singapore’s score of 836 and more than double Korea’s, with all three nations’ strong scores due principally to computers and semiconductors. Switzerland ranked third, Denmark fifth, and Belgium ninth with over 70 percent of their momentum coming from the pharmaceutical sector. Almost all of Mexico’s strong score was due to the motor vehicle sector, while 40 percent of Germany’s score also came from this sector. Meanwhile, 75 percent of Israel’s momentum came from IT and information services.
The U.S. momentum score from 2008 to 2020 was slightly below the global average, with 53 percent of its score coming from IT and information services. If this sector were the average size and growth, then it would only account for 29 percent of the U.S. momentum score, which would have fallen to just 79.
China’s momentum score was more than twice that of the United States and was relatively diversified, with basic metals being its strongest industry, followed by machine equipment then computers and electronics.
Figure 6: Index of momentum in all Hamilton industries from 2008 to 2020[4]
Explore ITIF’s Data Visualization for Momentum in the Hamilton Index
ITIF has developed a data visualization tool that weighs the change in gross value-added output and relative specialization of 40 countries plus select multinational groupings over time.
§ Visit: itif.org/publications/2023/12/13/2023-hamilton-momentum-visualization/.
The visualization tool provides three interactive metrics:
§ ITIF’s “Momentum index,” a weighted scoring system to benchmark national progress in Hamilton Index industries over time.
§ An LQ change calculator, to visualize the difference in countries’ relative performance over time, industry by industry.
§ A global market share change calculator to visualize the difference in countries’ global market shares over time, industry by industry.
Top 10 Producers
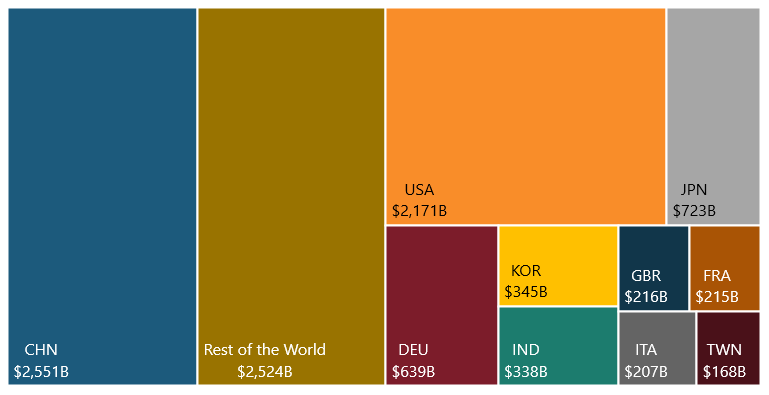
Hamilton industries together accounted for more than $10 trillion in global production in 2020, with the top 10 countries accounting for 75 percent of the total. (See figure 7 and figure 8.)
China dominated, with one-quarter of global output. For the first time, its output surpassed that of the rest of the world outside the top 10 producers. The United States was third as of 2020 with 21 percent of output. While India exceeded China’s workforce, its advanced industry output was just 13 percent of China’s.
Figure 7: Global output in Hamilton industries by the top 10 producers in 2020 ($7.6 trillion out of $10.1 trillion)
From the early 2000s to 2019, the rest of the world’s combined output comprised the largest global share, overtaking that position from the United States, which ranked first from 1995 to 2003. Then, following China’s acceptance into the World Trade Organization (WTO), the U.S. share started to fall significantly until 2010. Since then, it has rebounded, but with the lion’s share of that growth coming from the IT and information services industry.
Leaving IT and other information services out of the equation, the U.S. global share of Hamilton industries fell from around 24 percent in the last half of the 1990s to around 15 percent from 2010 to 2020. In contrast, China’s growth skyrocketed after its WTO accession, from around 6 percent in 2001 to over 25 percent in 2020. In aggregate, China’s growth matched almost all of Japan’s decline. Previously, Japan had held about the same global market share as did the United States as of 1995, but its share had dropped to around 7 percent by 2020. Notwithstanding Germany’s supposed strong performance (at least until recently), its share fell from around 10 percent in 1995 to just 6 percent in 2020.
Figure 8: Top 10 producers’ historical shares of global output in Hamilton industries
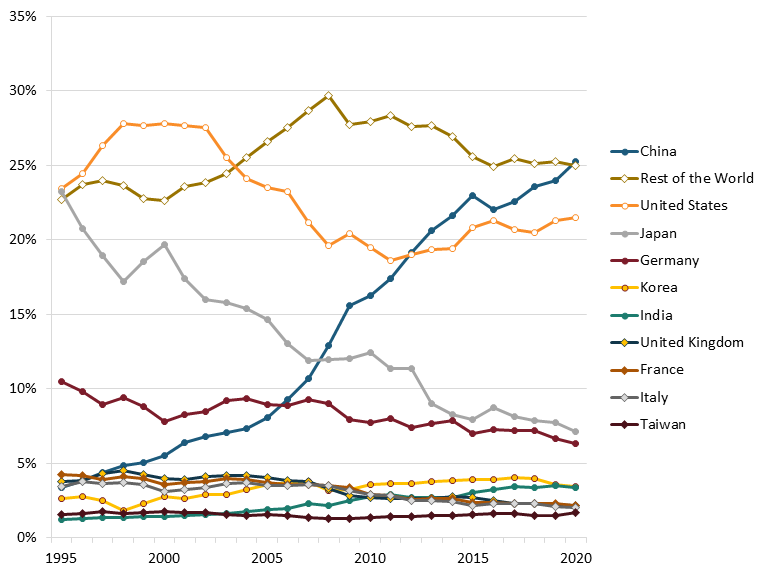
Leaving out IT and other information services, U.S. global share fell from around 24 percent in the last half of the 1990s to around 15 percent from 2010 to 2020.
The China Juggernaut
As discussed, the amount of advanced industry output globally has been fairly stable as a share of GDP throughout the 25-year period covered in this analysis. As such, when some countries gained share, others lost. From 1995 to 2020, China’s share of global advanced industry output increased 22 percentage points, from 3 percent to 25 percent. In the same period, OECD nations’ share fell 27 percentage points, from 85 percent to 58 percent. In other words, China’s growth came at the expense of the OECD.
More recently, from 2017 to 2020, Chinese output increased 17 percent, while the rest of world combined increased just 2 percent. Chinese output in Hamilton Index industries increased by $404 billion in that period, compared with an increase of $187 billion in the rest of world. (See figure 9.) However, when IT and other information services are exempted (an industry in which the United States and Europe are strong and China is weak), the picture is even starker. Chinese output grew $363 billion while output in the rest of the world fell by $107 billion. This difference was most profound in the machinery and equipment sector, other transportation, chemicals, and basic metals. The rest of world did outperform China in pharmaceuticals and IT and information services. But that might not last, as the Chinese government has targeted biopharmaceuticals and artificial intelligence as key industries for development.
Figure 9: Nominal change in advanced industry output from 2017 to 2020, China vs. the rest of the world
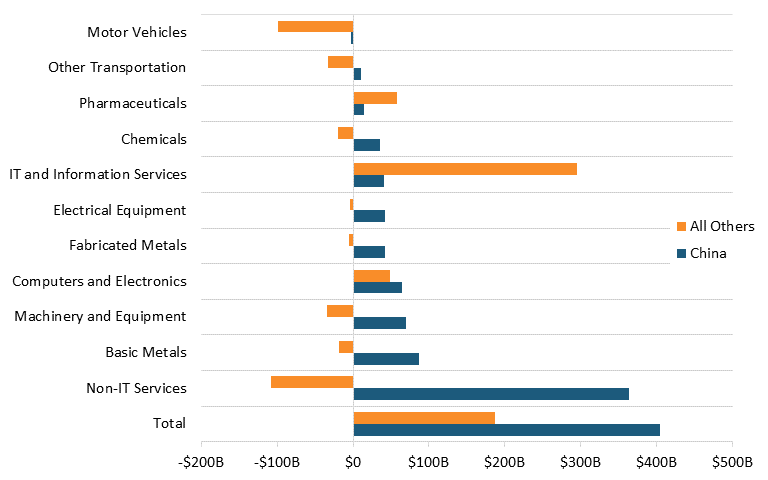
When IT and other information services are exempted (an industry in which the United States and Europe are strong and China is weak), the picture is even starker. Chinese output grew $363 billion while output in the rest of the world declined by $107 billion.
We can see this zero-sum competition play out in individual nations. ITIF identified the industries and countries where there was the most nominal decline in output from 2017 to 2020, not counting motor vehicles, which overall saw declines:
▪ In Austria and Switzerland, the biggest declines were in electrical equipment (declines of $1.15 billion and $115 million, respectively). During this period, China expanded its output by $42 billion.
▪ The nations where the largest loss was in machinery and equipment were Germany ($16.4 billion), Japan ($14 billion), Italy ($5.0 billion), Brazil ($4.1 billion), Argentina ($1.8 billion), Mexico ($1.5 billion), and the United Kingdom ($1.8 billion). China expanded its output by $69.4 billion.
▪ In computers and electronics, Denmark’s output fell $80 million, Japan’s fell $6.5 billion, and Korea’s fell $18 billion. China’s output increased by $64.7 billion.
▪ In chemicals, Brazil’s output fell $8.7 billion, Canada $900 million, Netherlands $1.4 billion, Norway $400 million, Pakistan $600 million, Singapore $5 billion, South Korea $5.6 billion, Germany $5.4 billion, and France $3.8 billion. China’s output increased $35.5 billion.
▪ In basic metals, Japan’s output fell $17.2 billion and Turkey’s $5.3 billion, while China’s increased $86.4 billion.
▪ In fabricated metals, Germany’s output fell by $7.1 billion, South Korea’s output fell by $4 billion, France’s by $3.4 billion, and Spain and Sweden $1.2 billion, while China’s increased $41.8 billion.
Global Market Shares: China vs. the OECD and G7
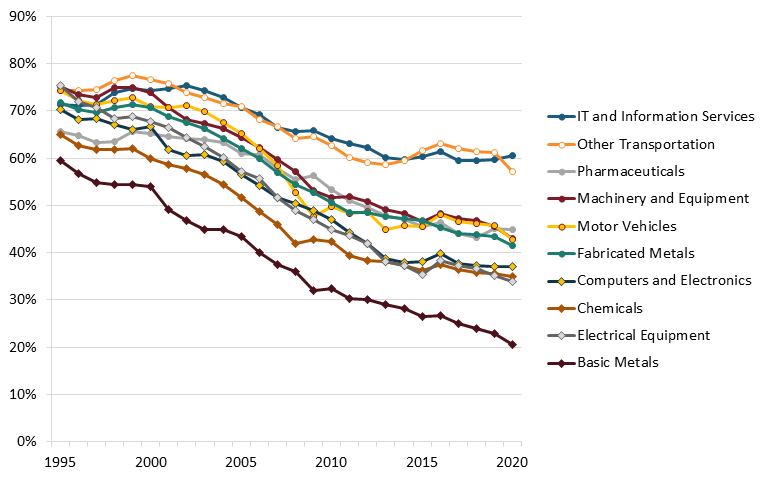
Between 1995 and 2020, OECD nations’ global market share dropped by 26.8 percentage points across all Hamilton Index industries. (See figure 10.) Within the OECD, the slope was even more pronounced for the G7 nations that have led the global economy since World War II—their overall market share in Hamilton industries dropped by 27.9 percentage points. (See figure 11.) By contrast, China’s overall market share increased by 21.9 points. (See figure 12.) During this period, China’s gains were strongly correlated with U.S. losses (an R coefficient of -0.79).
The largest declines for the OECD came in basic metals, where the bloc’s market share dropped by 46.2 percentage points, and electrical equipment, which declined by 40.1 points. It was a similar story for the G7: Its largest declines were in electrical equipment (a decline of 41.5 points), followed by basic metals (a decline of 38.8 points). China was the big beneficiary in both cases: Its biggest increases in market share were in basic metals (a 39.5-point increase) and electrical equipment (32.4 points).
The total Hamilton Index market share for the OECD declines by 26.8 percentage points. China, by contrast, increased its market share by 21.9 percentage points.
Figure 10: OECD global market shares in Hamilton Index industries
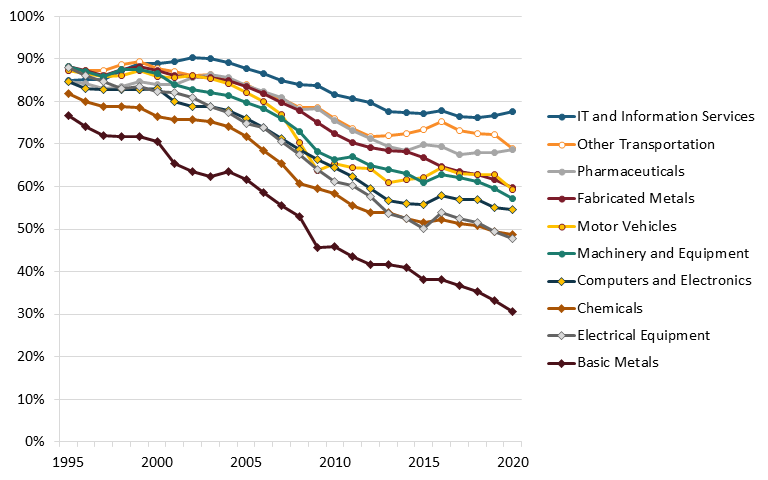
Figure 11: G7 global market shares in Hamilton Index industries
To match the advanced-industry share of China’s economy, U.S. output in Hamilton industries would need to expand by nearly $1.5 trillion (69 percent). That would require doubling U.S. output in pharmaceuticals, electrical equipment, machinery and equipment, motor vehicles, other transportation, computers electrical and optical, chemicals, basic metals, and fabricated metals.
Figure 12: China global market shares in Hamilton Index industries
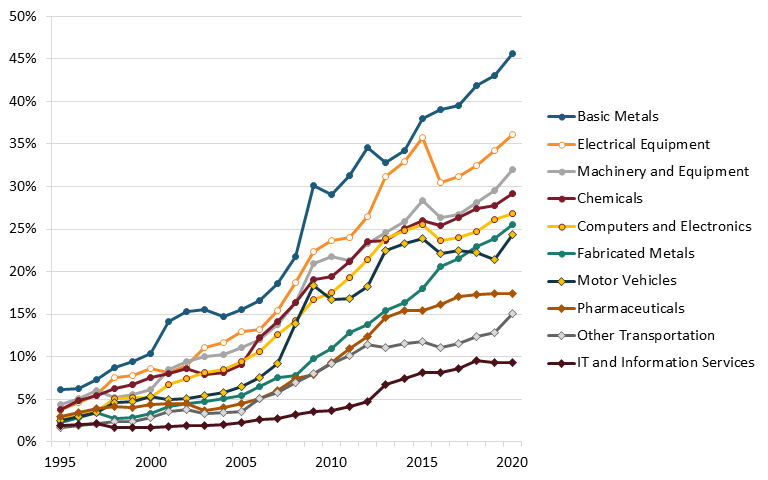
It would be one thing if the growth of China’s advanced industries were proportional to the growth of its overall economy. But it hasn’t been. China has made a strategic decision to outperform in these industries, and it has succeeded in relative terms too: It produced 47 percent more than the global average in 2020, while the United States produced 13 percent less than average.
To appreciate the enormity of that gap, consider that to match the advanced-industry share of China’s economy, U.S. output in these industries would need to expand by nearly $1.5 trillion (69 percent). This would require doubling U.S. output in pharmaceuticals, electrical equipment, machinery and equipment, motor vehicles, other transportation, computers electrical and optical, chemicals, basic metals, and fabricated metals.
China’s Role in the Growth of Non-OECD Global Market Shares
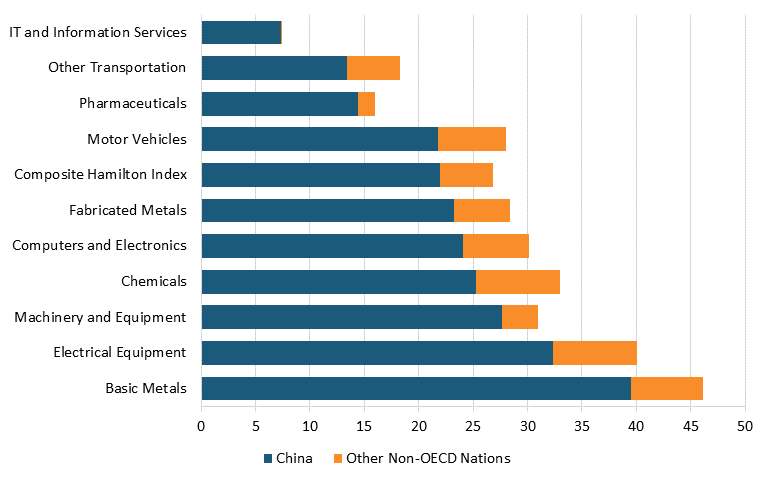
Between 1995 and 2020, global production across all Hamilton Index industries shifted to non-OECD nations: Their global market share increased by 26.8 percentage points. But the real story was the extent to which China drove that gain. Industry by industry, it was China’s growth that propelled the lion’s share of the non-OECD bloc’s progress. (See figure 13.)
The largest of those increases occurred in traditional industries such as basic metals (where the block realized a 46.2 percentage point increase in its market share) and chemicals (a 33 percentage-point increase). But thanks to China, the non-OECD bloc also captured substantial increases in market shares in more advanced industries such as computers and electronics (a gain of 30.1 percentage points) and motor vehicles (28 percentage points). But the reality is China’s gain has come at the expense of most of the developing world. Before the Chinese government decided it wanted to dominate manufacturing—especially advanced industries—many developing nations, in part because of favorable labor costs, were growing their manufacturing. Since China’s rise, that growth has slowed and, in some cases, stagnated.
Figure 13: Non-OECD change in global market shares (percentage point difference, 1995–2020)
Industry Profiles
Read Profiles of the 10 Hamilton Industries
§ In the PDF, see pages 19–69.
§ The 10 Hamilton industries include: IT and information services; computers, electronics, and optical products; chemicals; pharmaceuticals and biotechnology; machinery and equipment; fabricated materials; motor vehicles; other transportation equipment; basic metals; and electrical equipment.
Explore the Data Visualization Tool for Hamilton Industries
ITIF has developed a data visualization tool to show the state of global competition in each of the 10 Hamilton industries plus the composite index.
§ Visit: itif.org/publications/2023/12/13/2023-hamilton-industry-visualization/.
The visualization tool provides five interactive metrics:
§ By year: national performance (LQ), value-added output, and global market shares.
§ Trends: including time series of national performance (LQ) and global market shares.
Country Profiles
Read Profiles of the Top 10 Producers in Hamilton Industries
§ In the PDF, see pages 70–101.
§ The top 10 producers in Hamilton industries include: China, the United States, Japan, Germany, South Korea, India, the United Kingdom, France, Italy, and Taiwan.
Read Profiles of Other Noteworthy Producers
§ In the PDF, see pages 102–113.
§ Other country profiles include: Russia, Canada, Mexico, Brazil, Australia, and Vietnam.
Read Profiles of Select Multinational Groupings
§ In the PDF, see pages 114–125.
§ Select multinational groupings include: the G7, the EU-17 (EU members that joined prior to 2004), the EU-10 (members that joined after 2004), the Quad nations, Commonwealth nations, and Belt & Road members.
Explore the Data Visualization Tool for Country Profiles
ITIF has developed a data visualization tool to profile countries and multinational groupings based on their relative performance and market shares in Hamilton industries.
§ Visit: itif.org/publications/2023/12/13/2023-hamilton-country-visualization/.
The visualization tool provides five interactive metrics:
§ Relative performance: by year, as time-series trends, and by net change in a given period.
§ Market shares, including: global market shares of Hamilton industries and industries’ shares of domestic economies.
Appendices
Appendix A: Hamilton Index Industries
▪ Pharmaceuticals: Consists of medicinal and botanical products.
▪ Electrical Equipment: Includes products and tools such as batteries, fiber optics, household appliances, switchgears, and other industrial controls.
▪ Machinery and Equipment: Includes office machinery, industrial machinery, agricultural machinery, engines, and turbines.
▪ Motor Vehicles: Includes both cars and trucks.
▪ Other Transportation: Includes aerospace, rail, and sea transportation.
▪ Computer, Electronic, and Optical Products: Includes semiconductors, computer hardware, and consumer electronics (e.g., TVs, VR).
▪ IT and Information Services: Includes software and Internet companies.
▪ Chemicals: Consists of both commodity chemicals (e.g., oil and natural gas) and industrial chemicals.
▪ Basic Metals: Includes metal commodities used in industrial activities (e.g., steel, aluminum, palladium).
▪ Fabricated Metals: Includes metal products made from shaping or assembling processes.
Appendix B: Advanced Industries’ Relationship to National Trade Balances
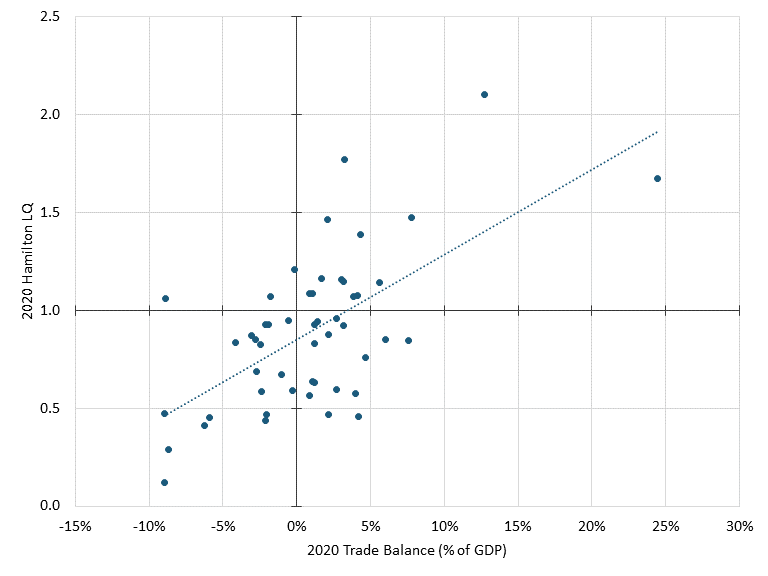
Countries that are more competitive in advanced industries can export more, thus resulting in a lower trade deficit, if not a trade surplus. Should a country lose its competitive edge in advanced industries, then its trade deficit will likely increase. This can present challenges for a nation’s future, as a trade deficit represents an implicit debt it will eventually have to pay back. As ITIF has argued in other reports, this will entail lowering consumption.[5]
The trade balance as a percentage of GDP had a somewhat positive correlation with overall LQ in the Hamilton Index (0.31 in 2020). (See figure 130.) That is, countries that run a larger trade surplus, or smaller trade deficit, as a percentage of GDP tend to have a higher LQ. By contrast, countries with a relatively high trade deficit as a percentage of GDP have a relatively low LQ.
The United States in 2020 had a trade deficit of 3.1 percent of its GDP. This makes the U.S. an outlier among OECD members. Except for Turkey, all other OECD nations had either a smaller trade deficit or a trade surplus. Much of the U.S. trade deficit is a result of the U.S. dollar’s higher value relative to other currencies. As ITIF has noted previously, this is driven by multiple factors, including the dollar’s status as the world’s reserve currency, exacerbated by China’s currency manipulation.[6] Notably, the U.S. trade deficit is not merely limited to just traditional industries, such as metals. Since 2002, the United States has been running a trade deficit in advanced technology products as well.[7]
Figure 130: Trade balance (% of GDP) vs. LQ
Appendix C: Country Groupings
This report includes profiles of selected regional groupings of countries. The members of each of the listed groups is shown as follows:
▪ EU-17: Austria, Belgium, Denmark, Finland, France, Germany, Greece, Italy, Luxembourg, Netherlands, Portugal, Spain, Sweden, United Kingdom, Bulgaria, Croatia, Romania
▪ EU-10: Cyprus, Czech Republic, Estonia, Hungary, Latvia, Lithuania, Poland, Slovakia, Slovenia, Malta
▪ Quad: United States, Australia, Japan, India
▪ Commonwealth: United Kingdom, Canada, Australia, New Zealand
▪ Belt & Road: Austria, Bangladesh, Belarus, Brunei Darussalam, Bulgaria, Cambodia, Cameroon, Chile, China, Costa Rica, Côte d’Ivoire, Croatia, Cyprus, Czech Republic, Egypt, Estonia, Greece, Hungary, Indonesia, Italy, Kazakhstan, Laos, Latvia, Lithuania, Luxembourg, Malaysia, Malta, Morocco, Myanmar, New Zealand, Nigeria, Pakistan, Peru, Philippines, Poland, Portugal, Romania, Russia, Saudi Arabia, Senegal, Singapore, Slovakia, Slovenia, South Africa, South Korea, Thailand, Tunisia, Turkey, Ukraine, Vietnam[8]
Appendix D: Hamilton Index Calculations
|
# |
Metric |
Source |
Calculation |
Example |
|||
|
Country |
Sector |
Year |
Finding |
||||
|
A |
National GDP |
World Bank; IMF |
=(#) |
Korea |
GDP |
2020 |
$1.6T |
|
B |
Global GDP |
World Bank; IMF |
=(#) |
World |
GDP |
2020 |
$85.2T |
|
C |
National Output, Single Sector |
OECD |
=(#) |
Korea |
Computers, Electronics |
2020 |
$107B |
|
D |
Global Output, Single Sector |
OECD |
=(#) |
World |
Computers, Electronics |
2020 |
$1.3T |
|
E |
National Output, Advanced Total |
ITIF |
=SUM(#:#) |
Korea |
All Advanced |
2020 |
$345B |
|
F |
Global Output, Advanced Total |
ITIF |
=SUM(#:#) |
World |
All Advanced |
2020 |
$10.1T |
|
G |
“Global Mkt Share” |
ITIF |
=(C/D) |
Korea |
Computers, Electronics |
2020 |
8.16% |
|
H |
“Domestic Mkt Share” |
ITIF |
=(C/A) |
Korea |
Computers, Electronics |
2020 |
6.53% |
|
I |
“Global GDP Share” |
ITIF |
=(D/B) |
World |
Computers, Electronics |
2020 |
1.54% |
|
J |
“Relative Share” (LQ) |
ITIF |
=(H/I) |
Korea |
Computers, Electronics |
2020 |
4.23x |
About the Authors
Dr. Robert D. Atkinson (@RobAtkinsonITIF) is the founder and president of ITIF. His books include Big Is Beautiful: Debunking the Myth of Small Business (MIT, 2018), Innovation Economics: The Race for Global Advantage (Yale, 2012), Supply-Side Follies: Why Conservative Economics Fails, Liberal Economics Falters, and Innovation Economics Is the Answer (Rowman Littlefield, 2007), and The Past and Future of America’s Economy: Long Waves of Innovation That Power Cycles of Growth (Edward Elgar, 2005). He holds a Ph.D. in city and regional planning from the University of North Carolina, Chapel Hill.
Ian Tufts is a policy analyst at ITIF. His research focuses on the economic implications of innovation and technology policy. He holds a Master of Science in applied economics from The George Washington University and a Bachelor of Science in economics from George Mason University.
About ITIF
The Information Technology and Innovation Foundation (ITIF) is an independent 501(c)(3) nonprofit, nonpartisan research and educational institute that has been recognized repeatedly as the world’s leading think tank for science and technology policy. Its mission is to formulate, evaluate, and promote policy solutions that accelerate innovation and boost productivity to spur growth, opportunity, and progress. For more information, visit itif.org/about.
Endnotes
[1]. Organization for Economic Cooperation and Development (OECD), Trade in Value Added (TiVA) 2022 ed. Principal Indicators (accessed September 5, 2023), https://stats.oecd.org/Index.aspx?DataSetCode=TIVA_2022_C1.
[2]. Because of how companies report income for tax purposes, Ireland appears to have artificially inflated advanced industry output measures.
[3]. Robert D. Atkinson, “Why the United States Needs a National Advanced Industry and Technology Agency” (ITIF, July 2021), https://itif.org/publications/2021/06/17/why-united-states-needs-national-advanced-industry-and-technology-agency/; Robert D. Atkinson, “Why America Should Compete to Win in Advanced Industries” (ITIF, April 2022), https://itif.org/publications/2022/04/11/why-america-should-compete-win-advanced-industries/.
[4]. The momentum index is the sum of the 10 Hamilton industries divided by GDP, after first multiplying each industry’s total value-added output in 2020 by its 2020 LQ and the percentage change in its LQ since 2008.
[5]. Robert D. Atkinson, “Manufacturing and Trade Balances: A Response from Rob Atkinson,” International Economic Law and Policy, February 22, 2023, https://ielp.worldtradelaw.net/2023/02/manufacturing-and-trade-balances-a-response-from-rob-atkinson.html.
[6]. Robert D. Atkinson, “Why Dollar as Reserve Currency Is America’s Achilles Heel,” The Korea Times, July 19, 2022, https://www.koreatimes.co.kr/www/opinion/2022/07/197_333106.html; Adams Nager, “Calling Out China’s Mercantilism,” The International Economy, June 6, 2016, http://www.international-economy.com/TIE_Sp16_Nager.pdf.
[7]. U.S. Census Bureau, Foreign Trade (Trade in Goods with Advanced Technology Products; accessed November 11, 2023), https://www.census.gov/foreign-trade/balance/c0007.html.
[8]. Benn Steil, “Belt and Road Tracker” (Council on Foreign Relations, July 2022), https://www.cfr.org/article/belt-and-road-tracker.
Editors’ Recommendations
December 13, 2023
The Hamilton Index, 2023: Data Visualization for Industries
December 13, 2023
The Hamilton Index, 2023: Data Visualization for Countries
December 13, 2023
