Research and development (R&D) supports long-term growth and competitiveness, especially in the advanced industries that drive national economic and technological strength. This is all the more important as China quickly catches up to—and may have already pulled ahead of—the United States in R&D investments, fueling its expanding lead in these advanced industries. Indeed, as an ITIF analysis found, “In 2023, U.S. GERD totaled $823 billion compared to China’s $781 billion… when adjusted for cost efficiency, China’s R&D spending in 2023 was 2.3 times its actual amount—closer to $1.8 trillion.”
Maintaining U.S. competitiveness vis-à-vis China requires strong R&D nationwide. Yet America’s innovation capacity is unevenly distributed, with R&D increasingly concentrated in a small number of states. According to National Science Foundation (NSF) data from 2022, when taking the average of the 52 states and territories (with available data), only 19 states exceeded the all-state average level of business R&D spending as a share of gross domestic product (GDP)—which gives each state equal weight—and just 13 states surpassed the national average, which weights states by their economic size. Moreover, the number of states exceeding the average has declined, and only a handful of states had R&D expenditures above 5 percent of GDP.
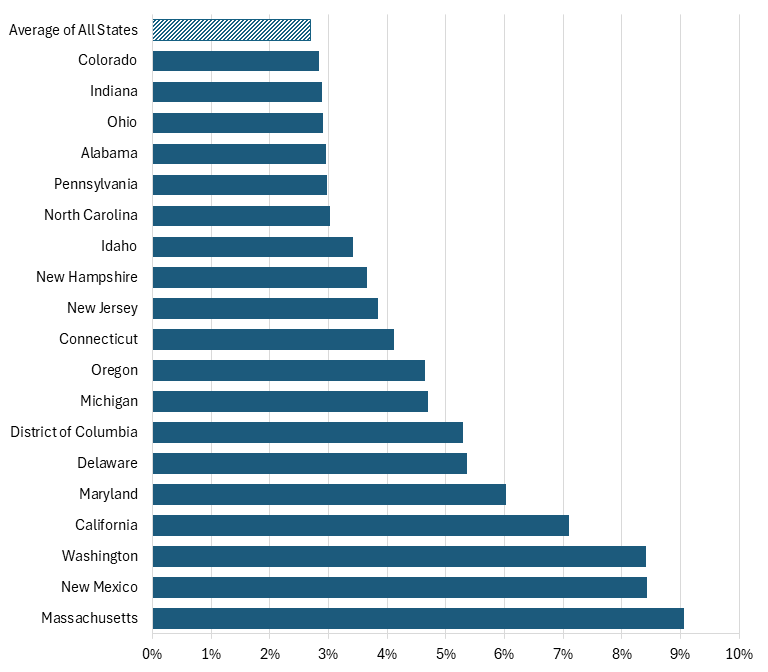
In 2022, the average state spent 2.7 percent of GDP on R&D; only 19 states had R&D intensity above this level. The top performers were Massachusetts, New Mexico, and Washington, with R&D spending as a share of GDP at 9.1, 8.4, and 8.4 percent, respectively. (See figure 1.) This represents a decline from the peak in 2016, when 23 states had R&D spending above the all-state average of 2.1 percent of GDP. In other words, R&D has become more spatially concentrated.
Figure 1: States with R&D as a gross domestic product above the average of all states (states’ economic size not weighted) in 2022
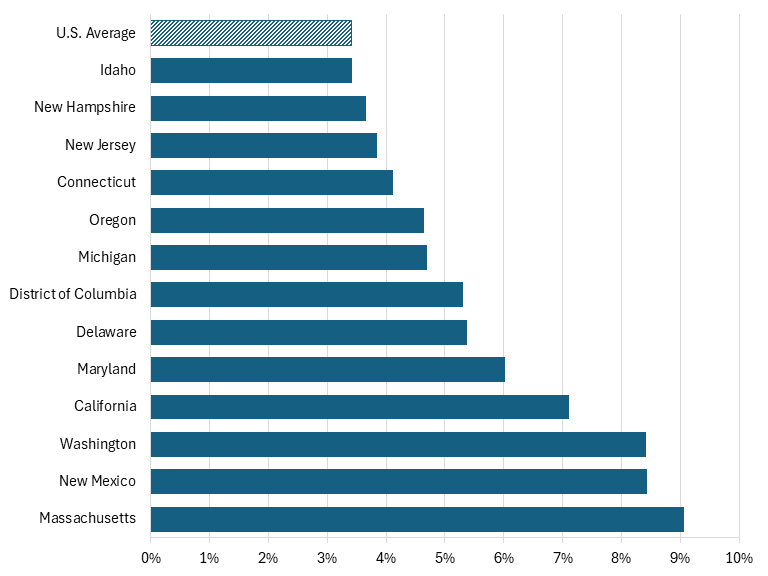
Business R&D is even more concentrated when compared to the U.S. average R&D share of GDP, which takes into account the size of each state’s economy. Only 13 states exceeded the U.S. average of 3.4 percent in 2022. These states were Massachusetts, New Mexico, Washington, California, Maryland, Delaware, the District of Columbia, Michigan, Oregon, Connecticut, New Jersey, New Hampshire, and Idaho. (See figure 2.) This is down from 2010, when 17 states had business R&D above the national average. In other words, business R&D growth has become more geographically concentrated.
Figure 2: States with R&D as a gross domestic product above the U.S. average (weighted by size of state’s economy) in 2022
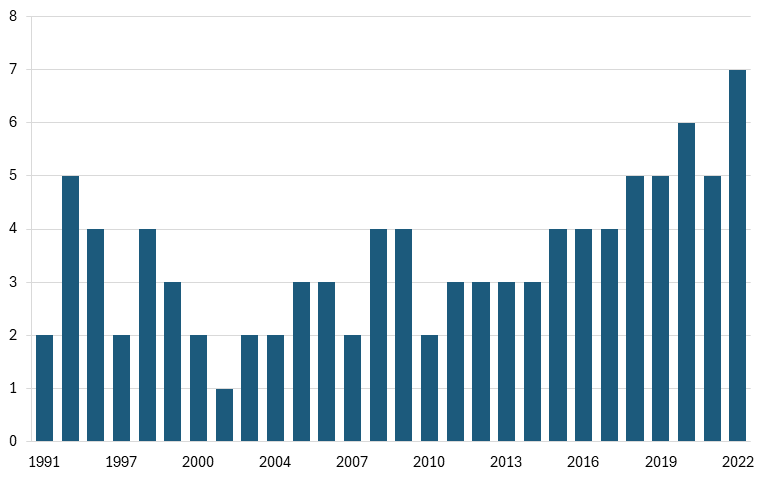
The good news is that seven states’ R&D spending as a share of GDP exceeded 5 percent in 2022—the highest number since 1991. (See figure 3.)
Figure 3: Number of states with R&D as a gross domestic product above 5 percent annually
To encourage R&D growth across all states, federal and state policymakers should strengthen incentives for private-sector R&D and for research conducted at academic institutions. Federal policymakers should increase the federal R&D tax credit to 40 percent and the Alternative Simplified Credit to 28 percent to encourage more firms to invest in innovation. Moreover, they should increase, not cut, funding for academic research, while tying any increases to research that is critical to competing with China. State policymakers, especially those in states with below-average R&D spending, should adopt or expand R&D tax credits and grants to complement federal incentives. This effort is critical as China continues to expand its dominance in advanced industries.