
Underinvestment in Capital Equipment Hinders Canadian Productivity Growth

Canadian firms are underinvesting in productivity-enhancing capital such as machinery, software, and advanced technologies. Without targeted reforms to boost investment and improve data collection, Canada risks falling further behind in global competitiveness and economic growth.
KEY TAKEAWAYS
Key Takeaways
Contents
Introduction
Canada is in the midst of a productivity crisis, with labour productivity increasing just 10 percent over the last decade. And with the United States, Canada’s largest trading partner by a significant margin, threatening a trade war, labour productivity matters more than ever in order to protect economic competitiveness, sustain living standards, and preserve strategic autonomy. Yet, despite widespread awareness of the problem, the reasoning for Canada’s poor productivity performance remains a mystery, with many explanations offered, including inadequate spending on research and development (R&D), too much low-skilled immigration, regulatory burden, interprovincial trade barriers, and of course, limited capital investment.
The most important step policymakers should take to turn around the productivity crisis is to move beyond conjecture to in-depth analysis of why most Canadian organizations are failing to adequately raise productivity, that is to say, their output per hour worked. This should include a deeper analysis into the drivers and performance of capital investment.
While there are many drivers of labour productivity, the most important is better “tools,” particularly new machinery, equipment, and software.[1] There is a general consensus that Canadian organizations invest too little in these tools.[2] In an era when Canadian firms will have to compete more broadly on the global market because of reduced trade with the United States, this underinvestment is a strategic vulnerability, leaving Canadian firms less able to adapt and succeed.
This report examines the role of capital investment in Canadian productivity growth. It finds that Canadian industries, overall, aren’t investing enough in productive capital expenditures (software, industrial machinery, and computers and electronics). Addressing the capital investment conundrum requires a multifaceted solution, with both broad-based and tailor-made strategies for each industry.
Productivity
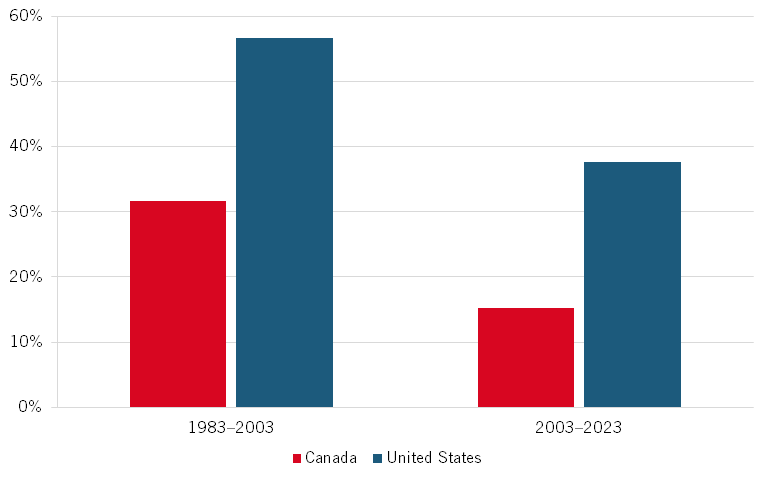
Canada’s labour productivity performance (output per worker hour) has been dismal. This can be seen by comparing Canadian labour productivity growth with that of the United States. From 1983 to 2003, this U.S. growth was 78 percent faster than Canada’s. Yet, from 2003 to 2023, U.S. growth in labour productivity was an astounding 148 percent faster. (See figure 1). While both economies’ growth rates fell in the latter period, America’s productivity declined by 34 percent, while Canada’s declined by an astonishing 52 percent!
Figure 1: United States and Canadian labour productivity growth rates, 1983–2003 vs. 2003–2023[3]
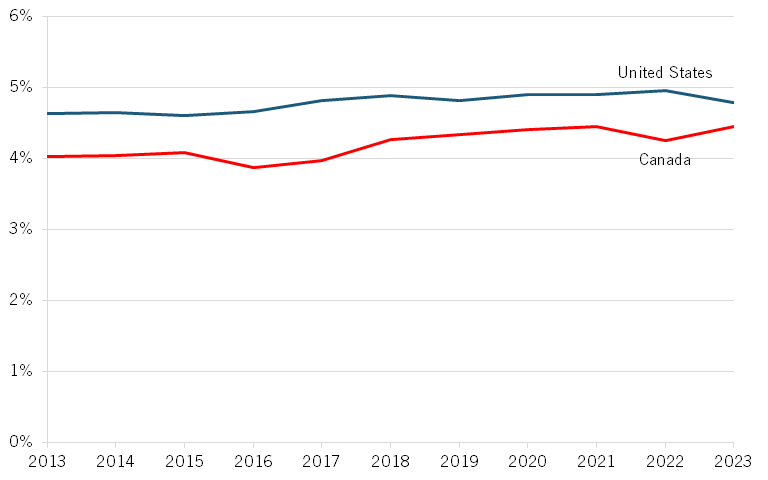
Between 2000 and 2022, U.S. labour productivity, despite also experiencing a slowdown in recent decades, grew at an annualized rate of 1.5 percent while Canada’s grew by only 1 percent. (See figure 2.)[4]
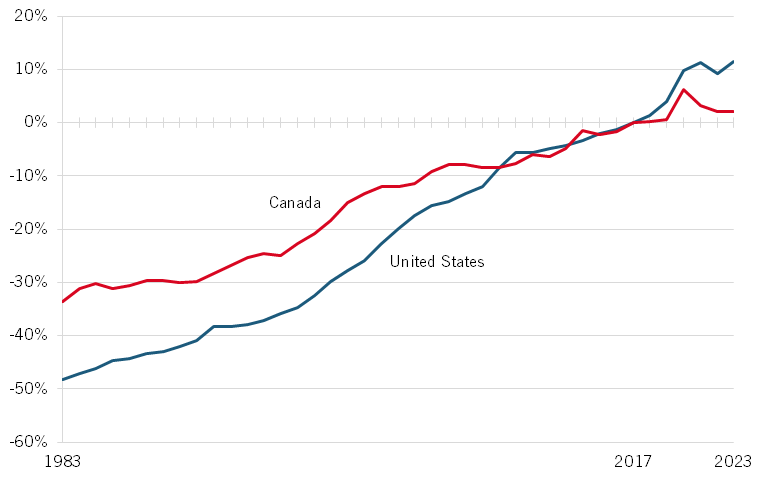
Figure 3 provides the same data with both countries’ productivity indexed to 2017. As shown, the United States grew faster for both periods—although from 2010 to around 2016, Canada’s growth kept pace—only to face an even sharper decline since then. In this study, we analyze this critical change in Canadian investment. Note that figure 3 does not show that Canada’s labour productivity was higher than the United States’ prior to 2017, merely that Canada’s rate of productivity growth slowed compared with that of the United States.
Figure 2: Labour productivity (2010 $US PPP per hour)[5]
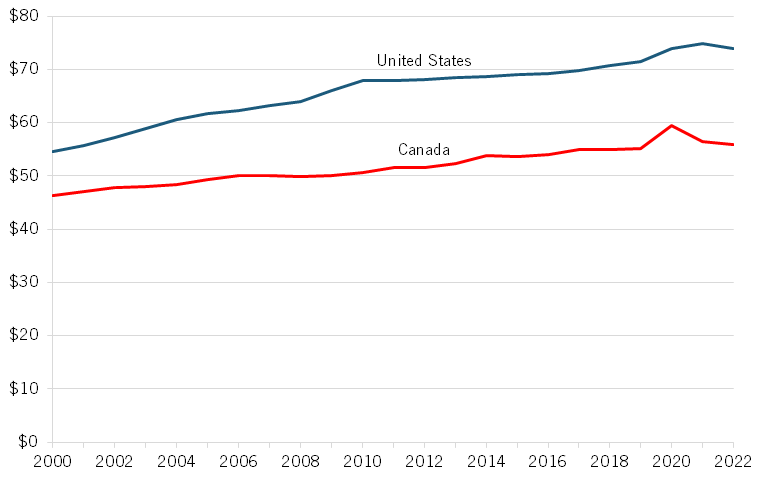
Figure 3: U.S. and Canadian labour productivity compared with base year (2017)[6]
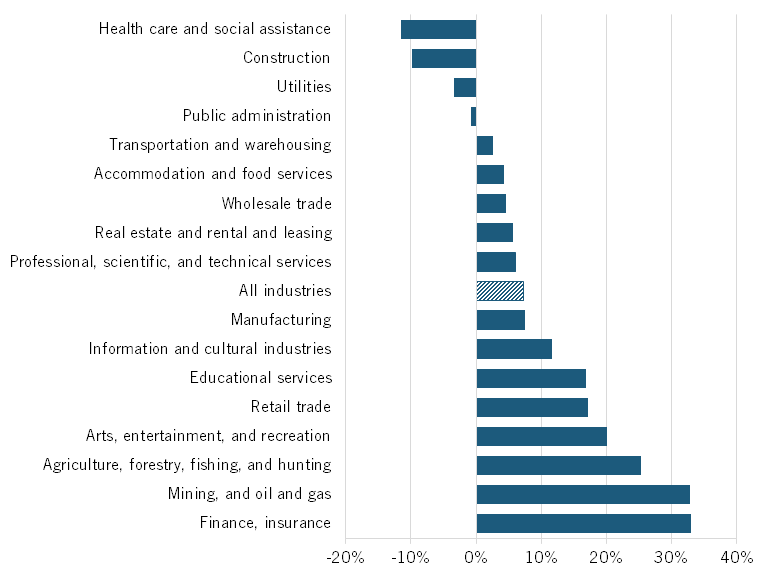
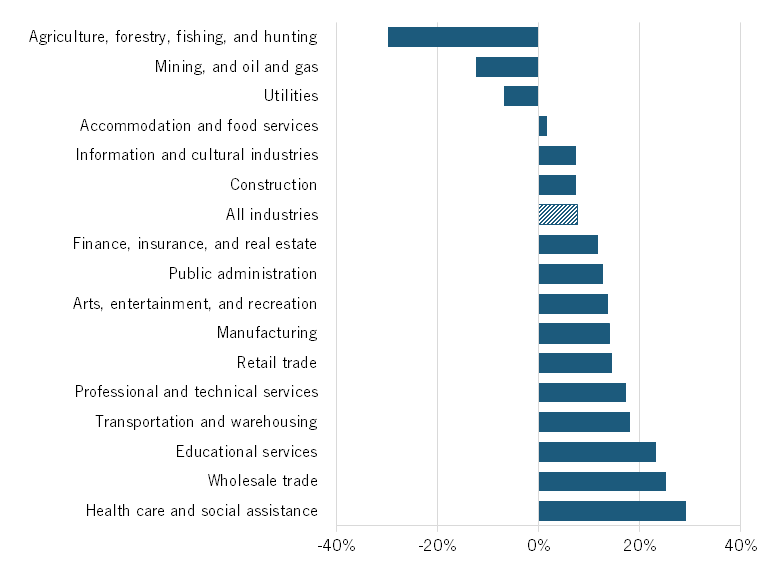
As noted, Canadian productivity grew just 7 percent from 2013 to 2023, with industries differing significantly in labour productivity growth. Agriculture, finance, and mining, oil, and gas all experienced large increases, while government, utilities, construction, and health care actually became less productive (figure 4).[7] Two key sectors—manufacturing and professional, scientific, and technical services, had about average productivity growth.
Figure 4: Change in labour productivity, 2013–2023[8]
Capital Investment
Increased capital investment boosts labour productivity. And it is a lack of this capital investment that is a key component of Canada’s ailing productivity performance.
Unfortunately, Statistics Canada does not publish publicly available data on industry capital expenditures at a granular level. Industries are categorized using the North American Industrial Classification System (NAICS) codes, with more-specific industries characterized by more digits in their NAICS code. For example, manufacturing has an NAICS code of 31, while beverage and tobacco manufacturing has an NAICS code of 312.
The most granular dataset on investments and gross capital stocks is only available at the three-digit NAICS code level. Yet, this data lacks specificity on what type of capital is being invested in, classifying capital as one of four assets: non-residential buildings, engineering construction, machinery and equipment, and intellectual property products. While machinery and equipment includes productive capital such as computers and industrial machinery, it also includes types of capital that yield little productivity gains, such as furniture and company uniforms. The category of intellectual property products includes software, a productive asset, but also includes expenditures on mineral exploration (which expands output, but not necessarily productivity). In other datasets where assets and investments are more precisely classified, industries are only distinguished by their two-digit NAICS codes, with categories such as manufacturing and retail trade.
In addition, Statistics Canada lists capital expenditures as any item that companies purchase that depreciate over more than a year, even if purchases are largely consumption expenditures such as furniture, muddying the discourse when policymakers seek to increase investment in capital. This is misleading. Any analysis of the relationship between productivity and capital investment should focus solely on capital that can make workers more productive.
In table 1, we reclassified capital types based on their expected impact on productivity, something Statistics Canada currently does not do. Descriptions of each kind of capital can be found in the appendix (table 3) and in the Methodology section.
Table 1: Change in capital expenditures relative to GDP (2011/2012–2021/2022*)[9]
|
Type of Capital |
Productive? |
Capex Change / GDP |
|
Total non-residential |
-20% |
|
|
Total productive capital |
1% |
|
|
Software |
Y |
47% |
|
Plastic and rubber products |
N |
**23% |
|
Textiles, clothing, leather products, and similar materials |
N |
**16% |
|
Fabricated metallic products |
N |
5% |
|
Computer and electronic products |
Y |
-2% |
|
Research and development |
N |
-6% |
|
Transportation equipment |
N |
-16% |
|
Non-residential buildings |
N |
-17% |
|
Industrial machinery |
Y |
-26% |
|
Engineering construction |
N |
-32% |
|
Mineral exploration and evaluation |
N |
-59% |
|
Furniture and related products |
N |
-61% |
|
Other manufactured products and custom work |
N |
-65% |
|
Electrical equipment, appliances and components |
N |
-68% |
|
Wood products |
N |
**-79% |
|
Non-metallic mineral products |
N |
**-100% |
* To account for fluctuations in annual investment, percentage change was calculated as the change between two base values: the average investment relative to GDP in 2012 and 2013, and the average investment relative to GDP in 2022 and 2023.
** Expenditures average less than $100 million annually, with large swings from year to year.
At the same time, investments in software increased by 47 percent, while investments in industrial machinery fell. Capital investments measured annually are subject to large fluctuations in some instances.
Figure 5 puzzlingly shows virtually no correlation between machinery and equipment investment and productivity by industry. Because new capital investment has a delayed impact on productivity, this relationship is displayed using a two-year lag where capital investment is measured from 2011 to 2021 while productivity is measured from 2013 to 2023. To account for fluctuations in annual spending, capital investment is measured as the sum of annual machinery and equipment investment relative to value added. Productivity is measured as the percentage change in output per hour. Agriculture, mining, and finance were removed from this analysis due to abnormally high productivity growth, skewing the results of the Canadian economy writ large. In the case of agriculture and mining, oil, and gas, uneven yields and a difficulty in applying accurate price deflators at the aggregate level result in measurement difficulties in productivity, while productivity in the finance and real estate sector is too heavily affected by residential real estate prices, a factor entirely independent of levels of capital investment in said industry.
Figure 5: Gross investment in machinery and equipment relative to value added vs. productivity growth[10]
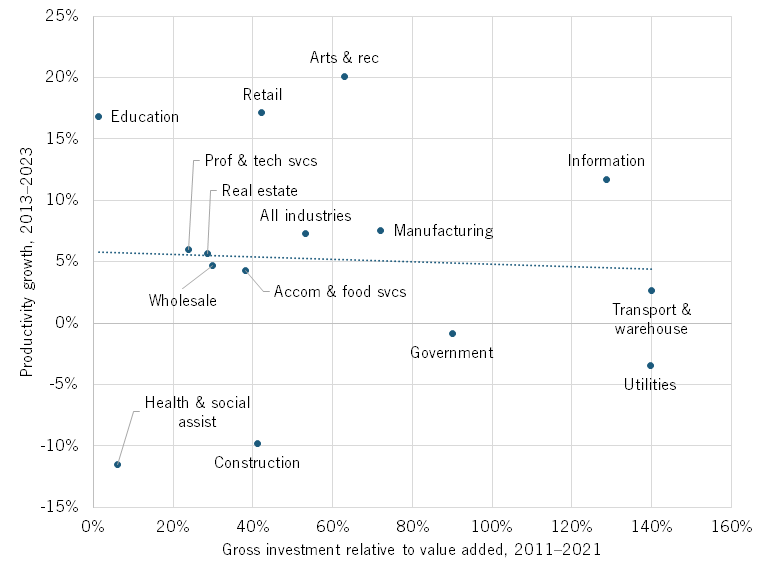
A lack of specificity in measurement could explain this weak correlation. Because machinery and equipment encapsulate productivity-enhancing technology as well as equipment that is likely to do little to boost productivity (e.g., furniture, work uniforms, and company cars), the correlation between it and productivity is not as precise as this analysis requires. Additionally, under Statistics Canada’s categorization, machinery and equipment does not include software, a highly productive asset. The weak correlation between productivity and economy-wide machinery and equipment investment could also account for the growth of software investments by firms, as money that may have once been invested in machinery is reallocated to software expenditures.
Furthermore, productivity outcomes lag capital investment and are filtered through management quality, training, and firm structure. That’s why simple correlation is weak, even though causality still runs through capital.
To better understand capital investment and productivity, we focus on productivity-enhancing capital: industrial machinery, computers and electronics, and software.
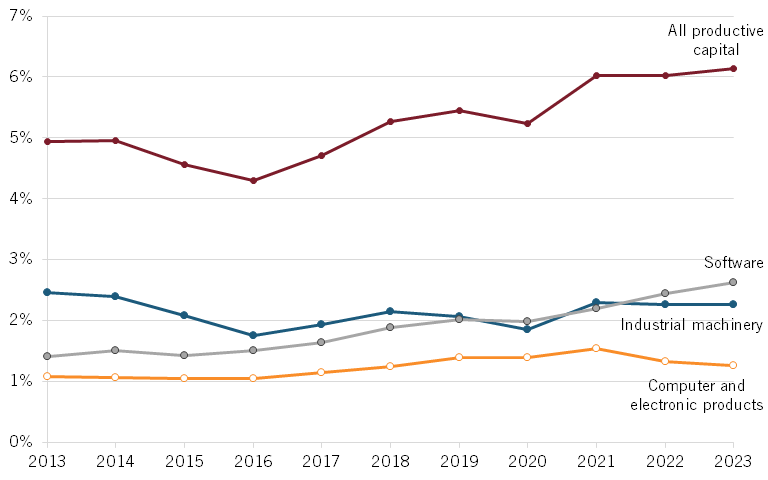
Figure 6 shows productive capital investments (as denoted in table 1) as a share of gross domestic product (GDP) for the period of 2013 to 2023. Acknowledging that investments fluctuate annually, we can see that investment in industrial machinery fell slightly, investment in computer and electronic products was unchanged, and software expenditures rose. Overall, investments in productive capital fell during the COVID-19 pandemic and then rebounded by 1 percentage point higher than in 2013.
Figure 6: Productive capital expenditures relative to GDP[11]
There is a positive, albeit weak, correlation (0.11) between the gross investment in productive capital from 2011 through 2021 and productivity growth from 2013 to 2023 for major industries. (See figure 7.) Once again, we use a two-year lag to account for delays in implementation and use, meaning that we estimate that capital investments made at any given point in time will take at least two years to have any meaningful impact on productivity.
Figure 7: Gross investment in productive capital relative to value added vs. productivity growth[12]
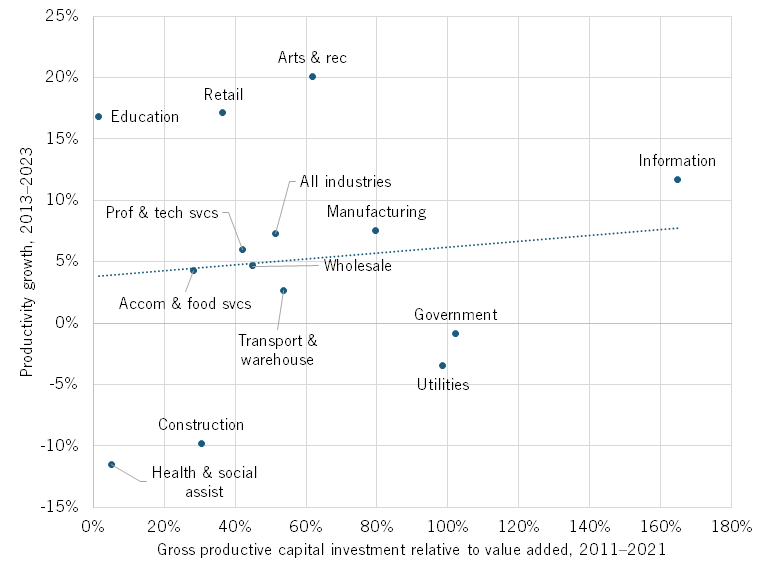
The weak correlation between capital investment and productivity does not indicate that there is no relationship between the two variables, but rather that the connection is influenced by many factors. Capital investment is a necessary condition for productivity growth, but not a sufficient one by itself. Gains in productivity often depend on how effectively capital is deployed—whether businesses are investing in the right types of assets, those assets are integrated into efficient processes, and workers are trained to use them effectively. In other words, the quality, timing, and context of investment matter just as much as the quantity. Weak correlations may also ignore structural barriers that prevent capital from translating into output improvements.
Capital Stocks
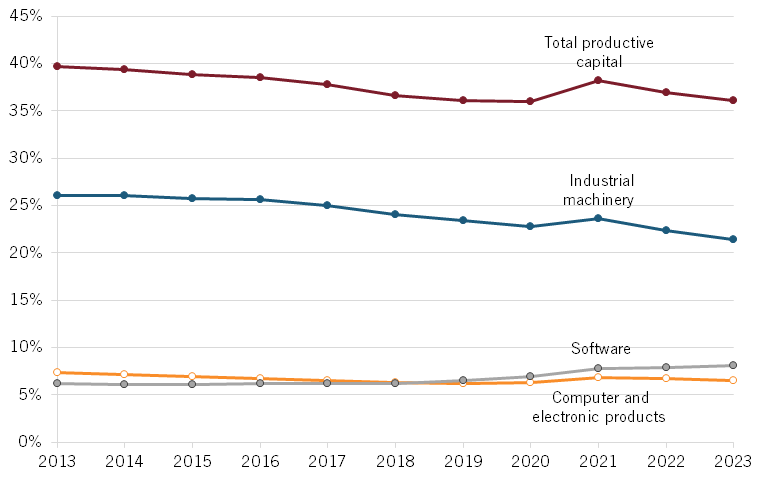
Capital depreciates. As such, it is important to measure the amount of capital stock, the inventory of capital assets in an economy, and not just annual investment at any given time, which can vary significantly year over year. Canada’s productive capital stock declined 8 percent as a share of GDP between 2013 and 2023 (see figure 8), a troublingly high rate.
More importantly, the critical capital stocks of industrial machinery and computers and electronics decreased 19 percent and 10 percent, respectively. In contrast, software capital stock increased, but not enough to make up for these declines. Productive capital stock relative to GDP increased briefly in 2020, but that was caused by a decrease in Canada’s GDP during 2020, with capital stocks remaining relatively flat, as opposed to an actual increase in capital stock.
Figure 8: Productive capital stocks relative to GDP[13]
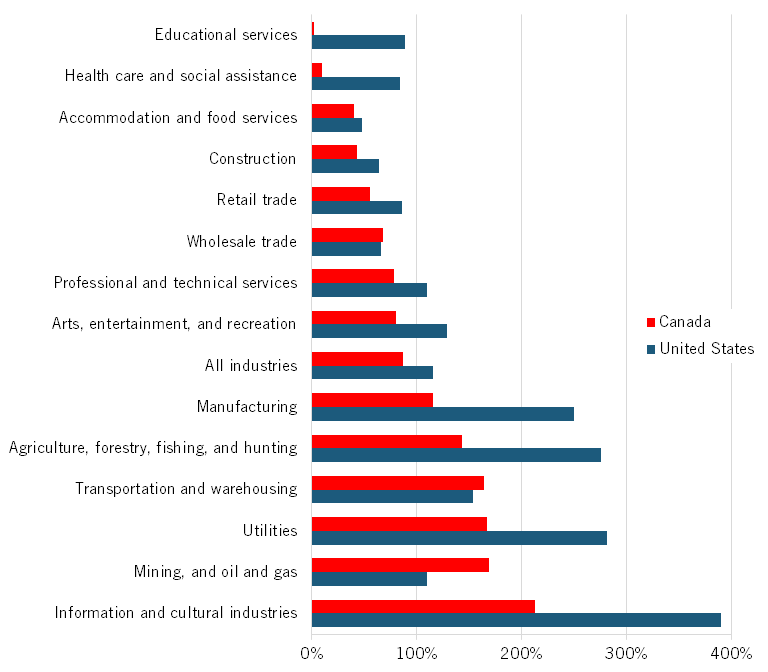
Certain industries, such as accommodations and food services, educational services, and wholesale trade, saw large increases in productive capital stocks relative to value added (figure 9). Notably, the accommodations and food service industry saw significant reductions in output from 2019 to 2020 due to the COVID-19 pandemic (24 percent and 36 percent reductions in value added, respectively). This industry struggled to see output return to pre-pandemic levels as of 2023, so while capital investment increased moderately, the capital stocks as a share of value added shot up as a result.
Figure 9: Change in productive capital stocks relative to value added, 2013–2023[14]
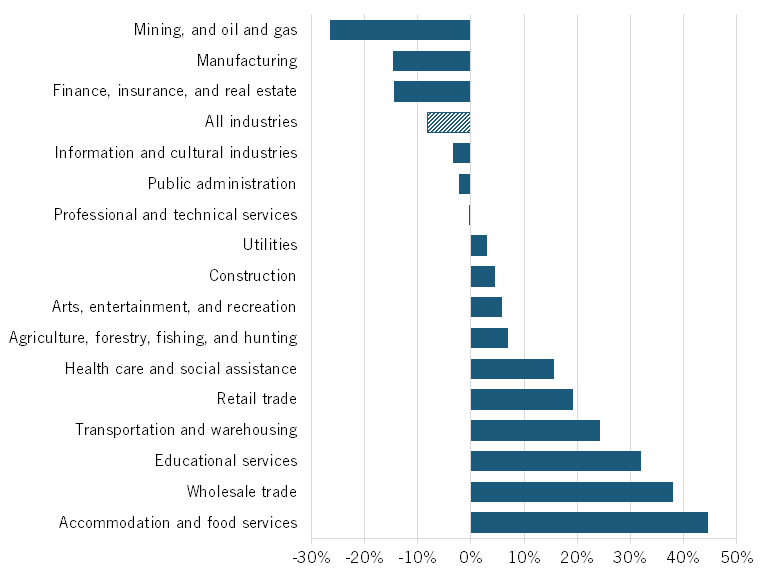
Conversely, the mining, oil, and gas and finance, insurance, and real estate industries have seen large increases in productivity (figure 4) over the last decade, yet their productive capital stocks have decreased at the same time. For the mining, oil, and gas industry, this increase in productivity can likely be attributed to the long lag from the capital deepening during the oil sands development in the 2000s that the sector is now benefiting from, while new capital expenditures have still not returned to their peak in 2012. Furthermore, the war in Ukraine in February 2022 resulted in a spike in global crude oil prices, meaning that the output of the oil sector in particular grew without changes to the operation. Meanwhile, the finance, insurance, and real estate industries have seen immense change in how they do business since 2003, with firms being able to scale their operations significantly without physical expansion (e.g., a bank or insurance brokerage being able to serve more customers without physical locations or cheque processing machines), thereby boosting productivity without increasing capital stock.
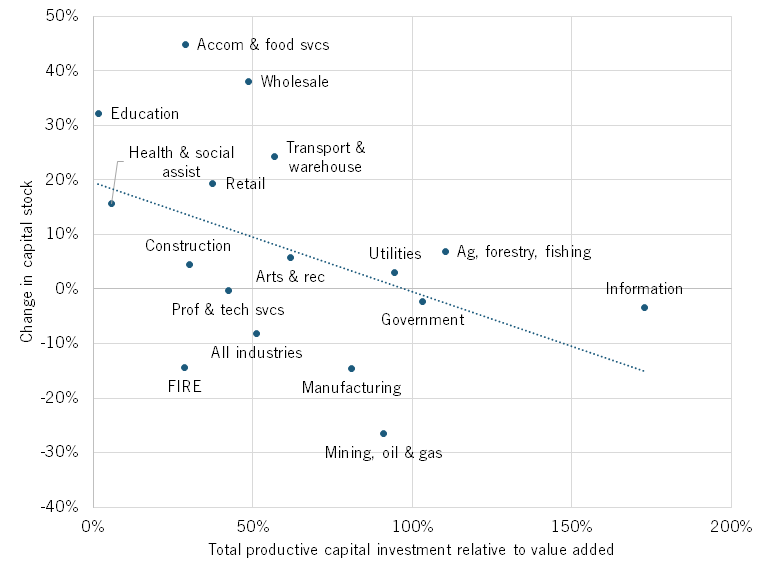
Figure 10 illustrates the relationship between the sum of productive capital expenditures relative to value added and the change in capital stocks by industry from 2013 to 2023. Greater capital expenditures generally increase capital stocks; however, the degree to which capital expenditures lead to increased capital stocks can also depend on whether firms are opting to retire productive capital assets earlier than anticipated due to advancements in functionality or efficiency. The rate of capital retirement differs across industries.
Surprisingly, we find a negative correlation of 0.43 between the sum of productive capital investment and the change in productive capital stock between 2013 and 2023. Industries that invested more in productive capital (industrial equipment, computers, and software) saw a larger decline in capital stock. This contradiction underscores a key policy challenge: Firms are investing, but the capital is either poorly targeted, prematurely retired, or outpaced by depreciation. Measuring “input dollars” alone misses whether those dollars build capacity. One possible explanation is there may be a misalignment between how Statistics Canada is reporting capital stocks and capital expenditures. Another is that the measure of capital stock relative to value added may not accurately represent capital accumulation in a period when COVID-19 weakened many industries.
Many industries saw high rates of annual capital investment while capital stocks declined. Information and cultural industries, manufacturing, and mining, oil, and gas saw capital stocks decrease by 3, 15, and 27 percent, respectively, while each industry invested more than most others.
The finance and real estate industry also experienced significant capital stock declines (14 percent), while it maintained stable capital investment during this period. This could be due to larger structural shifts in the respective industries towards a more cost-efficient and productive capital inventory, such as digital banking and fintech in the finance industry. These shifts can cause firms to retire assets earlier than expected, reducing stocks while increasing capital investments.
Figure 10: Total investment in productive capital relative to value added vs. change in capital stocks, 2013–2023[15]
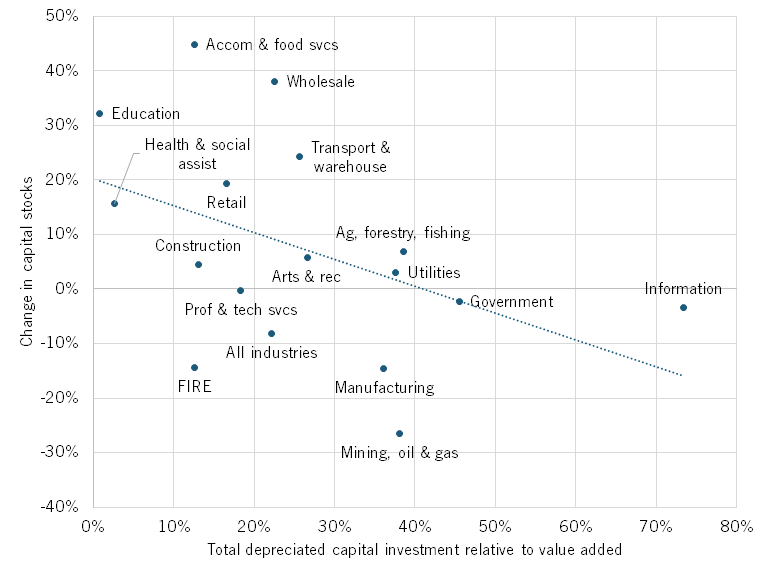
Because capital depreciates over time, adding up total capital investment relative to GDP from 2013 to 2023 would ignore the fact that capital purchased in 2013 is not worth today what it was worth then. Figure 11 shows the relationship between capital stocks and total productive capital investment after depreciation. Statistics Canada reports that productive capital depreciates at an average rate of 20 percent per year, meaning capital that was purchased at $1,000 in 2022 was worth $800 in 2023.[16] There is a moderate negative relationship between these two variables (correlation coefficient of -0.45).
Figure 11: Total depreciated capital investment relative to value added vs. change in capital stocks, 2013–2023
There is a positive correlation between the change in relative capital stocks and productivity growth (0.07), corroborating the assumption that productive capital stocks lead to enhanced productivity. However, a few industries were outliers in this analysis. Mining, oil, and gas, finance, and agriculture and forestry were once again removed from the analysis due to outlier levels of productivity and capital stock values.
At the same time, certain industries—manufacturing and the information and cultural industries—saw productivity increase while capital stocks declined. In the information and cultural industries, capital stocks recovered from the COVID pandemic slower than did value added, meaning we can likely expect capital stocks to return to normal growth in the near future. In manufacturing, capital stocks declined steadily between 2013 and 2020, but they have begun to recover. If these trends continue, we can also expect capital stocks and productivity to have a positive relationship in the manufacturing sector in the near future.
Figure 12: Change in productive capital stocks relative to value added vs. productivity growth, 2013–2023[17]
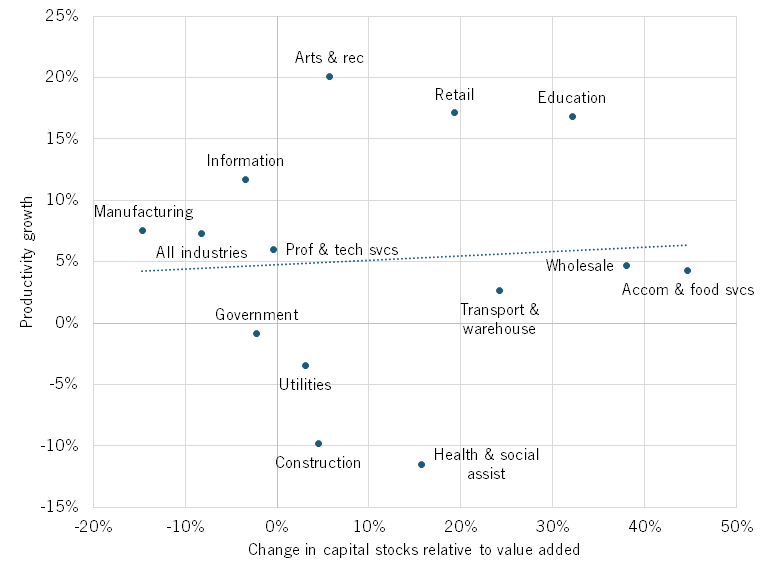
Many industries with positive capital stock growth rates also experienced positive productivity growth, indicating a positive relationship between capital and productivity.
A number of industries also saw positive growth in relative capital stocks while productivity declined, including construction, health care, and utilities. All three industries were hit hard by COVID, leading to productivity declines that persisted up until 2023. The health care and social assistance sector saw a dramatic drop in productivity between 2022 and 2023, which could possibly be explained by Canada’s overburdened health-care system in recent years, characterized by resource constraints and staff shortages. These have reduced the sector’s capacity to deliver quality care per worker hour efficiently.[18]
Figure 13 shows how capital stock, in absolute terms, relates to productivity. This figure mitigates the impact of pandemic recessions by not including value added in capital stock calculations. There is a positive correlation of 0.20, indicating that there is a stronger relationship between productive capital and productivity when negative economic shocks, such as the pandemic, are controlled for in the analysis.
Figure 13: Capital stock growth versus productivity growth, 2013–2023[19]
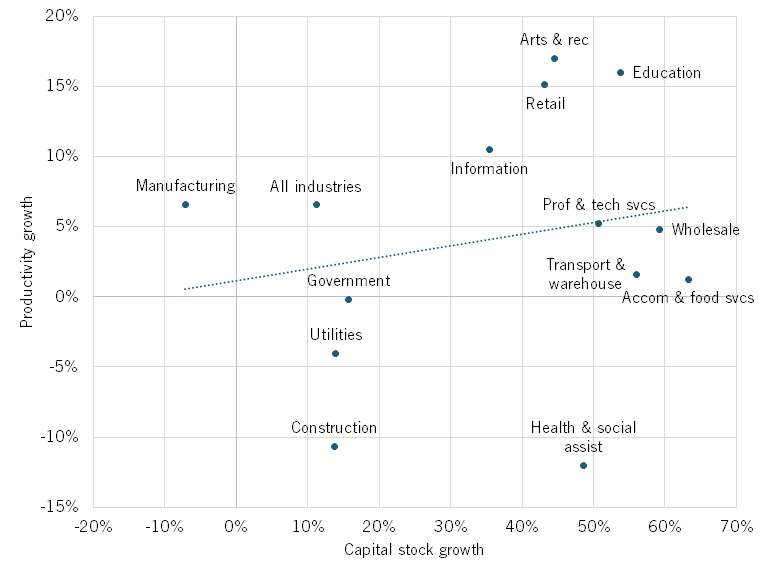
Of course, these correlations do not imply causation. Mismeasurement of either output or capital is a possibility. As are other forces at play affecting productivity growth and capital intensity. While there appears to be a positive correlation across all industries between increases in capital stock and increases in productivity, some industries, as discussed, show a different relationship. Other possible, general reasons for this relationship can be found below in table 2.
Table 2: Possible reasons for weak negative correlation between productivity and capital stock
|
Increasing Productivity Growth, |
Decreasing Productivity Growth, |
|
Productivity boosts due to efficiency optimizations and belt-tightening during times of economic uncertainty and high interest rates |
Entry of unproductive firms purchasing new capital stock |
|
Firms shifting towards asset-light models by outsourcing or leasing (software as a service, agricultural solutions as a service, etc.) |
Improper training for workers resulting in underutilization of new capital |
|
Automation replacing expensive physical capital with relatively inexpensive software solutions |
Unwillingness to adopt new technologies and instead replacing aging capital instead of upgrading |
|
Greater proportion of value added being derived from low-capital activities such as R&D and design |
Green retrofits or regulatory compliance upgrades that have no discernible impact on productivity |
Depreciation
Investment in capital assets lasts a finite amount of time. The lifespan of capital stock can vary depending on wear and tear or technological obsolescence, and these capital assets generally decline in value over time. This is called capital depreciation, and part of the purpose of capital expenditures is to, at minimum, keep pace with the depreciation of a firm’s stock of capital assets to maintain its productivity. Thus, a firm or industry can increase capital expenditures even relative to value added and still see decreasing capital stock due to depreciation. Net capital investment is an approximate measure for determining whether depreciation exceeds capital expenditures by subtracting the two values.
Figure 14 shows the gross productive capital investment minus gross depreciation in the five years between 2019 to 2023. Most industries had net positive investments in productive capital, excluding the agriculture and forestry, mining, oil, and gas, and utilities industries. These negative net capital investment values show that the decline in capital stocks in the agriculture and forestry industry and mining, oil, and gas industry (figure 9) are not simply due to structural shifts or early capital retirement, but rather because capital expenditures are not keeping pace with depreciation. Notably, all three industries with negative net capital investment are commodities-based industries, which saw significant fluctuations in profitability and uncertainty during the pandemic years, which likely limits firms’ ability to invest in new capital.
Should the decline in these industries continue, their capital stock will be depleted over time, which may lead to lower levels of productivity, as workers will have limited access to productivity-enhancing machinery, equipment, and software.
Other industries that experienced decreased capital stocks from 2019 to 2023, such as finance, insurance, and real estate and manufacturing, had net positive investment values, meaning the reduction of capital stocks in these industries can likely be attributed to the early retirement of capital or misuse of capital rather than depreciation.
Figure 14: Average net capital investment in productive capital, 2019–2023 (% of depreciation)[20]
Adoption of Robotics
Not all capital investment is equal when it comes to driving productivity. That is why Statistics Canada needs to collect much finer-grained detail on the types of capital investment, including AI, sensors, 5G, 3D printing, and of course robotics. Under the capital expenditures data, robotics would be categorized alongside industrial machinery; but a robotic assembly line and a printing press have very different impacts on labour productivity.
Robotics adoption is increasingly becoming a key to boosting productivity.[21] A study showed that investment in robots contributed to 10 percent of GDP growth per capita in Organization for Economic Cooperation and Development (OECD) countries from 1993 to 2016, and there is a 0.42 correlation between a country’s wage-adjusted manufacturing robot adoption and growth in productivity between 2010 and 2017.[22] The same study also found that a one-unit increase in robotics density (which the study defined as the number of robots per million hours worked) is associated with a 0.04 percent increase in labour productivity. A study by the Institute for Employment Research found that robot adoption led to a GDP increase in Germany of 0.5 percent per person per robot over 10 years from 2004 to 2014.[23] Another study found that introducing industrial robots in Spanish manufacturing firms boosted output by 20 to 25 percent and reduced labour-cost share by approximately 6 percent within four years.[24]
Yet, the adoption of robotics in Canada is far behind that of most OECD countries. In 2022, Canada ranked just 17th in the world for manufacturing robotics adoption. (See figure 15.)[25]
Figure 15: Robots per 10,000 manufacturing workers, 2022
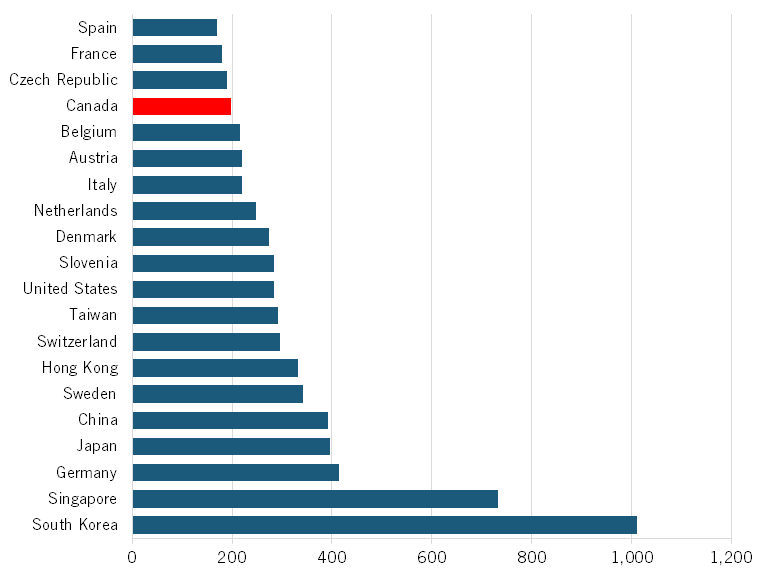
According to Statistics Canada, just 2 percent of firms had adopted robotics technology by 2022, while 95 percent reported that they did not believe robotic technology would apply to their business. [26] Many Canadian firms do not see the potential in robotics despite possible productivity-boosting applications in manufacturing, retail, utilities, and agriculture. Firms that did adopt robotics technology saw an increase in productivity and an increase in employment of 20 percent. Manufacturers were the largest adopters of robotics technology in Canada as of 2022, with 8.8 percent of manufacturers utilizing the advanced technology.[27]
Adoption of AI
Like other major technological advances, the age of AI promises to completely alter the way business is done across all industries, presenting the potential for significant boosts in productivity. The number of AI-related jobs in Canada is now growing faster than in any other country, an encouraging sign as Canadian firms struggle to boost productivity. The majority of these jobs are likely located in the information and cultural industries sector, which contains information technology jobs, explaining the high AI adoption rate in this industry relative to others in Canada. Canada being a world leader in developing AI is no surprise, with Geoffrey Hinton winning the Nobel Prize in Physics in 2024 and many world-leading AI firms being founded in Canada.[28]
Figure 16: Annual growth rate of the share of workers with AI-related jobs[29]
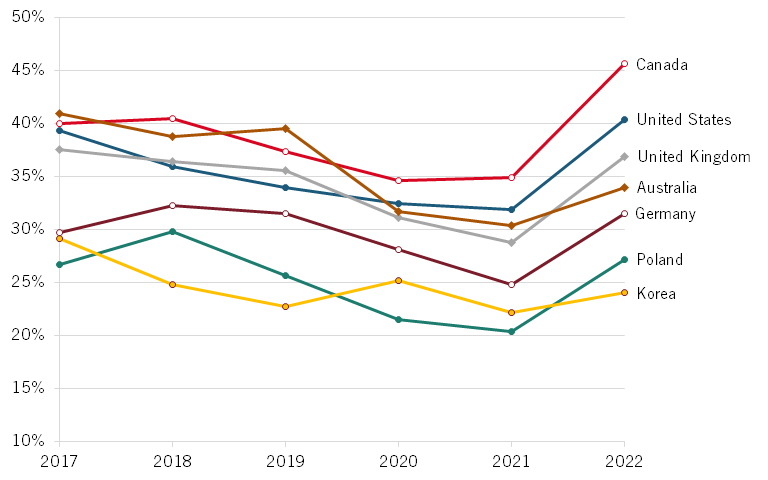
However, fears and skepticism of the technology’s applicability and long-term impacts have slowed adoption among firms. Studies show that AI adoption can add 0.1 to 0.6 percentage points annually to labour productivity.[30] Despite being a global leader in creating AI, Canadian AI adoption has fallen behind that of the United States across all industries. (See figure 16.) In almost all industries, barring the information and cultural industries, AI adoption is less than half that of the United States. It is worth noting that due to differences in data availability, U.S. estimates show the number of firms that have used AI in the six months prior to data collection (December 2023 and January 2024), while Canadian estimates show the number of firms that used AI over the 12 months before data collection (the second quarter of 2024), which should even slightly increase the amount of Canadian firms captured in the data relative to the United States.
Figure 17: Share of firms adopting AI, 2023–2024[31]
U.S. Comparison
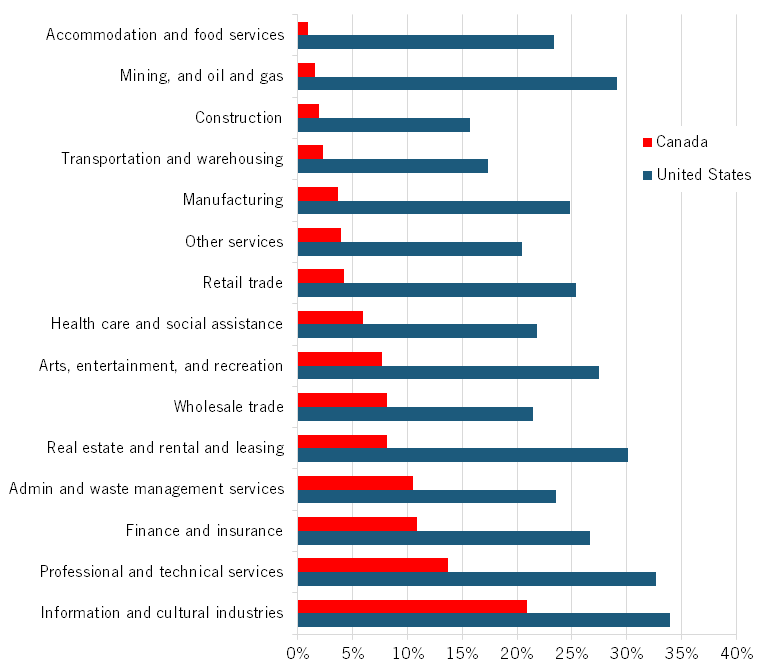
With the United States seeking to impose tariffs on Canadian goods, it is worth examining how Canadian capital investment and productivity compare with that of the United States. Figure 18 shows machinery and equipment and intellectual property capital expenditure (including productive and unproductive capital) as a share of value added by industry. Data regarding specific types of capital expenditures organized by industry are not made available by the U.S. Bureau of Economic Analysis (e.g., data on the U.S. manufacturing industry’s spending on industrial machinery is not available).
Figure 18: Capital expenditure relative to value added, 2013–2023[32]
Overall, the United States invested more as a share of GDP than did Canada from 2013 to 2023. On average, 11 percent of U.S. GDP was invested annually in machinery and equipment and intellectual property, compared with just 8 percent in Canada. In most industries, the United States outpaced Canadian industries by large margins, including agriculture and forestry, information and cultural industries, and manufacturing. Mining, oil, and gas and transportation and warehousing are the only two industries where capital investment in Canada exceeded the United States.
Canadian industries have consistently underinvested in productive capital compared with the same industries in the United States.
The pandemic severely affected both industries in Canada, which have seen their output drop significantly since 2019, skewing relative investment. In absolute terms, capital investment in both of these Canadian industries has either fallen (in the case of the mining industry) or stagnated (transportation and warehousing). Additionally, these measures take into account unproductive capital (e.g., furniture and fleet vehicles), confounding the results of this analysis. While Canadian firms may, in some industries, be investing more than similar firms in the United States in relative terms, it would be far more useful to examine how Canadian firms compare with U.S. firms in their expenditures on exclusively productive capital.
The gap between the two countries has begun to close in recent years. While the gap in relative productive capital investments between Canadian industries and U.S. industries were just under 1 percentage point in 2017, Canada’s rate of change has increased slightly and the gap between the two growth rates is now less than half a percentage point. Productive capital in the United States is defined as software, information processing equipment, and industrial equipment, and exclude fabricated metal products and electrical transmission, distribution, and industrial apparatuses. The asset types used for Canada are software, industrial machinery, and computer and electronic products. For a more detailed description, see appendix table 4.
Figure 19: Productive capital expenditures relative to value added, 2013–2023[33]
U.S. productivity had a similar level of correlation to productive capital expenditures (0.78) as did Canada (0.76).
While productive capital may have similar impacts on Canadian and U.S. productivity, there are undoubtedly areas in which Canada can learn from its U.S. counterparts. Research in 2012 looking at the impacts of software investments on productivity of U.S. multinationals in Europe relative to European multinationals in the same markets showed that despite making the same types and amounts of investments into software, U.S. multinationals saw larger productivity boosts than did their European counterparts.[34] These advantages are not inherent to some sort of geographic or historical exceptionalism, but rather from tougher management practices. Therefore, to combat diminishing returns and suboptimal capital utilization, investments in human capital need to be made, such as training and upskilling for workers and managers, as well as the implementation of more rigorous management practices in Canadian firms.
The size of Canadian firms may also play a key role in Canada’s productivity conundrum. Statistics Canada has well documented the importance of small businesses in the Canadian economy. Small businesses (firms employing fewer than 500 employees) contributed 48.2 percent, on average, to the Canadian GDP between 2016 and 2020.[35] In contrast, small businesses represented just 43.5 percent of GDP in the United States.[36] Differences in production process and capital intensity lead small firms to be less productive than large firms; however, exactly how much of a productivity disadvantage small firms have is essential information. According to a report published in 2014, Canadian small businesses were just half as productive as large firms; U.S. small firms, on the other hand, were 67 percent as productive.[37]
Canada needs more large firms to make necessary productivity gains, meaning small firms must take steps to expand and improve production. Statistics Canada should conduct another study analyzing the productivity disadvantage of small firms in Canada in comparison with the United States and other comparable economies.
Causes for Declining Capital Expenditures
Several explanations have been made for Canada’s sluggish growth in capital expenditures and the resulting productivity slump.
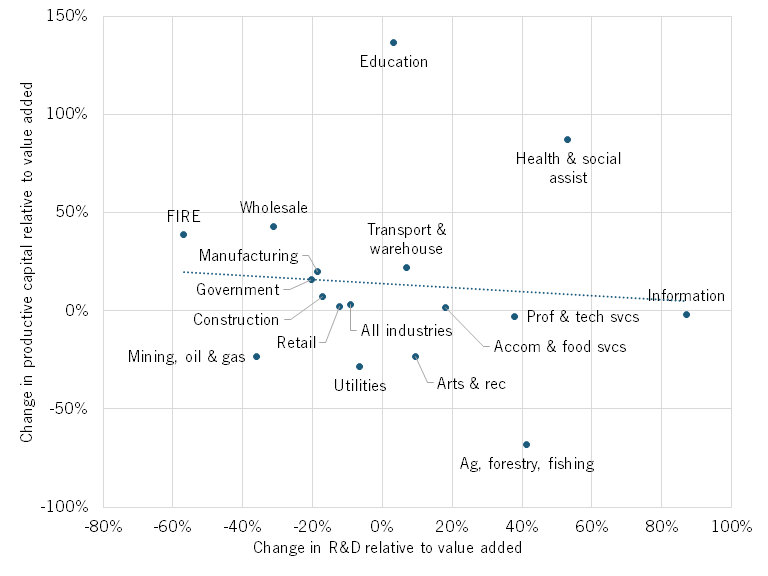
Some claim that the knowledge economy has arrived and that value added comes increasingly from low-capital activities such as R&D and design, rather than capital such as machinery. If this were true, we would likely see a decline in capital expenditures relative to value added when R&D expenditures increase. Figure 20 shows a weak, negative correlation (-0.08) between changes in spending on R&D and productive capital expenditures relative to value added, meaning there does seem to be a substitution effect, albeit small, occurring between R&D expenditures and productive capital expenditures. We can assume that this substitution is occurring mostly in industrial machinery and computer and electronic products, as these assets have seen reduced investment in the economy as a whole (see table 1).
Agriculture and forestry notably experienced the greatest reduction in capital expenditures over the decade, specifically in 2022 and 2023 when investment in industrial machinery fell to about 25 percent of what it was in 2021. At the same time, R&D increased, but not enough to account for the loss of industrial machinery investment, so it is more likely that reductions in productive investment in agriculture were a symptom of a post-COVID economy and not a shift to innovation investment. When agriculture is removed from the analysis, there is a slightly positive correlation between productive capital and R&D investment.
The manufacturing industry had a correlation coefficient of -0.75, suggesting a negative correlation between R&D expenditures and productive capital expenditures relative to value added.
This could mean that manufacturing innovations are often process innovations that do not impact capital expenditures or that the industrial machinery the manufacturing industry relies on has far longer depreciation cycles, making rapid technological change far more difficult compared with other industries. Or perhaps the manufacturing sector is indeed extracting more value added from R&D and design and is thus shifting capital investments away from capital such as software, machinery, and computers. As an example in manufacturing, most of the Apple iPhone’s value is derived from its design, software, and brand value rather than due to physical manufacturing costs, meaning more economic value is produced with the same or less capital expenditure.
Figure 20: Change in R&D investment relative to value added vs. change in productive capital expenditures relative to value added, 2013–2023[38]
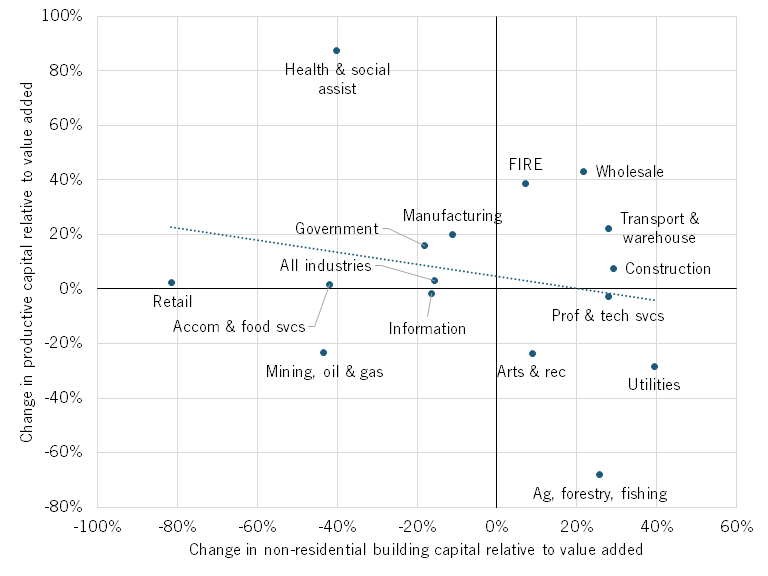
There is a belief that Canada’s excessive real estate prices mean that capital expenditures into commercial properties are drawing money away from expenditures into productive capital, either out of necessity or in hopes of greater returns on investment from real estate relative to other forms of capital.
Figure 21 shows a negative correlation of 0.22 between the two types of capital expenditures, once again indicating a substitution effect. The agriculture industry, which, as previously stated, has seen a significant reduction in productive capital investment, increased investment in non-residential building expenditures, as did the arts, entertainment, and recreation industry, which includes several sub-industries that require significant land and building improvements, such as sports arenas, casinos, amusement parks, and movie theatres. Conversely, other industries, such as manufacturing and health care, may have taken the opportunity during and after the pandemic to reduce their expenditures on non-residential buildings, freeing up money to spend on productive capital. Health care in particular has seen a drop in building expenditures coupled with productive capital investment since the pandemic, indicating a push for modernization in a fraught health-care system.
Figure 21: Change in non-residential building capital expenditures versus change in productive capital expenditures, 2013–2023[39]
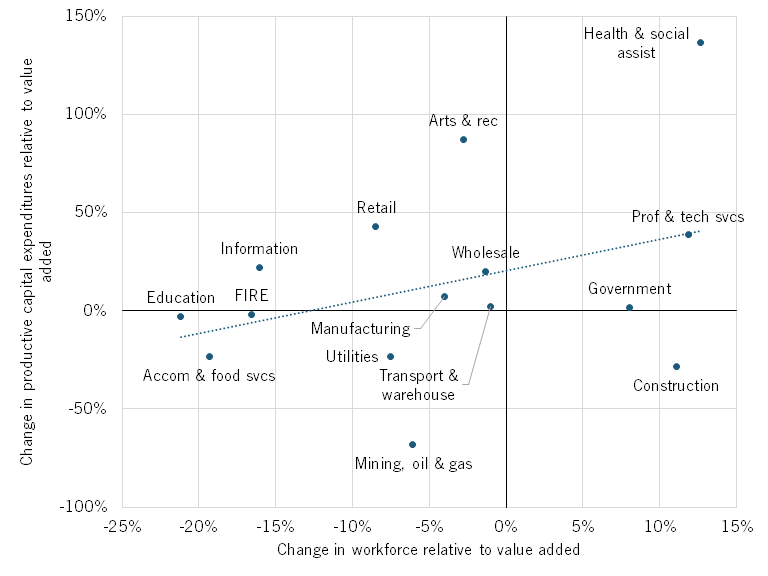
Finally, another theory is firms are opting to hire more people instead of investing in productivity-boosting capital, thereby increasing the total number of hours worked rather than the output per hour. Given the high levels of low-skill immigration in Canada, this is likely part of the problem. If firms have easy access to cheap labour, why invest in capital equipment? As University of Waterloo economist writes:
Businesses that are addicted to cheap labour have little incentive to invest in technology and equipment. Why invest in cutting-edge logistics software when there’s no shortage of low-wage drivers? Why automate agriculture with robotic harvesters and drones when there’s a steady supply of low-wage workers to do it manually? Make labour cheap enough and construction companies will begin to trade in their excavators for shovels![40]
One reason firms may be investing less is because they don’t see growth opportunities and as such prefer to “hunker down” using existing machinery and equipment. Why “bet the business” with major capital upgrades when the overall market is weak?
We see some evidence for this in figure 22, which shows that increased workforce relative to value added was positively associated with relative capital expenditures, with a correlation coefficient of 0.36 suggesting broadly that industries that are growing are more likely to boost capital expenditures as a share of sales. However, capital expenditures remained mostly unchanged in the government and construction sectors, which could be interpreted as a potential substitution effect in which people were hired in lieu of investing in productive capital. For example, the Canada Revenue Agency opted to hire 49.5 percent more employees between 2016 and 2023 to help administer COVID-19 support programs and combat tax evasion, despite calls for the government to invest in technology and other improvements to increase labour productivity.[41] Conversely, industries with great potential for automation, such as retail trade, wholesale trade, manufacturing, transportation and warehousing, and the information and cultural industries, all reduced their workforces relative to their respective value added.
Figure 22: Change in workforce vs. change in productive capital expenditures, 2013–2023[42]
Policy Implications
No single issue stands out as the cause of or the solution to Canada’s capital expenditures problem. Rather, many issues are cause for concern, and policymakers will need are wide-ranging response.
In 2019, the Trudeau Government enacted the Accelerated Investment Incentive, an enhanced first-year expensing program for certain eligible types of capital expenditures and a full expensing of machinery and equipment and clean energy investments.[43] Levels of capital investment amounts did not increase much after this, neither across the economy nor in manufacturing in particular. But this is likely in part due to four factors:
1. Most firms received only partial expensing, not true first-year write-offs;
2. Clean energy investments, though fully expensable, tend to have minimal or even negative productivity impacts;
3. Full expensing for machinery and equipment was confined to the manufacturing sector, limiting broader adoption; and
4. The economic uncertainty of COVID-19 deterred firms from committing to major capital expenditures.
The newly elected Liberal government has pledged to extend immediate expensing for manufacturing equipment, clean energy generation, energy conservation equipment, and zero-emission vehicles. While this commitment continues in the right direction, it is still too limited in scope to materially affect Canada’s productivity performance. To drive investment where it matters, the government should go further by making all productivity-enhancing capital expenditures eligible for full first-year expensing, as the United States did in its 2018 Tax Cuts and Jobs Act.
Canada’s smaller average firm size hurts capital investment and productivity. Canada should focus on allowing companies to achieve sufficient scale to compete on a global scale rather than pursue the popular approach of trying to get even more small businesses. It should adopt size-neutral policies, meaning all firms in Canada, regardless of size, face the same tax and regulatory obligations. That way, public policy does not artificially keep firms small by creating incentives to stay small. It should also rethink and reverse the recent antitrust focus on breaking up large firms that are critical to Canadian capital investment. And it should reform SR&ED to make the credit size neutral, rather than penalize medium and large firms.
Beyond removing disincentives to scale, Canada also needs to celebrate and systematically study what productivity leadership looks like in practice. The next government should establish a Prime Minister’s Productivity Innovation award, highlighting five or so organizations in Canada for their superlative use of capital investment, including software, to drive organizational productivity.
In addition, Innovation, Science and Economic Development Canada (ISED) should establish industry productivity groups to analyze productivity challenges in 25 or so specific industries in Canada per year, from hotels to waste collection to biopharmaceutical production. Each group, grounded in analytical staff and informed by industry experts, would examine global best practices in technology-driven productivity around the world, and then assess how Canadian organizations could adapt these innovations to their own practices. From robotic-based hotels in Tokyo to hospitals in China that automatically deliver drugs to hospital rooms to automated waste collection in Stockholm, the world is awash with best-practice productivity innovations that Canadian organizations can and should adopt.
As part of this effort, ISED should develop a productivity-enhancing technology pilot grant program that provides matching funds to 15 to 20 projects in Canada where the organization commits to implement global leading-edge productivity innovations. These funds need not be large (perhaps an average of $500,000 to $1 million), and as a condition of receiving the funds, the organization would commit to being open to allowing other similar organizations in Canada to learn from it. In addition, ISED could write up best-practice case study lessons that other organizations could use to implement similar innovations.
The Canadian government should seek an enhanced understanding with organized labour, stressing that it will not support labour bargaining over the introduction (or lack thereof) of new technology, even technology that automates work and reduces head count. While it is legitimate for unions to bargain over how gains from automation are shared, opposition to the adoption of productivity-enhancing technology undermines national competitiveness. We have seen this resistance for example, from Canadian dock workers.[44] But of course, unions and workers generally should be involved in the process of new capital investment, as long as that is to support the investment and worker wellbeing.[45]
All levels of Canadian government, across all ministries, should have it as a core mission to determine how their actions detract from or enhance capital investment to boost productivity. As part of this, government officials need to be willing to take leadership positions that automation and productivity growth are good for Canada and Canadians, even if that automation replaces, rather than complements workers.
The data available on software investment, one of a firm’s most productive assets, lacks any further descriptors or subcategories on Statistics Canada. The statistical agency fails to distinguish between purchased software, software that leads to process improvements and productivity growth, and self-built software. If a company were to invest in software production to sell it as a product, the software would not contribute to productivity growth. By not specifying what kind of software is being invested in, investment in producing both productivity-enhancing and nonproductivity-enhancing assets is being lumped together, a fact that may produce misleading data.
Modern productivity strategy requires precise visibility into where and how Canadian firms invest. But Statistics Canada’s capital expenditure data is ill-suited to today’s economy. It fails to distinguish between productive and nonproductive software, doesn’t track leased capital assets (which are increasingly important in SaaS and equipment-heavy industries), and reports spending using broad industrial categories that blur sector-specific dynamics.
In summary, underinvestment in much-needed, productivity-enhancing capital is a pernicious problem that policymakers at all levels of government urgently need to address. As evidenced by the oil and gas industry, declining profitability decreases industries and firms’ ability to intensify their capital. Chronic underinvestment in capital will depress labour productivity growth, lowering future living standards. If this continues, young Canadians will inherit a stagnant, less competitive economy. By fostering capital expenditures across the economy, Canada can drive innovation, boost its productivity, and enhance the global competitiveness of its industries.
Appendix
Table 3: Canadian asset classifications[46]
|
Asset Type |
Classification |
|
Non-residential building construction |
Industrial buildings; office buildings; shopping centres, plazas, malls and stores; other commercial buildings; schools, colleges, universities and other educational buildings; hospitals, health centres, clinics, nursing homes and other health care buildings; other institutional buildings. |
|
Engineering construction |
Transportation engineering construction; oil and gas engineering construction; electric power engineering construction; communication engineering construction; other engineering construction. |
|
Textile products, clothing, and products of leather and similar materials |
Fibre, yarn, thread, and fabrics; carpets, other textile furnishings and products; textile and fabric finishing and coating services; clothing, footwear and accessories. |
|
Wood products |
Hardwood and softwood lumber and treated wood products; wood chips, veneer and plywood, reconstituted wood products and wood waste; wood windows and doors, wood containers and other wood products. |
|
Plastic and rubber products |
Plastic building and construction materials; motor vehicle plastic parts; other plastic products; tires, rubber and plastic hoses and other rubber products. |
|
Non-metallic mineral products |
Other non-metallic mineral products; glass and glass products including waste and scrap; cement, ready-mixed concrete and concrete products. |
|
Fabricated metallic products |
Other fabricated metal products; structural, ornamental and architectural metal products; metal containers, boilers and tanks; hardware, wire products and turned products; coating, engraving, heat treating and similar metal processing services. |
|
Industrial machinery |
Parts, attachments and accessories for machinery of all kinds; industry-specific machinery; general-purpose machinery. |
|
Computer and electronic products |
Computer and computer peripheral equipment including parts; telephone apparatus and other communication equipment; printed and integrated circuits and other electronic components; audio and video equipment and unrecorded recording media; navigational, measuring, medical and control instruments. |
|
Electrical equipment, appliances, and components |
Household appliances; electrical equipment and components. |
|
Transportation equipment |
Passenger cars; light-duty trucks, vans and SUVs; medium and heavy-duty trucks and chassis; motor vehicle bodies, trailers and special purpose vehicles; aircraft and aircraft engines; aircraft parts and equipment; railroad rolling stock and parts; ships and boats; other transportation equipment and related parts. |
|
Furniture and related products |
Household furniture and furniture-related products; office and institutional furniture including fixtures. |
|
Other manufactured products and custom work |
Medical, dental and personal safety supplies, instruments and equipment; other manufactured products; custom work, manufacturing production services (except printing, finishing textiles and metals) and contract electronic reproduction services. |
|
Mineral exploration and evaluation |
No classification given |
|
Research and development |
Research and development services; own-account research and development services (except software development). |
|
Software |
General purpose software; custom software design and development services; own-account software design and development services. |
Table 4: U.S. asset classifications
|
Asset Type |
Classification |
|
Information processing equipment |
Computers and peripheral equipment; communication equipment; medical equipment and instruments; nonmedical instruments; photocopy and related equipment; office and accounting equipment. |
|
Industrial equipment |
Fabricated metal products; engines and turbines; metalworking machinery; special industrial machinery, n.e.c; general industrial, including materials handling, equipment; electrical transmission, distribution, and industrial apparatus. |
Methodology
Statistics Canada divides its data on capital expenditures into four main categories: machinery and equipment, intellectual property products, non-residential buildings, and engineering construction. Machinery and equipment include subcategories such as industrial machinery, computers, wood products, transportation equipment, and other physical forms of capital, while intellectual property products include the subcategories of intangible capital such as research and development spending, software, and mineral exploration. Engineering construction includes construction and renewal of infrastructure such as roads, pipelines, and waterworks, while non-residential building expenditures include construction, modification, and the renovation of buildings.
For instance, firms purchasing office furniture such as tables and couches and building new office buildings have fewer immediate impacts on productivity. They are more functions of an expanding workforce or changing business needs. In contrast, investments into computer software such as AI or video-editing software would give workers the necessary tools to be more productive. Similarly, while expenditure on research and development or engineering construction (infrastructure such as pipelines and roads) likely has positive impacts on labour productivity in the medium to long run, the time gap between expenditures and actual impacts on labour productivity is much slower and difficult to measure compared with investments into specialized industrial machines or computers that workers can benefit from immediately or within a few years.
Capital investment is generally analyzed in two ways: capital expenditures and capital stocks. Capital expenditures measure how much capital is being invested in during a time period and show how levels of investment change from year to year. Capital stocks, on the other hand, measure how much capital is owned across an economy at a point in time and can show whether capital expenditure keeps pace with depreciation of assets year to year. Capital expenditures reflect immediate investment activity and are used in this report to note short- to medium-term industry trends, whereas changes in capital stocks are generally a better tool for examining impacts on productivity.
An issue frequently encountered when examining the growth of capital expenditures is that expenditures will generally increase and decrease as industries grow or decline, which provides little information on whether firms are investing the right amount into capital. To account for this, this report generally uses capital expenditure and capital stocks relative to value added (the economic output of an industry minus the value of intermediate inputs purchased from other industries). For example, if an industry always invests 5 percent of its output into machinery and equipment, and the industry grew by 30 percent between 2013 to 2023, the capital expenditure to value added ratio remains the same, whereas the nominal value would likely show a 30 percent increase in capital expenditure despite firms generally not having intensified their capital.
About the Authors
Lawrence Zhang is head of policy at ITIF’s Centre for Canadian Innovation and Competitiveness. Previously, he served as an advisor to several Canadian cabinet ministers at both the federal and provincial levels, where he advised on key issues relating to industrial and innovation policy. He holds a Master of Public Policy and an Honours Bachelor of Arts in International Relations from the University of Toronto.
Meghan Ostertag is a research assistant for ITIF’s global innovation policy team.
About ITIF
The Information Technology and Innovation Foundation (ITIF) is an independent 501(c)(3) nonprofit, nonpartisan research and educational institute that has been recognized repeatedly as the world’s leading think tank for science and technology policy. Its mission is to formulate, evaluate, and promote policy solutions that accelerate innovation and boost productivity to spur growth, opportunity, and progress. For more information, visit itif.org/about.
Endnotes
[1]. Robert Atkinson, “Think Like an Enterprise: Why Nations Need Comprehensive Productivity Strategies” (ITIF, May 4, 2016), https://itif.org/publications/2016/05/04/think-enterprise-why-nations-need-comprehensive-productivity-strategies/.
[2]. Carolyn Rogers, “Time to break the glass: Fixing Canada’s productivity problem” (Bank of Canada, March 26, 2024), https://www.bankofcanada.ca/2024/03/time-to-break-the-glass-fixing-canadas-productivity-problem/.
[3]. Statistics Canada, “Indexes of business sector labour productivity, unit labour cost and related measures, seasonally adjusted” (Statistics Canada, Labour Productivity Index, March 2024), https://www150.statcan.gc.ca/t1/tbl1/en/tv.action?pid=3610020601; “Labour Productivity and Cost Measures: Major sectors: nonfarm business, business, nonfinancial corporate, and manufacturing” (U.S. Bureau of Labour Statistics, Labour Productivity Index from 1947 to 2023), https://www.bls.gov/productivity/tables/.
[4]. Shawn Sprague, “The U.S. productivity slowdown: an economy-wide and industry-level analysis,” U.S. Bureau of Labor Statistics, April 2021, https://www.bls.gov/opub/mlr/2021/article/the-us-productivity-slowdown-the-economy-wide-and-industry-level-analysis.htm.
[5]. Antonin Bergeaud et al., “Productivity Trends in Advanced Countries between 1890 and 2012,” Review of Income and Wealth, vol. 62(3), 420–444, http://www.longtermproductivity.com/download.html.
[6]. Ibid.
[7]. Robert D. Atkinson and Lawrence Zhang, “Assessing Canadian Innovation, Productivity, and Competitiveness” (ITIF, April 2024), https://itif.org/publications/2024/04/29/assessing-canadian-innovation-productivity-and-competitiveness/#_Productivity_Performance.
[8]. Statistics Canada, Labour productivity and related measures by business sector industry and by non-commercial activity consistent with the industry accounts, accessed November 2024, https://www150.statcan.gc.ca/t1/tbl1/en/cv!recreate.action?pid=3610048001&selectedNodeIds=2D7,3D181,3D182,3D183,3D184,3D185,3D186,3D190,3D191,3D194,3D197&checkedLevels=0D1&refPeriods=19980101,20230101&dimensionLayouts=layout2,layout2,layout3,layout2&vectorDisplay=false.
[9]. Statistics Canada, Flows and stocks of fixed non-residential capital, by sector of industry and type of asset, Canada (x 1,000,000), accessed November 2024, https://www150.statcan.gc.ca/t1/tbl1/en/tv.action?pid=3610009701; Statistics Canada, (Gross domestic product (GDP) at basic prices, by industry, annual average, industry detail (x 1,000,000), accessed November 2024, https://www150.statcan.gc.ca/t1/tbl1/en/cv.action?pid=3610043406.
[10]. Statistics Canada, Flows and stocks of fixed non-residential capital, by industry and type of asset, Canada, provinces and territories (x 1,000,000), accessed November 2024, https://www150.statcan.gc.ca/t1/tbl1/en/tv.action?pid=3610009601; Statistics Canada, Gross domestic product (GDP) at basic prices, by industry, annual average, industry detail (x 1,000,000), accessed November 2024, https://www150.statcan.gc.ca/t1/tbl1/en/cv.action?pid=3610043406; Statistics Canada, Labour productivity and related measures by business sector industry and by non-commercial activity consistent with the industry accounts, accessed November 2024, https://www150.statcan.gc.ca/t1/tbl1/en/cv.action?pid=3610048001.
[11]. Statistics Canada, Flows and stocks of fixed non-residential capital, by sector of industry and type of asset, Canada (x 1,000,000), accessed November 2024, https://www150.statcan.gc.ca/t1/tbl1/en/tv.action?pid=3610009701; Statistics Canada, Gross domestic product (GDP) at basic prices, by industry, annual average, industry detail (x 1,000,000), accessed November 2024, https://www150.statcan.gc.ca/t1/tbl1/en/cv.action?pid=3610043406.
[12]. Statistics Canada, Flows and stocks of fixed non-residential capital, by sector of industry and type of asset, Canada (x 1,000,000), accessed November 2024, https://www150.statcan.gc.ca/t1/tbl1/en/tv.action?pid=3610009701; Statistics Canada, Gross domestic product (GDP) at basic prices, by industry, annual average, industry detail (x 1,000,000), accessed November 2024, https://www150.statcan.gc.ca/t1/tbl1/en/cv.action?pid=3610043406; Statistics Canada, Labour productivity and related measures by business sector industry and by non-commercial activity consistent with the industry accounts), accessed November 2024, https://www150.statcan.gc.ca/t1/tbl1/en/cv!recreate.action?pid=3610048001&selectedNodeIds=2D7,3D181,3D182,3D183,3D184,3D185,3D186,3D190,3D191,3D194,3D197&checkedLevels=0D1&refPeriods=19980101,20230101&dimensionLayouts=layout2,layout2,layout3,layout2&vectorDisplay=false.
[13]. Statistics Canada, Flows and stocks of fixed non-residential capital, by sector of industry and type of asset, Canada (x 1,000,000), accessed November 2024, https://www150.statcan.gc.ca/t1/tbl1/en/tv.action?pid=3610009701; Statistics Canada, Gross domestic product (GDP) at basic prices, by industry, annual average, industry detail (x 1,000,000), accessed November 2024, https://www150.statcan.gc.ca/t1/tbl1/en/cv.action?pid=3610043406.
[14]. Ibid.
[15]. Ibid.
[16]. Statistics Canada, “Depreciation rates for select machinery and equipment categories” (Ottawa: Statistics Canada, November, 27 2015), https://www150.statcan.gc.ca/n1/pub/15-206-x/2015039/t/tbl04-eng.htm.
[17]. Statistics Canada, Flows and stocks of fixed non-residential capital, by sector of industry and type of asset, Canada (x 1,000,000), accessed November 2024, https://www150.statcan.gc.ca/t1/tbl1/en/tv.action?pid=3610009701; Statistics Canada, Gross domestic product (GDP) at basic prices, by industry, annual average, industry detail (x 1,000,000), accessed November 2024, https://www150.statcan.gc.ca/t1/tbl1/en/cv.action?pid=3610043406; Statistics Canada, Labour productivity and related measures by business sector industry and by non-commercial activity consistent with the industry accounts, accessed November 2024, https://www150.statcan.gc.ca/t1/tbl1/en/cv.action?pid=3610048001.
[18]. Don Drummond, Duncan Sinclair, and Jillian Gratton, “Troubles in Canada’s Health Workforce: The Why, the Where, and the Way Out of Shortages” (C.D. Howe Institute, November 2022), https://www.cdhowe.org/public-policy-research/troubles-canadas-health-workforce-why-where-and-way-out-shortages.
[19]. Statistics Canada, Flows and stocks of fixed non-residential capital, by sector of industry and type of asset, Canada (x 1,000,000), accessed November 2024, https://www150.statcan.gc.ca/t1/tbl1/en/tv.action?pid=3610009701; Statistics Canada, Labour productivity and related measures by business sector industry and by non-commercial activity consistent with the industry accounts, accessed November 2024, https://www150.statcan.gc.ca/t1/tbl1/en/cv.action?pid=3610048001.
[20]. Statistics Canada, Flows and stocks of fixed non-residential capital, by sector of industry and type of asset, Canada (x 1,000,000), accessed November 2024, https://www150.statcan.gc.ca/t1/tbl1/en/tv.action?pid=3610009701.
[21]. Georg Graetz and Guy Michaels, “Estimating the impact of robots on productivity and employment” (Robohub, July 2015), https://robohub.org/estimating-the-impact-of-robots-on-productivity-and-employment/.
[22]. “The Impact of Robots on Productivity, Employment and Jobs,” (International Federation of Robotics, April 2018), https://www.automate-uk.com/media/uhqbq25j/ifrtheimpactofrobotsonemploymentpositioningpaperupdatedv02april2017.pdf.
[23]. Institute for Employment Research, CEPR, and Düsseldorf Institute for Competition Economics, “German Robots–The Impact of Industrial Robots on Workers,” 2017.
[24]. Michael Koch, Ilya Manuylov, Marcel Smolka, “Robots and Firms” (working paper, CESifo, April 2019), https://www.ifo.de/DocDL/cesifo1_wp7608.pdf.
[25]. International Federation of Robotics, “World Robotics - Industrial Robots,” 2024, https://ifr.org/wr-industrial-robots/.
[26]. Rim Chatti et al., “Robotics Technologies Adoption: Insights from the Survey of Advanced Technology” (technical report, Statistics Canada, Ottawa, 2024), https://www150.statcan.gc.ca/n1/pub/22-20-0001/222000012024004-eng.htm.
[27]. Statistics Canada, Use of Advanced Technologies, by Industry and Enterprise Size, accessed November 25, 2024, https://www150.statcan.gc.ca/t1/tbl1/en/cv.action?pid=2710039701.
[28]. “Geoffrey Hinton – Facts – 2024” (The Nobel Prize), https://www.nobelprize.org/prizes/physics/2024/hinton/facts/
[29]. “AI Talent Concentration by Country” (OECD.AI Policy Observatory, April 2024), https://oecd.ai/en/data?selectedArea=ai-jobs-and-skills&selectedVisualization=ai-talent-concentration-by-country.
[30]. Michael Chui et al., “The Economic Potential of Generative AI: The Next Productivity Frontier” (McKinsey Digital, June 2023), https://www.mckinsey.com/capabilities/mckinsey-digital/our-insights/the-economic-potential-of-generative-ai-the-next-productivity-frontier#introduction.
[31]. Statistics Canada, Use of artificial intelligence by businesses and organizations in producing goods or delivering services over the last 12 months, second quarter of 2024, accessed December 2024, https://www150.statcan.gc.ca/t1/tbl1/en/tv.action?pid=3310082501; United States Census Bureau, Business Trends and Outlook Survey, AI Supplement, accessed January 8, 2024, https://www.census.gov/hfp/btos/data_downloads.
[32]. Statistics Canada, Flows and stocks of fixed non-residential capital, by sector of industry and type of asset, Canada (x 1,000,000), accessed November 2024, https://www150.statcan.gc.ca/t1/tbl1/en/tv.action?pid=3610009701; International Monetary Fund, Real Gross Domestic Product for Canada, retrieved from FRED, Federal Reserve Bank of St. Louis, accessed September 2024, https://fred.stlouisfed.org/series/NGDPRSAXDCCAQ; Bureau of Economic Analysis, National Data, Table 3.7E. Investment in Private Equipment by Industry, accessed March 4, 2025, https://apps.bea.gov/iTable/?ReqID=10&step=2&_gl=1*jpugdx*_ga*MTAxMzIxMjQyOC4xNzIwNDUxMjA3*_ga_J4698JNNFT*MTc0MTEwNTc1Ny44MS4wLjE3NDExMDU3NTcuNjAuMC4w#; Bureau of Economic Analysis, Value Added by Industry, accessed October 2024, https://apps.bea.gov/iTable/?reqid=150; Authors’ calculations.
[33]. Statistics Canada, Flows and stocks of fixed non-residential capital, by sector of industry and type of asset, Canada (x 1,000,000), accessed November 2024, https://www150.statcan.gc.ca/t1/tbl1/en/tv.action?pid=3610009701; International Monetary Fund, Nominal Gross Domestic Product for Canada, retrieved from FRED, Federal Reserve Bank of St. Louis, accessed September 2024, https://fred.stlouisfed.org/series/NGDPXDCCAA; U.S. Bureau of Economic Analysis (BEA), Fixed Asset Accounts Tables, Investment in Private Fixed Assets, Equipment, Structures, and Intellectual Property Products by Type, accessed December 5, 2024, https://apps.bea.gov/iTable/?ReqID=10&step=2&_gl=1*jpugdx*_ga*MTAxMzIxMjQyOC4xNzIwNDUxMjA3*_ga_J4698JNNFT*MTc0MTEwNTc1Ny44MS4wLjE3NDExMDU3NTcuNjAuMC4w#; U.S. Bureau of Economic Analysis (BEA), National Income and Product Accounts, Real Gross Domestic Product, Chained Dollars, accessed December 5, 2024, https://apps.bea.gov/iTable/?reqid; Author’s calculation.
[34]. Nicholas Bloom, Raffaella Sadun, and John Van Reenen, “Americans Do IT Better: US Multinationals and the Productivity Miracle,” American Economic Review, 2012, 102(1): 167–201, https://www.hbs.edu/ris/Publication%20Files/Americans%20Do%20IT%20Better_7cd547bc-c5f3-49b0-acf6-d0d4bc038a38.pdf.
[35]. Government of Canada, “Key Small Business Statistics 2023” (Ottawa: Government of Canada, 2024), https://ised-isde.canada.ca/site/sme-research-statistics/en/key-small-business-statistics/key-small-business-statistics-2023#s5.1.
[36]. U.S. Chamber of Commerce, “The State of Small Business Now” (Washington, D.C.: Chamber of Commerce, 2023), https://www.uschamber.com/small-business/state-of-small-business-now.
[37]. Statistics Canada, “The Canadian Productivity Review” (Ottawa: Statistics Canada, 2014), https://www150.statcan.gc.ca/n1/pub/15-206-x/2014033/part-partie1-eng.htm#h2_4.
[38]. Statistics Canada, Flows and stocks of fixed non-residential capital, by sector of industry and type of asset, Canada (x 1,000,000), accessed November 2024, https://www150.statcan.gc.ca/t1/tbl1/en/tv.action?pid=3610009701; Statistics Canada, Gross domestic product (GDP) at basic prices, by industry, annual average, industry detail (x 1,000,000), accessed November 2024, https://www150.statcan.gc.ca/t1/tbl1/en/cv.action?pid=3610043406.
[39]. Ibid.
[40]. Joël Blit, “Ottawa’s immigration cut is a chance to boost productivity,” The Globe and Mail, November 1, 2024, https://www.theglobeandmail.com/business/commentary/article-ottawas-immigration-cut-is-a-chance-to-boost-productivity/.
[41]. Kim Moody, “Big CRA funding increases could be better spent elsewhere” (Financial Post, January 23, 2024), https://financialpost.com/personal-finance/taxes/cra-big-increases-funding-better-spent-elsewhere.
[42]. Statistics Canada, Flows and stocks of fixed non-residential capital, by sector of industry and type of asset, Canada (x 1,000,000), accessed November 2024, https://www150.statcan.gc.ca/t1/tbl1/en/tv.action?pid=3610009701; Statistics Canada, Gross domestic product (GDP) at basic prices, by industry, annual average, industry detail (x 1,000,000), accessed November 2024, https://www150.statcan.gc.ca/t1/tbl1/en/cv.action?pid=3610043406; Statistics Canada, Employment by industry, annual; accessed November 2024, https://www150.statcan.gc.ca/t1/tbl1/en/tv.action?pid=1410020201.
[43]. Government of Canada, “Accelerated investment incentive” (Ottawa: Government of Canada, August 19, 2024), https://www.canada.ca/en/revenue-agency/services/tax/businesses/topics/sole-proprietorships-partnerships/report-business-income-expenses/claiming-capital-cost-allowance/accelerated-investment-incentive.html.
[44]. Nick Savvides, “Dockworkers on frontline of automation wars,” Seatrade Maritime News, November 28, 2024, https://www.seatrade-maritime.com/ports-logistics/dockworkers-on-frontline-of-automation-wars.
[45]. Rita Trichur, “Companies and unions must strive for consensus on robotics and automation at work,” The Globe and Mail, June 21, 2024, https://www.theglobeandmail.com/business/commentary/article-companies-and-unions-must-strive-for-consensus-on-robotics-and/.
[46]. Statistics Canada, “IOCC-Input-Output Commodity Classification,” July 26, 2019, https://www23.statcan.gc.ca/imdb/p3VD.pl?Function=getVD&TVD=137005.
