
Assessing Canadian Innovation, Productivity, and Competitiveness

Canada faces unprecedented challenges in innovation, productivity, and competitiveness. The first step in addressing them is to develop a clear understanding of the Canadian economy’s underlying structure and performance in each area. Policymakers must then tailor strategies for specific industries and technologies instead of focusing on principally on macro factors.
KEY TAKEAWAYS
Key Takeaways
Contents
Distinguishing Innovation, Productivity, and Competitiveness 4
Competitiveness Performance 43
Introduction
It has become a cottage industry in Canada to delve into the nature and causes of Canada’s struggling innovation, productivity, and competitiveness (IPC) performance. While much good analysis has been conducted, at the end of the day, there is still no consensus on the extent and causes of Canada’s poor IPC performance. And because of that, often reflecting a need to identify the “silver bullet” solution, numerous conclusions and recommendations have been put forth: less regulation, more regulation (e.g., antitrust enforcement), tighter linkages with North America, weaker linkages with North America, more education, and a change in culture, among others.
Getting the analysis and policy recommendations right is critical because the environment in which Canada finds itself is significantly more challenging than even a decade ago. First, China has become the world’s largest manufacturer and advanced industry producer, placing significant competitive pressures on Canadian firms in a host of industries. In this regard, the demise of Nortel and the concomitant rise of Huawei were just an opening salvo.
Second, there has been an Organization for Economic Cooperation and Development (OECD)-wide productivity slowdown as we have waited for the maturation of the next wave of general-purpose technologies (artificial intelligence (AI), next-gen chips, advanced electro-mechanical systems, etc.) and their broad-scale adoption. But Canada’s slowdown has been worse than that of many countries, including the United States’. This stagnation poses a significant threat to Canada as an aging population increasingly exerts a drag on economic growth and as lower relative living standards increase outmigration of knowledge workers to America.
Finally, Canada has not adequately translated spending billions at research universities and having a highly educated workforce into robust rates of domestic innovation, either through organizations adopting new technologies or companies producing and selling technology globally. As more and more technologies require a beyond-Canada scale for success, this poses new challenges for Canadian entrepreneurs and companies.
Some of Canada’s challenges are intrinsic. Abundant natural resources are both a blessing and a curse (a blessing because the wages in the sector are so high and a curse because their exports lead to a relatively higher value of the loonie). Canada’s proximity to the U.S. market provides opportunities to Canadian companies, but it also is a “black hole” gravitational pull that attracts Canadian talent, intellectual property (IP), and companies. Moreover, Canada’s foreign branch plant firms, built behind a 100-year tariff wall, create industrial capability that might not otherwise have emerged, but that also means limited research and development (R&D) and exports.[1]
But other Canadian challenges can be overcome, provided Canadians want to overcome them. More could be done to encourage universities to play a stronger role in supporting private sector innovation. The SR&ED tax credit could be redesigned to be a spur to R&D increases.[2] Canadian policymakers could stop looking to Europe as a regulatory model for emerging technologies and instead look to the United States for ways to grow a globally vibrant technology economy. More could be done to create a Canadian single market, rather than a market of 10 provinces. Ottawa could adopt a robust, sectoral-based productivity strategy. And more could be done to place IPC renewal at the centre of Canadian politics, for all the political parties.
This report—the first of the Information Technology and Innovation Foundation’s (ITIF’s) Canadian Centre for Innovation and Competitiveness—examines these issues. But it first clarifies the key differences between the three concepts of IPC—terms that are commonly confused in Canadian policy discourse. It then presents data on Canadian IPC, comparing performance with the United States and six other comparator nations (Australia, China, Germany, South Korea, Poland, and the United Kingdom). Finally, it lays out the following ten overarching principles we believe should guide future IPC policy efforts:
1. Reject “silver bullet” solutions.
2. Move beyond the idea that national economies can succeed by focusing on basic economic ingredients.
3. Think in terms of specific industries and technologies, not markets and the overall economy.
4. Look to “productionists” for advice on IPC.
5. Focus less on industrial recruitment and more on supporting companies already in Canada.
6. The only way to avoid the gravitational pull of the United States is to make our own.
7. See big and medium-sized businesses as beautiful.
8. Embrace North American integration, not separation.
9. Reject the precautionary principle and embrace the innovation principle.
10.Make IPC a top priority.
Distinguishing Innovation, Productivity, and Competitiveness
To listen to many pundits, economists, and policymakers discussing the economics of growth, it would be easy to get confused about exactly what is meant by three of the most commonly used terms “innovation,” “productivity” and “competitiveness” and “Are they synonymous? Conflicting? Unrelated?” In fact, while the three terms are related, they are clearly distinct and refer to different things.
Competitiveness
It is quite common for organizations and pundits to define “competitiveness” as “productivity.” Harvard’s Michael Porter has stated, “The only meaningful concept of competitiveness at the national level is productivity.”[3] The World Economic Forum’s Global Competitiveness Report agrees, defining competitiveness as “the set of institutions, policies, and factors that determine the level of productivity of a country.”[4] IMD’s World Competitiveness Yearbook defines it even more broadly as how an “economy manages the totality of its resources and competencies to increase the prosperity of its population.”[5] IMD includes virtually all factors related to economic performance, including youth employment levels, level of inflation, and real gross domestic product (GDP) growth. But if everything is competitiveness, then in practice nothing is.
In fact, competitiveness is narrower than productivity. To see why, it’s important to differentiate between traded and nontraded industries. A traded industry is one that sells a significant share of its output outside a particular geographical area. For example, a printing firm in Ontario that sells printed material to customers across Canada would be a traded firm from the perspective of the Ontario economy, but a nontraded firm from the perspective of the Canadian. In contrast, a software firm in Montreal that sells software throughout the world would be a traded firm from the provincial and national perspective.
Competitiveness is the ability of a nation to have a robust traded sector economy relative to imports while maintaining favourable “terms of trade” when the real price of exports is adjusted to reflect all “sales discounts” (including an artificially low currency, suppressed wages in export sectors, artificially low taxes on traded firms, and direct subsidies to exporters) and import restrictions. Under this definition, a nation may run a large trade surplus (one component of competitiveness). However, if it does so by providing large discounts to its exports or limits imports, it would not be truly competitive, for such policies would reduce its terms of trade by requiring its residents to give up some of their income to foreign buyers or force them to pay higher prices to domestic producers.
Unfortunately, while data exists on trade balances for virtually all nations, data on the extent of export discounts and import restrictions is difficult to obtain. As such, it is hard to identify which countries are truly competitive, although at a quick glance, it would appear that nations such as Austria, Germany, and Sweden would be on the list (they run trade surpluses while also having relatively high wages), while nations such as China (too much discounting) and the United States (too large a trade deficit) would not be listed. However, Canada appears to be relatively competitive with trade balances close to zero.[6] But this reflects, in significant part, a fall in the value of the Canadian dollar, especially relative to the U.S. dollar, which makes imports more expensive and exports cheaper.[7]
Competitiveness is the ability of a nation to have a robust traded sector economy relative to imports while maintaining favourable “terms of trade” when the real price of exports is adjusted to reflect all “sales discounts” and import restrictions.
But even that definition of competitiveness is too narrow because it does not differentiate between comparative advantage and competitive advantage. Of course, Canada has a comparative advantage in minerals, agriculture, and timber, and it runs trade surpluses in all of these, including $29 billion in minerals in 2023.[8] Not to take away anything from the companies and workers in these industries, but this was a comparative advantage that was bestowed upon rather than earned by Canada.
What really matters when assessing competitiveness is the performance of a nation in non-natural-resource-based sectors, especially technologically advanced, high-value sectors. It is in these sectors that employment multipliers and wages are usually very high. As we discuss in the section on Canadian competitiveness, these sectors include computers and semiconductors, motor vehicles, aerospace, and machinery and software, where Canadian competitiveness is quite low.
To be sure, productivity growth can help competitiveness—especially if it is concentrated in traded sectors, which lowers their costs and enables them to sell more in global markets without discounts. But productivity growth can also be relatively unrelated to competitiveness if it is concentrated in non-traded sectors. Imagine a nation with strong productivity growth but almost all of it in nontraded sectors such as grocery stores, electric utilities, and nursing homes. Certainly, incomes would go up as relative prices in these sectors fall, but firms in traded sectors would only see modest reductions in their costs to the extent they purchase inputs from nontraded firms.
Innovation
While the term competitiveness is usually incorrectly defined, innovation is usually defined more accurately, although all too often too narrowly. Many see innovation as only technological in nature, resulting in shiny new products such as Apple’s iPad or Boeing’s 787 Dreamliner. Still others believe innovation pertains only to the R&D activity going on at universities, national laboratories, and start-ups.
While this is all true, it is much too limiting in scope. The OECD properly defines innovation more broadly as “a new or improved product or process (or combination thereof) that differs significantly from the unit’s previous products or processes and that has been made available to potential users (product) or brought into use by the unit (process).”.”[9]
However, even when it is properly defined, many equate innovation with competitiveness, productivity, or both. For example, Bloomberg’s ranking of the 50 most innovative nations includes productivity as one of its seven variables. Likewise, the Canadian Council of Academies has written, “Given the potential of IR&D [industrial R&D] to boost economic growth, its relatively low intensity can help explain Canada’s persistent productivity gap with the United States.”[10]
In his testimony to Parliament, former Blackberry CEO Jim Balsillie stated, “When you start to do that [get more IP from R&D], you get leverage, which drives what’s called productivity or [GDP] per capita. That’s how these other economies get more wealth per worker and how to put more money in the average Canadian’s pocket.”[11]
Innovation can increase productivity and competitiveness, but it is not synonymous with either.
But while innovation is related to competitiveness and productivity, it is not synonymous with them. For example, the innovation of the smart electric grid will help boost the productivity of the electric industry but will not have a direct impact on competitiveness because electric utility services are not typically traded across borders. Likewise, the development of a new technology to better predict weather patterns might benefit quality of life, but it would also not directly affect productivity. In contrast, the creation of a new drug, a new kind of airplane, or a faster computer chip would not only enhance traded sector industries’ competitiveness (pharmaceuticals, aerospace, and semiconductors), but also improve quality of life. Thus, certainly innovation can increase productivity and competitiveness, but it is not synonymous with either. Given the fact that advanced industries globally account for around 12 percent of GDP, the locomotive power of R&D in these firms to drive growth is, by definition, limited. Moreover, innovation can be easily purchased from firms around the world. Canadian hospitals can buy the latest Swiss scanning machines, and insurance companies can buy Japanese AI software.
Productivity
Productivity is perhaps the most straightforward and easily defined of the three factors. Productivity is output per unit of input. The unit of input can be labour hours (labour productivity) or all production factors including labour, machines, and energy (total factor of productivity). Despite this simplicity, many still confuse the use of the term. For example, some have argued that moving jobs to China raises productivity because doing so lowers costs. But while this might reduce prices, it is actually likely to decrease output per unit of input since firms in Chinese use fewer machines and are less efficiently organized.
Economies have three ways to grow over the medium and longer term: growth in workers, growth in productivity across the board, or a shift to high-productivity industries. The first, growth in the number of workers, is a nonsustainable strategy and, more importantly, does nothing to increase per capita income growth.
The second, the “growth effect,” occurs when a nation’s productivity goes up not by some high-productivity industry sectors getting bigger, but rather by all sectors getting more productive. For example, a country’s retail, banking, and automobile manufacturing sectors can all increase their productivity at the same time. This can happen if all the firms increase their productivity, or if the low-productivity firms in a particular industry lose market share to high-productivity firms in the same industry (e.g., small bookstores go out of business because consumers prefer to buy e-books online). This process occurs in all sectors. One study of Canadian manufacturing finds that plant turnover from entry and exit contributes from 15 to 25 percent of manufacturing-labour productivity growth, with the other 75 to 85 percent coming from individual plants continuing to become more productive.
The third, the “shift effect,” occurs when the mix of low- and high-productivity industries in a nation changes. For example, if a developing nation loses 500 agricultural jobs (which, in developing nations, normally have low productivity) and gains 500 jobs in a software firm (which normally have higher productivity), overall national productivity would increase.
The lion’s share of productivity growth in most nations comes not from changing the sectoral mix to higher-productivity industries, but rather from all industries boosting their productivity.
But which productivity strategy—across-the-board growth or the shift effect—is the best path to higher productivity? The answer depends in large part on the size of an economy and to a lesser degree on the type of sector. The larger the economy, the more important the growth effect is since relatively less of large-economy output is traded. Moreover, the more local-serving the sector is, the more important the growth effect is. To understand why, consider an automobile factory in a small city. If its managers install a new computer-aided manufacturing system and raise the plant’s productivity (the growth effect), a large share of the benefits will flow to the firm’s customers around the nation and even around the world in the form of lower prices. The city will benefit only to the extent that its residents buy cars from that factory or if some of the increases in productivity go to higher wages instead of only to lower prices. In general, the lion’s share of productivity growth in most nations comes not from changing the sectoral mix to higher-productivity industries, but rather from all industries, even low-productivity ones, boosting their productivity.
Innovation Performance
Innovation cannot be captured in a single measure, though it is frequently shrunk down to rankings, indexes, and scorecards to make it easier to digest. However, such reductionism can make it harder for policymakers to gain more complete understanding of where exactly Canada’s weaknesses in innovation are.
While it may be helpful in gaining an overall understanding of the global innovation ecosystem to hear that Canada ranks 15th on the Global Innovation Index, or that it gets a “C” letter grade on its scientific articles, these do not indicate exact issues for improvement, only general areas.[12] Moreover, none of the major national innovation indexes provide effective assessments of countries’ innovation performance.
Our goal is not to provide a comprehensive list of indicators for every aspect of Canada’s innovation ecosystem, but to point out specific measures that highlight Canada’s performance, both good and bad. As such, to best provide an informative overview of Canada’s innovation performance, we explore a number of different indicators from a range of statistical bodies and international agencies.
R&D
As a key component of innovation, R&D is regularly homed in on when discussing Canada’s innovation performance—and rightfully so, as countries with high levels of R&D are frequently high-performance economies whose firms gain the ability to capitalize upon this knowledge creation.
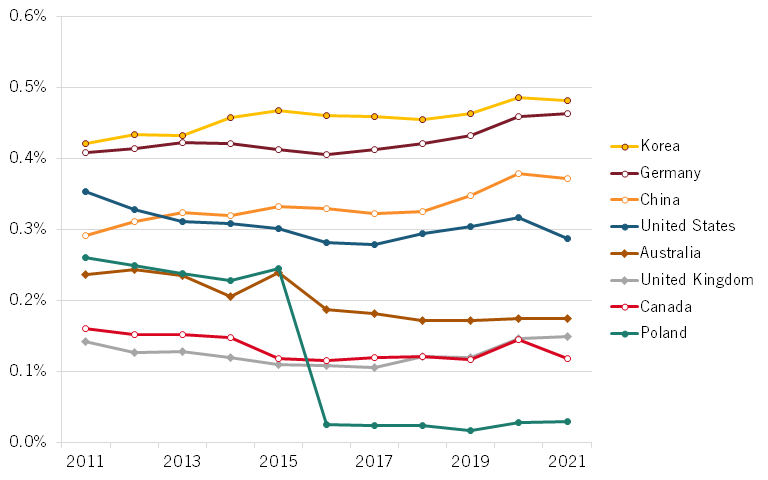
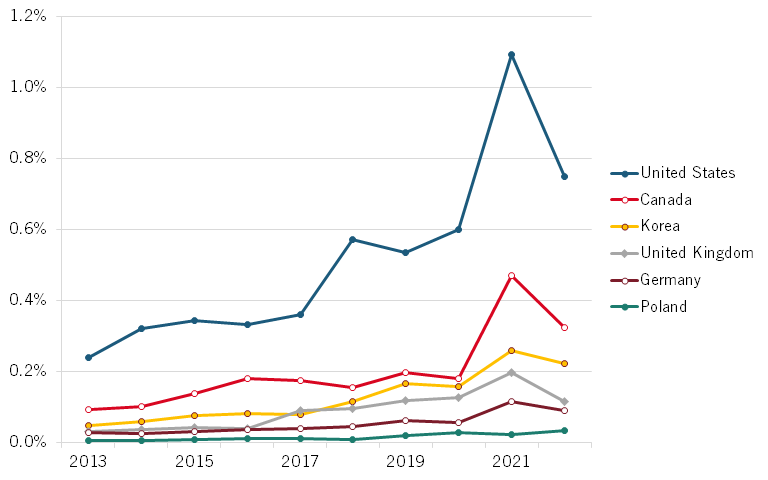
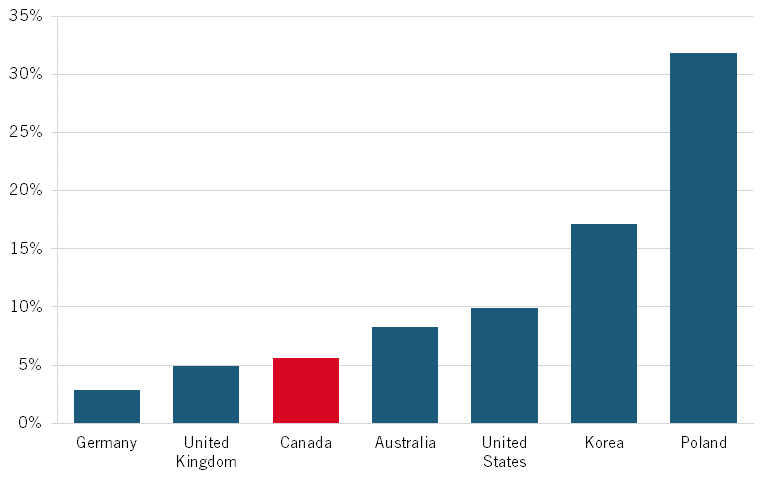
Based on the following indicators, Canada lags behind many of its peers and comparator countries in spending on R&D, with a virtually flat level of spending on R&D across the economy over time in figure 1, compared with moderate to high levels of growth across many other countries. Canada has seen particularly poor performance in business expenditures on R&D, with firms drastically underspending on R&D investments compared with other countries even after adjusting for GDP as well as firm size.
Canada’s higher-education R&D expenditure is higher than that of the comparator countries, although this only accounts for a small portion of gross R&D expenditures in Canada and with other countries. Finally, Canada’s government expenditure on R&D falls behind other countries, and increasing this could be an area of opportunity for the federal government to spur Canadian innovation in targeted industries.
Figure 1: Gross expenditure on R&D as a percentage of GDP[13]
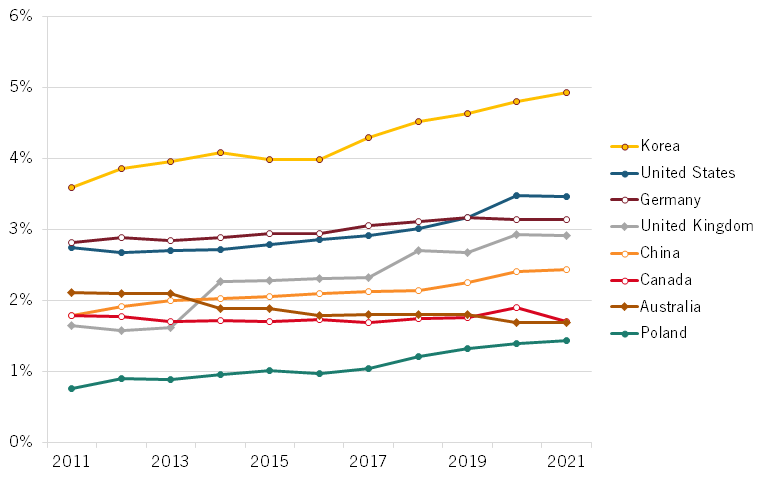
Figure 2 decomposes overall R&D expenditure into its three components: business expenditure on R&D (BERD); higher-education expenditure on R&D (HERD), and government expenditure on R&D (GOVERD). This illustrates how significantly the R&D gap between Canada and other advanced economies is derived from business R&D. Though Canada leads in higher-education R&D spending and trails quite far behind in government R&D spending, the overall makeup of R&D across countries shows that even significant government investment in public sector R&D is unlikely to address Canada’s low level of overall R&D.
Figure 2: R&D composition as a percentage of GDP (2021)[14]
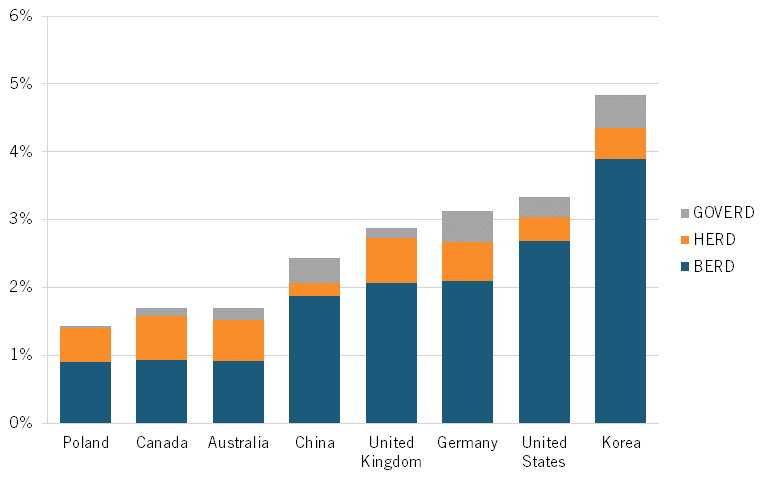
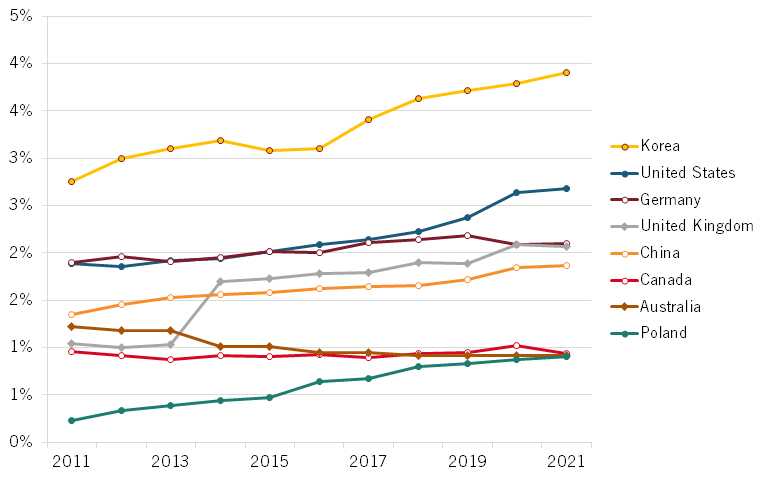
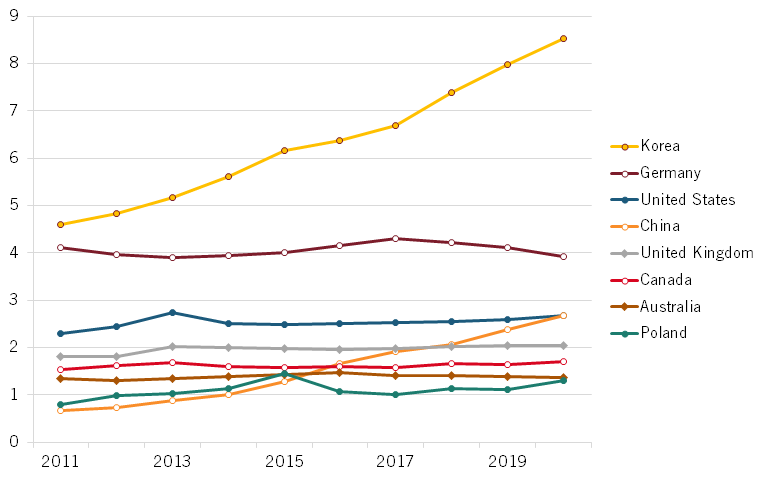
Figure 2 shows that Canada is essentially tied for last with Australia and Poland among the comparator countries in business spending on R&D. Meanwhile, business R&D in other countries has increased significantly in the past 10 years. In its current trajectory, it appears that Poland will likely surpass Canada in the near future. Though Canada’s absolute levels of business investment in R&D are higher than Poland’s due to the size disparity between the two economies, Poland’s overall GDP continues to significantly rise year over year, faster than Canada’s rate of growth.
Figure 3: Business expenditure on R&D as a percentage of GDP[15]
Canadian firms made up just 28 of the top 2,500 firms on the “2022 EU Industrial R&D Investment Scoreboard,” which lists the firms that invest the most in R&D around the world. Canada again falls behind many of the comparator countries, with Canada below all but Australia and Poland when comparing top R&D companies after adjusting for size of economy. (See figure 4.)
Figure 4: Companies in the top 2,500 global R&D investors per trillions of dollars of purchasing power parity (PPP) GDP (2022)[16]
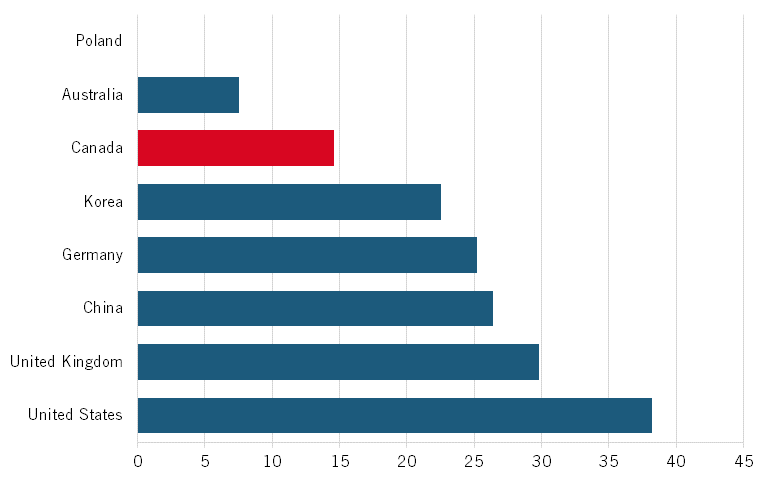
Table 1: Number of firms in nine advanced trade sectors (2021)[17]
|
Sector |
United States |
Canada |
Rest of |
Total |
|
Pharmaceuticals and Biotechnology |
263 |
6 |
209 |
478 |
|
Software and Computer Services |
197 |
6 |
134 |
337 |
|
Technology Hardware and Equipment |
71 |
3 |
133 |
207 |
|
Electronic and Electrical Equipment |
41 |
2 |
206 |
249 |
|
Industrial Engineering |
28 |
1 |
138 |
167 |
|
Automobiles and Parts |
28 |
2 |
118 |
148 |
|
Aerospace and Defence |
15 |
2 |
27 |
44 |
|
General Industrials |
15 |
0 |
49 |
64 |
|
Alternative Energy |
2 |
0 |
6 |
8 |
|
Total |
660 |
22 |
1,020 |
1,702 |
The average U.S. firm on the R&D 2,500 list invested $802 million in R&D, 0.06 standard deviations above the global average firm’s R&D spending of $656 million in the above sectors.[18]In comparison, the average Canadian firm invested just $234 million in R&D, 0.18 standard deviations below the global average.[19]
Collectively, U.S. firms in these sectors invest more in R&D than do Canadian firms. In 2021, U.S. firms spent almost 103 times more than Canadian firms: $529 billion on R&D, while Canadian firms spent $5.2 billion, despite U.S. GDP being just 11.7 times greater than Canada’s.[20] As a result, U.S. firms’ global R&D share was 47.4 percent compared with Canadian firms’ 0.5 percent.[21] (See figure 5.) This is compared with the rest of the world’s 52.1 percent.[22] Even when controlling for GDP, U.S. firms still spent more than Canadian firms. For every $1,000 of GDP, U.S. firms in these nine sectors invested $22.70 on private R&D, while Canadian firms invested $2.59.[23] The rest of the world’s firms invested $8.17.[24]
Certainly, industrial structure accounts for a major portion of Canada’s poor R&D performance—Canada will not have hundreds of pharmaceuticals and biotechnology companies on the R&D 2,500 list if there are not that many firms in that sector in the first place. As noted by Canadian economist and scientist Peter Nicholson, the “largest companies according to financial metrics belong to traditional economic sectors, dominated by finance (banking and insurance) and resources (primarily energy). Only two of the current top 25 companies by market value are in information technology (Shopify and Constellation Software) and only one manufacturer (Magna) makes the top 25 in revenue.”[25]
Figure 5: Share of global R&D of top 2,500 R&D spenders (2021)
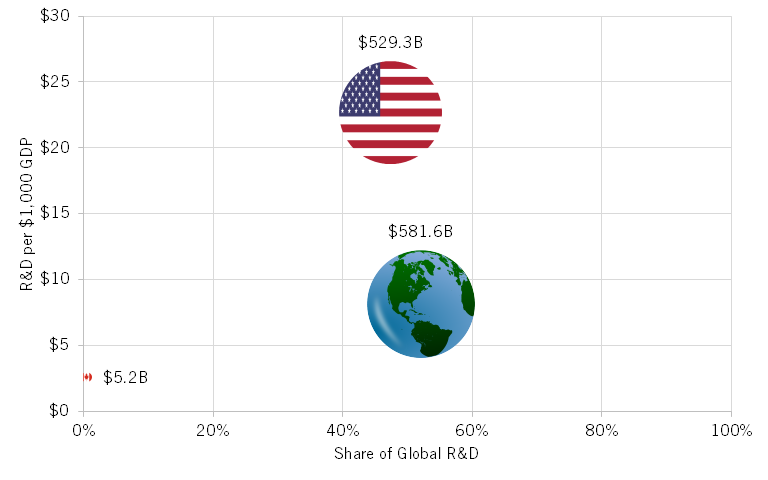
U.S. firms’ size-adjusted R&D spending was larger than Canadian firms’ in 2021. The size-adjusted R&D spending compares U.S. and Canadian firms’ R&D spending as a share of the respective countries’ GDPs to the global average R&D spending as a share of the world’s GDP. This results in an industry concentration ratio known as an LQ, which we express as a multiple. For example, if a country has twice the global average corporate R&D in a given sector, then its LQ in that sector is 2. The LQ is important in this analysis because it compares the performance of firms in each country with the global average after adjusting for the size of each country’s economy. By that measure, U.S. firms’ size-adjusted R&D spending was higher than Canada’s in all nine industries. (See table 2.)
Table 2: Business R&D relative to the global average in nine advanced sectors, 2021 (manufacturing in italics)[26]
|
U.S. Firms LQ |
Canadian Firms LQ |
|
|
Aerospace and Defense |
1.79x |
0.45x |
|
Software and Computer Services |
3.14x |
0.41x |
|
Automobiles and Parts |
0.67x |
0.27x |
|
Pharmaceuticals and Biotechnology |
2.18x |
0.18x |
|
Technology Hardware and Equipment |
2.20x |
0.09x |
|
Industrial Engineering |
0.84x |
0.09x |
|
Electronic and Electrical Equipment |
0.50x |
0.06x |
|
General Industrials |
1.13x |
0.00x |
|
Alternative Energy |
0.47x |
0.00x |
|
All Advanced Industries |
1.96x |
0.22x |
As for foreign funding of R&D, Statistics Canada data from 2021 shows that roughly $7.7 billion, or 39 percent of business enterprise R&D, was funded by foreign business enterprises (which includes Canadian subsidiaries of non-Canadian companies).[27] Meanwhile, data from the U.S. National Center for Science and Engineering Statistics reveals that U.S. companies invested $8.3 billion in R&D in Canada, accounting for 66,000 jobs.[28] Roughly $3 billion of this was in the information sector, which includes software and AI jobs, and 95 percent of the total U.S. investment in Canadian R&D was in large companies. The difference between the data from Statistics Canada and the U.S. National Center for Science and Engineering Statistics could potentially be explained by differences in definitions of country of control, though both data sources make it clear that a significant portion of Canadian R&D is funded by foreign-controlled companies.
Canada’s poor performance in business R&D, in part, can be attributed to the lack of scale seen in Canadian firms.
Canada’s poor performance in business R&D can partially be attributed to the lack of scale seen in Canadian firms. The Scientific Research & Experimental Development incentive program and overall corporate tax regime heavily favour small to medium-sized firms, thereby disincentivizing Canadian firms from reaching the size necessary to take advantage of returns to scale on R&D.[29]
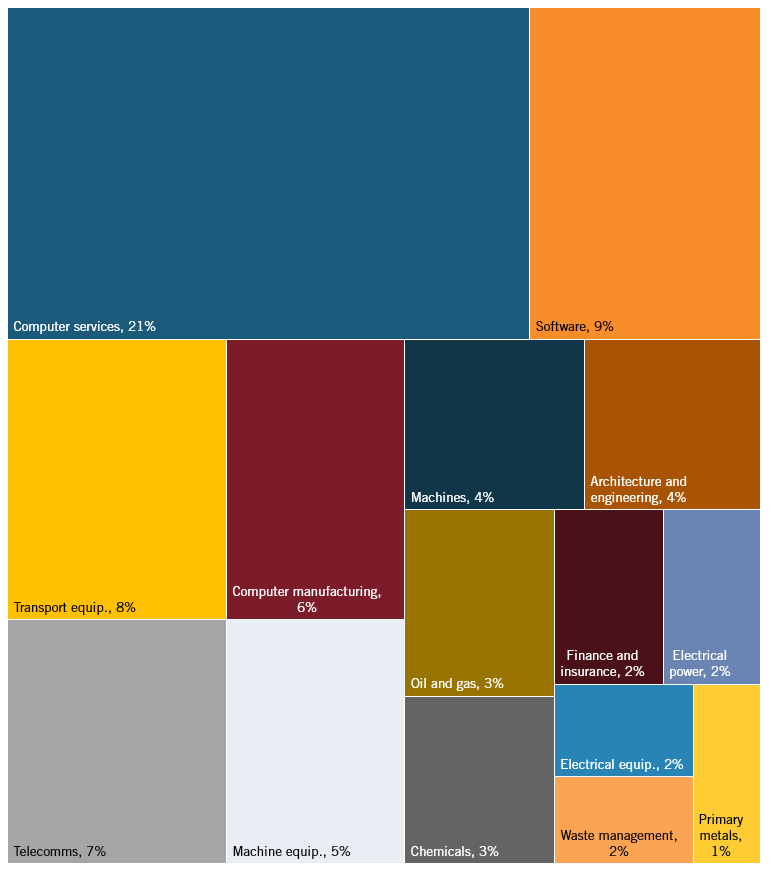
Figure 6 shows the latest Statistics Canada data on the breakdown of Canadian business expenditure on R&D by industry. Perhaps unsurprisingly, industries that rely more heavily on technological progress as a means of gaining a competitive market share, such as computer systems and transportation equipment, are more likely to invest more in R&D than other industries.
Figure 6: Top 15 Canadian R&D industries[30]
As noted, Canada has one of the highest rates of investment in R&D by the higher-education/postsecondary sector. It has long been almost double the rate at which the United States and Korea spend, as seen in figure 7, though that leaves the question of what the Canadian production system gets for it. Canada’s relative performance in university technology commercialization and start-ups should be much higher than it is compared with other nations, given this level of funding. Yet, in the absence of a robust technology transfer system and pathways to commercialization, R&D from the higher education sector is unable to provide significant economic benefits to firms and the broader economy in the same way that business R&D can. Simply having the “ingredient” of R&D performed at universities is not adequate to grow a globally competitive technology economy.
Figure 7: Higher-education expenditures on R&D as a percentage of GDP[31]
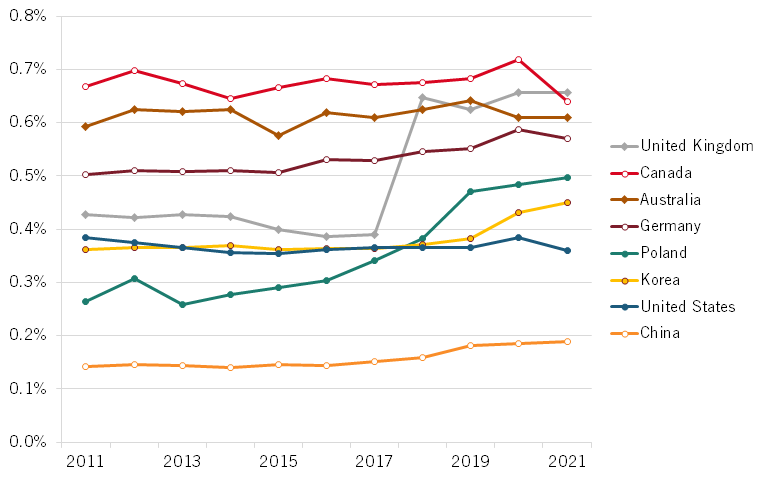
Figure 8 shows that Canada has a fairly middle-of-the-pack level of higher education R&D funded by the business sector, especially compared with countries such as German and Korea, which have established sophisticated programs to link businesses and research universities. This shows that Canada’s lackluster performance in converting college and university-derived inventions into tangible, commercially viable innovations is not necessarily an issue with a lack of private sector funding for higher-education R&D, but rather what comes after.
Figure 8: Percentage of higher-education R&D financed by the business sector (2019)[32]
Government R&D expenditures, though fairly small in most countries, have can be a significant driving force for a nation’s innovation by taking on financial risks that even de-risked private sector investment through government subsidy is unlikely to undertake. This is especially true if the R&D is aligned with industry specialization, as it tends to be in Germany and Korea. Investment from the U.S. Department of the Defense created ARPANET, the precursor for the modern Internet, that has allowed American companies to flourish in the 21st century at a scale and pace that otherwise would have been unlikely.[33] Meanwhile, public sector funding through Canada’s National Research Council played a vital role in the creation of canola oil and the electric pacemaker, which have had major long-lasting impacts on the health and well-being of Canadians as well as people around the world.[34] Figure 9 shows that Canada has been significantly underinvesting in government R&D relative to other countries, and this funding continues to be on a downward trajectory as well. If Canada wanted to achieve the same level of government expenditure of R&D as a share of GDP as the United States, it would have to increase its government R&D spending by 144 percent, or $3.1 billion.
Figure 9: Government expenditure on R&D as a percentage of GDP[35]
Intellectual Property
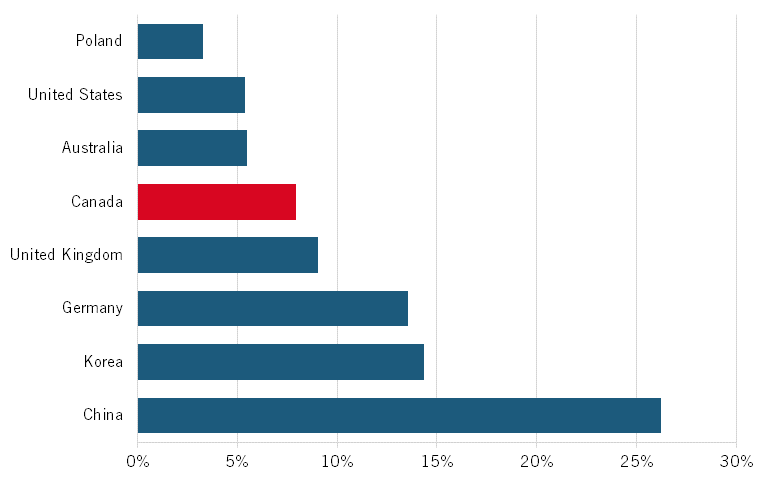
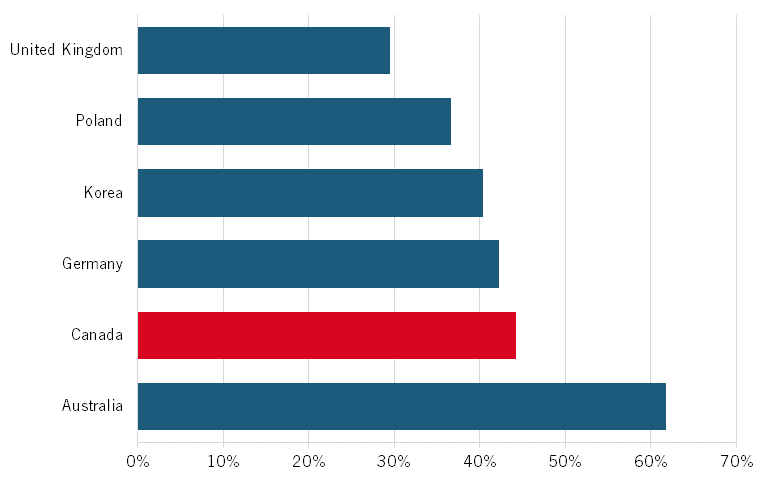
The World Intellectual Property Organization ranks Canada 13th in the world by total patenting activity. However, Canada is near the bottom alongside Australia and Poland when looking at the number of international patent applications adjusted for economy size. (See figure 10.) Meanwhile, Korea and China have been significantly increasing the number of patent applications year over year, roughly doubling their annual applications between 2011 and 2020.
Figure 10: Patent cooperation treaty patent applications per billion PPP$ GDP [36]
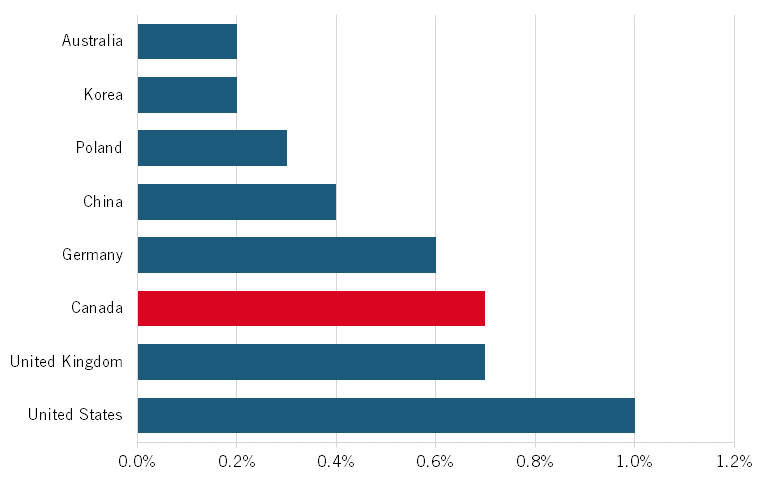
However, simply registering patents does not create economic prosperity. One measure of IP value is the amount of IP licensing revenue obtained from foreign firms. However, Canada’s balance of payments on IP receipts is negative, and it imports more than twice the amount of IP it exports, while the United States is functionally the inverse, exporting more than twice the amount of IP it imports. Figure 11 shows that IP does not make up a significant portion of Canada’s overall exports, though it beats out both Australia’s and Korea’s.
Figure 11: IP exports as a percentage of total trade (2021) [37]
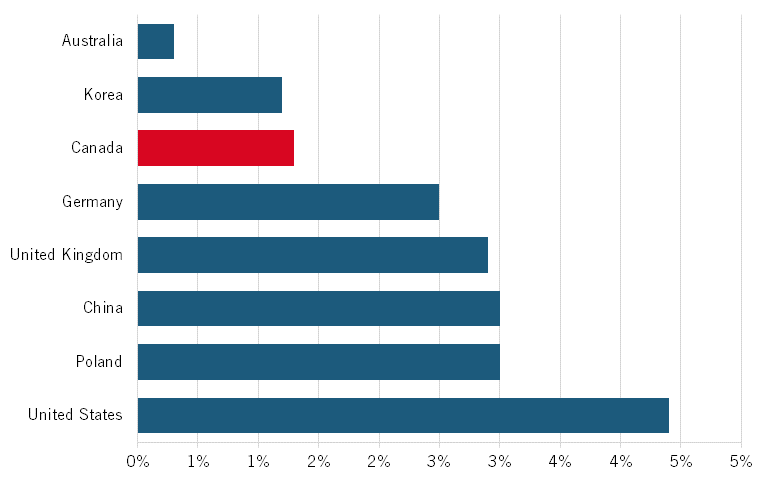
Table 3 shows the types of technologies, and therefore sectors, that obtain the most patents. Canada’s top categories do not differ significantly from that of the comparator countries’, meaning that Canadian firms face steep competition in their respective patenting-intensive industries. It should be noted that these technologies are all in industries wherein firms are more likely to seek patents, and not necessarily ones that are more broadly innovative.
Table 3: Top patent grants as a share of all patents, by technology (2023)[38]
|
Canada |
Australia |
China |
Germany |
||||
|
Medical technology |
8% |
Medical technology |
12% |
Computer technology |
13% |
Transport |
20% |
|
Pharmaceuticals |
8% |
Pharmaceuticals |
11% |
Measurement |
7% |
Mechanical elements |
10% |
|
Civil engineering |
7% |
Biotechnology |
7% |
Digital communication |
7% |
Electrical machinery, apparatus, energy |
9% |
|
Biotechnology |
5% |
Computer technology |
6% |
Electrical machinery, apparatus, energy |
6% |
Engines, pumps, turbines |
8% |
|
Measurement |
5% |
Civil engineering |
5% |
Machine tools |
4% |
Measurement |
7% |
|
Korea |
Poland |
United Kingdom |
United States |
||||
|
Computer technology |
9% |
Measurement |
7% |
Civil engineering |
11% |
Computer technology |
16% |
|
Semiconductors |
7% |
Civil engineering |
7% |
Computer technology |
10% |
Digital communication |
9% |
|
Electrical machinery, apparatus, energy |
7% |
Other special machines |
6% |
Medical technology |
6% |
Medical technology |
6% |
|
Medical technology |
5% |
Basic materials chemistry |
5% |
Measurement |
6% |
Electrical machinery, apparatus, energy |
6% |
|
Digital communication |
4% |
Organic fine chemistry |
5% |
Electrical machinery, apparatus, energy |
6% |
Semiconductors |
5% |
Higher Education
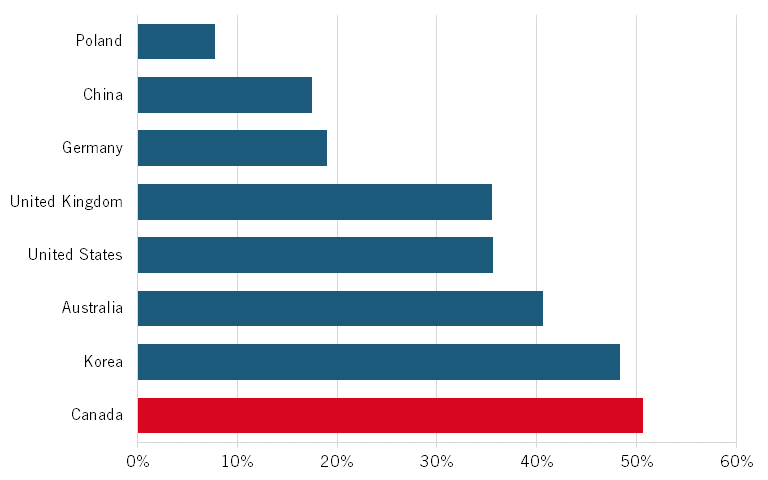
As with higher-education expenditure on R&D, Canada performs better than many comparator countries on most measures of innovation in the postsecondary sector and academia. For instance, Canadian universities are ranked among the highest in the world in virtually all published online rankings, including the QS Ranking published annually. (See figure 12.) Figure 13 shows that Canadians are the most educated population in the world when comparing people between the ages of 25 and 64 who possess a degree from a university or college. It is striking that this advantage has not been effectively translated into strong IPC performance.
Figure 12: Average QS ranking of top three universities (2023)[39]
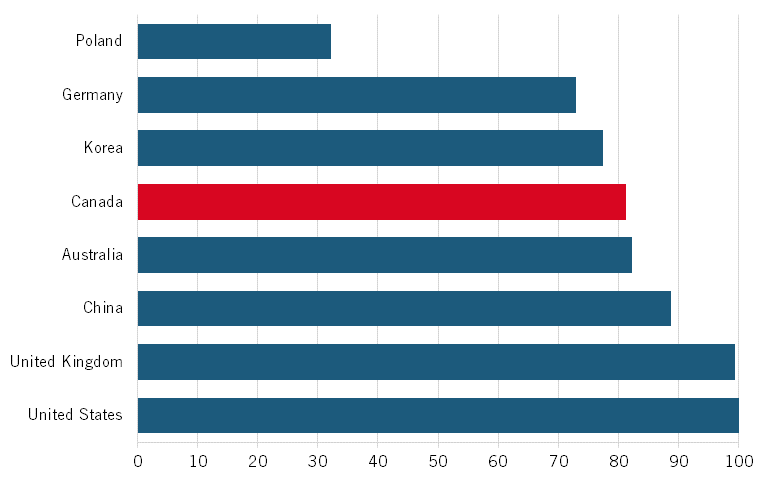
Figure 13: Share of age 25–64 population with a university or college degree (2022)[40]
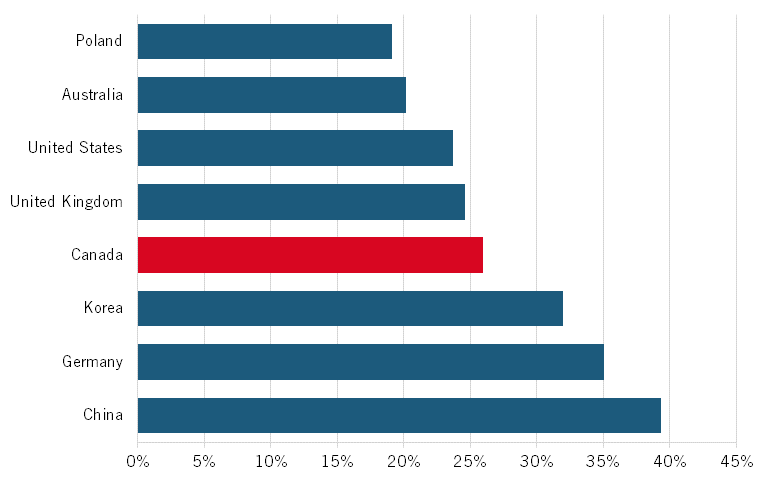
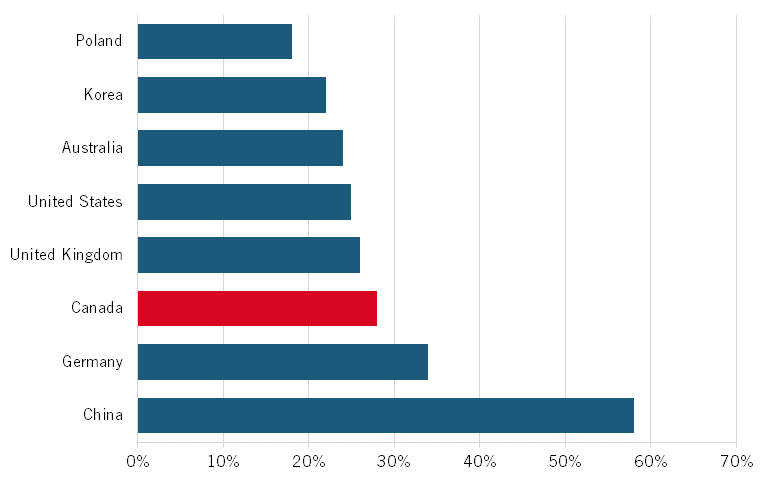
Canada also ranks highly in attainment of science, technology, engineering, and math (STEM) undergraduate degrees as well, lagging behind China, Germany, and Korea among the comparator countries.
Figure 14: STEM undergraduate degrees awarded as a percentage of total undergraduate degrees[41]
Canada also publishes a relatively high number of academic journal articles, as seen in figure 15. However, it’s not enough to just publish articles, even highly cited ones. Knowledge that is relevant to industry needs to be produced and transferred. Using the H-Index, a metric used to measure the number of published papers combined with the number of times authors are cited, Figure 16shows that Canadian authors are cited at noticeably a lower rate than scholars from Germany, the United Kingdom, and the United States.
Figure 15: Scientific and technical journal articles per billion PPP$ GDP (2022) [42]
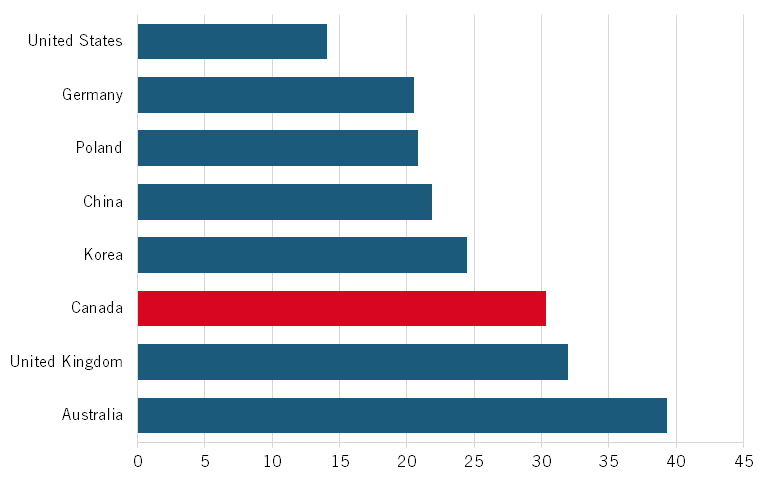
It’s not enough to just publish articles, even highly cited ones. Knowledge that is relevant to industry needs to be produced and transferred.
Figure 16: H-Index of publications (2022) [43]
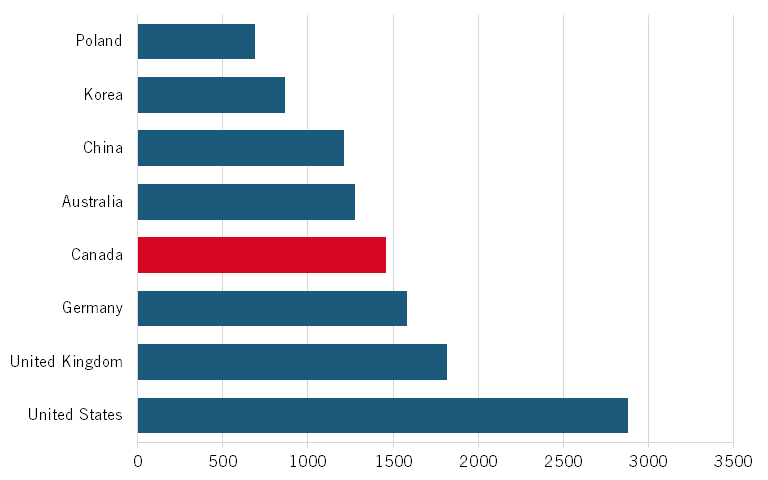
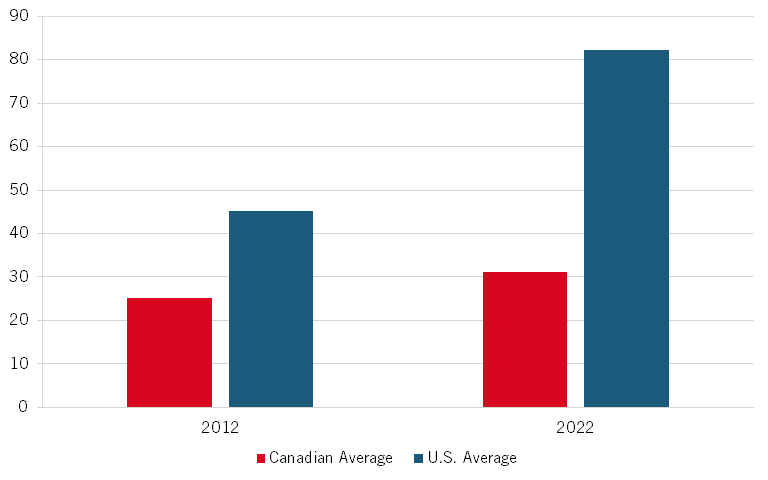
Figure 17 shows that, on average, American university technology transfer offices supported patent applications at almost twice the rate that Canadian ones did in 2012, and that disparity grew to three times in the ensuing decade.
Figure 17: University tech transfer office new patent applications[44]
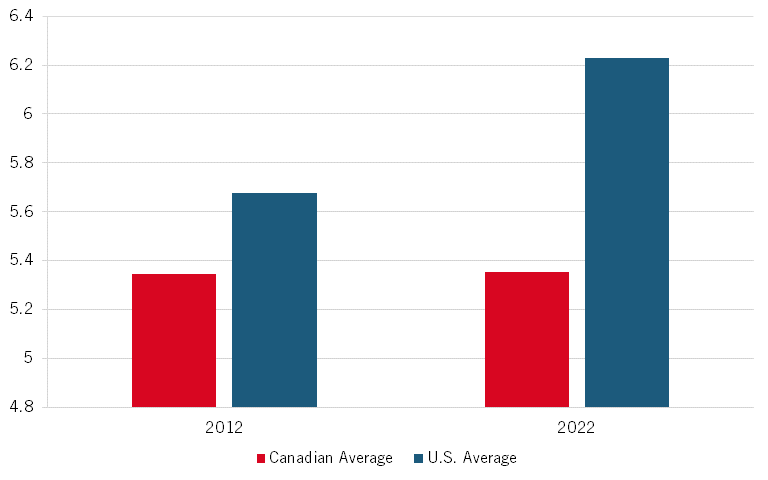
It is not clear from figure 18 whether the U.S. average amount of full-time equivalent (FTE) positions at technology transfer offices has increased due to increased activity, or whether the increased activity has encouraged these institutions to hire additional staff to better service the demand. However, it is clear that American institutions increased the number of FTEs between 2012 and 2022, while Canadian institutions remained relatively static in the amount of personnel support for innovation commercialization at the postsecondary and research institution level.
Figure 18: University tech transfer office licensing FTEs[45]
Labour Force
Though this is not a study on the labour market or trends in skills, the composition of the labour force is nevertheless important when discussing Canada’s innovation potential. From the two following measures and Canada’s overall high-level of postsecondary education and STEM degree attainment, Canada’s labour force appears to be well placed to take advantage of the innovation economy and the digital and advanced skills that it will require. However, whether the Canadian economy sufficiently capitalizes on the appropriate skills and workforce composition is an entirely separate question.
Figure 19 shows that Canada has a relatively average number of business enterprise researchers (adjusted for national labour force), which could indicate that the absolute business enterprise expenditure on R&D per researcher is lower than that of many other countries.
Figure 19: Business enterprise researchers per thousand labour force (2017) [46]
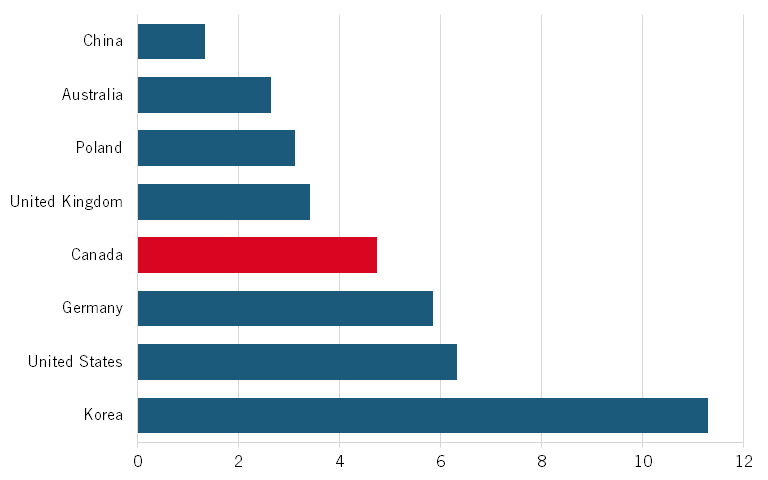
One measure of an economy’s ability to create new jobs in a burgeoning field is annual growth rate of AI jobs (figure 20). Canada ranks highest, and this portends real opportunities for the Canadian economy, especially if it can continue to support AI research and not put in place a regulatory system that limits AI innovation and use. The number of AI jobs in Canada is growing at a faster rate than any other country.
Figure 20: Annual growth rate of proportion of people with AI-related jobs[47]
The number of AI jobs in Canada is growing at a faster rate than any other country.
Technology Use
Innovative businesses both develop and use the results of innovation – namely technology, to succeed against their peers. Canadian businesses appear to be performing well in relation to the comparator countries on technology usage and adoption.
Figure 21 examines the rate at which businesses are adopting information technology tools across the economy. It does so by averaging the rates in which businesses are using tools such as social media, websites, cloud computing, e-commerce, and customer relations management software, among others. Canada performs well compared with the comparator countries, with the main source of Canada’s and Australia’s advantages being the higher percentage of businesses that use social media and cloud computing.
Figure 21: Business information technology (IT) adoption (2019) [48]
Many innovation-intensive industries are no longer as heavily dependent on capital investment in fixed assets, such as real estate, machinery, and equipment. As such, software spending is one way to look at the innovation input of firm-level investments in industries such as information technology, professional services, and finance. Canada spends the third most in the world on software amongst comparator countries, indicating that firm-level investments into software do not appear to be the major culprit behind Canada’s perennial corporate investment gap.
Figure 22: Software spending as a percentage of GDP (2022)[49]
AI tools have the potential to significantly increase productivity at the firm level, though businesses must be both willing and able to utilize them. Similar to figure 20, figure 23 also serves as a proxy to see how well businesses are adapting to brand new innovations. Canada is deploying AI at roughly the same rate as most of the comparator countries, apart from China.
Figure 23: Percentages of businesses that deployed AI (2022) [50]
Fast-Growing Businesses
Venture capital plays a crucial role in the innovation economy, providing funding for start-ups to grow their innovations into businesses. They provide the necessary resources for funding R&D, product development, and market expansion activities that most early-stage businesses do not possess, and also assist in the creation of a competitive environment wherein business models are evaluated early on. Canada’s venture capital investment exceeds most other countries’ but is much lower than U.S. funding.
Figure 24: Venture capital investment as a percentage of GDP[51]
The existence of unicorns, or start-ups with a valuation worth over $1 billion, shows a country’s ability to scale a company through the various stages of its innovation ecosystem as well as general investor confidence in a country’s innovation potential. As seen in figure 25, Canada appears to have a relatively mediocre measure of unicorn valuations, about one third the rate of the United States. This reflects Canada’s longstanding scale-up issue.
Figure 25: Unicorn valuations as a percentage of GDP (2022)[52]
Productivity Performance
As is widely understood, Canada’s productivity performance (output per worker hour) has been dismal. This can be seen by comparing Canadian labour productivity growth with the United States’. From 1982 to 2002, U.S. growth was 51 percent faster than Canada’s. From 2002 to 2022, American growth was an astounding 160 percent faster. (See figure 26.) While both economies’ growth rates fell in the latter period, America’s decline was just 26 percent, while Canada’s was 47 percent.
Figure 26: United States and Canadian labour productivity growth rate from 1982 to 2002 and 2002 to 2022[53]
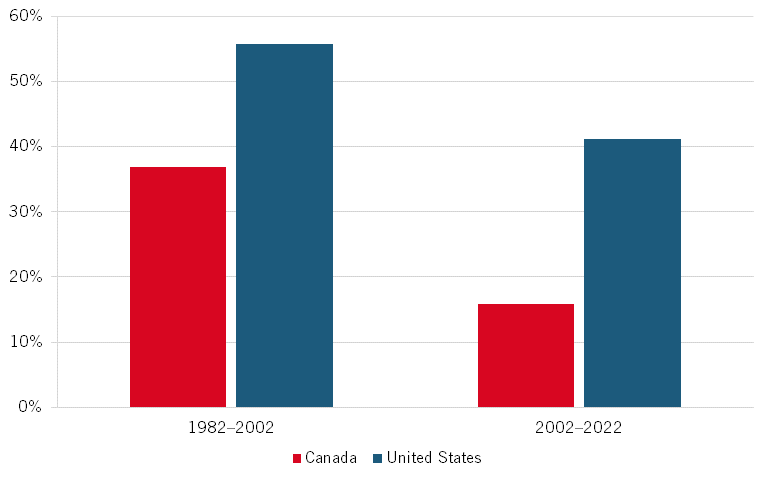
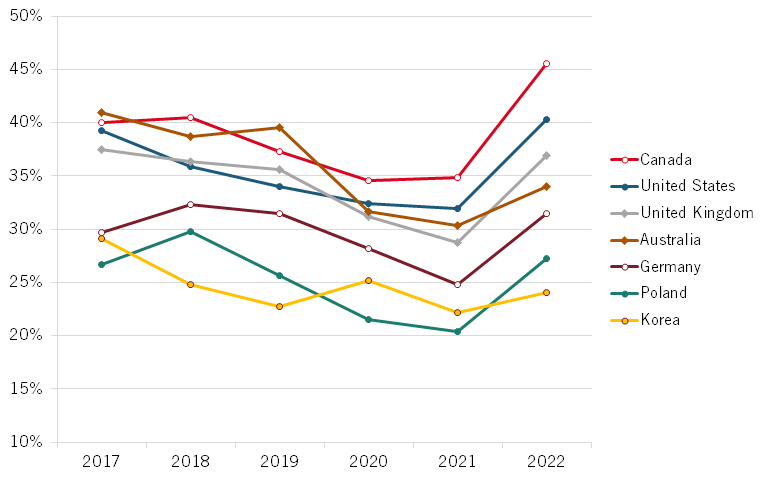
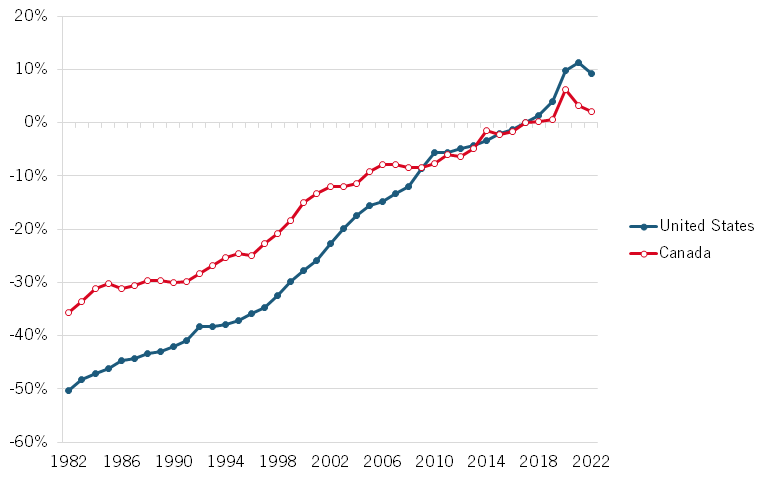
Figure 27 provides the same data for every year, with both countries’ productivity indexed to 2017. As shown, the United States grew faster for both periods, although from 2010 to around 2016, Canada’s growth kept pace, only to fall off again after that.
Figure 27: United States’ and Canadian labour productivity compared to base year 2017[54]
When comparing against the benchmark nations, we can see that Canada’s performance is at the lower end of the ranking. (China is excluded because its productivity was so high: 162 percent and 99 percent). From 2002 to 2012, Canada ranked last in productivity growth, about half the U.S. rate, and one-sixth the rate in Poland and South Korea. (See figure 28.) From 2012 to 2023, Canada’s relative performance was somewhat better, ranking third last, ahead of the United Kingdom and Germany. (See figure 29.)
Figure 28: Labour productivity, percentage growth, 2002–2012[55]
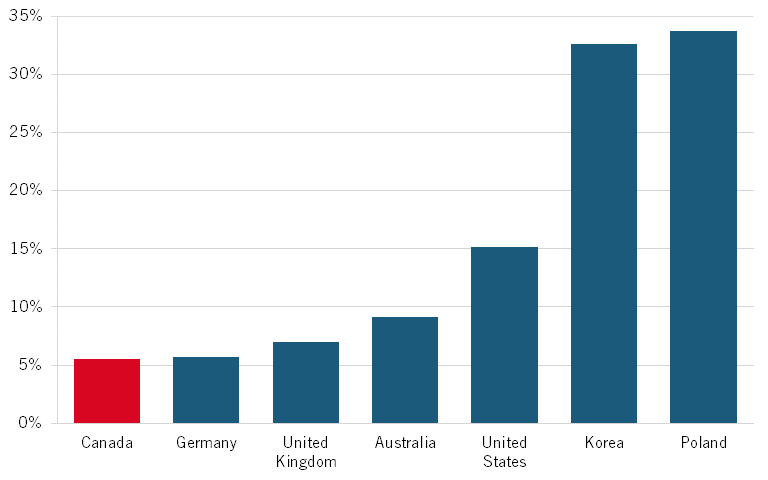
Figure 29: Labour productivity, percentage growth, 2012–2023[56]
When looking at individual Canadian industries at the 3-digit industry level, what is most striking is the significant divergence in labour productivity growth from 2011 to 2021. Many of the top performers were in retail and wholesale trade (e.g., miscellaneous store retailers, nonstore retailers, furniture stores, sporting goods), where the Internet and e-commerce may have played a key role. Other industries that were information or IT-based (other information services, telecommunications, publishing, and broadcasting) also saw reasonable gains. Twenty-one of 78 industries saw declines, some of which, such as air transportation, motion pictures, and couriers, were potentially related to COVID-based economic contraction. Finally, only 5 of 19 manufacturing sectors saw more than 2 percent annual productivity gains over the 10 years, a very low rate, especially when looking at historical Canadian manufacturing performance. Without stronger performance, it will be difficult for them to compete internationally.
Table 4: Labour productivity growth from 2011 to 2022 by industry (manufacturing in italics) [57]
|
Industry |
% Change |
|
Personal and household goods wholesaler-distributors |
81% |
|
Miscellaneous store retailers |
77% |
|
Crop production |
71% |
|
Clothing and clothing accessories stores |
71% |
|
Animal production |
62% |
|
Sporting goods, hobby, book and music stores |
58% |
|
Non-store retailers |
54% |
|
Provincial and territorial government services |
52% |
|
Oil and gas extraction |
50% |
|
Accommodation services |
46% |
|
Other information services |
44% |
|
Rail transportation |
39% |
|
Publishing industries (except Internet) |
39% |
|
Telecommunications |
35% |
|
Lessors of non-financial intangible assets (except copyrighted works) |
34% |
|
Building material and garden equipment and supplies dealers |
34% |
|
Miscellaneous manufacturing |
33% |
|
Non-metallic mineral product manufacturing |
32% |
|
Private households |
32% |
|
Rental and leasing services |
29% |
|
Miscellaneous wholesaler-distributors |
28% |
|
Computer and electronic product manufacturing |
25% |
|
Petroleum and coal product manufacturing |
25% |
|
Furniture and related product manufacturing |
25% |
|
Insurance carriers and related activities |
23% |
|
Furniture and home furnishings stores |
22% |
|
Repair and maintenance |
21% |
|
Motor vehicle and parts wholesaler-distributors |
21% |
|
Health and personal care stores |
20% |
|
Wood product manufacturing |
20% |
|
Plastics and rubber products manufacturing |
20% |
|
Pipeline transportation |
19% |
|
Data processing, hosting, and related services |
17% |
|
Machinery manufacturing |
17% |
|
Machinery, equipment and supplies wholesaler-distributors |
16% |
|
Chemical manufacturing |
15% |
|
General merchandise stores |
15% |
|
Farm product wholesaler-distributors |
13% |
|
Electronics and appliance stores |
13% |
|
Food manufacturing |
12% |
|
Primary metal manufacturing |
12% |
|
Broadcasting (except Internet) |
12% |
|
Nursing and residential care facilities |
11% |
|
Support activities for agriculture and forestry |
9% |
|
Support activities for mining and oil and gas extraction |
9% |
|
Food, beverage and tobacco wholesaler-distributors |
8% |
|
Motor vehicle and parts dealers |
8% |
|
Amusement, gambling and recreation industries |
7% |
|
Government educational services |
7% |
|
Gasoline stations |
5% |
|
Real estate |
4% |
|
Water transportation |
4% |
|
Federal government services |
4% |
|
Printing and related support activities |
3% |
|
Fabricated metal product manufacturing |
3% |
|
Food and beverage stores |
2% |
|
Monetary authorities - central bank |
2% |
|
Electrical equipment, appliance and component manufacturing |
1% |
|
Personal and laundry services |
1% |
|
Administrative and support services |
0% |
|
Truck transportation |
-1% |
|
Food services and drinking places |
-1% |
|
Building material and supplies wholesaler-distributors |
-4% |
|
Petroleum product wholesaler-distributors |
-6% |
|
Warehousing and storage |
-6% |
|
Social assistance |
-6% |
|
Paper manufacturing |
-7% |
|
Waste management and remediation services |
-10% |
|
Support activities for transportation |
-11% |
|
Forestry and logging |
-12% |
|
Ambulatory health care services |
-14% |
|
Transportation equipment manufacturing |
-15% |
|
Wholesale electronic markets, and agents and brokers |
-17% |
|
Mining and quarrying (except oil and gas) |
-18% |
|
Fishing, hunting and trapping |
-19% |
|
Government health services |
-21% |
|
Postal service |
-23% |
|
Beverage and tobacco product manufacturing |
-23% |
|
Motion picture and sound recording industries |
-28% |
|
Couriers and messengers |
-35% |
|
Air transportation |
-37% |
Only 5 of 19 manufacturing sectors saw more than 2 percent annual productivity gains from 2011 to 2021, a very low rate.
The lagging rates of productivity growth in Canada are one reason why Canada ranks behind the United States, Germany, the United Kingdom, and Australia. At continued rates of productivity growth, both Poland and Korea should lead Canada by the end of the decade.
Figure 30: GDP per hour worked in 2022 (constant prices, 2015 PPPs)[58]
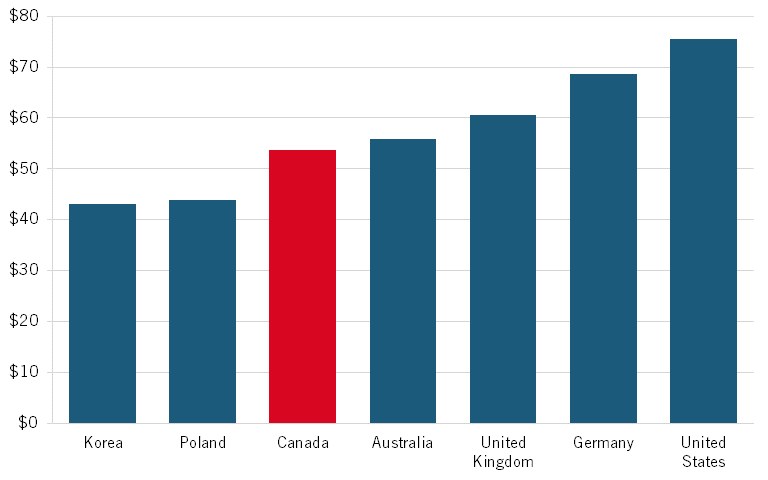
At continued rates of productivity growth, both Poland and Korea should lead Canada by the end of the decade.
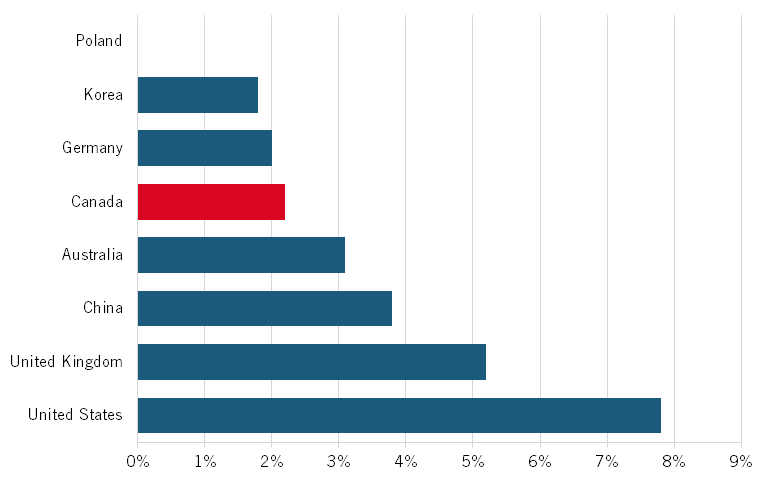
There are many explanations for Canada’s lagging productivity performance, but in our view most are speculation at best (among the best work on this is from the Canadian Centre for the Study of Living Standards).[59] The purpose of this report is not to lay out a productivity strategy for Canada. However, it is clear that one reason for lagging productivity performance is lagging investment in new capital equipment (machinery, equipment, software, computers, etc.). One source of data for international comparison comes from OECD whose measure includes machinery and equipment and weapons systems spending.[60] In 2020, Korea led the comparator nations, investing 9 percent of GDP. Only the United Kingdom was lower than Canada.
Figure 31: Machinery, equipment, and weapons systems share of GDP in 2020
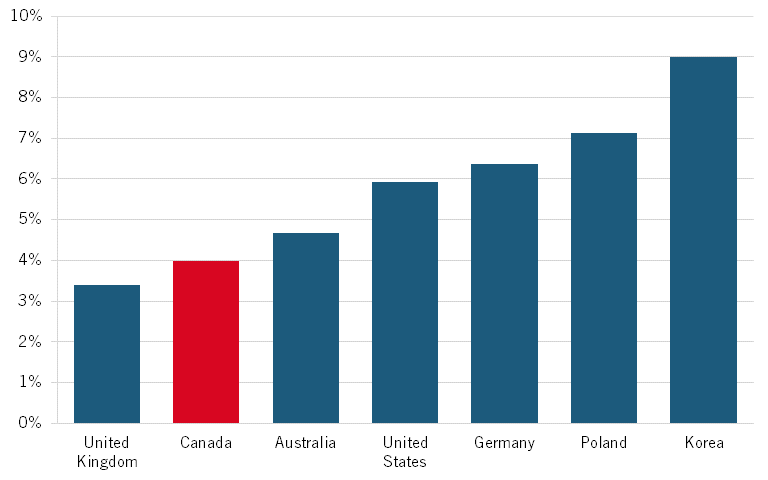
One reason for lagging productivity performance is lagging investment in new capital equipment.
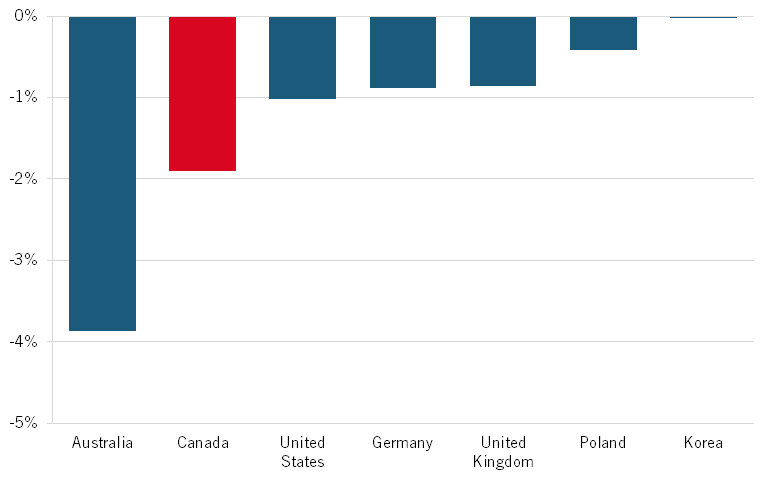
In terms of trends, investment has generally been falling as a share of GDP, in part perhaps because the cost of computing has fallen, and that makes up a considerable share of machinery costs. As a share of GDP, from 2005 to 2020, only Australia saw larger declines in investment than did Canada.
Figure 32: Machinery and equipment and weapon system share of GDP percentage point change, 2005–2020
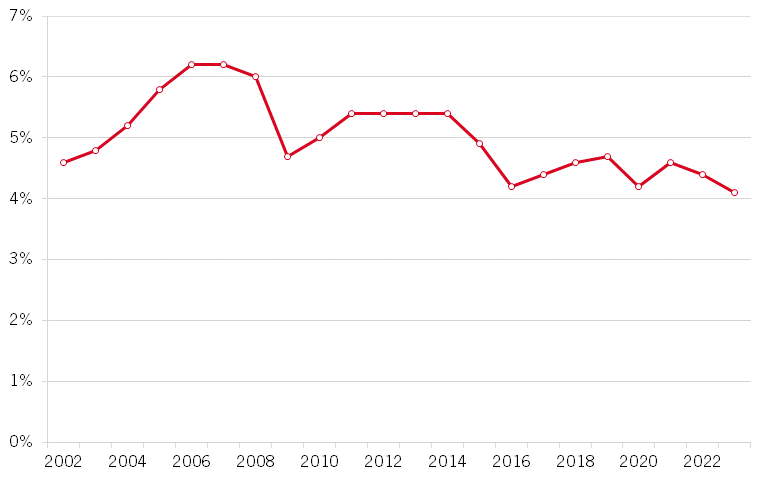
Within Canada, machinery and equipment expenditures as a share of total consumption expenditures peaked in the mid-2000s at around 6.2 percent and have since fallen to almost 4 percent in 2023.
Figure 33: Machinery and equipment as a share of final consumption expenditures, 2002–2023[61]
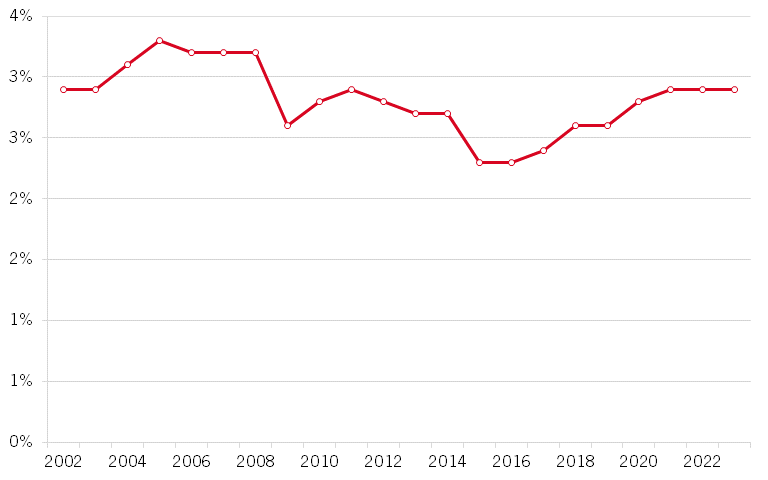
Canada’s performance in IP products is similar but somewhat better, peaking in the mid-2000s and falling slightly by 2023.[62]
Figure 34: IP products as a share of final consumption expenditures, 2002–2023[63]
These downward trends in investment reflect dramatic differences between industries, as table 5 and table 6 show. For example, according to government data, machinery and equipment investments by finance and insurance fell 78 percent over the last two decades, while mining and quarrying (except oil and gas) increased 328 percent. We see similarly wide disparities in the growth of IP products investment over the same period.
Table 5: Machinery and equipment investment percentage change from 2002 to 2022[64]
|
Industry |
% Change |
|
Other Indigenous government services |
5,280% |
|
Holding companies |
1,472% |
|
Educational services |
483% |
|
Mining and quarrying (except oil and gas) |
328% |
|
Support activities for agriculture and forestry |
275% |
|
Defence services |
245% |
|
Administrative and support, waste management and remediation services |
215% |
|
Primary metal manufacturing |
192% |
|
Health care and social assistance |
187% |
|
Construction |
164% |
|
Other municipal government services |
162% |
|
Nursing and residential care facilities |
152% |
|
Government sector |
128% |
|
Miscellaneous manufacturing |
115% |
|
Wood product manufacturing |
108% |
|
Wholesale trade |
106% |
|
Other provincial and territorial government services |
99% |
|
Forestry and logging |
90% |
|
Utilities |
89% |
|
Other federal government services |
89% |
|
Professional, scientific and technical services |
89% |
|
Crop production |
86% |
|
Hospitals |
81% |
|
Accommodation and food services |
81% |
|
Arts, entertainment and recreation |
65% |
|
Chemical manufacturing |
65% |
|
Transportation equipment manufacturing |
64% |
|
Fishing, hunting and trapping |
64% |
|
Beverage and tobacco products manufacturing |
60% |
|
Machinery manufacturing |
54% |
|
Fabricated metal product manufacturing |
48% |
|
Agriculture, forestry, fishing and hunting |
42% |
|
Transportation and warehousing |
42% |
|
Food manufacturing |
41% |
|
Total all industries |
40% |
|
Manufacturing |
40% |
|
Information and cultural industries |
40% |
|
Other services (except public administration) |
35% |
|
Non-profit institutions serving households |
27% |
|
Support activities for mining and oil and gas extraction |
19% |
|
Electrical equipment, appliance and component manufacturing |
16% |
|
Mining, quarrying and oil and gas extraction |
15% |
|
Retail trade |
14% |
|
Real estate and rental and leasing |
13% |
|
Plastics and rubber products manufacturing |
9% |
|
Conventional oil and gas extraction |
5% |
|
Non-metallic mineral product manufacturing |
-3% |
|
Paper manufacturing |
-6% |
|
Furniture and related product manufacturing |
-9% |
|
Petroleum and coal products manufacturing |
-11% |
|
Animal production |
-24% |
|
Finance, insurance, real estate, rental and leasing |
-34% |
|
Non-conventional oil extraction |
-36% |
|
Computer and electronic product manufacturing |
-46% |
|
Textile and textile product mills |
-56% |
|
Printing and related support activities |
-57% |
|
Clothing and leather and allied product manufacturing |
-75% |
|
Finance and insurance |
-78% |
Table 6: IP products percentage change from 2002 to 2022[65]
|
Industry |
% Change |
|
Nursing and residential care facilities |
6,900% |
|
Educational services |
852% |
|
Administrative and support, waste management and remediation services |
520% |
|
Construction |
433% |
|
Finance and insurance |
348% |
|
Holding companies |
319% |
|
Transportation and warehousing |
286% |
|
Furniture and related product manufacturing |
285% |
|
Support activities for mining and oil and gas extraction |
283% |
|
Mining and quarrying (except oil and gas) |
248% |
|
Retail trade |
214% |
|
Accommodation and food services |
189% |
|
Crop production |
178% |
|
Wholesale trade |
166% |
|
Professional, scientific and technical services |
166% |
|
Health care and social assistance |
155% |
|
Fishing, hunting and trapping |
150% |
|
Finance, insurance, real estate, rental and leasing |
148% |
|
Printing and related support activities |
133% |
|
Food manufacturing |
131% |
|
Other municipal government services |
127% |
|
Support activities for agriculture and forestry |
115% |
|
Utilities |
112% |
|
Arts, entertainment and recreation |
110% |
|
Hospitals |
105% |
|
Defence services |
100% |
|
Non-profit institutions serving households |
98% |
|
Agriculture, forestry, fishing and hunting |
90% |
|
Information and cultural industries |
89% |
|
Miscellaneous manufacturing |
83% |
|
Other federal government services |
58% |
|
Total all industries |
56% |
|
Government sector |
50% |
|
Beverage and tobacco products manufacturing |
48% |
|
Other services (except public administration) |
42% |
|
Electrical equipment, appliance and component manufacturing |
38% |
|
Wood product manufacturing |
37% |
|
Fabricated metal product manufacturing |
24% |
|
Clothing and leather and allied product manufacturing |
18% |
|
Animal production |
15% |
|
Other provincial and territorial government services |
13% |
|
Forestry and logging |
7% |
|
Non-conventional oil extraction |
5% |
|
Plastics and rubber products manufacturing |
1% |
|
Machinery manufacturing |
-1% |
|
Primary metal manufacturing |
-2% |
|
Manufacturing |
-17% |
|
Chemical manufacturing |
-21% |
|
Mining, quarrying and oil and gas extraction |
-27% |
|
Transportation equipment manufacturing |
-30% |
|
Petroleum and coal products manufacturing |
-32% |
|
Non-metallic mineral product manufacturing |
-38% |
|
Computer and electronic product manufacturing |
-44% |
|
Real estate and rental and leasing |
-54% |
|
Textile and textile product mills |
-59% |
|
Paper manufacturing |
-71% |
|
Conventional oil and gas extraction |
-77% |
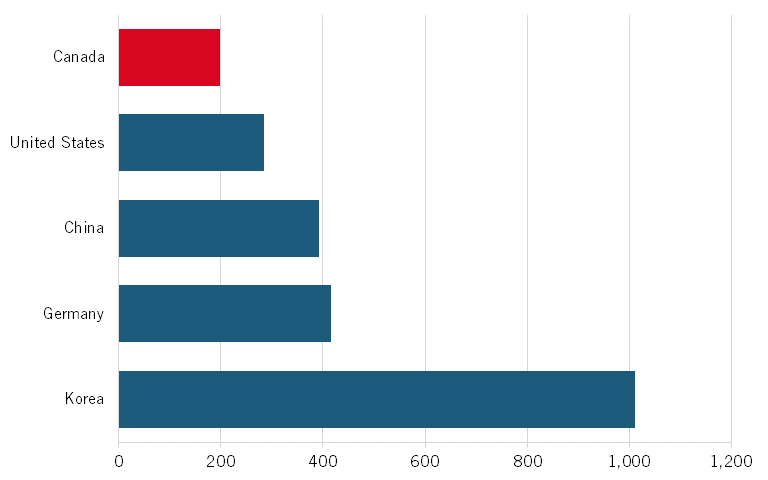
Robotics adoption is increasingly a key to boosting productivity. Figure 35 shows that Canada uses significantly fewer industrial robots per manufacturing worker than the comparator countries that were included in the International Federation of Robotics’ data. Given the fact that Canada’s top manufacturing industries, like transportation equipment, chemicals, and fabricated metals, are all generally considered to be robotics-intensive relative to other manufacturing industries, Canada’s low use of robotics cannot simply be blamed on industrial composition.[66] Canadian businesses chronically underinvest in new capital equipment relative to the other comparator countries, and robots is just one indicator. Canada’s low level of robot installation compared to China and Korea is particularly striking becase Canadian manufactguring wages are higher, which increases the return on investment of investing in robots.
Figure 35: Industrial robots per 10,000 manufacturing workers (2022)[67]
Competitiveness Performance
To assess Canada’s competitiveness performance, we examined changes in global shares of value-added output in 10 advanced industry sectors that are largely traded across national borders: pharmaceuticals; electrical equipment; machinery and equipment; motor vehicle equipment; other transport equipment; computer, electronic, and optical products; information technology and information services; chemicals (not including pharmaceuticals); basic metals; and fabricated metals. To conduct this analysis, we use production data from OECD’s dataset on trade in value added, covering the period from 1995 through 2020 (the last year of data availability).[68]
To assess Canada’s relative performance in these industries, we used an analytical statistic known as a location quotient (LQ), which measures a region’s level of industrial specialization relative to a larger geographic unit—in this case, a nation relative to the rest of the world. The LQ is calculated as an industry’s share of the economy divided by the global industry’s share of the global economy. An LQ greater than 1 means the country’s share of global output in an industry is greater than the global average; and an LQ less than 1 means a country’s share is less than the global average. Using these indicators, it is clear that not only has Canada consistently underperformed relative to the world, but it has lost ground.
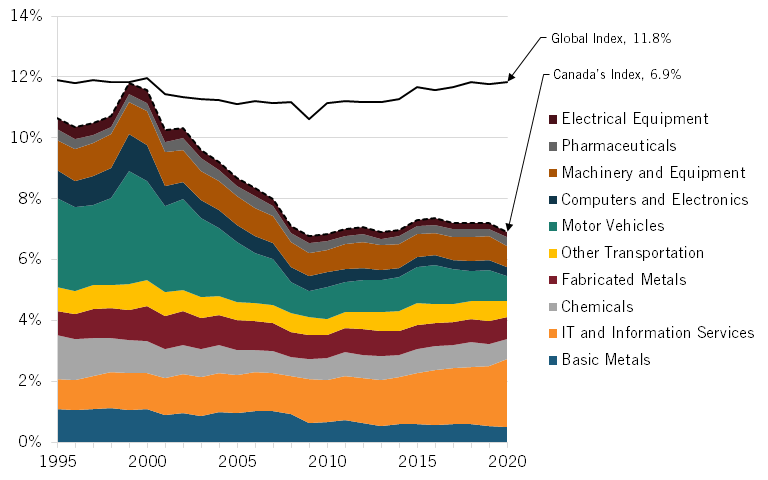
In the late 1990s, largely because of motor vehicles, Canada was about as concentrated in these advanced industries as the rest of the world. But its share sank dramatically in the 2000s, largely because of the “China shock” of China joining the World Trade Organization (WTO) and becoming the manufacturing workshop of the world. However, after the 2010s, its specialization in these industries largely stabilized, in part because of growth in the IT and information services sector. (See figure 36.)
Figure 36: Hamilton Index industries’ shares of Canada’s economy
Not only has Canada consistently underperformed relative to the world, but it has lost ground.
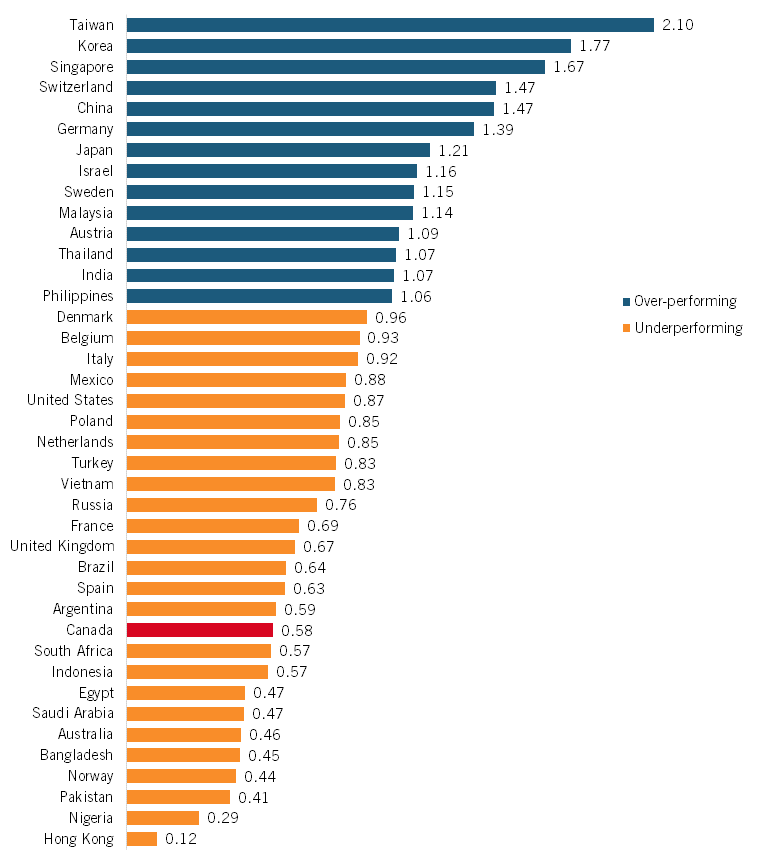
Figure 37 shows LQs for the sum of all 10 industries in 2020 for 40 countries. Countries with a blue bar graph have above-average production of these industries. Countries with orange graphs are below. It is striking that Canada’s LQ is 0.58 (almost half the global average). That puts Canada behind all OECD countries except Australia and Norway, and behind developing nations such as Mexico, Vietnam, and Argentina—and of course, China.
Figure 37: Relative national performance in the composite Hamilton Index (2020 LQ)
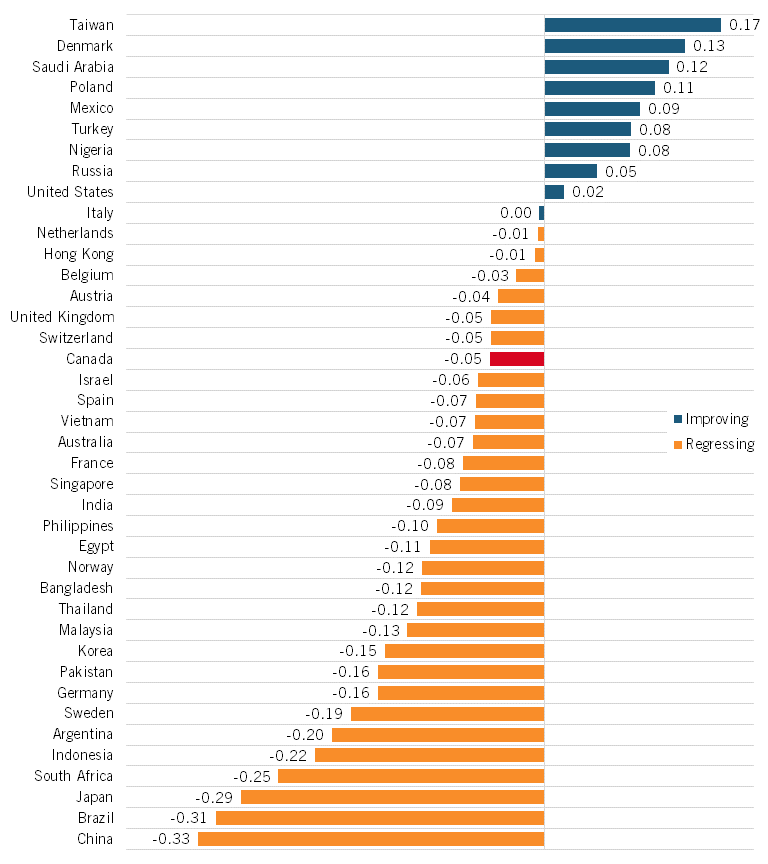
Canada’s relative performance compared with these other nations is also weak. From 1995 to 2020, Canada’s LQ fell 0.31 points, with only South Africa seeing a worse decline. Contrast that with Taiwan and Korea, whose LQs grew by even more than did Canada’s decline. (See figure 39.) However, as noted, Canada’s decline relative to the rest of the world slowed after 2008, with its LQ falling 0.05 points. (See figure 41.)
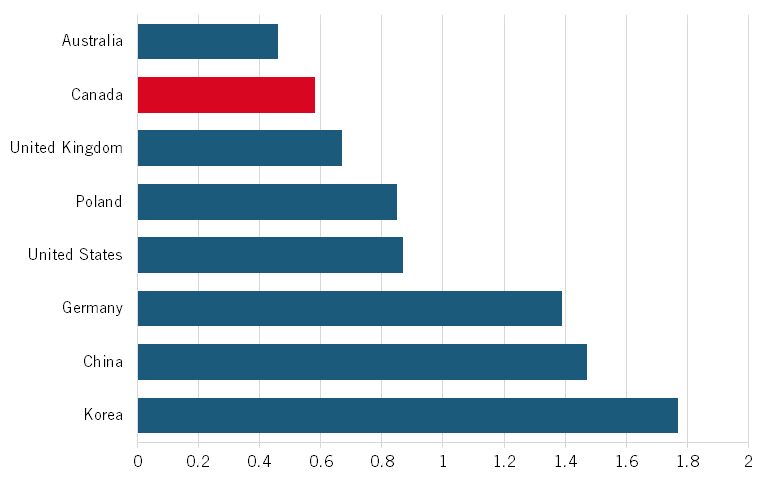
When comparing with the seven benchmark countries, Canada also performs poorly. Only Australia has a lower LQ. (See figure 38.) The leaders are Korea (built largely on its computer and electronics industry), China (with leadership in electronics, steel, mechanical equipment, chemicals, and computers), and Germany (with leadership in chemicals, motor vehicles, and machinery and equipment).
Figure 38: 2020 advanced industry location quotients
However, when it comes to change in LQ from 1995 to 2000, Canada’s performance was the worst, with its LQ falling from 0.89 to 0.58. In contrast, Poland (emerging from under the thumb of communist rule) and Korea (a robust “Asian Tiger”), saw the highest gains. (See figure 39.)
Figure 39: Percentage change in advanced industry concentration from 1995 to 2020[69]
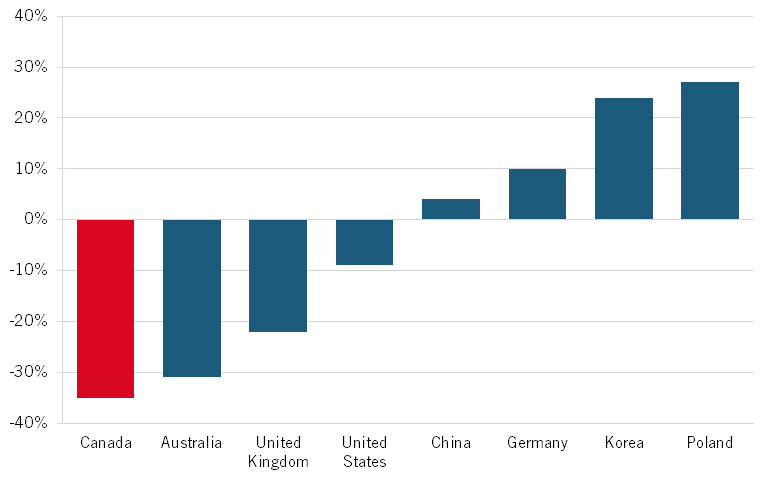
Figure 40: Change in relative national performance in the composite Hamilton Index (LQ difference, 1995–2020)
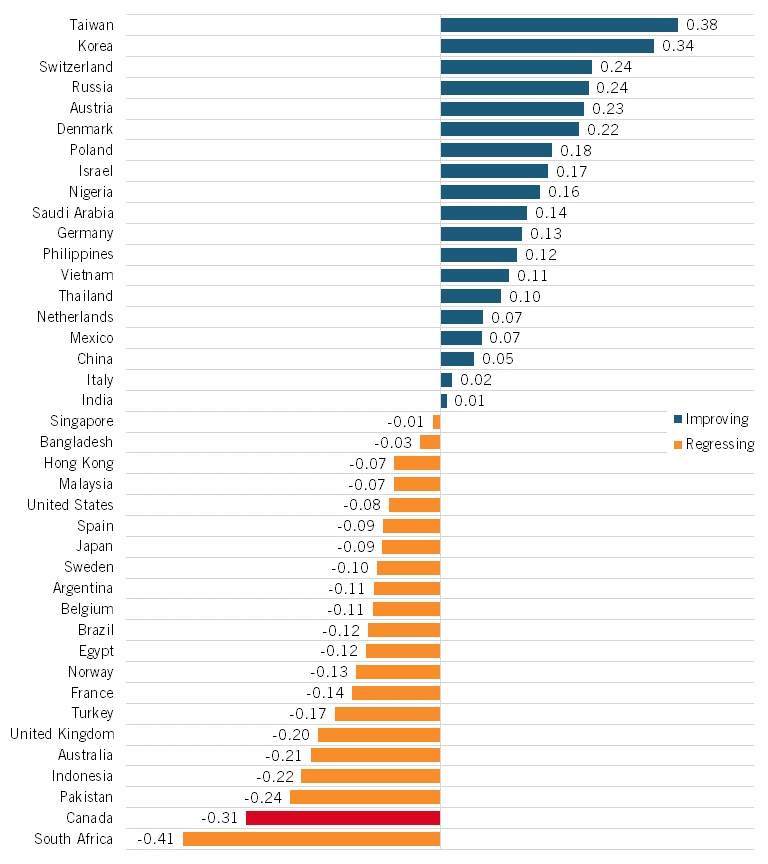
Figure 41: Change in relative national performance in the composite Hamilton Index (LQ difference, 2008–2020)
In terms of relative industry strength, Canada is above average in only one: other transportation, where Canada’s LQ is 1.21, presumably based on the strength of airplane manufacturer Bombardier. (See figure 42.) Canada’s second strongest industry, relative to the rest of the world, is IT and information services, where its LQ is almost 1 (0.99). This is likely because of the strength of its universities and related start-ups and major investments by U.S. IT and information services companies in Canada. In contrast, Canada is below average in all other advanced industries. Electrical equipment and computer and electronics are the worst-performing industries, with LQs of only 0.26 and 0.20, respectively.
Figure 42: Canada’s relative historical performance in Hamilton industries (LQ Trends)
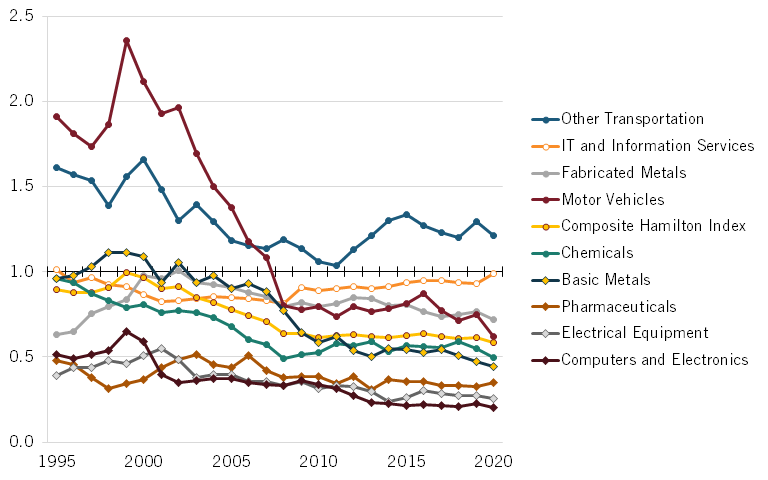
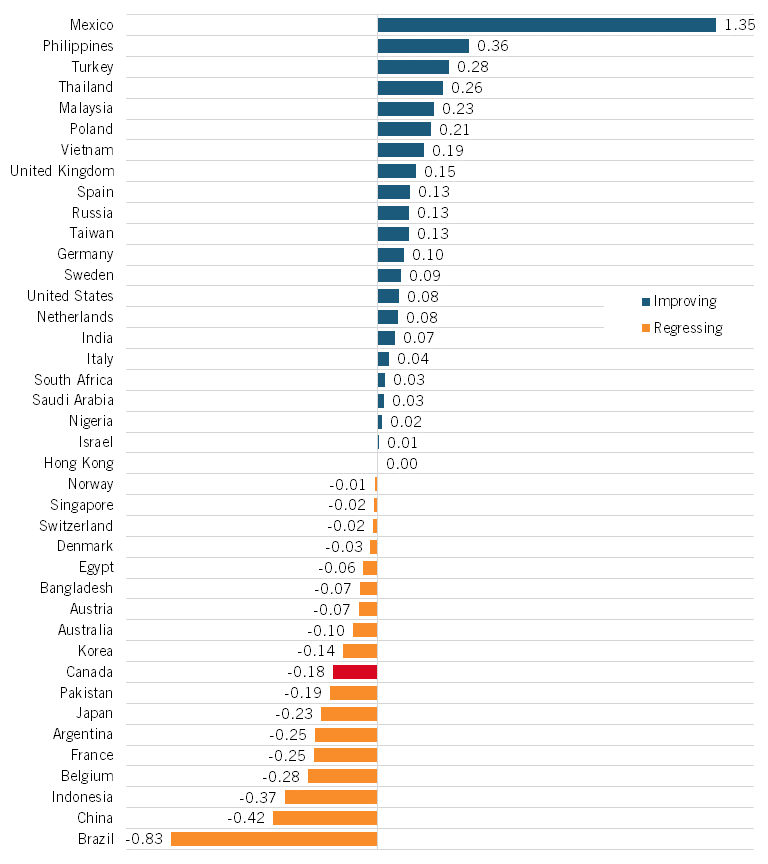
Moreover, as seen in figure 41, the story of Canada’s competitiveness decline is motor vehicles, which peaked at an LQ of around 2.4 in 1999 and plummeted to around 0.8 in 2008. But this is a problem the United States also faces, with its motor vehicle LQ being even lower as of 2020, at 0.57. (See figure 43.) Overall, the U.S. auto industry is quite weak compared with European and Asian producers. Moreover, a significant share of North American production has moved to Mexico, which has the highest LQ in motor vehicles of any country in the world at 3.14. In 2008, Canada accounted for 1.9 percent of the world’s motor vehicle output. By 2020, that fell to 1.2 percent. In the same period, Canada’s LQ in motor vehicles declined from 0.80 to 0.62. (See figure 44.) In contrast, Mexico went from 2.8 percent global market share to 4 percent, while the United States went from 11.6 to 14 percent.
From the early 2000s until 2020, the LQs for all the industries except other transportation and IT and other information services declined. Other transportation is Canada’s only industry that has been both strong and improving since 2008. IT and information services and chemicals are the only two industries that are weaker than the global average but have been improving since 2008. The remainder of Canada’s industries are both weak and declining: basic metals, motor vehicles, computers and electronics, electrical equipment, machinery and equipment, fabricated metals, and pharmaceuticals.
Figure 43: Relative performance in motor vehicles (2020 LQ)
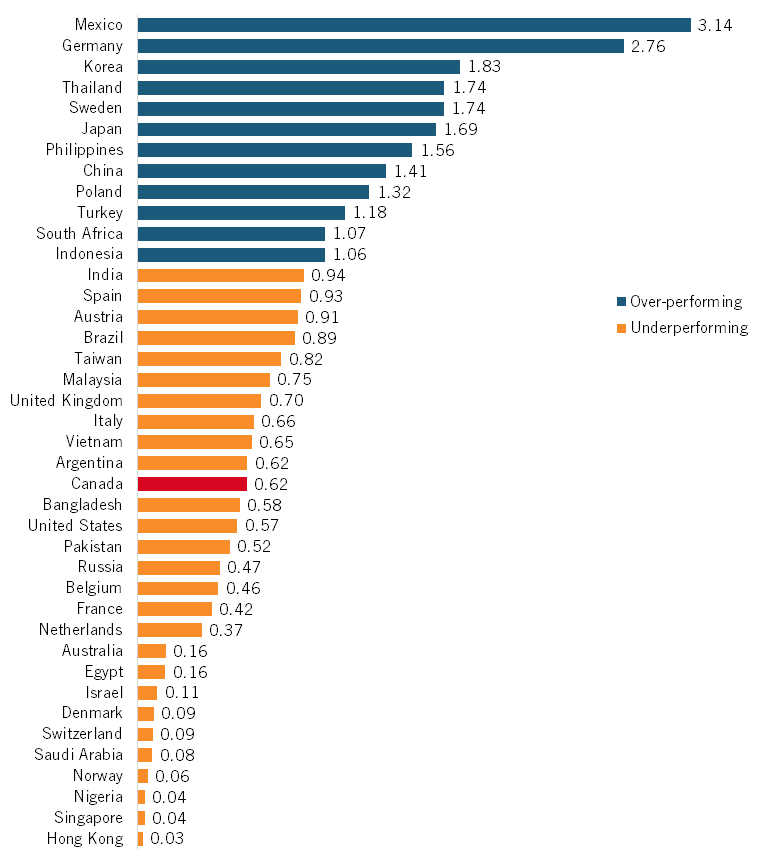
Figure 44: Net change in relative performance in motor vehicles, 2008–2020 (LQ difference)
One final note on Canadian competitiveness. In the 20th century, it was easier for Canada to build competitive global companies than it is now, largely because Asian competition, and Chinese in particular, was much less challenging then. The United States lost a number of leading companies and industries to Asia, and in particular to China (e.g., telecom equipment and solar panels). But it still retained many leading companies as well as enabled the creation of an array of new advanced technology companies that have become world leaders. Canada has lost many of its leading firms in the last 40 years or so, including Massey Fergusen, Stelco, Nortel, and Blackberry. And it’s not clear how Bombardier will fare, especially with foreign ownership and China likely to get into the same market.[70]
The reality is, should Canadian entrepreneurs today seek to build up similar companies today, the global headwinds will be much stronger. This is not cause for despair; rather, it is to point out the reality of the nature of today’s competition, and why Canada needs to double down on growing globally competitive advanced industry companies.
What To Do
It is beyond the scope of this report to lay out a detailed agenda for Canadian IPC. However, we do offer nine principles to guide policy.
Principle 1: Reject “Silver Bullet” Solutions
It is heartening that the issue of Canada’s declining IPC has been getting significant attention in Canadian public discourse. Unfortunately, too much of that discourse is focused on advancing single causes and silver bullet solutions. A good example is antitrust, where much of the narrative now holds tougher antitrust enforcement as the key to Canadian renewal. For example, The Globe and Mail editorial board has written that Canada should eliminate its efficiencies defense (which would make it easier to merge if companies boosted productivity) on the grounds that this change would—get ready—boost productivity![71] In examining why Canadian businesses are so reluctant to invest and innovate, the Centre for Productivity and Prosperity blamed lack of internal competition.[72] Yet, the last time the Canadian government released data on change in industry concentration ratios was around 2008, though this lack of evidence does not stop advocates from claiming that the competition sky is falling.
If Canada ran the same surplus as the United States does as a share of GDP, the increase to Canadian income would equal just 3 percent of Canadian GDP, hardly enough to move the needle on productivity.
Another popular explanation for weak productivity growth is weak IP ownership. Perhaps the most prominent proponent of this view is former Blackberry CEO Jim Balsillie, who critiqued recent comments by Carolyn Rogers, senior deputy governor, Bank of Canada, about Canada’s productivity crisis: “What we actually need is complex, robust industrial strategies that lead us from idea creation, idea retention and then the selling of that idea globally through a domestically headquartered firm.”[73]
But even if Canada were a global leader in IP, that would do little for Canadian productivity, as Canada runs a trade deficit in IP payments. If Canada ran the same surplus as the United States does as a share of GDP, the increase to Canadian income would equal just 3 percent of Canadian GDP, hardly enough to move the needle on productivity.[74]
The last time the Canadian government released data on change in industry concentration ratios was around 2008, though this lack of evidence does not stop advocates from claiming that the competition sky is falling.
Other popular explanations include a cultural resistance to innovation, too little help for small business, too many lower-skilled immigrants, too much regulation, high taxes, too little investment in the green transition, and more.[75] While all these issues may have validity, neither simple explanations nor silver bullet solutions serve Canada well, and lead to policymakers missing the bigger picture. Other explanations, such as lack of both R&D spending and capital investment in machinery, are not really explanations; they are symptoms. In part, silver bullet thinking reflects a lack of adequate analysis that identifies true causes of Canadian firms’ lagging IPC performance.
Principle 2: Move Beyond Ingredientism
“Ingredientism” refers to the belief that a nation can succeed in IPC principally by having robust quantities of the right ingredients. These can include effective trade agreements, good universities, the rule of law, educated workers, good broadband, etc. If ingredients were all that mattered, Canada would be one of the top innovation economies in the world.
Indeed, for years, Canada ranked among the leaders in various innovation indexes that were based on ingredients.
One recent study compares a number of leading countries, including Canada and the United States, to determine the relationship between increases in graduation rates in higher education and transformation to a more tech-based economy. It finds that Canada is alone among the nations where an increase in skilled workers does not support technological change in the economy, and “that skilled workers were allocated mainly to the Skilled Non-Market Services” (e.g., health care, higher education, government, etc.).[76] In fact, the coefficient for high-tech industry in Canada is negative, meaning more education is associated with less private sector high-tech industry, whereas in other nations, it is positive. More ingredients in Canada no longer do the job.
If ingredients were all that mattered, Canada would be one of the top innovation economies in the world.
Moreover, it’s not just the quantity of the ingredients, it’s having the right ingredients. You can’t bake a raisin pie with apples; you need raisins. In this sense, policies focused on ingredients, especially education and research, need to ensure that they are producing the ingredients that are needed by Canadian business, especially in advanced industries. In addition, ingredients have to be high quality. A cake with really good flour is better than one with mediocre flour. At least in the United States, the quality of college graduates appears to be lacking. In a study of second-semester seniors of four-year colleges, just 38 percent, 40 percent, and 34 percent were proficient in prose, document, and quantitative literacy, respectively.[77] One study of Ontario universities finds that there is no statistically significant improvement in critical thinking skills between entry and graduation.[78]
It’s pretty easy to graduate more students, even in STEM. It is vastly harder to hold universities and professors accountable for ensuring that their students are highly skilled. Related to this, Canadian governments should drive education reform to focus more on capabilities (e.g., thinking, writing, analysis and logic, quantitative analysis) and less on things (learning facts).
But just as one cannot bake a cake without the right ingredients, one also cannot do so without a good stove, utensils, recipe, and cook. Ingredients are not enough to build technology hubs, start-ups, and high-productivity firms. As such, Canadian IPC policy needs to focus much more on institutions than on ingredients. To take one example, Canadian universities get a significant amount of federal funding. But what are they actually doing with it? Is their research aligned with Canadian industry needs? Are their policies and programs providing real incentives for the commercialization of technology within Canada? Do provincial governments reward or penalize universities based on their contribution to Canadian tech commercialization? It’s time to move beyond ingredients to recipes.
Principle 3:Think Sectors and Technology, Not Markets and Economy
In Canda and other Commonwealth countries (and the United States), neoclassical economists call the shots, declaring what is appropriate to even be considered. And their focus is almost exclusively on price-mediated national economies, wherein innovation is seen as exogenous from the model. But this simplistic modeling of innovation and the innovation economy causes policy to go off the rails. Canadian economists Richard Lipsey and Kenneth Carlaw have done yeomen’s work to debunk the conventional economics view in favour of an innovation economics view.[79] Others have done similar work.[80] One key insight from innovation economics is that policy needs to be viewed through the lens of organizations, industries, and technologies.
For example, Canada’s productivity crisis cannot be adequately understood or even addressed by simply looking at broad macro factors, such as tax rates, infrastructure, and education. It has to be examined at the sector and firm levels. This is something William Lewis, former head of McKinsey Global Institute, showed so well in his landmark book The Power of Productivity.
Policy needs to be viewed through the lens of organizations, industries, and technologies.
Neoclassical economics assumes that all industries are alike in that they all seek to, and can effectively maximize, productivity, arguing that sectoral productivity policies are not needed because all industries respond adequately to market forces. In fact, productivity policy cannot be fully effective unless it is grounded in a sophisticated understanding that industries differ significantly with regard to their productivity dynamics. Sectoral productivity strategies are about analyzing how opportunities and constraints regarding productivity differ by industry and understanding what policy can do to improve the productivity of all industries.
An effective national productivity policy needs to be based on an analysis of individual industries and, when appropriate, broader production systems. Industries include firms in the same industry. Systems are broader and go beyond any particular industry. For example, the construction industry involves firms that actually build things. But the construction system is broader, including providers of materials inputs (e.g., sawmills), designers (e.g., architects), and builders (e.g., carpenters, welders, etc.) and even building owners. Economies are composed of a wide array of systems, including transportation systems, information systems, transaction systems, health systems, and others.
Embracing this view would mean that a Canadian national productivity strategy would seek to understand why some sectors have above average productivity while others lag behind. It would attempt to determine where key sectors are in terms of adopting global best-in-class productivity practices relative to these same sectors in other nations. As business economist Don Drummond wrote, “Canada is not alone in having shifted gears on framework policies quite radically without reaping all the expected benefits. Something seemed to be missing from the policy paradigm.”[81] He went on to note that a “research agenda with a focus on firm behavior from a micro approach is needed to obtain a deeper understanding of Canada’s terrible productivity record and to develop actions to boost productivity growth.”[82]
Mainstream economists study the overall economy and markets and prices, but they don’t really study the process by which entrepreneurs, firms, and industries use technology to boost IPC. As such, they are not best positioned to provide the kind of advice needed to solve Canada’s IPC problems.
Principle 4: Look to “Productionists” for Advice on Innovation, Productivity, and Competitiveness
Related to the need to focus on sectors and technology is the need to rely less on the discipline of economics. Mainstream economists study the overall economy and markets and prices, but they don’t really study the process by which entrepreneurs, firms, and industries use technology to boost IPC. As such, they are not best positioned to provide the kind of advice needed to solve Canada’s IPC problems.
It’s like going to cardiologist when the person’s problem is cancer. It’s time for Canada to look to “productionists” for analysis and guidance: analysts who have a deep understanding of firm, industry, and technology dynamics. One reason Anglo-American economies, including the United States’, have lagged behind in building advanced industry economies is that industry policy is largely shaped by the discipline of economics—and in this case, neoclassical economics that eschews more sophisticated roles for government in driving industrial competitiveness, productivity, and innovation. Many other countries and regions, such as Scandinavia, Israel, Korea, Singapore, and Taiwan, rely more on productionists and technologists for guidance. Canada needs to the do the same. Economists still need to play a key role in overall macroeconomic policy, but solving the IPC crisis requires new disciplines to be at the table.
Principle 5: Focus Less on Industrial Recruitment and More on Supporting Companies Already in Canada
In many ways, Canada’s national competitiveness and innovation strategy mirrors that of some American states, especially less innovative southern states that have long relied on industrial recruitment to grow their economies. Rather than work to boost homegrown, high-growth entrepreneurship and domestic innovation, they spend enormous resources, including financial, on “incentivizing” multinational corporations to build factories in their states. This appears to be a core of Canada’s growth strategy, too. Canada used to use tariffs to incentivize branch-plant investment; now it uses subsidies.
There are three problems with this strategy, whether at the provincial level or the national level. First, it is enormously expensive, diverting funding that could go to other “build from within” initiatives such as the Canada Innovation Corporation. Second, many of the firms selected are not building on existing Canadian innovation strengths and agglomerations, therefor the positive spillovers to other Canadian firms and supply chains can be limited. Third, these firms are often branch-plant firms that simply produce rather than innovate, at least until their products are made obsolete by technological change or the corporate headquarters gets a better deal from another government to a branch plant somewhere else.
In many ways, Canada’s national competitiveness and innovation strategy mirrors that of some American states, especially less innovative southern states that have long relied on industrial recruitment to grow their economies.
To be fair, it is easy to default to this strategy because it can provide immediate success in the form of ribbon-cutting ceremonies that government officials can stage to show they are creating jobs. A domestic innovation strategy is likely to pay greater longer-term dividends, however. As such, Canadian IPC policy should be more focused on helping firms in Canada, regardless of where they are headquartered, become more competitive, productive, and innovative.
Principle 6: The Only Way to Avoid the Gravitational Pull of the United States Is for Canada to Make Its Own
Canada’s next-door neighbor, the world’s largest economy with the most vibrant technology hubs, has long acted as a magnet for Canadian talent, IP, and start-ups. It is often easier to grow a technology company to scale in an American tech hub such as Boston or Silicon Valley than it is in Canada. While overarching innovation policies and frameworks in Canada can help reduce the gravitational pull balance, they won’t offset it.
Canada needs to build up its own “black hole” gravitational hubs. ITIF wrote in 2019, regarding the United States, that “far from diffusing, the [advanced tech] sector has been concentrating in a short list of superstar metropolitan areas.”[83] And this is because “substantial evidence now suggests that the agglomeration of firms brings with it strong self-reinforcing tendencies that not only inhibit the spread of development, but are likely to exacerbate its concentration.”[84] The same pull from U.S. tech hubs has been exerted on the Canadian economy. In response to ITIF’s proposal, Congress established a regional technology hub program to fund up to 20 metropolitan areas that already possess strong assets but need help to become self-sustaining growth poles. While, realistically, the United States has 8 to 10 places, at best, that could achieve that status, Canada has, at best, three or four. That means Canada’s innovation strategy should seek to build up innovation assets in a few key regions.
This is not to say that other policies supporting sectoral innovation in tourism, agriculture, mining, and other industries are not useful. It is to say that without these kinds of world-class hubs, Canada will struggle in the technology economy. Of course, regional politics make such a concentration strategy difficult, as all regions rightly want advanced industry development, as some have argued regarding the Global Innovation Clusters program launched by the Government of Canada in 2017.[85] But that doesn’t make it any less necessary.
It is important to note that it’s not just Canada that loses technology to national U.S. hubs; many U.S. states do as well. Media headlines often point out that roughly one in four Canadian science, technology, engineering, and math graduates frequently move to the United States after having received four years of publicly funded Canadian postsecondary education.[86] But less than 25 percent of computer science majors that graduate from a Michigan university are working in Michigan in five years after their degree and over one-third are working on the U.S. West Coast.[87] As such, this is not so much a Canada versus United States issue as it is a heartland versus tech hub issue, with the tech hubs being located in the United States.
If one looks at several key innovation economy indicators and compares Canada with the United States without several key U.S. states that are tech hubs (California, D.C. and Maryland, New York, Massachusetts, and Washington), Canada still lags behind on patents per worker (63 percent of the U.S. rate) and venture capital per GDP (55 percent), but it leads the United States in R&D expenditures per GDP (17 percent greater)and R&D employees (300 percent greater).
Canada’s innovation strategy should seek to build up innovation assets in a few key regions.
Focusing policy on a few Canadian tech hubs is key, but even that is likely not enough. Major U.S. tech hubs are incredibly diverse from a technology and industry perspective. To succeed, Canadian hubs will need to specialize and focus on key niche areas where the country can attain global distinctiveness.
Finally, for these hubs to succeed, especially against world-class U.S. hubs, their cost of living will need to become more competitive. Vancouver and Toronto are listed in the top 10 most expensive housing markets in the world.[88] This serves as a drag on hub development. There are only three solutions to this cost problem: 1) incentivize the building of more housing units; 2) incentive the movement of nontech jobs (e.g., back-office jobs) out of these high-cost hubs to other places in Canada; and 3) reduce population growth, particularly through low-skill immigration restrictions (as the Canadian government notes, most immigrants settle in either Montreal, Toronto, or Vancouver).[89] All three will likely be needed.
Principle 7: See Big and Medium-Sized Businesses as Beautiful
Canada is a small-business economy. But that does not mean it should be. A 2008 Bank of Canada study found, “A positive relationship between firm size and both labour productivity and TFP is found in both the manufacturing and non-manufacturing sectors. Given this relationship, the difference in the employment distribution over firm sizes between Canada and the United States can account for half of the Canada-U.S. labour productivity gap in manufacturing.”[90]
This why, according to a 2020 Statistics Canada study, firms with more than 500 employees pay their workers on average 44 percent more than do small firms.[91] Larger Canadian firms are also much more likely to adopt a range of information technologies in their production processes. An OECD study of Canadian technology adoption notes that “the adoption of advanced technologies and practices is positively correlated to the size of firms when taking into account other factors such as industry specificities.”[92] And large technology firms employ a higher share of nontechnology workers than do smaller ones, something that is key because not everyone has the capabilities or interest to be an engineer.[93]
Large businesses also create more jobs. Statistics Canada data shows that, from 2002 to 2020, small businesses increased employment at half the rate of large businesses (by 13 percent versus 26 percent).[94] Moreover, large firms invest more in R&D. As one study of U.S. firms notes, both R&D spending and R&D productivity increase with firm size.[95] And large, highly productive firms lead to their suppliers becoming more productive.[96] The narrative in Canada needs to change away from the one it is trending toward, which holds that large corporations are problematic and small businesses are the font of all that is good and paving the royal road to prosperity. Canadians hear constantly that small businesses are the backbone of the Canadian economy, and that government policy should support them more.[97]Doing so would do little to address Canada’s IPC challenge and is likely to make it worse.
The narrative in Canada needs to change away from the one it is trending toward, which holds that large corporations are problematic and small businesses are the font of all that is good and paving the royal road to prosperity.
To do that, Canada needs bigger firms, including small firms that grow up to be medium or large ones. This does not mean that Canada must aspire to building tech giants on the scale of the United States or Korea, although the benefits of being able to do so would be transformative. Rather, Canada should seek to build more “Mittelstand” (middle-sized) (as Germany has) firms, as these have the heft to not only better compete globally but also remain independent and Canadian headquartered.
One step Canada should try is to level the policy playing field when it comes to business size. It can start with the business tax code, including SR&ED, which provides distortionary preferential rates to small firms.[98]
Principle 8: Embrace North American Integration, Not Separation
Recently, there has been an increase in calls for Canada to assert its independence and separation from the U.S. economy. Canadian civil society leaders fought tooth and nail against Sidewalk Labs’ Toronto smart city proposal partially due to their distrust of American companies.[99] Toronto had the opportunity to be the leading smart city in the world because of Google’s investment, and yet it chose to say no.
Last year, the Senate of Canada reported, “To drive economic growth, the federal government should use public procurement as a strategic tool to support growing Canadian companies rather than foreign multinationals.”[100] This might work as long as foreign governments, including the United States, do not take reciprocal action, blocking any Canadian company from selling to the U.S. government. This step would also require Canada to withdraw from the WTO’s Government Procurement Agreement.
The Senate report also makes reference to standards, saying that “if Canada is not setting data standards that reflect Canadian interests, other jurisdictions’ interests will be built into the data standards and technologies that Canadians use.”[101] But the reason the global technology economy works is because the standards-setting process has been industry-led, voluntary, and based on consensus. While a Canadian traveling to London needs to bring an electric plug adaptor (because the standards for it were set before a global standards process), they don’t need to buy a U.K.-compliant smartphone.
We’ve seen the same narrative when it comes to reforming SR&ED, with some calling for making it even more discriminatory against foreign firms. Given the fact the OECD has found, “Foreign-controlled firms implement more logistics software technologies, management practices and tools, production process technologies and bio-and-environmental technologies than Canadian-controlled firms,” such measures would ensure that Canada is even farther behind global best practice.[102]
The narrative appears to be that if Canada were just more independent of the United States and discouraged American tech firms from locating and expanding operations in Canada, somehow a blossoming Canadian innovation ecosystem would emerge. Nothing could be more wrong, in large part because foreign investment in Canada brings jobs, valuable human capital development, and investment. Even if all the proposed separatist measures were put in place, it would not deter Canadians from moving to Silicon Valley or Canadian tech start-ups from being bought by U.S. firms.
In fact, Canadians would do the opposite, because invariably U.S. and EU policymakers would take steps to reciprocate, and Canadian companies would have less access to foreign markets. Firms in technology industries need scale in order to grow and thrive—end of story. Thinking that Canada can have a more isolated economy and have a thriving technology industry ignores this stark reality. To be sure, there is nothing wrong with requiring that IP developed with public funded be commercialized and produced in Canada. But that is very different from erecting barriers to continental integration and favouring Canadian-owned firms against foreign owned firms operating in Canada.
Even if all the proposed separatist measures were put in place, it would not deter Canadians from moving to Silicon Valley or Canadian tech start-ups from being bought by U.S. firms.
In short, Canada should seek to find areas for deeper integration with the U.S. economy, including in policy. For example, the U.S. National Institute of Standards and Technology operates a network of 16 Manufacturing USA institutes in in array of technology areas (e.g., digital manufacturing, lightweight materials, etc.) Canada should consider developing its own network of four or five Manufacturing Canada institutes and sign a memorandum of understanding with the U.S. Department of Commerce to allow Canadian firms to work with U.S. institutes and, conversely, U.S. firms with Canadian institutes. Canada would also benefit from more alignment between innovation surveys and datasets with the United States. It is extremely difficult to come up with an apples-to-apples comparison between innovation performance in both countries due to differing measures and methodologies.
Principle 9: Reject the Precautionary Principle and Embrace the Innovation Principle
A suite of new technologies, of which AI is just one, have the potential to deliver significant social and economic benefits, as well as power the next wave of Canadian technology companies. However, an increasing number of Canadian activists, scholars, pundits, and policymakers see these technologies as inherently risky, creating substantial negative impacts. As such, they want Canada to emulate Europe and embrace what is known as the “precautionary principle:” the idea that if a technological innovation may carry a risk of harming the public or the environment, then those proposing the technology should bear the burden of proving it will not. If they cannot, governments should limit the use of the new technology, including imposing strict regulatory rules on it, until proven safe. In fact, for most areas of innovation, the precautionary principle leads to more harm than good.
In contrast, the “innovation principle” holds that because the overwhelming majority of technological innovations benefit society and pose modest and not irreversible risks, government’s role should be to pave the way for widespread innovation while building guardrails, where necessary, to limit harms. The innovation principle (something U.S. policymakers, until recently, have embraced) recognizes that market forces, tort law, existing laws and regulations, or light-touch targeted interventions can usually manage the risks new technologies pose. In cases wherein regulations are needed, it stresses the importance of designing regulatory interventions and structuring regulatory enforcement in ways that minimize the harm to innovation, while still achieving the regulatory goals.
If Canada wants to turn around its IPC performance, it needs stop looking to Europe for guidance and instead take a time-out on regulating new technology, and focus instead on promoting it.
Understanding that many Canadian policymakers want more innovation, many Canadian advocates of the precautionary principle approach simply assert, with no empirical evidence, that heavy-handed regulations will actually increase innovation, presumably because users will feel safer. However, there is no evidence for this, and considerable evidence for the opposite.[103] As such, if Canada wants to turn around its IPC performance, it needs stop looking to Europe for guidance and instead take a time-out on new technology regulatory interventions, focusing instead on technology promotion. For example, rather than ask how to regulate AI, policymakers should be asking how to promote AI.
Principle 10: Make Innovation, Productivity, and Competitiveness a Top Priority
At the end of the day, policymakers have a significant number of degrees of freedom to drive IPC. As Mark Zachary Taylor noted in The Politics of Innovation: Why Some Countries Are Better Than Others at Science and Technology, certain countries, such as Israel, Korea, Singapore, Switzerland, and Taiwan, have been able to transform themselves through innovation, while others have not. The key factor, according to Taylor, is “hunger” based on systematic insecurity, which drives the need for innovation. Sitting next to the United States, a country with the largest military budget in the world, and having a strong, stable natural resources economy has meant that Canada has systematic security. That means if Canada is to effectively address its IPC challenges, it will have to start with value changes and building a narrative across government, companies, universities, and the media around the need for focus on IPC progress. Until that happens, progress is likely to be incremental and halting.
One indicator of this is a commitment by all levels of government to drive investment rather than spending. While elected officials like to consider virtually all spending on budget items as “investment,” in reality, only spending that generates more (ideally significantly more) in savings or output than the original spending qualifies as investment. In this sense, expenditures on clean energy, housing, roads, and others is more spending than investment.
If Canada is to effectively address its IPC challenges, it will have to start with value changes and building a narrative across government, companies, universities, and the media around the need for focus on IPC progress. Until that happens, progress is likely to be incremental and halting.
Conclusion
Fortunately, it seems that pundits, economists, and Canadians talking at the dinner table across the country are now waking up to the fact that the continuation of the status quo economy will lead to a less-prosperous Canada. Public and private sector leaders should take advantage of the growing consensus and use this momentum to make bold changes to how to transform the economy.
About the Authors
Dr. Robert D. Atkinson (@RobAtkinsonITIF) is the founder and president of ITIF. His books include Technology Fears and Scapegoats: 40 Myths About Privacy, Jobs, AI and Today’s Innovation Economy (Palgrave McMillian, 2024),Big Is Beautiful: Debunking the Myth of Small Business (MIT, 2018), Innovation Economics: The Race for Global Advantage (Yale, 2012), Supply-Side Follies: Why Conservative Economics Fails, Liberal Economics Falters, and Innovation Economics Is the Answer (Rowman Littlefield, 2007), and The Past and Future of America’s Economy: Long Waves of Innovation That Power Cycles of Growth (Edward Elgar, 2005). He holds a Ph.D. in city and regional planning from the University of North Carolina, Chapel Hill.
Lawrence Zhang is head of policy at ITIF’s Centre for Canadian Innovation and Competitiveness. Previously, he served as an advisor to several Canadian cabinet ministers at both the federal and provincial levels, where he advised on key issues relating to industrial and innovation policy. He holds a Master of Public Policy and an Honours Bachelor of Arts in International Relations from the University of Toronto.
About the Centre for Canadian Innovation and Competitiveness
The Centre for Canadian Innovation and Competitiveness is an Ottawa-based affiliate of the Information Technology and Innovation Foundation (ITIF), the world’s leading think tank for science and technology policy. As a separately incorporated and registered charity under the Canada Not-for-profit Corporations Act and Income Tax Act, the Centre’s mission is to help policymakers and the Canadian public better understand the nature of the innovation economy and the types of public policies that are necessary to drive Canadian innovation, productivity, and global competitiveness. For more information, visit innovationpolicy.ca.
Endnotes
[1]. Glen Williams, Not for Export (McClelland & Stewart, 1983).
[2]. Robert Atkinson and Lawrence Zhang, “Comments to Canada’s Department of Finance Regarding Scientific Research and Experimental Development Tax Incentives” (ITIF, April 2024) https://itif.org/publications/2024/04/02/comments-to-canada-department-of-finance-regarding-sred-tax-incentives/.
[3]. Michael Porter, “The Competitive Advantage of Nations,” Harvard Business Review, International Business (March-April 1990), http://hbr.org/1990/03/the-competitive-advantage-of-nations/ar/1.
[4]. “Global Competitiveness Report,” World Economic Forum, December 2020, https://www.weforum.org/publications/the-global-competitiveness-report-2020/.
[5]. “World Competitiveness Ranking” (IMD, World Competitiveness Center, 2023), https://www.imd.org/centers/wcc/world-competitiveness-center/rankings/world-competitiveness-ranking/.
[6]. “International merchandise trade, annual” (Statistics Canada, February 2024), https://www150.statcan.gc.ca/n1/daily-quotidien/240207/cg-a007-eng.htm.
[7]. Peter Muldowney, “History of the Canadian Dollar,” 9Connor, Clark, & Lunn Financial Group, February 2023), https://cclfg.cclgroup.com/insight/history-of-the-canadian-dollar/#:~:text=Coyne%20subsequently%20resigned%20and%20in,or%20minus%20a%201%25%20band.&text=In%20May%201970%2C%20with%20rising,the%20US%20dollar%20by%201972.
[8]. “Mineral Trade” (Government of Canada, September 2023), https://natural-resources.canada.ca/maps-tools-and-publications/publications/minerals-mining-publications/mineral-trade/19310.
[9]. “Oslo Manual 2018: Guidelines for Collecting, Reporting and Using Data on Innovation,” (OECD, 2018), https://www.oecd-ilibrary.org/docserver/9789264304604-en.pdf.
[10]. “The State of Industrial R&D in Canada,” (Council of Canadian Academies, 2013), https://cca-reports.ca/wp-content/uploads/2022/11/State-of-Industrial-RD-Full-Report-EN.pdf.
[11]. “Committee Report No. 7 - SRSR (44-1),” (Parliament of Canada, November 2023), https://www.ourcommons.ca/documentviewer/en/44-1/SRSR/report-7/page-36.
[12]. Soumitra Dutta et al., Global Innovation Index 2022: What is the future of innovation-driven growth (WIPO, 2022), https://www.wipo.int/edocs/pubdocs/en/wipo-pub-2000-2022-en-main-report-global-innovation-index-2022-15th-edition.pdf.
[13]. “GERD as a percentage of GDP” (OECD, April 2024), https://stats.oecd.org/Index.aspx?DataSetCode=MSTI_PUB.
[14]. “BERD as a percentage of GDP, HERD as a percentage of GDP, GOVERD as a percentage of GDP” (OECD, April 2024), https://stats.oecd.org/Index.aspx?DataSetCode=MSTI_PUB.
[15]. Ibid.
[16]. “EU Industrial R&D Investment Scoreboard” (European Commission, 2022), https://iri.jrc.ec.europa.eu/scoreboard/2023-eu-industrial-rd-investment-scoreboard.
[17]. Ibid.
[18]. Ibid.; “Representative Exchange Rate for Selected Currencies for January 2022” (International Monetary Fund), https://www.imf.org/external/np/fin/data/rms_rep.aspx; “Amazon Research and Development Expenses 2010-2023” (Macrotrends), https://www.macrotrends.net/stocks/charts/AMZN/amazon/research-development-expenses.
[19]. Ibid.
[20]. “EU Industrial R&D Investment Scoreboard” (European Commission, 2022), https://iri.jrc.ec.europa.eu/scoreboard/2023-eu-industrial-rd-investment-scoreboard; “Representative Exchange Rate for Selected Currencies for January 2022” (International Monetary Fund), https://www.imf.org/external/np/fin/data/rms_rep.aspx; “Amazon Research and Development Expenses 2010-2023” (Macrotrends), https://www.macrotrends.net/stocks/charts/AMZN/amazon/research-development-expenses; “World Development Indicators” (The World Bank), https://databank.worldbank.org/source/world-development-indicators.
[21]. Ibid.
[22]. Ibid.
[23]. Ibid.
[24]. Ibid.
[25]. Peter Nicholson, “Canada’s Economy in a Long-Term Global Context” (Policy Wonks, April 2024), https://policywonks.ca/canadas-economy-in-a-long-term-global-context/.
[26]. Ibid.
[27]. “Business enterprise in-house research and development expenditures, by industry group based on the North American Industry Classification System (NAICS), country of control and expenditure,” (Statistics Canada, August 2023), https://www150.statcan.gc.ca/t1/tbl1/en/tv.action?pid=2710033301.
[28]. “Business Enterprise Research and Development (BERD) Survey” (National Center for Science and Engineering Statistics, September 2023), https://ncses.nsf.gov/surveys/business-enterprise-research-development/2021.
[29]. Robert Atkinson and Lawrence Zhang, “Comments to Canada’s Department of Finance Regarding Scientific Research and Experimental Development Tax Incentives” (ITIF, April 2024), https://itif.org/publications/2024/04/02/comments-to-canada-department-of-finance-regarding-sred-tax-incentives/.
[30]. “Business enterprise in-house research and development expenditures, by industry group based on the North American Industry Classification System (NAICS), country of control and expenditure,” (Statistics Canada, August 2023), https://www150.statcan.gc.ca/t1/tbl1/en/tv.action?pid=2710033301.
[31]. “HERD as a percentage of GDP” (OECD, April 2024), https://stats.oecd.org/Index.aspx?DataSetCode=MSTI_PUB.
[32]. “Percentage of HERD financed by the business enterprise sector” (OECD, April 2024).
[33]. “A History of ARPANET: The First Decade” (Defense Advanced Research Projects Agency, April 1981), https://apps.dtic.mil/sti/pdfs/ADA115440.pdf.
[34]. “1946-1964” (National Research Council of Canada, 2019), https://nrc.canada.ca/en/corporate/history/1946-1964.
[35]. “GOVERD as a percentage of GDP” (OECD, April 2024), https://stats.oecd.org/Index.aspx?DataSetCode=MSTI_PUB.
[36]. “Global Innovation Index 2022” (WIPO, September 2022), https://www.wipo.int/edocs/pubdocs/en/wipo-pub-2000-2022-en-main-report-global-innovation-index-2022-15th-edition.pdf.
[37]. “International Trade Statistics” (WTO, April 2024), https://stats.wto.org/inventory/en.
[38]. “Patent Grants by Technology” (WIPO, April 2024), https://www3.wipo.int/ipstats/ips-search/patent.
[39]. “Global Innovation Index 2022” (WIPO, September 2022), https://www.wipo.int/edocs/pubdocs/en/wipo-pub-2000-2022-en-main-report-global-innovation-index-2022-15th-edition.pdf.
[40]. “Population with Tertiary Education” (OECD, April 2024), https://data.oecd.org/education.htm.
[41]. “Graduates by Field(OECD, April 2024), https://data.oecd.org/education.htm.
[42]. “Global Innovation Index 2022” (WIPO, September 2022), https://www.wipo.int/edocs/pubdocs/en/wipo-pub-2000-2022-en-main-report-global-innovation-index-2022-15th-edition.pdf.
[43]. “Scimago Journal & Country Rank” (SJR, April 2023), https://www.scimagojr.com/countryrank.php.
[44]. 2022 Canadian Licensing Activity Survey; 2022 U.S. Licensing Activity Survey; 2012 Canadian Licensing Activity Survey; 2012 U.S. Licensing Activity Survey (AUTM).
[45]. Ibid.
[46]. “Business Enterprise researchers (FTE)” (OECD, April 2024), https://stats.oecd.org/Index.aspx?DataSetCode=MSTI_PUB.
[47]. “AI Talent Concentration by Country” (OECD.AI Policy Observatory, April 2024), https://oecd.ai/en/data?selectedArea=ai-jobs-and-skills&selectedVisualization=ai-talent-concentration-by-country.
[48]. “OECD Digital Economy Outlook 2020” (OECD, March 2024), https://www.oecd-ilibrary.org/sites/def83a04-en/index.html?itemId=/content/component/def83a04-en.
[49]. Ibid.
[50]. “Global AI Adoption Index 2022” (IBM, May 2023), https://www.ibm.com/downloads/cas/GVAGA3JP.
[51]. “Venture Capital Investments” (OECD, April 2024), https://stats.oecd.org/Index.aspx?DataSetCode=VC_INVEST#.
[52]. “Global Innovation Index 2022” (WIPO, September 2022), https://www.wipo.int/edocs/pubdocs/en/wipo-pub-2000-2022-en-main-report-global-innovation-index-2022-15th-edition.pdf.
[53]. “Indexes of business sector labour productivity, unit labour cost and related measures, seasonally adjusted” (Statistics Canada, Labour Productivity Index, March 2024), https://www150.statcan.gc.ca/t1/tbl1/en/tv.action?pid=3610020601; “Labour Productivity and Cost Measures: Major sectors: nonfarm business, business, nonfinancial corporate, and manufacturing” (U.S. Bureau of Labour Statistics, Labour Productivity Index from 1947 to 2023), https://www.bls.gov/productivity/tables/.
[54]. Ibid.
[55]. “Labour productivity per person employed, 2002, 2012” (The Conference Board, Total Economy Database - Output, Labor, and Labour Productivity), https://data-central.conference-board.org/.
[56]. Ibid.
[57]. “Labour productivity and related measures by business sector industry and by non-commercial activity consistent with the industry accounts: labourproductivity from 2011 to 2022” (Statistics Canada, April 2024), https://www150.statcan.gc.ca/t1/tbl1/en/tv.action?pid=3610048001&pickMembers%5B0%5D=1.1&pickMembers%5B1%5D=2.7&cubeTimeFrame.startYear=2022&cubeTimeFrame.endYear=2022&referencePeriods=20220101%2C20220101.
[58]. “Level of GDP per capita and productivity, GDP per hour worked, USD, constant prices 2015 PPPs” (OECD, April 2024), https://stats.oecd.org/index.aspx?DataSetCode=PDB_LV#.
[59]. “Canadian Centre for the Study of Living Standards,” https://www.csls.ca/res_reports.asp.
[60]. OECD also provides data for a related category, Transport and ICT equipment. The measures and trends for Canada are very similar to the machinery and ewquipment and weapons’ systems numbers.
[61]. “Gross domestic product, expenditure-based, at 2017 constant prices, annual (x 1,000,000) (machinery and equipment and final consumption” (Statistics Canada, February 2024), https://www150.statcan.gc.ca/t1/tbl1/en/tv.action?pid=3610036901.
[62]. IP is defined as “products that are the result of research, development, investigation or innovation leading to knowledge that the developers can market or use to their own benefit in production because use of the knowledge is restricted by means of legal or other protection. The knowledge may be embodied in a free-standing product or may be embodied in another.” “Intellectual Property Products” (Statistics Canada Glossary), https://www150.statcan.gc.ca/n1/pub/13-605-x/gloss/gloss-i-eng.htm#Intellectualpropertyproducts.
[63]. “Gross domestic product, expenditure-based, at 2017 constant prices, annual (x 1,000,000), intellectual property products and final consumption” (Statistics Canada, March 2024), https://www150.statcan.gc.ca/t1/tbl1/en/tv.action?pid=3610036901.
[64]. “Flows and stocks of fixed non-residential capital, by industry and type of asset, Canada, provinces and territories (x 1,000,000), machinery and equipment investments for industries” (Statistics Canada, March 2024), https://www150.statcan.gc.ca/t1/tbl1/en/tv.action?pid=3610009601.
[65]. Ibid. Note: Other indigenous government services industry was removed due to a lack of data.
[66]. “Gross domestic product (GDP) at basic prices, by industry, annual average” (Statistics Canada, March 2024), https://www150.statcan.gc.ca/t1/tbl1/en/cv!recreate.action?pid=3610043403&selectedNodeIds=2D1,3D1,4D55,4D65,4D70,4D73,4D77,4D80,4D81,4D84,4D92,4D95,4D98,4D104,4D113,4D121,4D127,4D132,4D142,4D146&checkedLevels=0D1&refPeriods=20230101,20240101&dimensionLayouts=&vectorDisplay=false.
[67]. “Global Robotics Race: Korea, Singapore and Germany in the Lead” (International Federation of Robotics, January 2024), https://ifr.org/ifr-press-releases/news/global-robotics-race-korea-singapore-and-germany-in-the-lead.
[68] Because of how companies report income for tax purposes, Ireland appears to have artificially inflated advanced industry output measures.
[69]. “TiVA 2022 Principal Indicators” (OECD, November 2023), https://stats.oecd.org/OECDStat_Metadata/ShowMetadata.ashx?Dataset=TIVA_2022_C1&ShowOnWeb=true&Lang=en.
[70]. Quentin Parker, “Country can take aircraft production to the next level,” China Daily, January 2024, https://global.chinadaily.com.cn/a/202401/02/WS659361fda3105f21a507a056.html.
[71]. “An overhauled Competition Act will light a fire in the stolid world of Canadian business,” The Globe and Mail, December 2023, https://www.theglobeandmail.com/opinion/editorials/article-an-overhauled-competition-act-will-light-a-fire-in-the-stolid-world-of/.
[72]. Jonathan Deslauriers and Robert Gagne, “The low productivity of Canadian companies threatens our living standards” (Centre for Productivity and Prosperity, April 2023), https://policyoptions.irpp.org/magazines/april-2023/the-low-productivity-of-canadian-companies-threatens-our-living-standards/.
[73]. Mark Randell, “Bank of Canada warns of low productivity ‘emergency,’ making t harder to control inflation,” The Globe and Mail, March 2024, https://www.theglobeandmail.com/business/article-bank-of-canada-warns-of-low-productivity-emergency-making-it-harder-to/.
[74]. Calculations using BEA and Stats Can data on IP foreign receipts and payments.
[75]. Margaret O’Sullivan, “Canada’s tax rates among the highest in the world” (Fund Library, May 2019), https://fundlibrary.com/Articles/Detail/canadas-tax-rates-among-highest-in-the-world/376#google_vignette.
[76]. Cynthia Armas and Fernando Sanchez-Losado, “Structural Change and the Income of Nations” (UB Economics Working Paper, No. 412), 28.
[77]. Joseph Kennedy, Daniel Castro, and Robert Atkinson, “Why It’s time to Disrupt Higher Education by Separating Learning From Credentialing” (ITIF, August 2016), https://www2.itif.org/2016-disrupting-higher-education.pdf, 6.
[78]. Ross Finnie et al., “Measuring Critical-thinking Skills of Postsecondary Studies” (Higher Education Quality Council of Ontario, 2018), https://heqco.ca/wp-content/uploads/2020/04/Formatted_PAWS_FINAL_FIX.pdf.
[79]. Richad Lipsey and Kenneth Carlaw, “Industrial Policies: Common Not Rare,” Economic Growth Ejournal, May 2021, https://papers.ssrn.com/sol3/papers.cfm?abstract_id=3854149.
[80]. Robert Atkinson and Stephen Ezell, Innovation Economics: The Race for Global Advantage (Yale University Press, September 2012).
[81]. Don Drummond, “The ‘OECD Paradigm’ Seemed Like a Necessary but Not Sufficient Condition for Stronger Productivity Growth, Queen’s University,” International Productivity Monitor No. 29 (Fall 2015), http://www.csls.ca/ipm/29/drummond.pdf.
[82]. Ibid.
[83]. Robert Atkinson, Mark Muro, and Jacob Whiton, “The Case for Growth Centers: How to Spread Tech Innovation Across America” (ITIF, December 2019), https://itif.org/publications/2019/12/09/case-growth-centers-how-spread-tech-innovation-across-america/.
[84]. Ibid.
[85]. Mark Lowey, “Clusters’ last stand: regionalism and red tape lost the battle for innovation” (Research Money, September 2022), https://researchmoneyinc.com/article/clusters-last-stand-regionalism-and-red-tape-lost-the-battle-for-innovation.
[86]. Sean Silcoff, “Canada facing ‘brain drain’ as young tech talent leaves for Silicon Valley,” The Globe and Mail, May 2018, https://www.theglobeandmail.com/business/technology/article-canada-facing-brain-drain-as-young-tech-talent-leaves-for-silicon/.
[87]. Beth LeBlanc, “Michigan failing to retain key talent after graduation, report says,” The Detroit News, June 2023, https://www.detroitnews.com/story/news/local/michigan/2023/06/01/university-of-michigan-wayne-state-michigan-state-msu-um-graduates-computer-science-degrees/70271364007/.
[88]. Avery Koop, “Ranked: 15 of the World’s Least Affordable Housing Markets” (Visual Capitalist, September 2023), https://www.visualcapitalist.com/mapping-housing-market-affordability/.
[89]. “Prepare for life in Canada” (Government of Canada), https://www.canada.ca/en/immigration-refugees-citizenship/services/new-immigrants/prepare-life-canada/choose-city.html.
[90]. Danny Leung, Cesaire Meh, and Yaz Terajima, “Firm Size and Productivity” (working paper, 2008-45, Bank of Canada, Canadian Economic Analysis Department), http://www.bankofcanada.ca/wp-content/uploads/2010/02/wp08-45.pdf.
[91]. Douwere Grekou, Wulong Gu, and Beiling Yan, “Decomposing the Between-firm Employment Earnings Dispersion in the Canadian Business Sector: The Role of Firm Characteristics” (Statistics Canada, Analytical Studies Branch Research Paper Series, February 2020), https://www150.statcan.gc.ca/n1/pub/11f0019m/11f0019m2020006-eng.htm.
[92]. Fernando Galindo-Rueda, Fabien Verger, and Sylvan Ouellet, “Patterns of innovation, advanced technology use and business practices in Canadian firms,” OECD Science, Technology and Industry Working Papers, No. 2020/02, https://doi.org/10.1787/6856ab8c-en.
[93]. The Innovation Authority of Israel found that larger software companies employ an average of 2.55 employees in non-technology jobs for each employee in a technology job such as engineering or development. This ratio of nontechnology employees per technology employees is called an “employment multiplier” and of all the types of high-tech companies operating in Israel, the employment multiplier is highest among complete software companies. In contrast, in start-ups, companies open for less than 10 years, companies that employ up to 80 employees, and businesses with revenue of less than 20 million shekels, only 0.32 nontechnology employees are employed for each person in a technology job. Start-ups therefore have the lowest employment multiplier of all technology companies in Israel; “How many Israelis Really Work in High-Tech?” (Israel Innovation Authority, 2023), https://innovationisrael.org.il/en/report/how-many-israelis-really-work-in-high-tech/.
[94]. “Key Small Business Statistics 2023” (Statistics Canada, March 2023), https://ised-isde.canada.ca/site/sme-research-statistics/en/key-small-business-statistics/key-small-business-statistics-2023.
[95]. Anne Maria Knott and Carl Vieregger, “Reconciling the Firm Size and Innovation Puzzle” (Organization Science, Vol 31 No 2, Feb 2020), https://pubsonline.informs.org/doi/abs/10.1287/orsc.2019.1310.
[96]. Mary Amiti et al., “Do large firms generate positive productivity spillovers?” (CentrePiece Spring 2024), https://cep.lse.ac.uk/pubs/download/cp677.pdf.
[97]. Miwako Nitani, “Supporting the Backbone of Canada’s Economy: SME Growth and Financing Programs” (Telfer, July 2019), https://telfer.uottawa.ca/telfer-knowledge-hub/better-canada/supporting-the-backbone-of-canada-s-economy-sme-growth-and-financing-programs.
[98]. “Corporation tax rates” (Government of Canada, January 2024), https://www.canada.ca/en/revenue-agency/services/tax/businesses/topics/corporations/corporation-tax-rates.html.
[99]. Laura Bliss, “Critics Vow to Block Sidewalk Labs' Controversial Smart City in Toronto,” Bloomberg, February 2019, https://www.bloomberg.com/news/articles/2019-02-25/post-hq2-toronto-residents-try-to-block-sidewalk-labs.
[100]. “Needed: An innovation strategy for the data-driven economy” (Senate Canada, June 2023), https://sencanada.ca/content/sen/committee/441/BANC/Reports/Needed-Innov-Strat-Data-DrivenEcon_e.pdf.
[101]. Ibid at 18.
[102]. “Productivity differences between domestic and foreign controlled Plants” (Statistics Canada, 2000), https://www150.statcan.gc.ca/n1/pub/11-623-x/2003001/4067523-eng.htm.
[103]. Alan McQuinn and Daniel Castro, “Why Stronger Privacy Regulations Do Not Spur Increased Internet Use” (ITIF, July 2018), https://itif.org/publications/2018/07/11/why-stronger-privacy-regulations-do-not-spur-increased-internet-use/.
Editors’ Recommendations
April 2, 2024
Comments to Canada’s Department of Finance Regarding Scientific Research and Experimental Development Tax Incentives
January 4, 2024
