
Explaining the Relative Competitive Decline of America’s Automotive Industry
The competitiveness of the auto industry of the United States has waxed and waned over the past 60 years and is clearly not the globally dominant behemoth it once was. To bolster the industry’s competitiveness, policymakers first must understand why it has faltered and the challenges it faces moving forward.
KEY TAKEAWAYS
Key Takeaways
Contents
Recapping Faltering U.S. Auto Industry Competitiveness 3
Explaining Evolving U.S. Auto Industry Competitiveness: 1960s to 2010. 7
Explaining Evolving U.S. Auto Industry Competitiveness: 2010 to the present 24
Introduction
The competitiveness of the auto industry of the United States (that is, considering all manufacturers, domestic and foreign alike, producing autos or auto parts in America) has waxed and waned over the past 60 years—and certainly has declined from its zenith in the post-World War II years. This is the second in a series of three reports exploring the evolving global competitiveness of the U.S. automotive industry. The first report examines what happened to the competitiveness of the auto industry of the United States since the mid-1960s.[1] This report examines why “what happened” happened; in other words, it looks at the causal factors explaining the relative decline of the auto industry of the United States since the mid-1960s. The report is divided into two parts: the years up to 2010 and the period thereafter. The final report in this series will lay out a comprehensive U.S. auto industry competitiveness strategy.
Recapping Faltering U.S. Auto Industry Competitiveness
As noted, the first report in this series examines the evolving competitiveness of the auto industry of the United States from the mid-1960s to today. That report articulates a pattern of relative and continuing decline that was much more severe than that explained simply by a rebalancing of the global economy as other nations recovered from the devastation of World War II and rebuilt their production economies. The following provides a brief overview of several key highlights from the first report in this series, which explores how the competitiveness both of U.S. automakers—notably the Big Three of General Motors, Ford, and Chrysler—and of the broader U.S. automotive industry has evolved over the past 60 years.
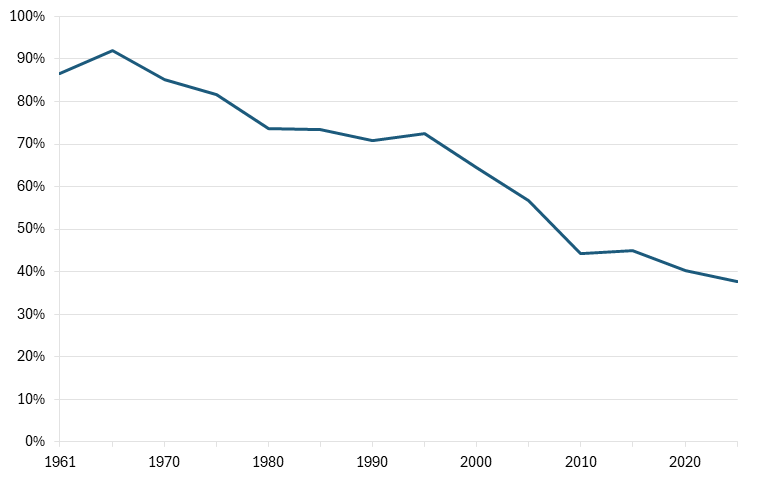
Consider the Big Three U.S. automakers’ share of the U.S. auto market. As late as 1965, the Big Three accounted for 92 percent of the U.S. auto market. But the market-share dominance of these automakers would decline significantly over the ensuing decades, falling to 45 percent by 2015, less than half the share of a half-century before. By 2024, the Big Three’s share of the U.S. auto market would slip even further, down to 38 percent. (See figure 1.)
Figure 1: Big Three U.S. automakers’ share of the U.S. auto market (cars and light trucks), 1961–2024[2]
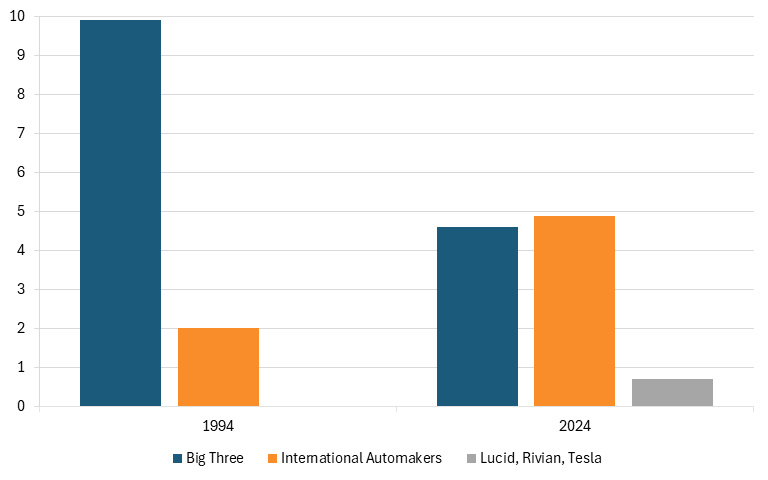
Consider the Big Three automakers’ U.S. vehicle production compared with that of transplants over the past three decades. In 1994, the Big Three manufactured 9.9 million vehicles in the United States, which was five times more than the 2 million vehicles manufactured by international automakers (i.e., transplants) producing in the United States. However, by 2024, the Big Three automakers would manufacture just 4.6 million vehicles in the United States (a decline of over 50 percent of their U.S. production from 1994), and this output would be even lower than the 4.87 million vehicles produced by international automakers operating in the United States (although new U.S. automakers such as Lucid, Rivian, and Tesla would chime in with about 700,000 new U.S. vehicles produced). (See figure 2.)
Figure 2: Auto production in the United States, by select groupings of firms (millions of units), 1994 & 2024[3]
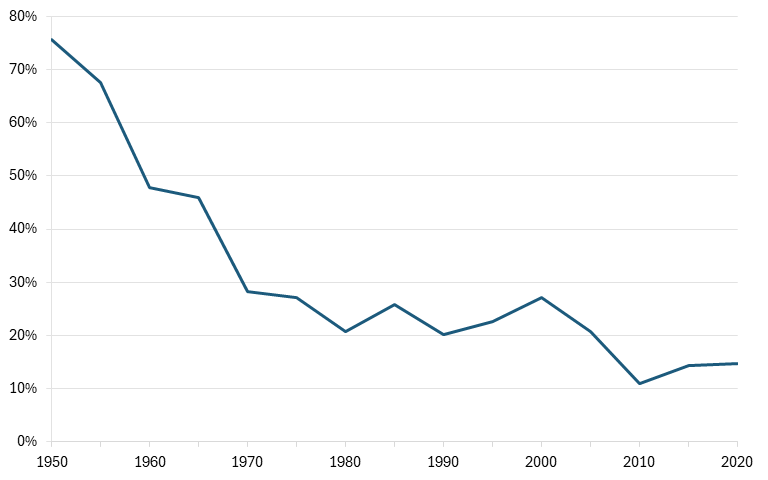
Consider America’s share of global automobile production. In 1950, the United States accounted for 76 percent of global vehicle production.[4] By 1960, this would still be a prodigious 48 percent share, and 46 percent as of 1965, but in the ensuing five years, this share would slide by two-fifths, to just 28 percent, falling to 20 percent by 1990. In 2022, the share stood at just 14.7 percent. (See figure 3.)
Figure 3: U.S. share of global vehicle production, 1950–2020[5]
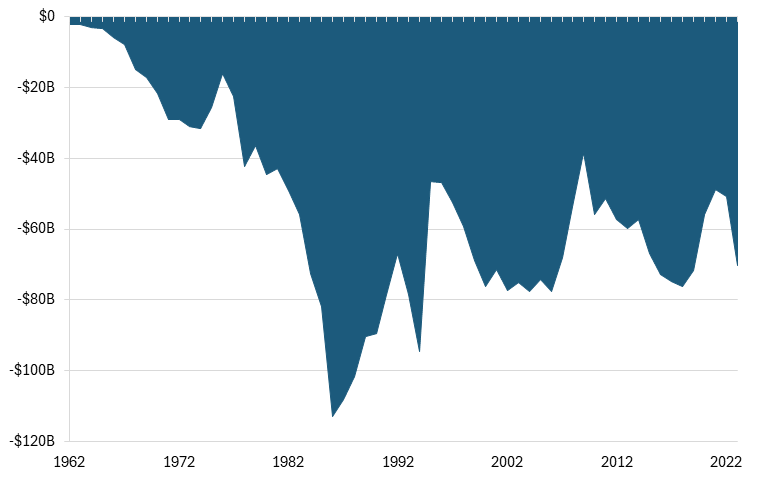
Consider America’s global trade balance in passenger vehicles. From 1963 to 2023, the United States ran a consistent trade deficit in real (inflation-adjusted) terms. This deficit ballooned from $21.7 billion in 1970 to $113 billion in 1986, an increase of more than fivefold, clearly demonstrating the effect of foreign—notably Japanese—import competition throughout the 1970s and 1980s. By the early 2000s, this deficit had abated somewhat yet still generally remained in excess of $60 billion most years from 2003 to 2023. Over the entire 60-year period, the accumulated U.S. motor vehicles trade deficit reached $3.3 trillion in 2023 dollars.
Figure 4: U.S. real trade balance in passenger vehicles (2023 dollars), 1963–2023[6]
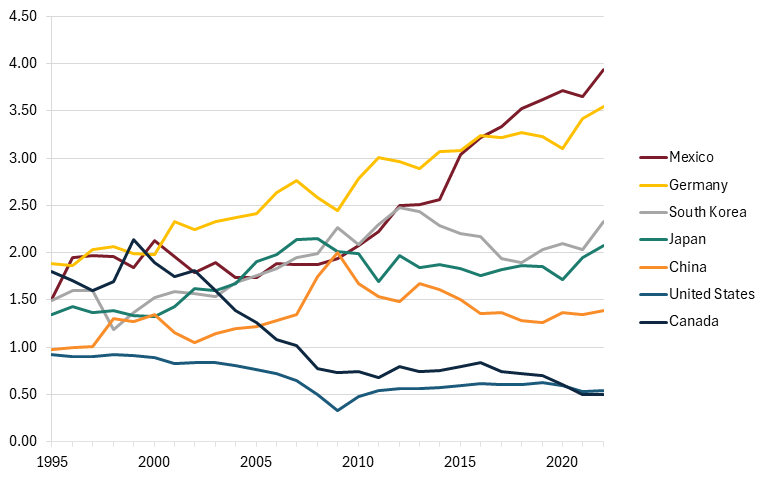
Lastly, consider America’s location quotient (LQ) in the global automotive industry. (An LQ compares how much an industry contributes to a nation’s economy as it does to the global economy.) Starting in 1995 (the earliest year for which this data is available), the United States posted an LQ of 0.92, meaning the U.S. auto industry contributed then almost as much (just 8 percent less) to the U.S. economy as the industry contributed to global gross domestic product (GDP). However, by 2022, America’s motor vehicles LQ had shrunk to 0.54, meaning the U.S. auto industry today contributes a little over half as much to the U.S. economy as the industry does to the global economy. By contrast, Mexico saw its LQ rise over 2.5-fold from 1.51 to 3.94. Germany’s motor vehicles LQ, already strong at 1.89 in 1995, rose to 3.54; similarly, Japan’s LQ increased from 1.34 to 2.08; China’s LQ rose modestly from 0.97 to 1.39. (See figure 5.)
Figure 5: Selected countries’ LQs in motor vehicles, 1995–2022[7]
In summary, although certainly great strengths remain, there is unmistakable evidence over the past 60 years of some degree of decline among both major U.S. automakers and the broader U.S. auto industry. The following explores the causal factors behind declining U.S. auto industry competitiveness during two time periods: the mid-1960s to 2010—a period marked by aggressive import competition and the rise of transplant production in the United States—and the period since 2010, marked by increasing globalization, especially in the form of offshoring of production to Mexico, the rise of China as a fiercer competitor, and the emergence of new automotive production technologies, such as robotics.
Explaining Evolving U.S. Auto Industry Competitiveness: 1960s to 2010
This section explores various theories that have been advanced to explain the relative decline of the U.S. auto industry. Explanations include risk aversion, a bespoke U.S. automotive marketplace creating path dependency, product life cycle theory, automakers’ shift from a “flexible production system” to a “dispersed parallel production system,” poor vehicle quality, and management practices of “relational contracts”—particularly with employees and suppliers—that impeded an effective competitive response when fierce foreign competition appeared. All these rationales have some degree of explanatory power, although what especially stands out at the end of the day is that it took at least 15 years for the Big Three to effectively respond to the lean production practices of Japanese automakers that were enabling them to produce lower-cost, higher-quality vehicles. Before examining the rationales for decline, a brief overview of Japanese auto import and transplant competition in the late 20th century is in order.
Overview of Auto Import and Transplant Competition in the Late 20th Century
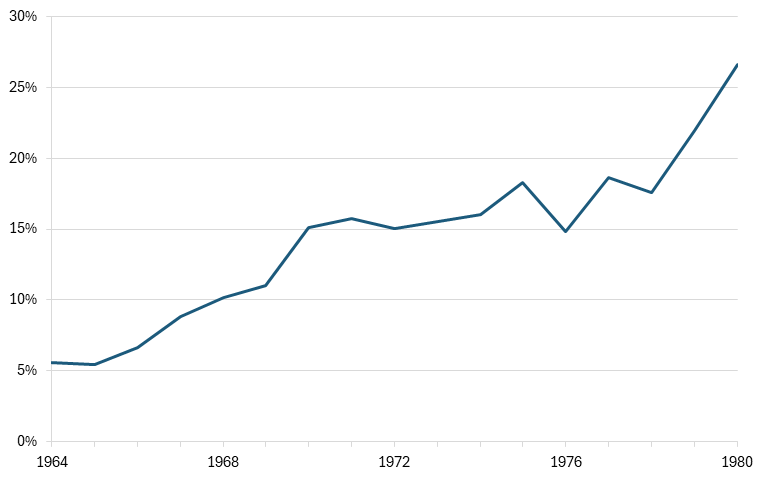
Arguably the most significant dynamic affecting the U.S. auto industry in the late 20th century was the rise initially of import competition and later transplant competition from foreign automakers, notably those from Japan (and to a lesser extent Germany). From 1964 to 1974, the share of (non-Canadian) imported passenger cars in the U.S. marketplace increased from 5.6 percent to 16 percent, and increased further to 26.6 percent by 1980. (See figure 6.) In terms of sales, in 1965 vehicle imports surpassed 500,000 units for the first time, with this number tripling to 1.5 million by 1971 and surpassing 2.3 million units in 1980.[8] By that year, import sales were slightly higher than the vehicle output of Ford and Chrysler combined.[9] Whereas Nissan and Toyota combined commanded less than a 1 percent share of the U.S. auto market in 1965, by 1980, this had increased to 12.3 percent.[10]
Figure 6: U.S. market share of imported passenger cars, 1964–1980[11]
In response to the explosive growth of Japanese auto imports in the late 1970s, in 1981, the Reagan administration imposed voluntary export restraints (VERs) on Japanese automakers, starting initially with a cap of 1.68 million vehicles (then 22 percent of the U.S. market); the ceiling would be raised to 1.85 million units in 1984, and 2.3 million units in 1985, where it would remain for the rest of the decade.[12] But the VER effort was poorly designed. As Lorraine Eden and Maureen Appel Molot explained, “Since the US demand for Japanese cars outstripped the supply, the Japanese auto producers used the VER program to raise their own prices in the US. They also shipped cars of higher product quality loaded with extra options since the implicit tax per unit was less on higher value added exports.”[13]
As American University’s Stephen Cohen elaborated, “As soon as Japanese automakers realized that American consumers had a relatively price inelastic demand for their products, they steadily increased sticker prices.”[14] In contrast, he explained, “Meanwhile, the Big Three responded to the price spikes of their Japanese competition by steadily raising prices on domestic models. Detroit’s marketing strategy placed profits ahead of regaining lost market share by being price competitive.”[15]
Researching the impact of the VERs, Brookings Institution economist Robert Crandall found that, by mid-1984, the prices of Japanese cars in the United States had increased 20 to 30 percent—between $1,500 and $2,500—over what they would have been in the absence of the de facto VER trade barrier.[16] Crandall estimated that the prices of U.S.-made cars increased by at least half this amount. He further found that the VERs added as much as $3 billion to the profits of Japanese automobile companies in 1984. Crandall estimated an annual cost to the U.S. economy of $160,000 for each job saved in the U.S. auto industry.[17]
Cohen noted, “The larger Japanese companies did not distribute their windfall profits to shareholders.” Instead, “They spent the money on research and development to produce cars more efficiently and with even higher quality. They enhanced their technology, added new models at a faster than usual pace, and installed flexible manufacturing systems in their assembly plants to permit quicker responses to shifts in consumers’ tastes.”[18] (Note: A later section of this report examines global auto firms’ comparative reinvestment in research and development (R&D) and capital expenditures (Capex) compared with buybacks and dividends.) Indeed, as one auto industry analyst observed in the early 1980s, the Japanese automakers’ accelerated product shift into mid-size and luxury cars facilitated by the VERs unwittingly upgraded the Japanese into a “greater threat in market segments traditionally held by domestic manufacturers.”[19]
Another impact of the VERs was to encourage and accelerate Japanese auto transplant production in the United States. However, this was not the only reason; others included production closer to the U.S. auto market enabled greater understanding of U.S. customer preferences; the Japanese government’s desire to reduce the U.S.-Japanese balance of payments deficit, one-third of which at that time arose from autos and auto parts; the reality that continuing U.S. demand for Japanese vehicles could be handled more easily with on-site production (i.e., the traditional rationale for foreign direct investment); and that over the course of the 1980s, the rising and fluctuating yen (alongside U.S. state subsidies) made it more economically feasible for Japanese automakers to manufacture in the United States.[20] To the latter point, one industry analyst estimated in 1989 that an automobile could be built at a transplant for $200 less than one built in Japan and delivered to the United States.[21]
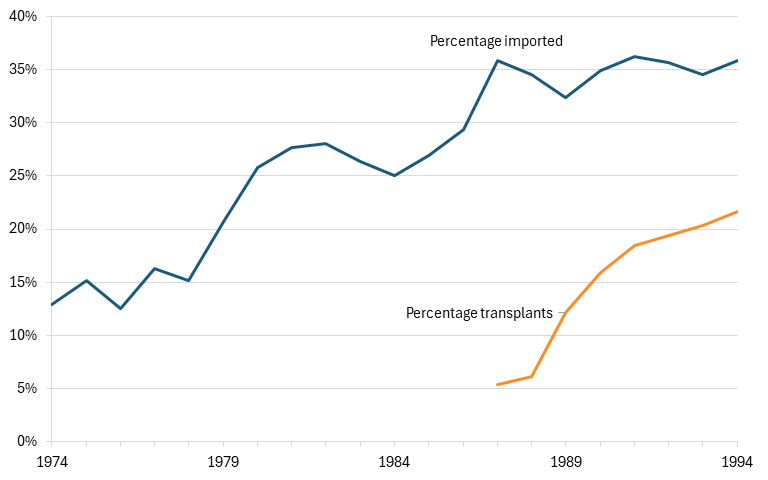
Thus, over the course of the 1980s, Japanese automakers began to accelerate their transplant production in the United States. Honda was the first Japanese automaker to establish an auto production facility in the United States, in Marysville, Ohio, in 1982; Nissan followed with a factory in 1984. (Volkswagen had been the first foreign auto manufacturer to open an auto factory in the United States, in the 1970s.) However, the bulk of Japanese transplant operations began in the mid- to late 1980s. Whereas there was 1 foreign-operated motor vehicle assembly plant in the United States in 1979, by 1991, there would be 13 (compared with 57 U.S.-owned motor vehicle assembly plants).[22] From 1987 to 1994, the share of North American passenger vehicle sales coming from cars produced at transplant factories increased from 5 to 22 percent. (See figure 7.) And over that period, the percentage of imported cars sold in North America would increase nearly threefold from 13 percent to 36 percent. Overall, transplant capacity in North America increased from 2.2 million units in 1989 to 3.1 million in 1993 to 3.7 million in 2000.[23] By 2017, Japanese automakers would operate 24 plants and 43 R&D facilities in 20 states, producing approximately 4 million vehicles per year, and becoming a permanent feature of the U.S. automotive landscape.[24]
Figure 7: North American passenger car sales, 1974–1994[25]
What explains the rise of the foreign auto competitors and the relative decline of the U.S. auto industry?
Risk Aversion (and Hubris) as a Result of Oligopolistic Market Dominance
A strong argument can be made that, with U.S. auto companies so dominant in their markets in the 1950s and 1960s, they got locked into standardized production processes and became risk averse. The 1950s to the early 1970s were the epitome of the mass production economy. The Big Three held market shares that changed little over time. It was a staid industry in which profits could generally be assured. (In fact, 1980 would become the first year that GM ran in the red since 1921.) Product markets were stable, with the Big Three producing a limited number of models, usually variations of the same kind of family sedan. Model changes were relatively limited. After the basic technological configuration of the car was perfected by the early 1950s, the technology changed little. The annual cosmetic model changes, with the tail fins getting a little bigger one year or a little smaller the next, were as big as the changes got.
Standardized mass production became a key feature of industrial production in this period. Because the production systems of many core industries relied on specialized, high-cost machines, it was only economical to run very long production runs of the same items. For example, Ford would regularly produce 50,000 items, such as right door panels, and then store them for weeks at a time. In order to take advantage of the economies of scale afforded by mass production systems, by the 1950s, Ford and Chrysler had two basic auto body designs, and General Motors had three. One 1967 book sums up the mass production system and its risks: “The installation of too much special-purpose machinery may be dangerous because of style changes and changes in design, which may render highly specialized machines useless.”[26] In other words, the industry settled into known and predictable patterns of production—and revenues. Further, the entrenched dominance of the U.S. mass production system would leave U.S. automakers ill-prepared when the onslaught of the Japanese automakers’ lean production system would arrive in ensuing decades.
Indeed, as Susan Helper and Rebecca Henderson wrote, “General Motors’ history of market dominance appears to have made the firm very risk averse, perhaps because the firm’s extraordinary success made risk avoidance a profit-maximizing strategy for many years.”[27] The authors related the anecdote of GM’s failed attempt to introduce a copper-cooled engine in 1922, which failed largely because the product was focused on the Chevrolet division in violation of GM’s policy of divisional autonomy.[28]
The entrenched dominance of the U.S. mass production system would leave U.S. automakers ill-prepared when the onslaught of the Japanese lean production system would arrive in ensuing decades.
The lesson GM CEO Alfred Sloan took from this, as he wrote in My Years at General Motors, was, “It was not necessary to lead in design or run the risk of untried experiment.”[29]
As Helper wrote, ”This incident apparently had a searing staying power; it was cited as late as 1987 by GM engineers as a reason to avoid technological risk.”[30] Helper also noted, at least for GM, “It appears that GM’s enormous success led it to deny the threat posed by foreign competition for over a decade. It is hard to be definitive as to whether this denial was due to the ossifying effects of decades of market power, of weak internal incentives, or of cognitive biases in the senior team, particularly since these factors surely interacted.”[31] Regardless, GM (like the other U.S. automakers) certainly failed to understand the nature of looming Japanese competition, nor did it respond effectively once it did.
Rosabeth Moss Kanter, in her masterful 1983 book, The Change Masters, made a similar point. Noting that many financial analysts and the public accused GM of being shortsighted and short-term in its thinking, she wrote, “Ironically, GM executives do express a long view, I found—but this is likely to be a long view backward into company history.”[32] Kanter continued, “Roger Smith [CEO of GM from 1981 to 1990] told me he was trying to ‘return this company to the way Sloan intended it to be managed.’”[33] She went on, “And apparently, there have been until recently, few mechanisms or incentives for making decisions with long-range payoffs, other than ‘forward-model programs’ concerned with products.”[34] Kanter closed her chapter on “Turning Around American Advantage” quoting a GM executive addressing the “impact of Japanese competition and the cost differentials on the US auto industry” observing, “The problem is not in Tokyo, it is in Detroit.”[35]
One final point here. Many have attributed U.S. auto industry decline to a failure to invest, or due to a fixation on “return on net assets,” whereby U.S. firms would cut the denominator (assets) to bolster their financial return (in order to enable comparability across industry sectors to appear more favorable to investors). But, as Keller noted, “Between 1980 and 1985, GM spent over $45 billion on acquisitions and automation, a sum that at the time was more than the combined market value of Toyota and Honda.”[36] So it wasn’t necessarily that the Big Three weren’t willing to invest, it was more that they did so poorly. Thus, ultimately, risk aversion is a component of the explanation for the relative decline of the U.S. auto industry, but it’s only part of the story.
Bespoke U.S. Auto Marketplace
One reason that explains both why the United States has consistently run deficits in motor vehicles trade and why the country’s LQ in motor vehicles has been so low—it’s never been above 1.0 since 1995 and, as noted, is today about half the global average—is that America in a way represents a bespoke auto marketplace. Especially in the industry’s formative years in the 1950s, American consumers generally preferred larger, more powerful, more muscular vehicles, and the low cost of gasoline in the United States meant automakers could produce powerful, gas-consuming vehicles that didn’t necessarily have to place a premium on energy efficiency (certainly at least not until the oil shocks in the 1970s).
A 1960 Buick Electra Convertible 225 with the distinctive fin-tail style of the late 1950s

As Eden and Molot elaborated, “The American car was an all-purpose road cruiser emphasizing power, comfort, a smooth ride, and versatility. All cars were roughly the same size; diversity came by offering a variety of cosmetics, body styles, and accessories on the same platform.”[37] (In contrast, European auto firms offered an “extraordinary range of models” compared with the one-sized family car that dominated the US market.)[38] In other words, American automakers produced vehicles in the United States that were distinct for American consumers. Conversely, to the extent U.S. automakers sold into foreign markets such as Europe, they tended to produce smaller, more fuel-efficient vehicles locally manufactured in those markets through subsidiaries (e.g., GM’s Opel and Ford of Europe). One can see this today by visiting many developing nations, especially in Asia, where most cars are smaller, more fuel-efficient ones from Japan (and increasingly China) that make sense in crowded cities with limited parking and expensive gas.
Historically, the United States produced vehicles predominantly for domestic consumption, while countries such as Germany and Japan, and today China and Mexico, produce vehicles for both domestic consumption and export markets.
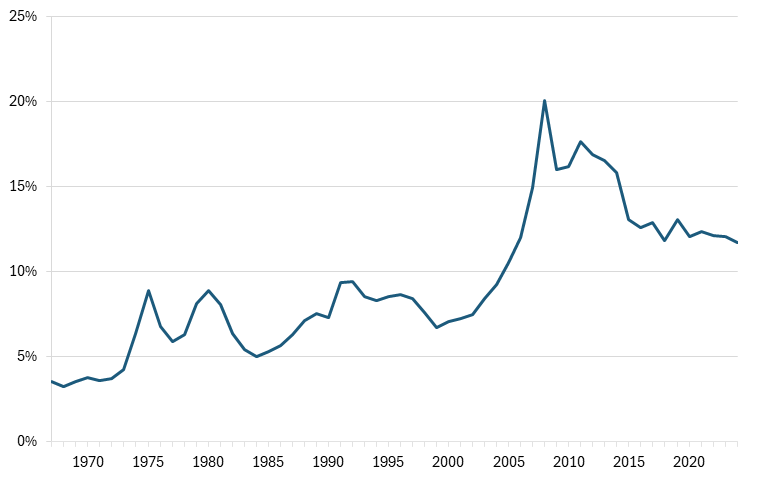
Thus, the reality is that the United States has hardly ever been a very significant auto-exporting nation. In fact, from 1967 to 2004, the value of U.S. automotive exports as a share of production value never exceeded 10 percent. That this share rose over 20 percent briefly in the late 2000s was largely a reflection of demand contraction after the Great Recession, as, by 2024, the share again had receded to 12 percent. (See figure 8.)
Figure 8: U.S. automotive exports as a share of automotive output, 1967–2024[39]
In other words, historically at least, Big Three auto production in the United States predominantly served local markets and generally wasn’t intended for export. This explains in part both America’s trade deficit in the sector and why the U.S. autos LQ has remained so low for so long, especially compared with international peers—such as Germany and Japan, historically, and China today—whose auto sectors are producing well beyond domestic capacity because much of their output is intended for export to markets with similar dynamics as those of their home markets.
This also raises an important point about the global automotive industry: it services differentiated markets. Many other advanced technology markets tend to be nondifferentiated. A semiconductor is going to perform a similar function within an electronic device anywhere in the world; a jet engine will perform the same function for an aircraft. A drug tends to work similarly within the body (respecting genetic differences) everywhere in the world. The point is that in those types of manufacturing industries, a manufacturer can generally sell a given product globally at scale, whereas the auto marketplace tends to be somewhat more bespoke and cater more to local preferences. In this sense, the relatively poor U.S. auto export performance is not mainly due to organizational performance, but rather to market differences.
Product Life Cycle Theory
Product life cycle theory holds that a product goes through a series of stages from conceptualization to market withdrawal, broadly: introduction, growth, maturity, and decline.[40] Joshua Murray and Michael Schwartz, authors of Wrecked: How the American Automobile Industry Destroyed Its Capacity to Innovate, wrote that “on the surface, product life cycle theory seems to perfectly explain the decline of the U.S. auto industry.”[41] As they elaborated, the narrative would run:
[f]rom introduction of a new product made entirely in the southern Michigan region where it was invented, through the incredibly innovative growth stage ending right before the Great Depression, to postwar maturity with standardization of the auto manufacturing process and expansion across the United States and internationally, to the decline stage where the product was made by the Japanese in their U.S. transplants, using cheaper non-union labor, and sold to the United States.[42]
As Murray and Schwartz observed, this theory of the case seemed to fit so perfectly that the Abernathy Group at the Massachusetts Institute of Technology (MIT), examining in the early 1980s the causes of U.S. auto industry decline, concluded, “So if in Detroit there is wringing of hands or gnashing of teeth, such lamentation is as useless as it is irrelevant. Neither in Lear’s age nor our own has anyone discovered an effective remedy for the inexorable cycles of nature.”[43]
U.S. automakers failed to understand the nature of looming Japanese competition, or respond effectively once they did.
Ultimately, product life cycle theory rests on the assertion that product maturity arrives when disruptive innovation potential is exhausted, which triggers geographic expansion (to other regions or countries) and competition based on cost reduction.[44] But while it seems that even today a four-wheel car doesn’t look much different than a car did a century ago, in reality, there has and continues to be tremendous innovation in motor vehicles. Today, it’s the evolution of electric batteries replacing internal combustion engines (ICEs), the advent of vehicle autonomy, and software-designed vehicles (SDVs). But in decades back, it’s been innovations such as automatic transmissions and anti-lock brakes. Automobiles remain an industry far from reaching “innovation or technological maturity.”
This is often a dynamic neoclassical economists miss. For instance, when the color television was thought to have reached its technological zenith, Princeton University economist Alan Blinder wrote:
The TV manufacturing industry really started here, and at one point employed many workers. But as TV sets became “just a commodity” their production moved offshore to locations with much lower wages. And nowadays the number of television sets manufactured in the United States is zero. A failure? No, a success.[45]
Losing an industry is a success? Blinder may have been right that the old black-and-white and then color cathode-ray tube television sets had become commodities for which competition was based largely on production cost, but this assumption of “technological stasis” betrays a stunning inability to understand dynamic technologies and how product life cycles regularly renew themselves. Once the United States took the neoclassical economists’ advice and allowed the TV manufacturing industry to disappear, it lost out entirely as televisions evolved from cathode-ray tubes to high-definition, flat-screen TVs—first using liquid crystal display (LCDs) and then light-emitting diode (LED) displays—and as these technologies have been deployed across a wide range of products, from automobiles themselves to digital advertising signage systems to large-scale video displays.[46] That constituted a short-sighted loss of thousands of American jobs that could have been making these high-tech products. And just as those who thought the television industry had reached “maturity” were mistaken, those who believe the automobile had—or has—reached a mature state of innovation are as well mistaken today.
Moreover, as Murray and Schwartz pointed out in Wrecked, Japanese automakers took market share not from the United States principally through labor cost advantage, but rather through product and process innovations (which effectively produced their cost advantage).[47] They also noted that the decline of innovation followed the geographic expansion of production, not the other way around. As such, there is some merit to the product life cycle theory (particularly with regard to booming Mexican automotive production today, largely driven by low-cost labor, as subsequently explained), but in itself alone it does not provide an adequate explanation for U.S. auto industry decline.
Flexible vs. Parallel Dispersed Production Systems
In Wrecked, Murray and Schwartz offered a compelling meta-analysis that traces the decline of the U.S. auto industry fundamentally to its abandonment of the flexible production processes it had pioneered in the 1930s for a “dispersed parallel production” system—an abandonment which they posited was the result of labor-management discord—leaving the industry unprepared to respond when more-innovative Japanese competitors appeared in the 1970s and 1980s, using the very flexible production practices they contended Detroit had discarded.
Analysts have identified four structural features that define flexible production as a unique system: just-in-time delivery, geographic clustering, machine flexibility, and long-term sole supplier relationships.[48] Murray and Schwartz contended that the flexible production approach was the hallmark of vehicular innovation in Detroit and southern Michigan—where there were more entrepreneurial start-up companies than anywhere else in America during the first quarter of the prior century—leading to the industry flourishing. Geographic clustering—characterized by concentrations of skilled workers, capable suppliers, and manufacturing capacity and expertise—represented a key feature of this system, enabling rapid, iterative, collaborative hands-on innovation that would lead to breakthroughs such as hydraulic braking, independent front suspension, better transmissions, and sleeker auto bodies. The system was also supported by a “moral economy” with an ethos of “honest effort” and an environment of trust between management and labor, perhaps best symbolized by Henry Ford’s $5 an hour wage: honest wage for honest effort.
As Joshua Murray explained, “Originally, the production system was highly concentrated—automakers worked with a small handful of sole suppliers, often with lifetime contracts, located close to the plants where the cars were made so they could provide just-in-time delivery.”[49] As he continued, “This system made innovation efficient, because the long contracts gave suppliers the security needed to tweak their products on demand and just-in-time delivery meant plants weren’t stuck with a huge inventory of products they no longer needed.”[50] Moreover, the geographical concentration meant that vehicle designers, suppliers, and workers could convene at the factory to discuss, troubleshoot, or redesign vehicle features quickly and easily.[51]
Murray and Schwartz traced the decline of the U.S. auto industry to its abandonment of flexible production processes for a “dispersed parallel production” system, which they contended resulted from labor-management discord.
Murray and Schwartz contended that labor strife began to worsen in the wake of the Great Depression, notably in the mid-1930s as the industry slowly started to recover, but management didn’t return wages and employment to their previous levels, leading to wildcat strikes, including the Great Flint Strike of 1936, which greatly disrupted production as “a few hundred workers brought the largest corporation in America to its knees” and within four years, the entire U.S. auto industry had unionized.[52]
The authors asserted that—in order to reduce workers’ structural leverage and insulate the production system from future work stoppages—in subsequent decades, management of U.S. automotive companies would turn to a “dispersed parallel production system” characterized by a geographic dispersion of production, stockpiling, and multisupplier contracts.[53] While switching to a dispersed parallel production system mitigated labor power (no longer could a single strike shut down a company), it fundamentally—and permanently—impeded U.S. automakers’ ability to innovate. As the authors explained, “Dispersion made coordinating direct action more difficult by creating large physical distances between workers.”[54] Parallel production further eliminated “mother plants” as “rather than a single plant production parts for most vehicles produced by a company, now every part was built in at least two plants.”[55] Moreover, stockpiling allowed stations downstream to continue working if a strike disrupted an upstream plant, although doing so led to waste and inefficiency.
Moreover, the proliferation of plants and their geographic dispersion led to automakers using parts provided by multiple suppliers and “predictably, automakers began exploiting competition between suppliers in order to reduce costs.”[56] The geographic separation of plants, suppliers, and workers made just-in-time production difficult to coordinate, while large stockpiles made it expensive and flexible machinery redundant, leading to an abandonment of just-in-time production practices. Thus, the authors concluded, “the rise of dispersed parallel production was the death knell of flexible production in the U.S. auto industry.”[57]
Murray and Schwartz averred that the dispersed parallel production model ultimately impeded U.S. automakers’ ability to respond as smaller, lighter, more fuel-efficient vehicles became more popular in the 1960s and 1970s at a time when U.S. automakers focused on larger, more-prestigious, powerful, and performance-driven cars. They argued that “the demand for more fuel-efficient vehicles [first sparked actually by Volkswagen’s Beetle] … initially spurred U.S. producers to respond by importing compacts from their European subsidiaries. They chose to import small cars rather than make them in the United States because dispersed parallel production made it too expensive.”[58] U.S. automakers knew how to produce small cars—indeed, they were producing them in Europe—but in order to compete through U.S. production, “the Big Three would have had to implement new production methodologies and equipment.”[59] As they continued:
In a dispersed parallel system, that would have caused the traditional shutting down of production that takes places during model changeovers to take even longer, cutting into profitability. With no flexible machinery, moving from making large autos and trucks to making small cars would have required changing out all the machinery. Buying all new machines and getting rid of the old ones would have been not just time-consuming but also expensive. In addition, mistakes would have been made at first in implementing new methodologies, since dispersal made face-to-face contact between rank-and-file engineers more difficult.[60]
When importing compacts from foreign subsidiaries proved cost ineffective, the Big Three automakers abandoned small cars for a time, with the dismissive claim of “small cars, small profits.”[61] (O’Donnell and Andresky wrote, “GM regarded the small car market as ‘an unpleasant aberration that would vanish, if there was justice in heaven.’”)[62] When U.S. automakers tried again (after Japanese competition showed that small cars could be profitable), their “small cars were generally of lower quality than the Japanese version” owing in particular to their inability to implement unit body construction and aluminum engines (even though they were using these practices in Europe). But, Murray and Schwartz argued that “unit body was held up primarily by the cost associated with implementation in the numerous distant plants in the decentralized production system, and converting to aluminum would have required eating the costs already invested in cast-iron technology (a symptom of single-purpose, as opposed to, flexible machinery).”[63] In other words, they argued, it was the fundamental nature of the production system that was the impediment to implementing known innovations in America.
Ultimately, Murray and Schwartz contended that “the final consequence of abandoning flexible production was the deindustrialization of the U.S. economy, which accelerated in the 1970s and ’80s and decimated production centers like Detroit and Flint.”[64] As they asserted, “General Motors employed around 350,000 production workers throughout the United States in the 1960s. By 2016, this number had fallen to 135,000 production workers, only 55,000 of whom were employed domestically.”[65] They argued that “a seemingly simple option would have been to readopt flexible production in order to compete,” but since structural constraints impeded this, “the easy option was a ‘spatial fix’: inefficient (labor-intensive) manufacturers migrated to low-wage areas [first in other regions of the United States, and then abroad] in order to offset the cost-of-production advantage.”[66] Looking into the future of the U.S. automotive industry, Murray and Schwartz concluded that “our analysis predicts further decline in both the near and distant future” unless there “is a return to flexible production.”[67]
Murray and Schwartz offered a compelling meta-narrative that subsumes symptoms of decline—low productivity, poor vehicle quality, and an inability to respond effectively to import competition—into a framework anchored in structural production process impediments that’s explained by firms’ inability to effectively manage their workforces. But as the University of Chicago’s Gary Herrigel pointed out, for all its strengths, “the book has many problems,” ignoring a number of potential causal factors. Most notably that, perhaps, “industry did not innovate simply because there was no competition, either domestically or abroad, to force producers to do so.”[68] The authors also appear to have offered a too-jaundiced view of the role of management (not to mention the nature of capitalism itself) and a thoroughly antagonistic assessment of management-labor relations that seems to significantly overstretch the role of class conflict in their narrative. Nevertheless, there is much this account gets right in its assessment of U.S. auto industry decline.
Failing to Timely Respond to Foreign Competition
The crux of the relative decline of the U.S. auto industry appears to be, as McKinsey & Company wrote in its 2005 report “Increasing Global Competition and Labor Productivity: Lessons from the U.S. Automotive Industry,” “It took ten to fifteen years for the Big Three to learn, adopt, and implement lean production techniques [from the foreign transplants] and they succeeded at different rates.”[69] (See figure 9.)
Or, as Eden and Molot put it, “for the first twenty years or so of Japanese penetration in the U.S. market, the Big Three thought that the competitive advantage of the Japanese auto MNEs [multinational enterprises} came from low wages.”[70]
Figure 9: Manufacturing efficiency: hours per vehicle, select automakers, 1979–2002[71]
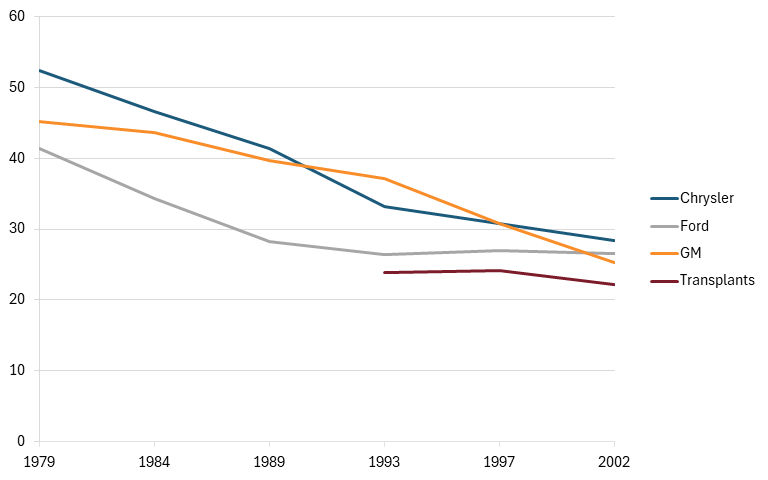
As McKinsey elaborated, “The leading Japan-based OEMs [original equipment manufacturers] were clear leaders in hours per vehicle for the majority of the 1987 to 2002 period. The Big Three improved process efficiency largely by adopting the lean production techniques pioneered by the Japan-based OEMs, rather than developing wholly new process innovations of their own.”[72]
As McKinsey continued, for its part, “GM did not see any pressing need for a large-scale change program. Furthermore, its decentralized organizational structure impeded its ability to carry out process transformation once it realized the need.”[73]
Indeed, as Susan Helper corroborated, “It took General Motors more than two decades to imitate Toyota’s practices consistently.”[74] However, it should be noted that Ford did respond much more rapidly than GM to the Japanese competition.
From 1967 to 1980, Japanese automakers increased their labor productivity by 7.9 percent per year, while for U.S. manufacturers the rate of increase was just 1.3 percent.
As McKinsey noted, “It took four years for Ford to go from a pilot program to widespread adoption of lean production.”[75] Corroborating this analysis, in a comparative study of the productivity of the American and Japanese auto industries over a 13-year period, Marvin Lieberman and Shigeru Asaba found that, from 1967 to 1980, Japanese automakers increased their labor productivity by 7.9 percent per year, while for U.S. manufacturers, the rate of increase was just 1.3 percent. (See table 1.) Japanese parts suppliers increased their productivity by 11.4 percent per year over this period, while that figure was 1.1 percent for American parts suppliers (and their total factor productivity (TFP) was rated at -1.0 percent).[76]
U.S. automakers did improve in the following decade, exceeding Japanese labor productivity in assembly by over 4 percentage points annually from 1980 to 1993, demonstrating that U.S. manufacturers did eventually learn and benefit from the processes of their Japanese competitors, but their delay in adapting cost them years of profits and market share.
Table 1: Productivity growth of U.S. and Japanese auto assemblers and parts suppliers[77]
|
Assemblers |
Part Suppliers |
|||
|
USA |
JPN |
USA |
JPN |
|
|
Avg. Labor Productivity Growth Rate, 1967–1980 |
1.3% |
7.9% |
1.1% |
11.4% |
|
Avg. TFP Growth Rate, 1967–1980 |
1.5% |
-1.0% |
||
|
Avg. Labor Productivity Growth Rate, 1980–1993 |
8.8% |
4.0% |
2.6% |
4.3% |
|
Avg. TFP Growth Rate, 1980–1993 |
1.8% |
-0.3% |
||
Of course, it also bears noting here that American Dr. W. Edwards Deming, a pioneer of many of the quality and lean practices that Japanese automakers ultimately mastered, offered the ideas to American automakers first, only to be largely rebuffed and to find a more receptive audience abroad—in Japan.[78]
The Role of Management Practices and Relational Contracts With Labor and Suppliers
In their paper, “Management Practices, Relational Contracts, and the Decline of General Motors,” Helper and Henderson offered a somewhat complementary (to Murray and Schwartz) account of GM’s decline (and, by extent, that of the overall U.S. auto industry), although their account focuses more on the mechanics of why GM’s management proved unable to implement known effective best practices (e.g., lean, quality, kaizen), couching the explanation largely in the relational contracts GM management adopted with workers and suppliers.[79]
In the late 1980s, Japanese firms needed 1.7 million adjusted engineering hours to develop a $14,000 car, while their U.S. competitors took an average of 3.2 million hours.
As Helper and Henderson contended:
GM struggled for so long because Toyota’s practices were rooted in the widespread development of relational contracts—agreements based on subjective measures of performance that could neither be fully specified beforehand nor verified after the fact and were thus enforced by the shadow of the future—and GM’s history, organizational structure, and managerial practices made it very difficult to maintain these kinds of agreements either within the firm or between the firm and its suppliers.[80]
Ultimately, Helper and Henderson argued, it took some time—at least 20 years—for GM “to understand exactly what Toyota was doing and to attempt to implement the full bundle of practices necessary to successfully imitate its Japanese rivals.”[81]
Helper and Henderson did note the effect of labor cost differentials, pointing out that (according to one 2007 study) labor costs at GM were as high as $73/hour (factoring in benefits such as health care and pensions, in addition to wages), while Japanese competitors’ costs in the United States were roughly $48 an hour (or 35 percent less).[82] They also noted that GM’s legacy costs were about $1,600 per car in 2005.[83] (Legacy costs are long-term financial obligations incurred by an organization in previous years, primarily consisting of pension and health care benefits for retirees.)
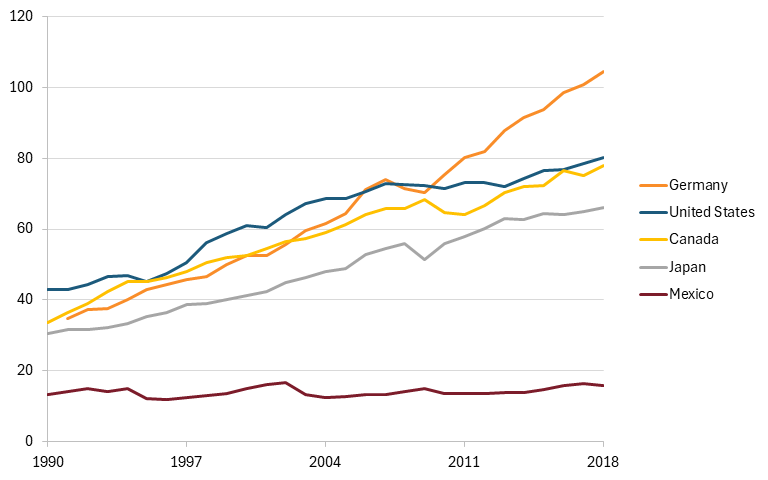
Reinforcing this point, between 1990 and 2018, the labor costs of Japanese workers in the motor vehicle manufacturing industry consistently undercut those of the United States. Adjusted for purchasing power parity (PPP), Japan’s labor cost per employee was consistently between 65 and 75 percent of U.S. labor costs from 1990 until the global financial crisis in 2008. In the years following, Japan’s labor costs have increased slightly relative to those of the United States, but are still lower. (See figure 10.)
Figure 10: Labor cost per employee, 1990–2018 (thousands of PPP-adjusted dollars)[84]
But while GM was hampered with some legacy costs and higher hourly labor cost obligations, Helper and Henderson explained that GM was simply “significantly less productive than its rivals in nearly every aspect of its operations” for much of the 1980s and 1990s.[85] For instance, Clark and Fujimoto found that in the late 1980s, Japanese firms needed 1.7 million adjusted engineering hours to develop a $14,000 car, while their U.S. competitors took an average of 3.2 million hours.[86] GM’s assembly operations were also persistently less productive than those of their rivals. In their book, The Machine That Changed The World, Womack, Jones, and Roos compared the productivity of GM’s Farmingham assembly plant against Toyota’s Takaoka assembly plant, finding that it took GM nearly double the number of hours it took Toyota to assemble a vehicle.[87] (See table 2.)
Table 2: The productivity of GM’s Farmingham assembly plant versus Toyota’s Takaoka assembly plant in 1986[88]
|
GM Farmingham |
Toyota Takaoka |
|
|
Gross assembly hours per car |
40.7 |
18.0 |
|
Adjusted assembly hours per car |
31 |
15 |
|
Assembly defects per 100 cars |
130 |
45 |
|
Assembly space per car (square feet/car) |
8.1 |
4.8 |
|
Inventories on parts (average) |
2 weeks |
2 hours |
Ultimately, Helper and Henderson argued that American automakers saw the value and techniques of lean/quality/just-in-time practices, but it took them a very long time to adopt changes in management and organizational practices to make those techniques successful throughout their organizations (as McKinsey found). As they argued, GM executives, “appeared to have believed that the essence of Toyota’s advantage lay in tools like the fixtures designed to change stamping dies rapidly, or in the use of ‘just-in-time’ inventory systems, rather than the management practices that made it possible to develop and deploy these techniques.”[89] They recount the account of Jeffrey Liker (a GM consultant) from “This American Life” in 2010:
One of the GM managers was ordered from a very senior level—(it) came from a vice president—to make a GM plant look like NUMMI [New United Motor Manufacturing, Inc.]. And he said, “I want you to go there with cameras and take a picture of every square inch. And whatever you take a picture of; I want it to look like that in our plant. There should be no excuse for why we’re different than NUMMI, why our quality is lower, why our productivity isn’t as high, because you’re going to copy everything you see. … Immediately, [I] knew that was crazy. We can’t copy employee motivation; we can’t copy good relationships between the union and management. That’s not something you can copy, and you can’t even take a photograph of it.[90]
GM’s executives appeared to believe that the essence of Toyota’s advantage was in fixtures and inventory systems, rather than the management practices that made it possible to develop and deploy these techniques.
Employee Relationships
Perhaps Helper and Henderson’s most trenchant analysis pertains to how disparately GM and Toyota management treated workers in automotive design and production practices. They note that “in the 1960s and 1970s, jobs on the General Motors assembly line were very narrowly defined; a worker would perform the same set of tasks—for example, screwing in bolts—every 60 seconds for eight to ten hours each day.”[91] Workers were expected—and permitted—to do nothing beyond the assigned single task. “Responsibility for the design and improvement of the assembly system was vested firmly in the hands of supervisors and manufacturing engineers, while vehicle quality was the responsibility of the quality department. GM’s managers were notorious for believing that blue collar workers had little—if anything—to contribute to the improvement of the production process.”[92]
In contrast, while “jobs on Toyota’s production line were even more precisely specified: for example, standardized work instructions specified which hand should be used to pick up each bolt … Toyota’s employees had a much broader range of responsibilities.”[93] Toyota workers were extensively cross-trained and expected to be able to handle six to eight different jobs on the line; moreover, “they were also responsible for both the quality of the vehicle and the continual importance of the production process itself.”[94]
In particular, leveraging the kaizen approach, workers were expected to identify quality problems as they occurred in real time, and were empowered “to pull an ‘andon’ cord located at each assembly station to summon help to solve them in real time, and if necessary to pull the andon cord again to stop the entire production design.”[95] (This reflected tremendous trust in workers, as it can cost a company as much as $15,000 every minute an assembly line is down.)[96] To further their ability to contribute to continuous improvement processes, Toyota workers were trained in statistical process control and experimental designs.
In contrast, GM executive Steven Bera noted that, even after GM plants began to install some of the physical features of Japanese auto plants, “there was no change in the culture. Workers and managers continued their old antagonistic ways. In some of the factories where they installed the andon cord, workers got yelled out when they pulled it.”[97]
As Helper and Henderson noted, “Some plant managers continued to believe that blue collar workers were fundamentally lazy and would pull the andon cord any time they wanted a break and that the blue collar workers lacked the capacity to engage in problem solving or continuous improvement.”[98] Later, when GM workers received training in Statistical Process Control and were told that their suggestions would be welcomed, they provided a flood of suggestions, but “management had not assigned anyone to respond to their suggestions or examine the data, [so] workers soon reverted to past patterns, feeling betrayed and much less interested in participating in future experiments.”[99]
Supplier Relationships
Helper and Henderson also noted that “U.S. automakers’ relationships with outside suppliers from the 1950s were also very different from those of their Japanese competitors.”[100]
Or, as Cutcher-Gershenfeld, Brooks, and Mulloy wrote, “Historically, the Big Three would pit suppliers against one another in competitive bidding processes and approach ongoing relationships from a low-trust, high-control perspective.”[101]
As MacDuffie and Helper elaborated, U.S. automaker-supplier relationships:
Were driven overwhelmingly by price and were governed by written contracts that involved precise specification of the purchased part. There was little communication between suppliers and either the central engineering groups who designed the parts or the assembly plants responsible for using them—a reflection of a deeply held belief at General Motors that experts should do the planning and designing while implementation should be accomplished through a detailed division of labor.[102]
Ultimately, Clark and Fujimoto estimated that supplier contributions accounted for one-third of the difference in Japanese automakers’ advantage over their U.S. counterparts in total engineering hours needed to develop a new car.[103] Similarly, Cusumano and Takeishi found that the defect rates of parts supplied by Japanese companies were on the order of one-tenth the rate supplied by U.S. firms.[104] Further, a sample of U.S. automotive suppliers selling to both Toyota and U.S. automakers found that, from 1990 to 1996, the average supplier reduced defects by 50 percent for Toyota, but only 26 percent for their largest U.S. customer.[105] Certainly, U.S. automaker-supplier relationships have since improved, but they still remain challenging: One 2017 McKinsey study finds that “inefficiencies in OEM-supplier interactions add up to roughly 5 percent of development, tooling, and product costs in the auto industry.”[106]
In their comparative study on productivity levels between the Japanese and U.S. automotive sectors, Lieberman and Asaba noted, “Our most striking findings relate to the poor performance of American automotive suppliers.” They explained, “Compared with Japan, US supplier-assembler relations have long been characterized by mistrust and adversarial relations. This has limited the extent of information sharing and collaborative, long-term investments.”[107]
Supplier contributions accounted for one-third of the difference in Japanese automakers’ advantage over their U.S. counterparts in total engineering hours needed to develop a new car.
Unable to Scale Learnings Across the Organization
Both Murray and Schwartz in Wrecked and Helper and Henderson extensively recounted the history of NUMMI, a joint venture GM formed with Toyota to learn from Toyota’s management practices in an erstwhile shuttered GM Fremont (California) plant, which “had been one of the least productive [plants] in GM, famous for its troubled labor relations” where unexcused absenteeism often exceeded over 20 percent and there were over 1,000 labor grievances.[108]
Despite that history, Toyota rehired 99 percent of the assembly workers and 75 percent of the skilled trade workers, implemented its practices, and “NUMMI went on to reach levels of productivity and quality comparable to those of Toyota’s Japanese plants.”[109]
Yet, while that attempt was successful, Womack, Jones, and Roos noted that “it seems to have had only a minimal impact on the functioning of GM as a whole.”[110]
Murray and Schwartz further observed that, in the mid-1990s, GM tried to model production at other locations based on lessons learned from NUMMI, but failed to replicate them across the organization, especially as the company invested over $1 billion to upgrade its stamping and assembly plant in Lordstown, Ohio (along with plants in Lansing, Michigan and Ramoz Azipe, Mexico), “into a flexible production system that could produce everything needed for the [Chevrolet] Cavalier and [Pontiac] Sunfire.”[111] But as Alex Taylor found, immediately upon launch, the project faced coordination problems and ended up months behind schedule, costing the company $2 billion in lost sales and a point of market share.[112] Murray and Schwartz argued that the geographic dispersion (between the three plants) “made it impossible to truly take advantage of the benefits of flexible production.”[113]
As then-GM CEO Rick Waggoner explained at the time, “The big issue is we bit off a big chunk. There were three orders of magnitude—three buckets. If it had been the same plant, same processes and same productivity it would have been easy. But if you vary all of those things it becomes more complex.”[114]
In summary, Helper and Henderson concluded that GM’s central failing was that “it took time for the firm to understand the nature of the cluster of techniques that drove Japanese success,” particularly their “high performance work systems”—patterns of managerial practice that center around dense networks of communication and joint problem solving.[115] Ultimately, they asserted that “these techniques could not be implemented without the simultaneous development of effective relational contracts, and General Motors had considerable difficulty building such contracts.”[116]
Inferior Vehicle Quality
To address the topic briefly, certainly cost and inferior vehicle quality were significant contributors to the decline of U.S. auto industry competitiveness, but the framing offered thus far places that as a symptom of deeper industrial management, organizational, and production challenges, not as the central cause of the decline itself. Nevertheless, it’s certainly true that “throughout the 1980s and 1990s, consumers complained that American cars suffered from noise, vibration, and harshness and from poor ride quality.”[117] Moreover, the average fuel economy of Japanese cars and trucks sold in the United States was 5 miles per gallon greater than that of American vehicles in the 1980s.[118]
In 1988, Japanese vehicles had an 18 percent quality advantage over the U.S. industry; by 1989, the gap was 27 percent.
A 1990 Los Angeles Times article’s title asks “Why Can’t America Catch Up?” noting that after a decade of effort, U.S. vehicles continued to lag behind in quality. The article quotes Chris Cedergren, an automotive analyst with J. D. Power & Associates, as saying, “Without a doubt, the Japanese won the 1980s.”[119] In fact, the gap continued to grow throughout the decade: according to J.D. Power, in 1988, Japanese vehicles had an 18 percent quality advantage over the U.S. industry; by 1989, the gap was 27 percent.
Japanese automakers also extended their conceptualization of quality over this time. As analyst James Risen noted, “The Japanese have come to view quality in a much more comprehensive sense than the Americans. Their new definition encompasses not just quality as the industrial science of building cars that do not fall apart, but also quality as the art of providing the customer with a better overall driving experience.”[120] The Japanese called these atarimae hinshitsu—“taken-for-granted [vehicle] quality”—and miryoku teki hinshitsu, meaning “compelling” or “bewitching” quality.[121]
This section has outlined several rationales for the relative decline of the U.S. automotive industry from the mid-1960s to 2010. All offer some degree of explanatory power, but the core issue appears to be that it took 10 to 15 years for the Big Three to learn, adopt, and implement lean production techniques from the foreign automakers.
Explaining Evolving U.S. Auto Industry Competitiveness: 2010 to the present
Coming out of the Great Recession’s convulsions, the U.S. auto industry appeared to have stabilized. Certainly, the foreign transplants account for a larger share of domestic manufacturing today. But from 2010 to 2022, the United States’ share of global automotive output increased from 10.9 percent to 13.8 percent, a 26.5 percentage point increase. The industry’s value added increased from $88.2 billion in 2010 to $154.2 billion by 2016, although it had only further increased to $159.3 billion by 2022 (the 2022 value added amount represented an 81 percent increase over the 2010 level). As noted, America’s LQ in autos remains weak at 0.54 percent, although at least that represents an increase over the 0.33 percent nadir reached in 2009 in the wake of the Great Recession.[122]
Indeed, as one 2015 report puts it, “The U.S. auto industry has been revitalized in recent years through a commitment to quality, innovative production, and management techniques, a constructive relationship between management and labor, and improved relations with suppliers.”[123] The authors of that report noted both that management-labor strife had abated and that “the union has been a full partner for more than a decade in experimenting with work organization.”[124] Excluding the United Auto Workers strike of 2023, which was resolved six weeks after it began, this trend has held consistent up to the present day.
Another 2015 report by Austan Goolsbee and Alan Kreuger, then with the Council of Economic Advisors under president Obama, similarly notes, “We are both pleased and a bit surprised by how well the past five years have played out for the domestic auto industry. We are both thrilled and relieved with the result: the automakers got back on their feet, which helped the recovery of the U.S. economy.”[125]
However, over the past decade, a new set of challenges has emerged, especially marked by the increasing offshoring of production to Mexico—largely due to the lower costs of labor and capital for manufacturers there—and the rise of China as a hypercompetitive auto manufacturer.
The Rise of Mexico
As the Information Technology and Innovation Foundation (ITIF) has written, the combined continental scale of Canada, Mexico, and the United States can enable a competitive North American production system—a “factory North America”—that can better position the United States (and its neighbors) in competition with China in advanced technology industries.[126] The three nations produce a high-wage/low-wage partnership, bringing complementary labor forces, infrastructure, innovation capacities, and industry strengths together to create a highly competitive economic region.[127] In other words, auto producers in the United States can leverage more economically produced parts, or cheaper assembly thanks to lower-cost labor in Mexico, within their supply chain to produce more cost-competitive vehicles.
Labor is the single largest cost to automobile manufacturers outside materials, making up 65 to 70 percent of nonmaterial costs. From 2000 to 2021, Mexican wages per worker were, on average 25 to 30 percent of those in the United States.
Mexico has indeed become an increasingly significant hub for both auto parts manufacturing and automotive final assembly, its LQ nearly doubling from 2.08 in 2010 to 3.94 by 2022. At the same time, its value added output more than doubled, increasing from $27.9 billion in 2010 to $65.1 billion in 2022, while its global market share in the auto industry doubled from 3 percent to 6 percent. In 2024, Mexico ranked fifth globally in light vehicle manufacturing and in exports, with vehicle exports totaling approximately $104.8 billion, 79 percent of which ($82 billion) was destined for the United States.[128] Mexico’s automotive landscape encompasses 21 major vehicle manufacturers and 90 of the world’s 100 largest auto parts companies.[129]
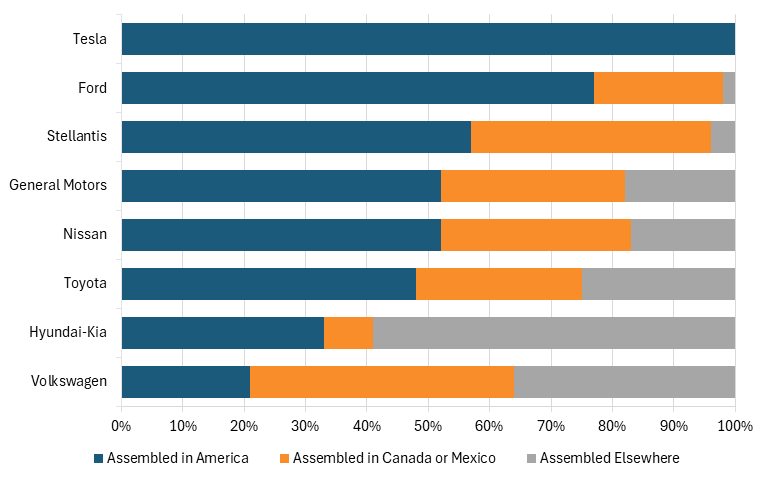
In 2024, 3.6 million cars, around half of America’s car imports by value, arrived via its North American neighbors, with Mexico accounting for about 2.5 million, or 70 percent, of these.[130] Around two-fifths of the cars sold in America by Stellantis come from Mexico or Canada. For GM, the share is nearly one-third. Ford assembles about 20 percent of its vehicles in Mexico or Canada. Mexican and Canadian production accounts for two-fifths of Volkswagen vehicles sold in America. (See figure 11.) Mexico is also a key supplier of auto parts for the U.S. automotive industry, with 43 percent of U.S. auto parts imports coming from that nation.
Figure 11: Percentage of U.S. vehicle sales assembled in the United States or elsewhere[131]
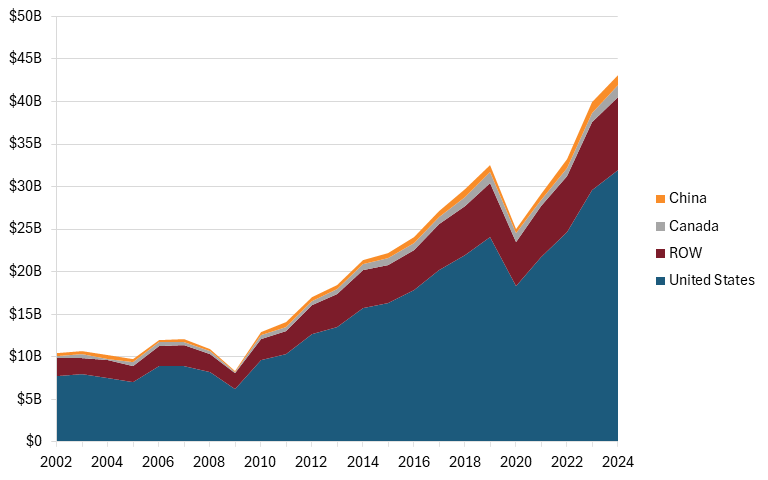
The Peterson Institute for International Economics (PIIE) estimated that 38 percent of the total value added embedded in Mexican motor vehicles sold to the United States originates in the United States. (See figure 12.) PIIE estimated that, in 2024, over $30 billion in implied value-added content in Mexican auto imports came from the United States. Conversely, U.S.-produced content accounted for only $1.2 billion in value added of Chinese auto imports. In other words, a greater share of the value of goods entering the United States from Mexico contains U.S.-produced value than would be the case for China. (The point here being that to the extent manufacturing occurs away from the United States, America is better off when that manufacturing happens in near-shored locations such as Mexico, instead of China.)
Figure 12: Implied value-added content by origin in Mexican auto exports to the United States, 2002–2024[132]
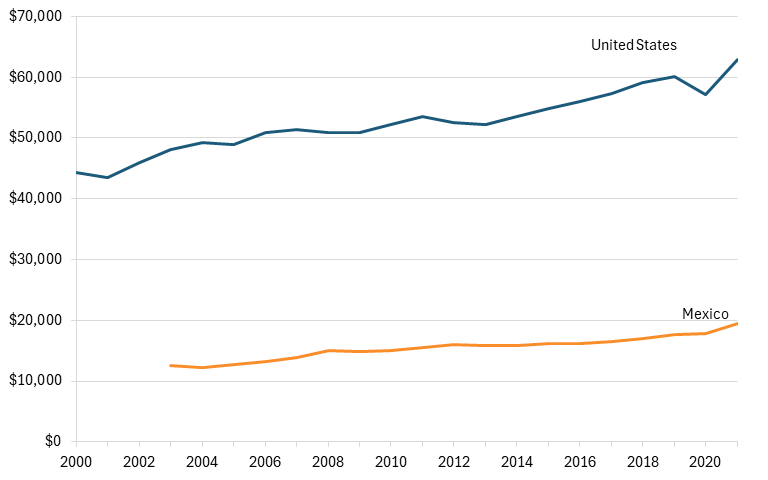
Of course, Mexico’s most significant comparative advantage in the auto sector is labor wages. Labor is the single largest cost to automobile manufacturers outside materials, accounting for 65 to 70 percent of their nonmaterial costs.[133] The Organization for Economic Cooperation and Development (OECD) provides data on wages and salaries for workers in the motor vehicle manufacturing industry in the United States and Mexico from 2000 to 2021. Adjusted for PPP, Mexican wages per worker were, on average 25 to 30 percent of those in the United States over that time period.[134] (See figure 13.) Relatedly, a 2022 study from the Colegio de México finds that, on average, workers in the Mexican automotive industry were paid directly $3.14 an hour in wages, while in the United States, they earned $28.60 and in Canada $26.34 (i.e., this study finds that Mexican auto workers earned an even smaller wage relative to the United States, just 11 percent).[135] K. Venkatesh Prasa of the Center for Automotive Research noted, “What I’ve found on the ground in many plants in Mexico is, in fact, Mexican productivity is comparable or even higher than U.S. productivity, and the quality is very high.”[136]
Figure 13: Salary per worker in the motor vehicle manufacturing industry, PPP-adjusted[137]
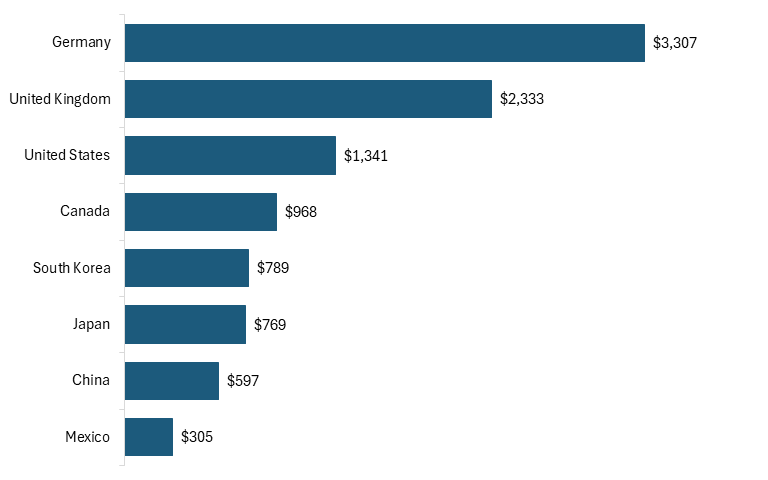
The size of the gap between the United States and Mexico is reinforced when looking at the labor cost per vehicle produced in the two countries. In 2024, Mexico had the lowest labor cost per vehicle among major producers at just $305, nearly half of China’s $597, and about 22 percent of the U.S. level of $1,341. (See figure 14.)
Figure 14: Labor cost per vehicle by country, select countries, 2024[138]
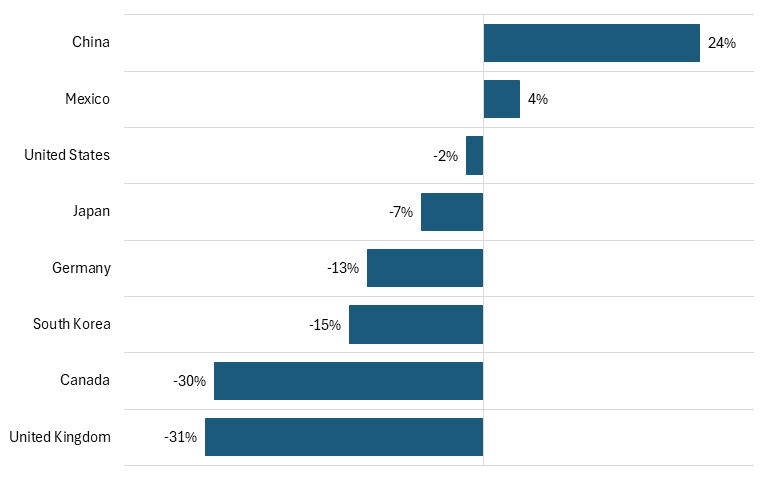
From 2019 to 2024, Mexico’s labor costs per vehicle grew only 4 percent. (See figure 15.) The aforementioned Colegio de México study finds that, from 2019 to 2021, Mexican wages for assembly workers had grown by just 0.10 cents per year.[139] (Note: the U.S.-Mexico-Canada free trade agreement (USMCA) requires that 40 to 45 percent of an automobile’s content be made by workers earning at least $16 per hour to encourage higher wages, yet a vast cost gap persists.)[140] Labor cost per vehicle in the United States, conversely, fell by 2 percent over this time.
Figure 15: Change in labor cost per vehicle by country, 2019–2024[141]
This is the same challenge developed countries now face with China. Conventional international economics and development theory never postulated that there could be sectors in low-wage countries with very high comparable productivity in developed countries. International trade theory held that rich countries could compete with poor countries with lower wages because the latter’s workers were less productive. That is no longer the case with Mexico and China.
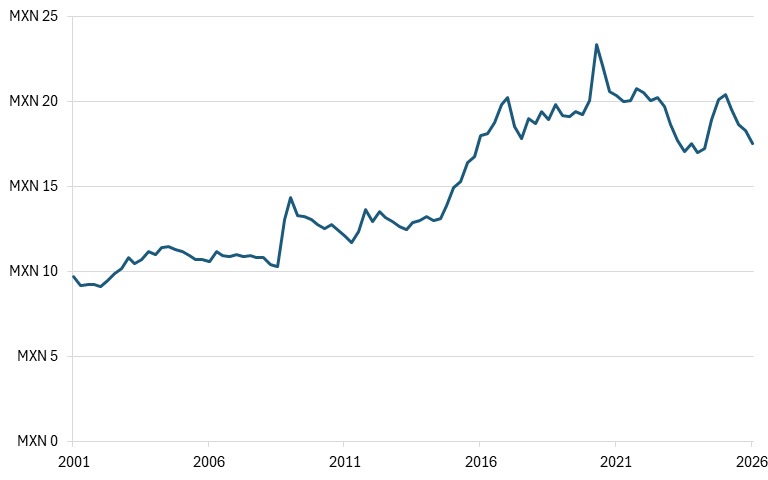
And perversely, the Mexican peso has actually gotten weaker over the years, with the value of one U.S. dollar increasing from 10 pesos to 17.5 pesos between 2001 and 2026, making it even more economical to move U.S. (and Canadian) production there. (See figure 16.) The combination of high productivity, low wages, and a weak peso makes opting not to move auto production to Mexico an incredibly difficult choice to make.
Figure 16: U.S. dollar to Mexican peso (MXN) spot exchange rate, 2001–2026[142]
The Emergence of China as the World’s Largest Auto Producer
This section examines the growth of China’s auto industry and how China has accelerated automotive innovation.
Growth of China’s Auto Industry
Over the past 25 years, China has gone from a peripheral automaker to the world’s leading producer of motor vehicles, having produced over 34 million units in 2025.[143] And its rise to this station has been rapid. China’s value added output in the motor vehicle industry has increased even faster than Mexico’s since 2010, from $130.6 billion to $292.1 billion in 2025, a 124 percent increase. At the same time, it’s grown from holding 16 percent of global market share to 25 percent—with automotive analysts predicting that this value could reach one-third by 2030.[144] However, China’s LQ has fallen slightly over this period (from 1.74 to 1.41) because, although China’s motor vehicle industry has grown rapidly, its broader economy has grown even faster, making it slightly less specialized than it was 12 years previously.
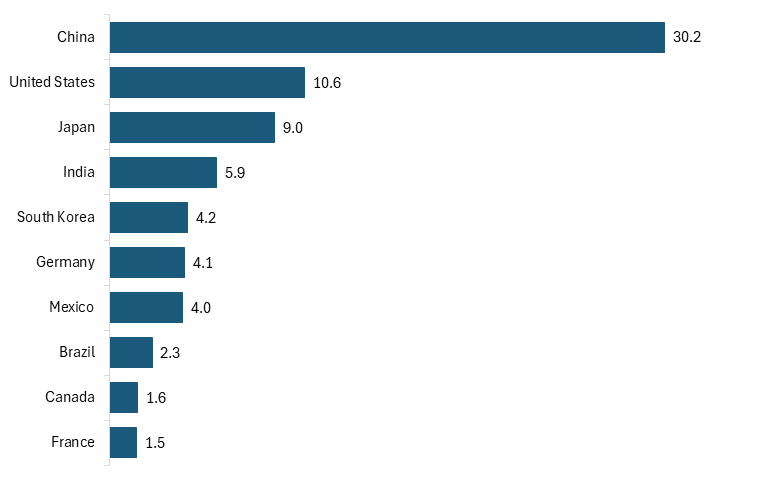
Regarding output, China leads the world by an extraordinary margin. In 2023, China produced over 30 million vehicles, almost three times more than the United States’ production of 10.6 million vehicles, and well ahead of Japan’s output of just under 9 million vehicles. (See figure 17.)
Figure 17: Vehicle output of world’s top 10 auto-producing nations, 2023 (millions of units)[145]
Between 2003 and 2023, U.S. vehicle output fell by 1.3 million units, resulting in a 39 percent decline in the U.S. global share of vehicle production. Over the same period, China experienced a nearly 300 percent increase in its share of automobile production, nearly double the rise in India, and over three times the increase in Mexico. (See figure 18.) Notably, more than 90 percent of auto production in China, Germany, Japan, and South Korea is by companies headquartered in that country; for the United States, that figure is 44 percent.[146]
Figure 18: Percent change in countries’ global share of automotive vehicle production, 2003–2023[147]
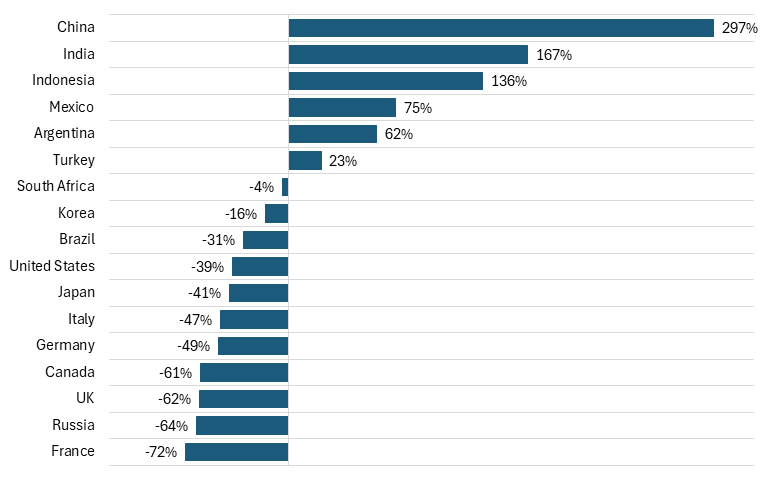
Due, in part, to the low labor costs in China (as previously shown in figure 14), the cost of Chinese vehicles is perceptibly low compared with international competitors, elevating their products in the global market. As such, exports of Chinese vehicles have boomed. From 2010 to 2023, Chinese exports of motor vehicles increased by 3,724 percent; in comparison, exports from Mexico increased by 134 percent. As a share of GDP, the increase was more measured, but still extraordinary, at 1,196. Mexican exports as a share of GDP increased by 44 percent.
China experienced a nearly 300 percent increase in its share of automobile production from 2003 to 2023, while the United States experienced a 39 percent decline.
But China’s emergence from minor actor to the leading global auto producer hasn’t been incidental, but rather the result of intentional industrial strategies and a great deal of technological innovation, as ITIF compressively explained in its report “How Innovative Is China in the Electric Vehicle (EV) and Battery Industries?”[148] The following briefly recounts the progress China has made in automotive (especially EV) product and process innovation.
China’s Innovation in Autos/EVs
As Andrew Bergbaum, global co-leader of the automotive and industrial practice at AlixPartners observed, “The revolution taking place in the global auto industry is driven by the incredible and once unthinkable maturation of Chinese automakers that do a number of things differently.”[149] Research firm Bernstein estimates that Chinese EVs can cost half as much to make as European ones, even while they boast better tech.[150]
Product Innovation: More Innovative Vehicles
EVs and EV batteries were actually invented in the United States. In fact, inventor William Morrison developed the first successful electric car in 1890, and by the early 1900s, about one-third of vehicles on U.S. roads were electric.[151] Engine technology subsequently dominated most of the 20th century, but in the early 1970s, Exxon scientist M. Stanley Whittingham created the first functional lithium-ion battery, which was improved upon by John Goodenough at the University of Oxford and the Japanese scientist Akira Yoshino at Asahi Kasei Corp.[152] In the mid-1990s, researchers at the University of Texas pioneered a new compound called lithium-iron phosphate (LFP) that would become the primary original EV battery chemistry.[153] U.S. EV battery start-up A123 commercialized this technology in the late 2000s (famously receiving a $249 million grant from the Obama administration), but went bankrupt in October 2012 and was purchased by the Chinese company Wanxiang Group, transferring much of America’s EV-making knowhow to China.[154]
Much of America’s EV battery-making knowhow was transferred to China when Wanxiang Group purchased A123.
Today, a wide variety of EV batteries exist, but the two most prominent types have historically been LFP and nickel- and cobalt-based batteries, which can come in nickel cobalt aluminum (NCA) or nickel manganese cobalt (NMC) varieties. Nickel/cobalt batteries were actually the dominant battery technology for many years, used in American- and European-produced EVs, such as Teslas.[155] Indeed, as Zeyi Yang wrote in MIT Technology Review, “Just a few years ago, LFP batteries were considered an obsolete technology that would never rival NMC batteries in energy density.”[156] In fact, from 2016 to 2018, LFP batteries accounted for just 10 percent of the global EV battery market.[157] But today, LFP batteries account for about 40 percent of the global market for EVs, and as Yang wrote, “It was Chinese companies, particularly CATL, that changed this consensus through advanced research.”[158]
Or, as Max Reid, a senior research analyst for EVs and batteries at research firm Wood Mackenzie, explained, China’s EV battery leadership “is purely down to the innovation within Chinese cell makers. And that has brought Chinese EV battery [companies] to the front line, the tier one companies.”[159]
China clearly dominates EV battery technology today, producing 80 percent of the world’s EV batteries made in 2024.[160] In April 2024, CATL announced that it had developed its fast-charging “Shenxing Plus” LFP battery, which is capable of a driving range of more than 1,000 km (621 miles) off a single charge.[161] CATL asserts that the battery can achieve a range of 400 km (248 miles) off just a 10-minute charge.[162] In October 2025, China’s Chery introduced an all-solid state EV battery capable of going 800 miles on a single charge.[163] Moreover, as the New York Times’ Keith Bradsher noted, “Beyond the battery itself, China also dominates electric motor production, and in designing high-efficiency systems that tie together batteries and motors.”[164]
So dominant are Chinese EVs that Ford is considering a tie-in with Chinese EV battery maker CATL to produce EV batteries in the United States for the company. In fact, at the 2025 Aspen Ideas Festival, Ford CEO Jim Farley called China’s global lead in electric vehicles and connected-vehicle technology “the most humbling thing I have ever seen.”[165]
Yet, Chinese EV makers have intensely focused on innovating beyond the battery itself, particularly in incorporating digital features into vehicles, such as autonomous driving, driver-assistance features, navigational aids, virtual reality, and even “multiple high-resolution dashboard screens pimped with generative AI and streaming video.”[166]
As Paul Gong, UBS head of China auto research, explained, “New EVs are more like computers with batteries on wheels. Chinese carmakers are now ahead of almost everyone else along the entire EV supply chain.”[167] And as the hardware has become simpler, the focus for what makes an appealing product has shifted decisively to software and new features.[168] Ade Thomas, who founded World EV Day, coined the phrase “digital bling” cars to describe the tech-laden EVs now being manufactured in China.[169]
Process Innovation: More Efficiently and Cost-Effectively Designing and Manufacturing Vehicles
Chinese automakers have demonstrated the ability to bring new vehicles to market much faster than their Western legacy competitors can. As the Wall Street Journal’s Selina Cheng and Yoko Kubota elaborated, “Chinese automakers are around 30% quicker in development than legacy manufacturers, largely because they have upended global practices built around decades of making complex combustion-engine cars.”[170] For instance, Nio takes less than 36 months from the start of a project to delivery to customers, compared with roughly four years for many traditional carmakers. Overall, Chinese EV makers offer models for sale for an average of 1.3 years before they are updated or refreshed, compared with 4.2 years for foreign brands.[171]
As McKinsey elaborated, “China’s new EV-focused automakers have slashed the time required to develop a new vehicle, taking new electric models from concept to launch in roughly 24 months—twice the speed of other automotive companies, where lead times reach 40 to 50 months or even longer.”[172] (See figure 19.) Innovating at speed allows Chinese competitors to differentiate their products with novel technologies and first-to-market features.
Figure 19: Directional product development timeline, months to start production[173]
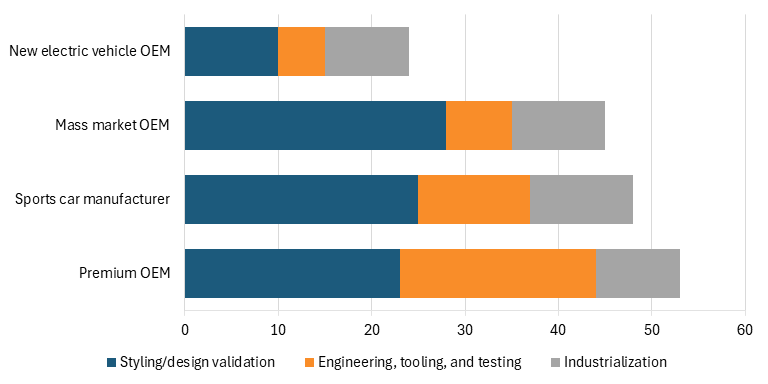
As McKinsey elaborated, “Complexity kills speed in product development” and so Chinese OEMs have adopted “a focus on radical simplification” that “goes right down to the component level, with an emphasis on the use of standard components wherever possible and modular designs that enable modifications without major redesign, qualification, and testing.”[174] Chinese OEMs further seek to maximize the number of parts carried over from one product to the next. China’s automotive OEMs also use software simulation and virtual prototypes for 65 percent of their testing, compared with 40 to 50 percent in other regions of the world. Moreover, three-quarters of those tests are highly automated, compared with around two-thirds in other regions. Overall, McKinsey has estimated that the use of digital tools for smart and efficient testing and development can reduce vehicle time to market by 9 to 11 months.[175]
Innovating at speed allows Chinese competitors to differentiate their products with novel technologies and first-to-market features.
Chinese automakers have also advanced notable automotive manufacturing process innovations. It was Tesla that pioneered the “gigacasting” process for manufacturing vehicle chassis, a metal die-casting process characterized by forcing molten metal under high pressure into a mold cavity. By combining hundreds of manufacturing steps into one, thus saving on components, weight, cost, and time, the technique helped Tesla reduce production costs for the underbody of its Model Y by some 40 percent.[176] But China’s Xiaomi has innovated further upon Tesla’s gigacasting process.[177] Specifically, as the Wall Street Journal’s Cheng and Kubota wrote:
The liquid aluminum that gets injected into the die-casting machine has to be a certain variety that can withstand an extraordinary amount of pressure. Xiaomi had to come up with its own material, building an artificial-intelligence program that used a method known as deep learning to simulate how different materials would behave when placed inside the die-cast machine.[178]
China further leads the world in deploying robots in the automotive manufacturing environment. In fact, in 2024, China deployed almost 57,200 automotive robots, which is over four times more than the United States’ 13,641 and Japan’s 13,087 robots deployed. (See figure 20.) As the New York Times’ Bradsher explained, “[Nio] has invested so extensively in robots that one of its factories employs just 30 technicians to make 300,000 electric car motors a year.”[179]
Figure 20: Automotive industry robot installations, select countries, 2023–2024[180]
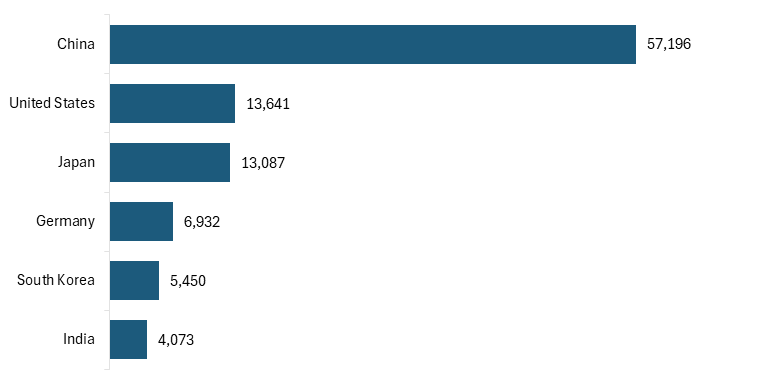
China’s robot adoption in the automotive sector also outstrips the United States when considering robots deployed per 10,000 workers. While South Korea and Japan surpass China in this figure, China’s deployment of 115.6 robots per 10,000 workers is over two times the U.S. figure of 56.8. (See figure 21.)
Figure 21: Robot density per 10,000 workers in the automotive sector, 2024[181]
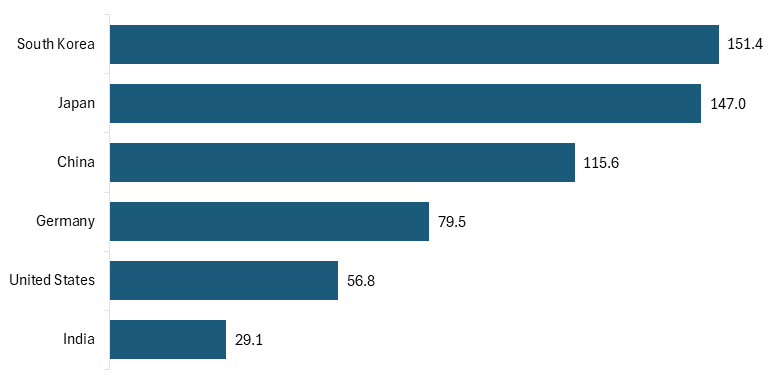
China’s auto industry’s utilization of robots is even more impressive considering wages in China’s auto industry are a fraction of those in the United States. In fact, controlling for wages, ITIF found that Chinese firms (across all sectors) are now using industrial robots at 12 times the American rate.[182] And, as with Mexico, Chinese auto wages are a fraction of U.S. wages, something that has not been helped by a Chinese RMB that has not measurably appreciated over the last 12 or so years.
Another area where Chinese automakers appear to have surpassed Western ones is in productive relationships with suppliers. As the Society for Automotive Engineering elaborated:
One traditional supplier, working collaboratively with a Chinese OEM, was surprised at how fast it completed the project. One reason things went so quickly was that the Chinese automaker provided it with only 50 pages of specifications compared to the 4,000 pages it can get from traditional automakers. Chinese OEMs are better at telling suppliers how they want a component to perform and letting them figure out how to achieve it, instead of trying to dictate all the steps a supplier must follow.[183]
In summary, China’s ability to produce novel automotive product and process innovations is very real and China has clearly become an increasingly fierce competitor in the global automotive industry.
The Current State of the U.S. Auto Industry
After being the clear hegemon of the global auto industry from the 1920s through the mid-1960s, the U.S. auto industry has undergone significant changes at all levels over the past six decades. Beginning as a homogenous market dominated by the Big Three automakers, a surge of imports and later transplants changed the game for American automakers and the U.S. auto marketplace as a whole. U.S. automakers adapted slowly to this challenge, ceding market share and losing significant potential revenues.
Today, the U.S. auto industry faces a new, but eerily similar, set of challenges. Faced with new competitors, this time from low-cost manufacturers in Mexico and powerful, state-supported OEMs in China, the U.S. auto industry must adapt to new technologies and production processes being developed around the world or risk, once again, falling behind.
Today, U.S. automakers continue to import large swaths of their production from lower-cost nations, most prominently Mexico. GM and Ford, the two largest U.S. automakers, both import substantially more than they export, with GM importing nearly 1.2 million more units to the United States than it exports. Ford, on the other hand, being the largest American auto exporter, has a U.S. trade deficit of 40,000 units.[184] (See figure 22.)
Figure 22: U.S. trade deficits of U.S. auto firms, units (2024)[185]
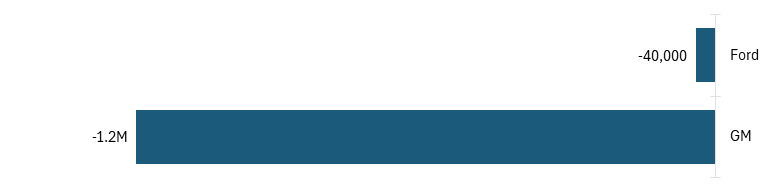
In order to increase competitiveness, one key area of potential improvement for U.S. auto firms could be their levels of capital investment. Among major automakers, Tesla leads with the highest capital investment-to-revenue ratio, at 11.6 percent, followed by BMW at 8.8 percent. But the Big Three automakers fall into the middle of the global pack with capital investment ratios between 7 and 4.5 percent (although on this metric, the Japanese automakers lag behind their competitors).[186] (See figure 23.)
Figure 23: Capital expenditures as a share of revenue, 2024[187]

U.S. automakers could also reinvest more of their revenues in R&D and Capex (at least compared with global leaders Honda and Volkswagen). In FY 2024, Honda stood out in revenue reinvestment into business operations, allocating one-fifth of its net revenue to capital investment and R&D, followed by Volkswagen at about 12 percent, while the Big Three were in the middle. GM and Stellantis invest roughly twice as much in R&D and capital expenditures as in dividends and stock buybacks, while Ford invests comparatively less, allocating only 3 percent of total revenue to shareholder returns. (See figure 24.) Heightened investment in capital and research is more likely to lead to product and process innovations in the automobile industry and increase its competitiveness.
Figure 24: Share of auto companies reinvested vs. used for share buybacks or dividends, FY 2024[188]
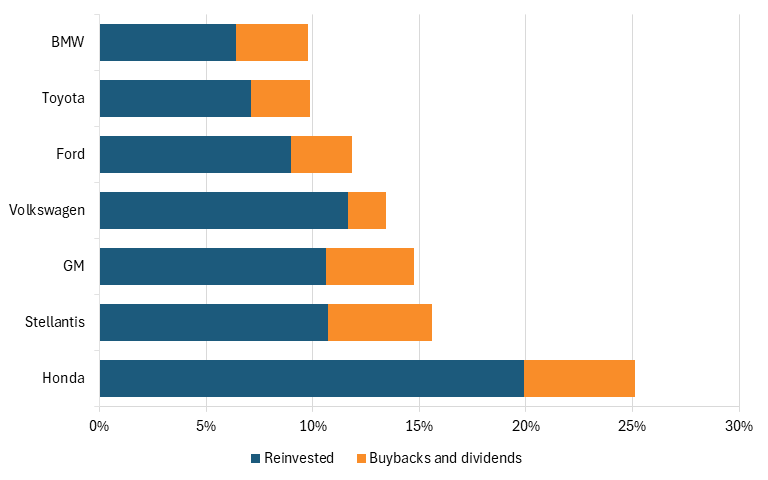
This is all to say that the U.S. auto industry has reached another crossroads. As in the late 20th century, the industry is again being massively disrupted by foreign competition. It’s imperative that the industry recognize this risk before it’s too late and take the needed steps to increase domestic production and competitiveness before the time to do so has passed.
Conclusion
Having now examined what happened to the competitiveness of the auto industry of the United States and why it has experienced a relative decline over the past several decades, the final report in this series will present a set of extensive policy recommendations aimed at outlining a comprehensive national strategy to bolster the competitiveness of the U.S. auto sector.
Acknowledgments
The authors would like to thank Robert Atkinson for his assistance with this report.
This report is the second installment in a three-part series on the U.S. auto industry. Read the series at itif.org by searching #autostrategyseries.
About the Authors
Stephen Ezell is vice president for global innovation policy at the Information Technology and Innovation Foundation (ITIF) and director of ITIF’s Center for Life Sciences Innovation. He also leads the Global Trade and Innovation Policy Alliance. His areas of expertise include science and technology policy, international competitiveness, trade, and manufacturing.
Meghan Ostertag is a policy analyst for economic policy at ITIF. She holds a bachelor’s degree in economics from American University.
About ITIF
The Information Technology and Innovation Foundation (ITIF) is an independent 501(c)(3) nonprofit, nonpartisan research and educational institute that has been recognized repeatedly as the world’s leading think tank for science and technology policy. Its mission is to formulate, evaluate, and promote policy solutions that accelerate innovation and boost productivity to spur growth, opportunity, and progress. For more information, visit itif.org/about.
Endnotes
[1]. Stephen Ezell and Meghan Ostertag, “Assessing the Evolving Global Competitiveness of the US Auto Industry” (ITIF, March 2026), https://itif.org/publications/2026/03/23/assessing-evolving-global-competitiveness-of-us-auto-industry/.
[2]. David G. Anderson, “The US Auto Industry, 1960-2025” (The Data Poet, April 6, 2025), https://thedatapoet.substack.com/p/the-us-auto-industry-1960-2025.
[3]. “International Automakers and Dealers in America” (AIADA, 2025), https://autosdriveamerica.org/wp-content/uploads/2025/08/ADA_8.5X11_2025_final_compressed.pdf.
[4]. U.S. Department of Energy, “Fact #637: August 23, 2010 World Motor Vehicle Production,” https://www.energy.gov/eere/vehicles/fact-637-august-23-2010-world-motor-vehicle-production.
[5]. Data from 1950 to 1990 came from U.S. Department of Energy, “Fact #637: August 23, 2010 World Motor Vehicle Production,” https://www.energy.gov/cmei/vehicles/fact-637-august-23-2010-world-motor-vehicle-production; Data from after 1990 comes from Organization for Economic Cooperation and Development (OECD), “Trade in Value Added (TiVA) 2025 Edition,” accessed February 4, 2026.
[6]. Harvard Atlas of Economic Complexity (U.S. Imports and Exports of Passenger motor vehicles (excluding buses), 1962–2023), accessed January 29, 2026, https://atlas.hks.harvard.edu/explore/overtime?year=2023&startYear=1962&endYear=2023&productClass=SITC&exporter=group-1&locationLevel=country&view=markets&product=product-SITC-1314&tradeDirection=imports&importer=country-840; Federal Reserve Bank of St. Louis (Consumer Price Index for All Consumer: All Items in U.S. City Average), accessed February 10, 2026, https://fred.stlouisfed.org/series/CPIAUCSL#.
[7]. Robert D. Atkinson and Meghan Ostertag, “The Hamilton Index, 2025” (ITIF, forthcoming report); OECD, “Trade in Value Added (TiVA) 2025 Edition.”
[8]. “Data on imports sheds light on their dramatic gains from 1964-80,” Inside Auto, July 10, 2024, https://www.indieauto.org/2024/07/10/data-on-imports-sheds-light-on-their-dramatic-gains-from-1964-80/.
[9]. Ibid.
[10]. Lorraine Eden and Maureen Appel Molot, “Made in America? The US Auto Industry, 1955–1995,” The International Executive Vol. 38, Issue 4 (July/August 1996), https://www.voxprof.com/eden/Publications/madeinustheusautoindustry.pdf.
[11]. James R. McElroy, “Automotive Trade Statistics, 1964–80” (U.S. International Trade Commission, December 1981), https://www.usitc.gov/publications/332/pub1203.pdf.
[12]. Ana Aizcorbe, “Japanese exchange rates, export restraints, and auto prices in the 1980s,” Monthly Labor Review (February 2007), https://www.bls.gov/opub/mlr/2007/02/art3full.pdf.
[13]. Eden and Molot, “Made in America? The US Auto Industry, 1955–1995,” 521; Robert Feenstra, “Voluntary Export Restraints in U.S. Autos, 1980–81: Quality, Employment, and Welfare Effects,” in Richard Baldwin (Eds.), The Structure and Evolution of Recent U.S. Trade Policy (Chicago, Illinois: The University of Chicago Press, 1984).
[14]. Stephen D. Cohen, “The Route to Japan’s Voluntary Export Restraint on Automobiles: An Analysis of the U.S. Government’s Decision-making Process in 1981” (Working Paper No. 20, School of International Service, American University), https://nsarchive2.gwu.edu/japan/scohenwp.htm.
[15]. Ibid.
[16]. Ibid.; Testimony of Robert W. Crandall, “The Legacy of the Japanese Voluntary Export Restraints,” Hearing of the Subcommittee on Trade, Productivity, and Economic Growth of the Joint Economic Committee, June 24, 1985 (Washington: U.S. Government Printing Office): 50, 59-60.
[17]. Robert W. Crandall, “Import Quotas and the Automobile Industry: The Costs of Protectionism,” The Brookings Review (Summer 1984): 16.
[18]. Cohen, “The Route to Japan’s Voluntary Export Restraint on Automobiles: An Analysis of the U.S. Government’s Decision-making Process in 1981.”
[19]. Ibid. Citing testimony of Maryann Keller, in “The Legacy of the Japanese Voluntary Export Restraints,” 66.
[20]. Eden and Molot, “Made in America? The US Auto Industry, 1955–1995,” 523.
[21]. David Wong, “The U.S Auto Industry in the 1990s” (Federal Reserve Bank of Philadelphia, July/August 1990), https://www.philadelphiafed.org/-/media/frbp/assets/economy/articles/business-review/1990/brja90dw.pdf.
[22]. Eden and Molot, “Made in America? The US Auto Industry, 1955–1995,” 512.
[23]. Wong, “The U.S Auto Industry in the 1990s.”
[24]. Scott Miller, “CSIS: Why Japanese-nameplate Automakers Became American Manufacturers” (Center for Strategic and International Studies, October 4, 2017), https://www.jama.org/csis-japanese-nameplate-automakers-became-american-manufacturers/.
[25]. Eden and Molot, “Made in America? The US Auto Industry, 1955–1995,” 516.
[26]. Lewis Mumford, Myth of the Machine (New York: Harcourt Brace Jovanovich, 1967).
[27]. Helper and Henderson, “Management Practices, Relational Contracts, and the Decline of General Motors,” Journal of Economic Perspectives Vol. 28, Issue 1 (Winter 2014): 63, https://www.aeaweb.org/articles?id=10.1257/jep.28.1.49.
[28]. Ibid.
[29]. Alfred Sloan, My Years at General Motors (New York, NY: Crown Books, 1963): 69.
[30]. Susan R. Helper, “Strategy and Irreversibility in Supplier Relations: The Case of the U.S. Automobile Industry,” Business History Review Vol. 65, Issue 4 (1991): 633–40.
[31]. Helper and Henderson, “Management Practices, Relational Contracts, and the Decline of General Motors,” 63.
[32]. Rosabeth Moss Kanter, The Change Masters: Innovation & Entrepreneurship in the American Corporation (New York, NY: Simon & Schuster, 1983): 347.
[33]. Ibid.
[34]. Ibid.
[35]. Ibid., 351.
[36]. Maryann Keller, Rude Awakening: The Rise, Fall, and Struggle for Recovery of General Motors (New York: Harper Perennial, 1989.); Helper and Henderson, “Management Practices, Relational Contracts, and the Decline of General Motors,” 53.
[37]. Eden and Molot, “Made in America? The US Auto Industry, 1955–1995,” 513.
[38]. James Womack and Daniel Jones, “The Fourth Transformation in Autos” Technological Review Vol. 87 (1984): 28–37.
[39]. Federal Reserve Bank of St. Louis (Table Data - Motor vehicle output: Final sales of domestic products: Exports), accessed February 10, 2026, https://fred.stlouisfed.org/data/AB69RC1A027NBEA; Federal Reserve Bank of St. Louis (Consumer Price Index for All Consumer: All Items in U.S. City Average), accessed February 10, 2026, https://fred.stlouisfed.org/series/CPIAUCSL#; Federal Reserve Bank of St. Louis (Motor vehicle output), accessed February 10, 2026, https://fred.stlouisfed.org/series/A953RC1Q027SBEA.
[40]. Corporate Finance Institute, “Product Life Cycle,” https://corporatefinanceinstitute.com/resources/management/product-life-cycle/.
[41]. Joshua Murray and Michael Schwartz, Wrecked: How the American Automobile Industry Destroyed Its Capacity to Compete (New York, New York: Russel Sage, 1991): 4.
[42]. Ibid.
[43]. William J. Abernathy, Kim B. Clark, and Alan M. Kantrow, Industrial Renaissance: Producing a Competitive Future for America (New York: Basic Books, 1983).
[44]. Murray and Scwhartz, Wrecked, 4.
[45]. Andy Grove, “How America Can Create Jobs,” BusinessWeek, July 1, 2010, http://www.businessweek.com/magazine/content/10_28/b4186048358596.htm.
[46]. Robert D. Atkinson and Stephen Ezell, Innovation Economics: The Race for Global Advantage (New Haven, Connecticut: Yale University Press, 2012).
[47]. Murray and Scwhartz, Wrecked, 4.
[48]. Ibid., 14.
[49]. Vanderbilt University, “Decline of U.S. auto industry linked to midcentury shift in production models,” July 18, 2019, https://news.vanderbilt.edu/2019/07/18/decline-of-u-s-auto-industry-linked-to-midcentury-shift-in-production-models/.
[50]. Ibid.
[51]. Ibid.
[52]. Murray and Scwhartz, Wrecked, 9.
[53]. Ibid., 9–10.
[54]. Ibid, 155.
[55]. Ibid.
[56]. Ibid., 156.
[57]. Ibid.
[58]. Ibid., 169–170.
[59]. Ibid., 170.
[60]. Ibid.
[61]. Abernathy, Clark, and Kantrow, Industrial Renaissance: Producing a Competitive Future for America.
[62]. Thomas O’ Donnell and Jill Andresky, “Are GM’s troubles deeper than they look,” Forbes, September 27, 1982.
[63]. Murray and Scwhartz, Wrecked, 171.
[64]. Ibid.
[65]. Ibid.
[66]. Beverly Silver, Forces of Labor Workers: Workers’ Movement and Globalization Since 1870 (Boston: Cambridge University Press, 2003); Ibid., 172.
[67]. Murray and Scwhartz, Wrecked, 204.
[68] . Gary Herrigel, “Book Review: Wrecked: How the American Automobile Industry Destroyed Its Capacity to Compete,” American Journal of Sociology Vol. 126, No. 2 (September 2020), https://www.journals.uchicago.edu/doi/abs/10.1086/710117.
[69]. Martin Neil Baily et al., “Increasing Global Competition and Labor Productivity: Lessons From the US Automotive Industry” (McKinsey Global Institute, November 1, 2005), 12, https://www.mckinsey.com/industries/automotive-and-assembly/our-insights/increasing-global-competition-and-labor-productivity.
[70]. Eden and Molot, “Made in America? The US Auto Industry, 1955–1995,” 513.
[71]. Ibid.
[72]. Baily et al., "Increasing Global Competition and Labor Productivity: Lessons From the US Automotive Industry,” 12.
[73]. Ibid.
[74]. Helper and Henderson, “Management Practices, Relational Contracts, and the Decline of General Motors,” 55.
[75]. Baily et al., "Increasing Global Competition and Labor Productivity,” 13.
[76]. Marvin B. Lieberman and Shigeru Asaba, “Inventory Reduction and Productivity Growth: A Comparison of Japanese and US Automotive Sectors,” Managerial and Decision Economics Vol. 18 (1997): 73–85, https://onlinelibrary.wiley.com/doi/abs/10.1002/%28SICI%291099-1468%28199703%2918%3A2%3C73%3A%3AAID-MDE811%3E3.0.CO%3B2-H.
[77]. Ibid., 80.
[78]. “Reflections on the Fabric of the Toyota Production System,” The Deming Institute, September 23, 2019, https://deming.org/reflections-on-the-fabric-of-the-toyota-production-system/.
[79] Helper and Henderson, “Management Practices, Relational Contracts, and the Decline of General Motors.” “Kaizen” is a Japanese philosophy focused on continuous, incremental improvement in business processes, productivity, and, when applied to the workplace, involving all employees from assembly line workers to executives.
[80]. Ibid., 55.
[81]. Ibid., 61.
[82]. “GM-UAW Back at Bargaining Table; Auto Stocks Rise,” USA Today, September 17, 2027, http://usatoday30.usatoday.com/money/autos/2007-09-17-gm-uaw_N.htm?csp=34.
[83]. David Welch and Dan Beucke, “Why GM’s Plan Won’t Work,” Business Week, May 8, 2005, http://www.businessweek.com/stories/2005 -05-08/why-gms-plan-wont-work.
[84]. The Conference Board, (International Labor Comparisons; accessed January 30, 2026), https://www.conference-board.org/ilcprogram/; The World Bank, (PPP conversion factor, GDP (LCU per international $)), accessed February 11, 2026, https://data.worldbank.org/indicator/PA.NUS.PPP.
[85]. Helper and Henderson, “Management Practices, Relational Contracts, and the Decline of General Motors,” 52.
[86]. Ibid.; Kim Clark and Takahiro Fujimoto, Product Development Performance: Strategy, Organization, and Management in the World Auto Industry (Boston, Massachusetts: Harvard Business School Press, 1991).
[87]. James P. Womack, James, Daniel T. Jones, and Daniel Roos, The Machine that Changed the World (New York, NY: The Free Press, 1990).
[88]. Ibid.
[89]. Helper and Henderson, “Management Practices, Relational Contracts, and the Decline of General Motors,” 54.
[90]. Ibid., 54–55; This American Life, “NUMMI,” National Public Radio Episode 403, March 26, 2010, http://www.thisamericanlife.org/radio-archives/episode/403/nummi.
[91]. Ibid., 56.
[92]. Ibid., 56; Paul S. Adler, Paul and Bryan Borys, “Two Types of Bureaucracy: Enabling and Coercive” Administrative Science Quarterly Vol. 41, Issue 1 (1992): 61–89; Womack, Jones, and Roos, The Machine that Changed the World.
[93]. Helper and Henderson, “Management Practices, Relational Contracts, and the Decline of General Motors,” 56.
[94]. Ibid.
[95]. Ibid.
[96]. Joel Cutcher-Gershenfeld, Dan Brooks, and Martin Mulloy, “The Decline and Resurgence of the U.S. Auto Industry” (Economic Policy Institute, May 6, 2015), 7, https://files.epi.org/2015/the-decline-and-resurgence-of-the-us-auto-industry.pdf.
[97]. This American Life, “NUMMI.”
[98]. Helper and Henderson, “Management Practices, Relational Contracts, and the Decline of General Motors,” 64.
[99]. Ibid., 65.
[100]. Ibid., 57.
[101]. Cutcher-Gershenfeld, Brooks, and Mulloy, “The Decline and Resurgence of the U.S. Auto Industry,” 21.
[102]. John Paul MacDuffie and Susan Helper, “Creating Lean Suppliers: The Honda Way,” California Management Review Vol. 39, Issue 4 (1997): 118–51.
[103]. Clark and Fujimoto, “Product Development Performance”; Helper and Henderson, “Management Practices, Relational Contracts, and the Decline of General Motors,” 52.
[104]. Michael A. Cusumano and Akira Takeishi, “Supplier Relations and Management: A Survey of Japanese, Japanese-transplant, and U.S. Auto Plants,” Strategic Management Journal Vol. 12, Issue 8 (1991): 563–88.
[105]. Jeffrey H. Dyer and Nile W. Hatch, “Relation-specific Capabilities and Barriers to Knowledge Transfers: Creating Advantage through Network Relationships,” Strategic Management Journal Vol 27, Issue 8 (2006): 701–19.
[106]. Sree Ramaswamy et al., “Making It In America: Revitalizing U.S. Manufacturing” (McKinsey & Company, November 2017), 56, https://www.mckinsey.com/~/media/McKinsey/Global%20Themes/Americas/Making%20it%20in%20America%20Revitalizing%20US%20manufacturing/Making-it-in-America-Revitalizing-US-manufacturing-Full-report.ashx.
[107]. Liberman and Asaba, “Inventory Reduction and Productivity Growth: A Comparison of Japanese and US Automotive Sectors,” 83.
[108]. Helper and Henderson, “Management Practices, Relational Contracts, and the Decline of General Motors,” 53.
[109]. Womack, Jones, and Roos, The Machine that Changed the World.
[110]. Helper and Henderson, “Management Practices, Relational Contracts, and the Decline of General Motors,” 53; Saul A. Rubenstein and Thomas A. Kochan, Learning from Saturn (Ithaca, NY: Cornell University Press, 2001).
[111]. Murray and Scwhartz, Wrecked, 196.
[112]. Alex Taylor, Sixty to Zero: An Inside Look at the Collapse of General Motors—and the Detroit Auto Industry (New Haven, Connecticut: Yale University Press, 2010).
[113]. Murray and Scwhartz, Wrecked, 196.
[114]. Tim Keenan, David Smith, and Jon Lowell, “The story behind GM’s costly J-car launch,” Wards Auto, April 1, 1995, https://www.wardsauto.com/news/archive-wards-the-story-behind-gm-s-costly-j-car-launch/761824/.
[115]. Helper and Henderson, “Management Practices, Relational Contracts, and the Decline of General Motors,” 67.
[116]. Ibid.
[117]. Ibid., 51.
[118]. Oak Ridge National Laboratory (ORNL), “Transportation Energy Databook” (ORNL, October 2006), https://tedb.ornl.gov/.
[119]. James Risen, “COLUMN ONE : Why Can’t America Catch Up? : Despite a decade of effort by U.S. firms, the Japanese are still building better cars. Now, new thinking in Tokyo threatens to make the gap even wider,” Los Angeles Times, January 14, 1990, https://www.latimes.com/archives/la-xpm-1990-01-14-mn-277-story.html.
[120]. Ibid.
[121]. Ibid.
[122]. Stephen Ezell and Meghan Ostertag, “Assessing the Evolving Global Competitiveness of the US Auto Industry,” 21–23.
[123]. Cutcher-Gershenfeld, Brooks, and Mulloy, “The Decline and Resurgence of the U.S. Auto Industry,” 3.
[124]. Ibid.
[125]. Austan D. Goolsbee and Alan B. Krueger, “A Retrospective Look at Rescuing and Restructuring General Motors and Chrysler” (Princeton University Industrial Relations Section, Working Paper #558, 2015), http://arks.princeton.edu/ark:/88435/dsp01sj139419w.
[126]. Rodrigo Balbontin and Stephen Ezell, “Comments to USTR Regarding the Trade Agreement Between the United States, Mexico, and Canada” (ITIF, November 2025), https://itif.org/publications/2025/11/03/comments-to-ustr-regarding-the-usmca-trade-agreement/.
[127]. Nigel Cory, “Comments to USTR Regarding the Work of the North American Competitiveness Committee” (ITIF, July 2023), https://itif.org/publications/2023/07/18/comments-to-the-ustr-regarding-work-of-north-american-competitiveness-committee/.
[128]. U.S. International Trade Administration, “Mexico Country Commercial Guide,” https://www.trade.gov/country-commercial-guides/mexico-automotive-industry.
[129]. Jerry Haar and Eric Porras, “Rewiring the Road Ahead: How Mexico Continues to Shape North America’s Automotive Future” (Georgetown University, Baratta Center for Global Business Education), https://globalbusiness.georgetown.edu/researchandinsights/global-perspectives-blog/rewiring-the-road-ahead-how-mexico-continues-to-shape-north-americas-automotive-future/. Key global brands including Audi, BMW, Ford, General Motors, Honda, Kia, Mazda, Nissan, Stellantis, Toyota, and Volkswagen maintain significant production operations across 14 Mexican states.
[130]. “No one gains from American tariffs on cars from Mexico or Canada,” The Economist, June 30, 2025, https://www.economist.com/business/2025/01/30/no-one-gains-from-american-tariffs-on-cars-from-mexico-and-canada.
[131]. Ibid.; Pallavi Rao, “Visualized: Where Automakers Build Cars Sold in America,” Visual Capitalist, March 26, 2025, https://www.visualcapitalist.com/visualized-where-automakers-build-cars-sold-in-america/.
[132]. Julieta Contreras, “Restricting imports of Mexican vehicles will harm US manufacturers” (Peterson Institute for International Economics, December 2024), https://www.piie.com/blogs/realtime-economics/2024/restricting-imports-mexican-vehicles-will-harm-us-manufacturers.
[133]. Jim Schmidt et al., “Why Automakers Need to Focus on Labor Cost Per Vehicle,” Oliver Wyman, https://www.oliverwyman.com/our-expertise/insights/2025/apr/why-automakers-must-focus-on-labor-cost-per-vehicle.html.
[134]. The International Monetary Fund (IMF), (Implied PPP conversion rate, national currency per international dollar), accessed March 26, 2026, https://www.imf.org/external/datamapper/PPPEX@WEO/OEMDC; OECD, (STAN Database for structural analysis, 2025 edition), accessed March 26, 2026, https://data-explorer.oecd.org/vis?tm=wages%20by%20industry&pg=0&snb=31&vw=tb&df[ds]=dsDisseminateFinalDMZ&df[id]=DSD_STAN%40DF_STAN_2025&df[ag]=OECD.STI.PIE&df[vs]=1.0&dq=A.MEX%2BUSA.C%2BC29.D11..&pd=2000%2C&to[TIME_PERIOD]=false.
[135]. Cesaire Chiatchoua, “Analysis of the evolution of wages since USMCA in the Mexican automotive industry,” Ciencia Latina Revista Científica Multidisciplinar Vol. 7, Issue 3 (July 2023): 9720, https://www.researchgate.net/publication/372541300_Analysis_of_the_evolution_of_wages_since_USMCA_in_the_Mexican_automotive_industry.
[136]. Jackie Charniga, “Canada, Mexico integral to US auto manufacturing for a century,” Detroit Free Press, February 4, 2025, https://www.freep.com/story/money/cars/2025/02/04/canada-mexico-us-auto-manufacturing-history-ford-gm-chrysler/78182033007/.
[137]. IMF, “Implied PPP conversion rate, national currency per international dollar.”
[138]. Oliver Wyman, “New Analysis Examines Labor Cost Per Vehicle Amidst Changing Automotive Landscape” (Motor, May 9, 2025), https://www.motor.com/2025/05/new-analysis-examines-labor-cost-per-vehicle-amidst-changing-automotive-landscape/.
[139]. Chiatchoua, “Analysis of the evolution of wages since USMCA in the Mexican automotive industry.”
[140]. Dennis W. Jansen, Liqun Liu, and Andrew J. Rettenmaier, “NAFTA to USMCA” (Texas A&M University Private Enterprise Research Center, January 30, 2020), https://perc.tamu.edu/blog/2020/01/nafta-to-usmca.html.
[141]. Wyman, “New Analysis Examines Labor Cost Per Vehicle Amidst Changing Automotive Landscape.”
[142]. Federal Reserve Bank of St. Louis (Mexican Pesos to One U.S. Dollar, not seasonally adjusted, quarterly average), accessed March 29, 2026, https://fred.stlouisfed.org/series/DEXMXUS#.
[143]. Xinhua, “China’s Auto Output, Sales Reach New Highs in 2025, Building Global Win-Win Ecosystem,” The State Council Information Office The Peoples Republic of China, January 15, 2026, http://english.scio.gov.cn/in-depth/2026-01/15/content_118280571.html.
[144]. Organization for Economic Cooperation and Development (OECD), “Trade in Value Added (TiVA) 2025 Edition,” accessed February 4, 2026; Stephen Ezell, “How Innovative Is China in the Electric Vehicle and Battery Industries?” (ITIF, July 29, 2024), https://itif.org/publications/2024/07/29/how-innovative-is-china-in-the-electric-vehicle-and-battery-industries/.
[145]. Alliance for Automotive Innovation (AAI),“Data Driven: Navigating the Road Ahead” (AAI, 2024), 21, https://www.autosinnovate.org/posts/papers-reports/Alliance%20for%20Automotive%20Innovation%20-%20DATA%20DRIVEN%20Report%20(January%202025).pdf.
[146]. David Coffin, “National Automotive Competitiveness” (U.S. International Trade Commission, Office of Industry and Competitiveness Analysis, January 2024), 3, https://www.usitc.gov/publications/332/working_papers/national_automotive_competitiveness.pdf. For China, 51 percent is by wholly Chinese companies and 46 percent by joint ventures between Chinese and non-Chinese companies. Wards Intelligence, “Germany Vehicle Production, 1970-2022,” April 17, 2023; Wards Intelligence, “Asia Vehicle Production by Country and Manufacturer, 2022,” April 17, 2023; Wards Intelligence, “Asia Vehicle Production by Country and Manufacturer, 2022,” April 17, 2023.
[147]. AAI, “Data Driven: Navigating the Road Ahead,” 21.
[148]. Ezell, “How Innovative Is China in the Electric Vehicle and Battery Industries?”
[149]. Tim Levin, “Chinese Brands Will Sell A Third Of The World’s Cars By 2030: Study,” Inside EVs, June 30, 2024, https://insideevs.com/news/724950/chinese-ev-brands-global-sales/.
[150]. “Jam-packed: Chinese EV-makers are leaving Western rivals in the dust,” The Economist, May 4, 2024, https://www.economist.com/business/2024/05/01/chinese-ev-makers-shine-at-beijings-car-jamboree.
[151]. Shannon Osaka and Naema Ahmed, “How the U.S. lost its lead in electric vehicles and other clean energy inventions,” The Washington Post, July 31, 2025, https://www.washingtonpost.com/climate-environment/2025/07/31/china-clean-energy-united-states-inventions/.
[152]. Ibid.
[153]. Gabrielle Coppola, “America’s Long, Tortured Journey to Build EV Batteries,” Bloomberg, June 8, 2023, https://www.bloomberg.com/news/features/2023-06-08/a-us-startup-s-failure-paved-the-way-for-china-s-ev-battery-dominance.
[154]. “China’s Wanxiang Wins A123 Auction for $260 Million,” Bloomberg, December 10, 2012, https://www.bloomberg.com/news/articles/2012-12-10/china-s-wanxiang-wins-a123-auction-for-260-million.
[155]. Casey Crownhart, “Meet the new batteries unlocking cheaper electric vehicles,” MIT Technology Review, February 17, 2023, https://www.bloomberg.com/news/articles/2023-06-05/china-s-ev-battery-sector-is-preparing-another-technology-breakthrough.
[156]. Zeyi Yang, “How EV Batteries Are Becoming the Next Source of Tension for China and the U.S.,” MIT Technology Review, February 22, 2023, https://www.technologyreview.com/2023/02/22/1069032/ev-batteries-politicization-china-us/.
[157]. Casey Crownhart, “Meet the new batteries unlocking cheaper electric vehicles,” MIT Technology Review, February 17, 2023, https://www.bloomberg.com/news/articles/2023-06-05/china-s-ev-battery-sector-is-preparing-another-technology-breakthrough.
[158]. Yang, “How EV Batteries Are Becoming the Next Source of Tension for China and the U.S.”
[159]. Ibid.
[160]. Zeyi Yang, “Chinese EV Batteries Are Eating the World,” Wired, January 28, 2026, https://www.wired.com/story/chinese-ev-batteries/.
[161]. “Chinese EV battery maker CATL unveils LFP battery with 1,000 km range,” Reuters, April 25, 2024, https://www.reuters.com/business/autos-transportation/chinese-ev-battery-maker-catl-unveils-lfp-battery-with-1000-km-range-2024-04-25/.
[162]. Yasmeta Oon, “China creates groundbreaking electric car battery that fully charges in just 10 minutes,” MSN, May 20, 2024, https://www.msn.com/en-us/autos/news/china-creates-groundbreaking-electric-car-battery-that-fully-charges-in-just-10-minutes/ar-BB1mInh2.
[163]. Suvrat Kothari, “China Is Making 800-Mile EV Batteries. Here’s Why America Can’t Have Them,” InsideEVs, October 21, 2025, https://insideevs.com/news/776394/china-800-mile-solid-state-ev-battery/
[164]. Keith Bradsher, “China’s E.V. Threat: A Carmaker That Loses $35,000 a Car,” The New York Times, October 5, 2023, https://www.nytimes.com/2023/10/05/business/nio-china-electric-vehicles.html.
[165]. “Exclusive: Ford and Geely in talks for manufacturing, technology partnership, sources say,” Reuters, February 3, 2026, https://www.reuters.com/business/autos-transportation/ford-geely-talks-manufacturing-technology-partnership-sources-say-2026-02-04/.
[166]. Carlton Reid, “How China’s EV Boom Caught Western Companies Asleep at the Wheel,” Wired, October 14, 2023, https://www.wired.com/story/how-chinas-ev-boom-caught-western-car-companies-asleep-at-the-wheel/.
[167]. Sha Hua and Yoko Kubota, “A Chinese Phone Maker Did Something Apple Couldn’t: Make an EV,” The Wall Street Journal, May 22, 2024, https://www.wsj.com/business/autos/a-chinese-phone-maker-did-something-apple-couldnt-make-an-ev-3523186a.
[168]. Ibid.
[169]. Reid, “How China’s EV Boom Caught Western Companies Asleep at the Wheel.”
[170]. Selina Cheng and Yoko Kubota, “How China Is Churning Out EVs Faster Than Everyone Else,” The Wall Street Journal, March 4, 2024, https://www.wsj.com/business/autos/how-china-is-churning-out-evs-faster-than-everyone-else-df316c71.
[171]. Ibid.
[172]. Kimberly Borden and Sebastian Küchler, “Automotive product development: Accelerating to new horizons” (McKinsey & Company, August 2025), 2, https://www.mckinsey.com/capabilities/operations/our-insights/automotive-product-development-accelerating-to-new-horizons.
[173]. Ibid.
[174]. Ibid., 4.
[175]. Ibid.
[176]. The Green Living Guy, “Tesla Die-Casting Process Revolutionizes Underbody Production,” September 29, 2023, https://greenlivingguy.com/2023/09/tesla-die-casting-technology-reduces-model-y/.
[177]. Hua and Kubota, “A Chinese Phone Maker Did Something Apple Couldn’t: Make an EV.”
[178]. Ibid.
[179]. Bradsher, “China’s E.V. Threat: A Carmaker That Loses $35,000 a Car.”
[180]. International Federation of Robotics, “World Robotics 2025 - Industrial Robots Press Conference,” Youtube, October 2, 2025, https://www.youtube.com/watch?v=w1xGp-S3Mf4. (Note: Data for South Korea is from 2023.)
[181]. Ibid.
[182]. Robert D. Atkinson, “China using industrial robots at 12x US rate,” Asia Times, September 17, 2023, https://asiatimes.com/2023/09/china-using-industrial-robots-at-12x-us-rate/.
[183]. “The U.S. Automotive Industry At Risk” (Society of Automotive Engineers, October 2024), https://www.sae-detroit.org/wp-content/uploads/2024/12/24-GLC-White-Paper.pdf.
[184]. Keith Naughton, “GM Imports More Cars Into the US Than Any Other Automaker,” Bloomberg UK, May 8, 2025, https://www.bloomberg.com/news/newsletters/2025-05-08/supply-chain-latest-gm-imported-more-cars-into-us-than-any-other-automaker; “Auto Exporters of America in 2024: Who’s Leading the Industry?” Tendata, May 6, 2025, https://www.tendata.com/blogs/export/6688.html.
[185]. Ibid.
[186]. Compiled by authors from companies’ FY 2024 annual reports.
[187]. Compiled by authors from companies’ FY 2025 annual reports.
[188]. Ibid.
