
Comments to USTR Regarding the Work of the North American Competitiveness Committee
The Case for a North American Production System.. 2
Global Trade Interdependence: U.S. Trade Linkages with Canada and Mexico. 6
Trade Linkages Between the United States and Mexico. 6
Updated Analysis: Trade in Intermediate Inputs by Industry. 10
The Hamilton Index: Assessing National Performance in the Competition for Advanced Industries. 15
Country-By-Country and North American Performance. 18
The North American Trading Bloc: A Work in Progress for Advanced-Industry Production. 24
Cross-National Innovation Clusters. 33
Mexico’s Innovation Capital 36
Support United States “Plus” Canada and Mexico as Opposed to a U.S.-Only Strategy. 38
Improve Information Sharing, Coordination, and Alignment of Defensive Measures. 40
Develop North American Trade and Competitiveness Metrics and Competitiveness Consultive Measures 40
Develop a North American Manufacturing Digitalization Strategy and Ecosystem.. 41
Expand Collaborative Research Between Leading U.S. and Canadian Centers of Innovation. 42
Introduction
With a population of 500 million, North America—Canada, Mexico, and the United States—represents one of the world’s most economically vibrant regions, accounting for 28 percent of global economic output.[1] The region also forms one of the world’s largest free trade zones, with deeply integrated supply chains and complementary raw material resources. Beyond that, the three nations form a high-wage/low-wage partnership, bringing complementary labor forces, infrastructure, innovation capacities, and industry strengths together to create a highly competitive economic region. This relationship is poised to make North American manufacturing value chains globally cost competitive with Asian (or European) ones and thus help create a “North American Production System.”
The geopolitical and economic context lends itself to the three countries working to support a North American Production System, one that leverages and deepens already robust and productive industrial value chains, is anchored by the U.S.-Mexico-Canada (dUSMCA) free trade agreement (and the North American Free Trade Agreement (NAFTA) before it), and responds to the growing national and economic security concerns regarding China-based production and supply networks. However, to seize this opportunity in North America and build on what has already developed under NAFTA/USMCA, the three respective governments need to coordinate and enact an ambitious and coordinated series of trade, technology, and innovation policies, while rolling back existing protectionist policies that impede deeper North American integration.
This submission provides extensive data and analysis of current North American production dynamics (including analysis of advanced technology sectors in each country, as well as trade analysis on a value-added basis) as well as recommendations for how to create an ever-more richly connected North American Production System.
The Case for a North American Production System
Canada, Mexico, and the United States should make the development of a competitive North American Production System a central goal. The USMCA’s North American Competitiveness Committee should examine and recommend ways for how the three countries can work together to improve their individual, but more importantly, collective competitiveness. As the Information Technology and Innovation Foundation (ITIF) defines it, competitiveness represents “the ability of a nation’s non-mineral-based traded sectors to effectively compete in global markets in the absence of subsidies and government protections, while receiving a strong price premium that enables strong terms of trade.”[2]
The global economy has become increasingly interlinked, as nations—and enterprises therein—specialize in productive activities wherein they enjoy the greatest levels of comparative advantage. This phenomenon has become especially pronounced in the globalization of value chains for sectors such as information, computing and electronics, aerospace, machinery and equipment, and automotives, with Asia becoming a central player in many of these supply chains, especially for information and communications technology (ICT) products. This internationalization of supply chains means that the success of original equipment manufacturers (OEMs) depends greatly on the health and vitality of suppliers in other nations and their ability to pursue globalized trade. At the moment, Mexico’s comparative advantage (in the main) lies in the lower-cost production of goods (although such goods aren’t necessarily low value, as Mexico’s competitiveness in the automotive value chain shows). Canada complements the United States’ lead role in knowledge-intensive and value-added manufacturing. However, looking ahead, Canada can specialize in the mining and processing of the critical minerals needed in many advanced technologies, such as electric vehicles. Canada also brings distinct strengths in the aerospace, quantum, and ICT services sectors, and Mexico too certainly has its leaders in sectors such as ICT manufacturing and services and automotive suppliers.
The three neighbors need to support a North American production system as the investment, research and development (R&D), and trade that happens in each of these countries is more likely to benefit others in North America more than production networks based in Asia. However, for this to happen, especially in manufactured and advanced technology products, the United States needs to stop including Mexico and Canada in discriminatory domestic requirements (like with steel tariffs and Buy American provisions). The United States also needs to stop reflectively opposing U.S. firms that move or increase production in Mexico. That’s because production in Mexico in fundamentally different to that in China. For example, 40 percent of the inputs to finished manufactured goods in Mexico come from the United States.[3] By contrast, for China, that figure is a mere 4 percent. In essence, unlike trade with Mexico (and Canada), when production goes to China, the United States loses out on much more of the production process and interlinkages, not to mention, enabling a global adversary.
The United States needs to recognize that its USMCA partners deserve special attention in economic and trade policy in terms of ensuring they are not impacted by discriminatory domestic measures. Given their critical role in supporting North American production networks, it was clearly an own-goal for the Trump administration to enact a 10 percent tariff on aluminum and a 25 percent tariff on steel from Canada due to baseless national security concerns. The same applies for the Trump administration’s threatened (but not enacted) tariffs against Mexico unless it took action on immigration issues. The same applies to the Biden administration’s Buy American Act that requires that 75 percent (up from the 55 percent today) of the cost of products procured by the U.S. government be made up of domestic components by 2029. Regardless of whether it comes to defense products, critical minerals, steel, semiconductors, or automobiles, Canada and Mexico and their respective firms and products deserve to be treated the same as American ones given both USMCA and these countries’ role in supporting U.S. economic competitiveness. The United States needs to ensure that efforts to target Chinese innovation mercantilism and national and economic security threats are appropriately targeted and don’t indiscriminately sweep Canada and Mexico up in their impact.
Some trade opponents will complain that a North American Production System will lead to a “giant sucking sound” south to Mexico due to NAFTA, as U.S. presidential candidate Ross Perot famously claimed. That may have been true in 1992, but the great sucking sound since then has not been to the south, but to the east—namely, China. U.S. and Canadian companies now have access to low-wage production sites around the world. The differential economic impact of production networks in East Asia vs. North America are now clear. As the data in this submission shows, supporting a North American Production System is likely to lead to more, not less, manufacturing in North America. In this case, the greater division of labor in a North American (NA) system will be clearly beneficial for all three nations, even if it leads to some production relocations.
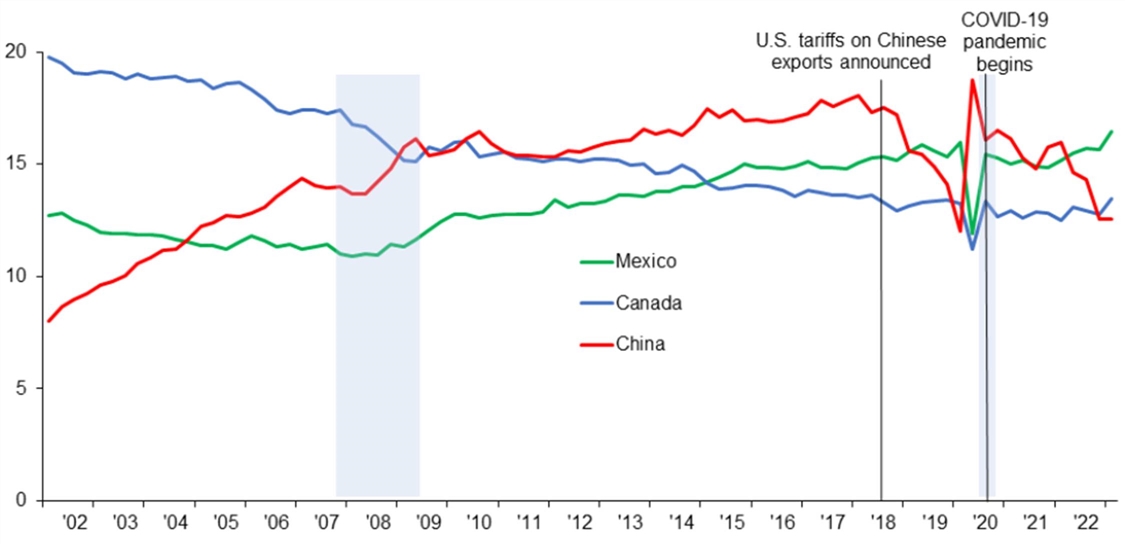
Mexico became the top U.S. trading partner at the beginning of 2023, with total bilateral trade between the two countries totaling $263 billion during the first four months of this year. During this time, total trade in manufactured goods between Mexico and the U.S. reached $234.2 billion. (See Figure 1.)[4] This is an unalloyed good thing as the data shows that when imports from Mexico increase, so do U.S. exports as well. Since the start of the COVID-19 pandemic in early 2020 through to June 2023, American imports of Mexican manufactured goods grew from $320 billion to $402 billion, an increase of 26 percent.[5] This growth in trade with Mexico inevitably also benefits the United States (and Canada). Also, a more prominent North American production system also makes sense given growing concerns regarding supply chains and national security. North American supply chains are inherently more stable than cross-ocean ones, especially when production occurs in China. Given these synergies, both reshoring (the moving of jobs and production back to the United States) and nearshoring (the moving of jobs and production back to neighboring countries) are important to U.S. and North American competitiveness.
Figure 1: Share of total U.S. trade (percent)[6]
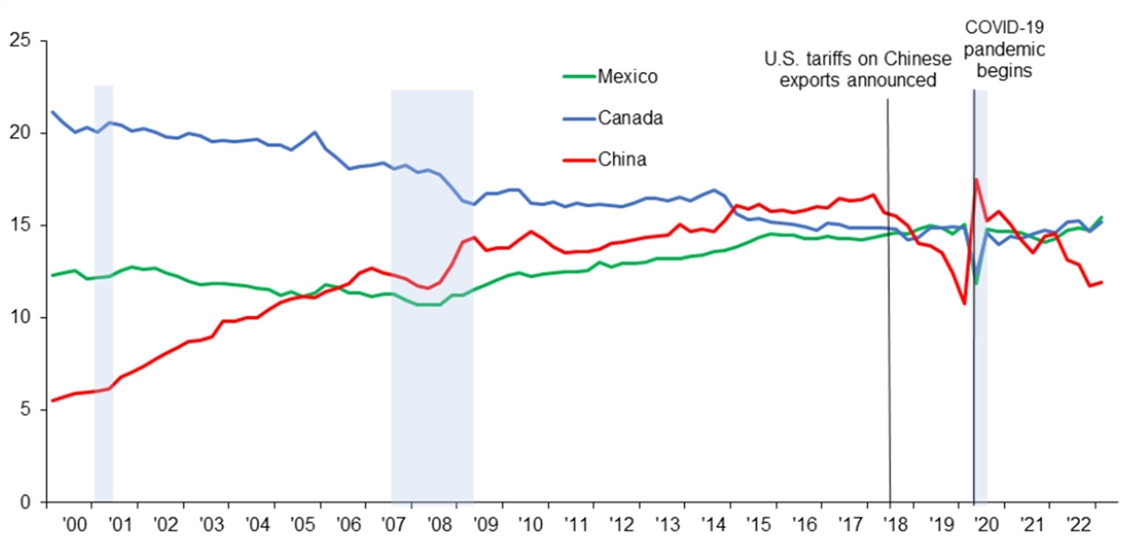
The Biden administration’s focus on encouraging U.S. firms and production networks (especially in manufacturing) to shift out of China due to national security and other concerns make Mexico its most logical sourcing alternative to China. And a shift is indeed underway. Starting in 2021, Mexico and Canada overtook China in terms of their respective shares of total U.S. manufacturing trade. (See Figure 2). Moreover, a recent study—“Is US Trade Policy Reshaping Global Supply Chains?”—showed that Trump administration tariffs led to significant decoupling between the United States and China, and that while U.S.-China trade remained significant, Canada and Mexico were among the largest beneficiaries of shifting supply and production networks. The study examined the reshaping of supply chains using detailed U.S. 10-digit import data (tariff-line level) between 2017 and 2022.[7] It showed that Trump administration tariffs on China led to a decline in imports from China, but that U.S. import diversification of tariffed goods, or goods with declining import shares from China, did not increase markedly. In terms of the reshuffling of the U.S.’s top trade partners, China’s share fell 5.3 percentage points (ppts), but for strategic goods (e.g., chemicals, vehicles, pharmaceuticals, and electrical machinery), the decrease was massive, from 36.8 percent in 2017 to 23.1 percent in 2022. The countries with the biggest gains in market share included USMCA partners, with Canada’s share growing 0.75 ppts and Mexico’s by 0.64 ppts, alongside gains in Vietnam (1.9 ppt), Taiwan (1 ppt), India (0.54 ppt), and Korea (0.53 ppt).[8]
Figure 2: Share of total U.S. manufacturing trade (percent)[9]
The nearshoring of production from China (and elsewhere) to Mexico and Canada will take time given the significant amounts of capital invested in existing networks and due to the long-standing and complex supply relationships that go along with these. Anecdotal media reports and trade data are encouraging and suggest that the nearshoring move to Canada and Mexico is happening (to some extent). A 2023 Kearney consulting firm survey of manufacturing executives and CEOs found that more than 80 percent of firms across almost all industries are now on a path to reshore at least part of their manufacturing operations in the next three years.[10] A September 2022 Banco de México survey showed that 16 percent of respondent firms indicated they had benefited from nearshoring trends in the prior 12 months.[11] A December 2022 Citibanamex analysis of Mexican industrial properties cited nearshoring as contributing to low industrial vacancy rates of around 5 percent nationally and to near zero along the border in Tijuana. In particular, early data and stories point toward the trend that much of the new made-in-Mexico goods traded with the United States come from American and European firms looking to add new capacity in Mexico. For example, Tupperware, Hasbro, Tesla, and Mattell have all announced plans to increase production in Mexico.
Nearshoring to Mexico should be reflected in foreign direct investment (FDI) data; however, FDI in Mexico was largely flat from 2015 to 2022. Furthermore, while the U.S. share of FDI in Mexico is little changed, China’s share—though still very small—is rising quickly. This could be because the impact on FDI is lagged and may well show up in future data releases. It could also be due to the uncertainty given the USMCA’s pandemic-era launch and changes in Mexican government policies.[12]
The increase in tariffs and other restrictions in the U.S.-China trade relationship during the Trump administration contributed to a renewed interest in nearshoring, and some early anecdotal stories and data reflect this. The COVID-19 supply chain disruptions engendered a second wave of renewed interest in nearshoring. Ongoing Biden administration efforts to target certain advanced industry investments and technologies in China means firms continue to look for how best to diversify their production networks to places like Canada, Mexico, and the United States. While the aggregate data shows that U.S. trade is dynamic (in terms of where it shifts to), it also shows that trade patterns with China remain resilient, which is not surprising given the time, capital, and effort it takes to shift established supply and production networks.
Nevertheless, the value of past North American cooperation is clear in the trade and investment data. For example, tariff reductions alone under NAFTA caused the volume of intra-North American trade to increase by 41 percent for the United States, 11 percent for Canada, and more than 118 percent for Mexico.[13] The challenge for Canada, Mexico, and the United States is to enact the coordinated and complementary policies that can result in a similar jump in trade, investment, and innovation that together creates a more competitive and innovative North American Production System.
The submission proceeds as follows. Firstly, the submission provides detailed analysis of inter- and intra-industry trade between the United States and Mexico across six key industrial sectors. Secondly, the submission examines national changes (between 1995, 2006, and 2018) in global shares of output in seven industry sectors as part of the Hamilton Index of Advanced-Technology Performance for the United States, Canada, and Mexico, along with Germany, the EU-28 (minus Germany), China, India, Japan, Korea, and Taiwan. Thirdly, the North American Sub-National Innovation Competitiveness Index (which covers the 92 states and provinces of Canada, Mexico, and the United States) highlights economic differences among states and provinces, identifies regions needing more federal attention, contextualizes cross-national innovation performance, and tracks the continent’s overall competitiveness in the innovation-driven global economy. Finally, the submission provides a range of recommendations to further shape a more robust North American Production System.
Global Trade Interdependence: U.S. Trade Linkages with Canada and Mexico
Trade Linkages Between the United States and Mexico
ITIF’s 2019 report “Global Trade Interdependence: U.S. Trade Linkages with Korea, Mexico, and Taiwan” provides detailed empirical analysis of U.S. trade linkages with Mexico. It did not cover Canada (which is separately analyzed below). Its analysis builds on the analysis above and remains relevant in understanding the nature of U.S.-Mexico trade and economic ties and points to the need for updated and further economic analysis, while also suggesting several important policy recommendations.
The report examined trade linkages between the United States and three key partner nations—Mexico, Korea, and Taiwan—analyzing the extent of inter- and intra-industry trade across six key sectors: automobiles, chemicals, computers and electronics, machinery, other transportation equipment (including aerospace), and pharmaceuticals. The report demonstrates both that U.S. industries in these sectors depend greatly on trade with suppliers in these partner nations and that these nations are key importers of U.S. goods in these industries. It also exemplifies a more nuanced analysis of trade balances.
At the global level, global value chains (GVCs) do not impact the basic methodology used to calculate a country’s trade balance: exports minus imports. But when factoring in GVCs at the bilateral level, this formula becomes tricky for estimating a country’s relative competitiveness with a trading partner. This stems from trade-accounting methodologies not being able to capture the realities of modern trade. In the past, most countries only traded in final products; therefore, when, for example, Country A exported $1,000 in products to Country B without importing anything in return, Country A had a $1,000 trade surplus with Country B. But the advent of GVCs means a significant share of global trade involves trade in inputs—countries adding a bit of value to a certain input, then exporting that input to another country for further refinement and increases to its value. To illustrate, from 2004 to 2014, trade in intermediate goods increased from one-quarter of global trade to two-fifths of global trade.[14] And, in reality, “about 70 percent” of international trade today involves global value chains, as services, raw materials, parts, and components cross borders—often numerous times.[15]
Turning back to our example, for the modern-day equivalent, that $1,000 in exports to Country B may not in fact be entirely produced in Country A. Country A could be using $500 in inputs from Country C and $300 in inputs from Country D, and generating only $200 of that final $1,000 value exported to Country B. Country A’s “true” trade surplus with Country B should therefore be $200. But instead, Country B would actually have “true” deficits of $500 with Country C and $300 with Country D. In reality, Country A’s “true” trade surplus with Country B would be much smaller than what standard trade surplus reporting would indicate, and Country A’s competitiveness relative to Country B would be overstated through standard means. But bear in mind that factoring in GVCs only readjusts a country’s bilateral trade balances to better account for the flow of inputs across multiple countries, and does nothing to affect a country’s overall trade balance with the world. This weakness in methodology has often been cited as one major factor why the U.S.-China trade deficit appears larger than it “truly” is.[16] Indeed, a significant portion of China’s exports to the United States consist of final products assembled from components imported from various other countries. Thus, within the bilateral trade balance equation, the overall value of its exports should not be directly attributed to China.
This method of analyzing bilateral trade deficits refers to the value-added (VA) trade balance. This method attempts to factor in GVCs by tracking how the bits of value added from one input to another flow from the source country all the way to their final destination, rather than just calculating trade flows as static border-to-border exchanges. In summary, for $1,000 in imports to Country B from Country A (using our above example), a value-added trade balance separates that value into $200 imported from Country A, $500 imported from Country C, and $300 imported from Country D.
However, value-added trade balances contain certain major assumptions and limitations about the way firms operate, because real VA trade data simply does not exist.[17] VA trade data is synthetic—assembled through merging global gross trade data with countries’ input-output tables and various statistical techniques. To date, only a handful of VA trade datasets exist: Notable ones include the OECD’s Trade in Value-Added (TIVA) accounts and the University of Groningen’s global input-output database. Although the methods to construct VA trade data differ from organization to organization, these assembled datasets tend to present similar findings.[18] But until countries start developing and implementing statistical methodologies that take into account the modern realities of GVCs in trade, these synthetic VA trade datasets will remain a key tool in revealing countries’ true trade balances with one another.
This section explores U.S. bilateral trade linkages with Mexico. Many firms in these countries manage key “specialized tasks” within broader U.S. enterprise-driven ICT and automotive GVCs. There is no one single metric that evaluates the bilateral trade linkages and bilateral competitive position of any two economies. Therefore, the following section will examine U.S. trade with Mexico through the following lenses (note that the reference years provided in these tables vary according to data availability, with the most recently available data being used wherever possible):
▪ Value-added trade balances
▪ Intra-industry trade in value added
▪ Composition of product trade in terms of capital, intermediate, or final goods
▪ Domestic value added as a share of countries’ gross exports and imports
▪ Industry-level trade in value added with each partner country across six industries: automobiles, chemicals, computers and electronics, machinery, other transportation equipment (including aerospace), and pharmaceuticals
▪ Domestic value added as a share of gross exports and imports, by industry
▪ Intermediate and final goods trade linkages among countries, by industry
The sections below includes some, but not all, of the data and analysis from these focal points.
Value-Added Trade Balance
The VA trade balance reflects the “real” trade balance the United States has with its bilateral trading partners. It is calculated as the value generated by the United States exported to another country that remains there, minus the “real” value generated by a foreign economy imported by the United States that remains here.
As table 1 shows, U.S. trade deficits in both gross terms and VA-trade terms widened from 2002 to 2014 with Mexico. The gross U.S. trade deficit increased with Mexico from $61.3 billion to $100.6 billion over this period. The VA data reveals the United States is slightly less competitive against Taiwan and Korea, but somewhat more competitive against Mexico, than gross trade figures would suggest.
Table 1 reflects the VA trade balance estimates in 2002 and 2014 for the three countries (2014 data has been used because it was the most recent year value-added trade data was available for all three countries). The table contains three main categories:
▪ Gross trade: The gross trade balance between the country pair. This is simply total exports minus total imports.
▪ VA-adjusted trade: This is the estimate of the “real” trade balance. This is defined as the value directly exported to the trading partner that remains abroad plus value indirectly exported to the trading partner through an intermediary country that remains there, minus value imported from the trading partner that remains here plus value indirectly imported from the trading partner through intermediary countries that remains here. “Real” trade balances are often different than they appear on a gross-value basis, inflating the size of some trading partners’ surpluses and deflating the size of others.
▪ Intra-industry trade (VA-adjusted): This is similar to the second category, but only counts intermediate goods trade from industry to industry (e.g., Taiwanese ICT firms purchasing components from U.S. ICT firms).
As table 1 shows, U.S. trade deficits in both gross terms and VA-trade terms widened from 2002 to 2014 with Mexico. The gross U.S. trade deficit increased with Mexico from $61.3 billion to $100.6 billion over this period. The VA data reveals the United States is slightly less competitive against Taiwan and Korea, but somewhat more competitive against Mexico, than gross trade figures would suggest.
Table 1: U.S. trade with partner nations, adjusted by value added, 2002 and 2014 (millions, 2014)[19]
|
Country |
Year |
Exports |
Imports |
Balance |
|
Gross |
||||
|
Mexico |
2014 |
$193,345 |
$293,916 |
-$100,571 |
|
Mexico |
2002 |
$110,024 |
$171,362 |
-$61,338 |
|
Value Added |
||||
|
Mexico |
2014 |
$178,587 |
$267,366 |
-$88,778 |
|
Mexico |
2002 |
$113,839 |
$169,043 |
-$55,203 |
|
Intra-Industry |
||||
|
Mexico |
2014 |
$42,200 |
$29,078 |
$13,123 |
|
Mexico |
2002 |
$29,563 |
$16,534 |
$13,029 |
Examining the VA trade balance share of total trade provides context for the magnitude of the trade balance (it calculates the absolute value of the trade balance, and then divides it by the sum of imports and exports), as seen in Figure 3. The Mexican share increased from 19.5 percent to 19.9 percent. These figures suggest the United States lost competitiveness against Mexico and Korea, but the losses were significantly smaller than the raw trade-balance data would suggest.
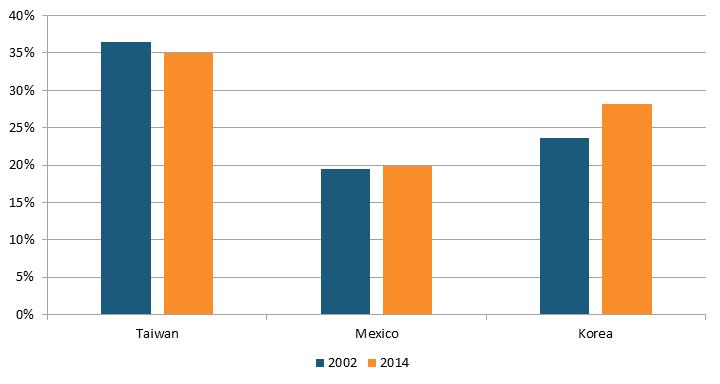
Figure 3: Value-added trade balance as percentage of total value-added trade[20]
Another aspect is the extent to which VA-adjusted imports and exports differ from their gross values. For example and comparison, in 2014, Mexico’s VA exports were 92 percent of gross exports and VA imports were 91 percent. The fact that the percentages of VA exports and imports trade with Mexico are balanced at approximately 90 percent means that bilateral gross trade flows with Mexico closely reflect the true trade relationship.
Updated Analysis: Trade in Intermediate Inputs by Industry
In general, products fall into one of three categories—capital goods such as machinery, consumption (final) goods such as smartphones, and production inputs (intermediate goods) such as steel plates. Deeper integration into GVCs means trade in inputs will increase much more than capital and consumption goods because countries are sourcing from a wider network of global suppliers, and production processes are becoming more complex, churning out products with more complicated features.
From 2002 to 2017, U.S. exports of intermediate goods to Mexico grew from 76 percent to 81 percent (of the total amount of exports.) (See Table 2.) In absolute terms, the United States also exports 13 percent more intermediate goods to Mexico than its global average. Similarly, the proportion of intermediate goods in Mexican imports has decreased by 8 percent, such that U.S. imports from Mexico have slightly fewer intermediate goods than average. This indicates an increasingly one-sided relationship with Mexico, with Mexico relying more on U.S. inputs for its products than the United States relies less on Mexican inputs.
Table 2: U.S. product trade according to broad economic categories, 2002 and 2017[21]
|
World |
Korea |
Mexico |
Taiwan |
||||||||
|
|
2002 |
2017 |
2002 |
2017 |
2002 |
2017 |
2002 |
2017 |
|||
|
Exports |
|||||||||||
|
Capital Goods |
26% |
21% |
32% |
28% |
15% |
14% |
33% |
28% |
|||
|
Intermediate Goods |
65% |
68% |
63% |
66% |
76% |
81% |
63% |
67% |
|||
|
Consumption Goods |
9% |
11% |
5% |
6% |
9% |
5% |
4% |
5% |
|||
|
Imports |
|||||||||||
|
Capital Goods |
21% |
26% |
28% |
28% |
28% |
39% |
39% |
29% |
|||
|
Intermediate Goods |
55% |
50% |
48% |
62% |
57% |
49% |
41% |
55% |
|||
|
Consumption Goods |
24% |
24% |
24% |
10% |
15% |
12% |
20% |
16% |
|||
For advanced economies such as the United States’, competitiveness depends in significant part on how well their technology-based industries perform. These industries are also key drivers of innovation and productivity growth. The section below merges analysis of ITIF’s 2019 report “Global Trade Interdependence: U.S. Trade Linkages with Korea, Mexico, and Taiwan” with analysis of updated (2018) intermediate trade data for Canada, Mexico, and the United States. As noted, ITIF’s 2019 report covered the following sectors: chemical manufacturing, pharmaceutical manufacturing, computer and electronics manufacturing, electrical equipment manufacturing, machinery manufacturing, automobile manufacturing, other transportation manufacturing (including aerospace), telecommunication services, computer programming and information services (also labeled as ICT services), and R&D services.[22]
One of the greatest strengths of NAFTA/USMCA has been the creation of continentally integrated markets and production networks, particular for sectors like autos, where parts and components may cross the borders of North American countries as many as eight times before being installed in a final assembly plant.[23] Similarly, medical devices cross North American borders as many as ten times as they are refined toward final production. The trade deficit the United States maintains with Mexico can partially be attributed to the United States taking advantage of lower labor-unit costs in Mexico to produce more cost-competitive products for the American market. While the United States depends on Mexico for a lower-cost production environment, Mexican firms source many inputs from U.S. firms, as established by robust intra-industry trade surplus levels. For example, ITIF’s 2019 report shows that (based on 2014 data) tech-based industries accounted for 42 percent of gross exports and 56 percent of gross imports, and 45 percent of value-added exports and 49 percent of value-added imports. These figures show exports to Mexico are more tech-based and imports less tech-based than gross values suggest. In general, trade with Mexico is less tech-based, but the United States depends on Mexican production facilities in large part to supply cheap tech-based products for consumers.
Analysis of the most recent intermediate input trade data (2018) shows Canada, Mexico, and the United States remain interconnected in key industries in ways that trade in finished goods and services trade data does not fully reflect. (See Table 3.) This intermediate trade matters, for as Hufbauer et al. observe, “A large portion of two-way trade among the NAFTA economies represents imported intermediates that raise the competitiveness of US firms, enabling them to improve their export profile in world markets.”[24]
U.S.-Mexico trade linkages hinge on the automobile and ICT industries. The automotive sector is the largest and clearest example of an integrated North American production network that is reliant on a significant portion of trade in intermediate inputs. In the automotive sector in 2018, the U.S. exported $16.8 billion in intermediate inputs to Canada and $8.9 billion to Mexico, while Canada exported $17.6 billion to the United States and $673 million to Mexico, and Mexico exported $38.5 billion to the United States and $4.9 billion to Canada. Nearly one-quarter and 33 percent of Mexico’s total auto exports go to the United States and Canada, respectively, as intermediate inputs. Likewise, 10.1 percent and 6.6 percent of total U.S. auto exports go to Canada and Mexico, respectively, as intermediate inputs. (See Table 4.) U.S. automobile exports to Mexico are much smaller in value-added terms than gross terms. This is due to the North American automobile value chain, wherein U.S. automobile exports to Mexico contain a fair number of components from Canada. Most of Mexico’s automobile and ICT exports are final goods meant for end users. Overall, this illustrates the reality of North American automobile value chains, wherein automobile components move between North American countries multiple times before being assembled into a final product. As noted, automobile parts and inputs may cross the U.S-Mexico border as many as eight times as they are being refined and produced.[25]
Global production networks for ICT and electrical equipment are predominantly based in China and North Asia. While it’s unrealistic to expect North America to seize all or even a large share of this economic activity, North America has some integrated production networks that the three countries would obviously want to grow as production networks diversify and shift. For example, in the ICT sector, 2 percent and 4.6 percent of total U.S. exports go to Canada and Mexico, respectively, as intermediate inputs. Meanwhile, 13.6 percent and 11.4 percent of Mexico’s total exports to the United States and Canada as intermediate inputs, respectively. This is lower than the auto sector, yet it again shows how Mexico plays a crucial role in helping make North America more competitive. Similarly, 5.3 percent of Mexico’s exports of electrical equipment go to the United States and Canada for intermediate use, while 3.3 percent of U.S. exports go to Mexico as intermediate inputs.
Machinery trade is another closely linked industry. In 2018, the United States exported $6.8 billion and $6.3 billion of machinery products to Canada and Mexico, respectively, for use as intermediate inputs. Meanwhile, Canada exported $5.1 billion to the United States, while Mexico exported $6.4 billion as intermediate inputs. The similar machinery export and import values suggest that both the United States and Mexico produce very specific types of machines the other partly relies upon. Intra-industry trade in the machinery industry accounts for a small share of bilateral machinery trade, which further supports the suggestion that the United States and Mexico are trading finished machinery that either country specializes in producing.
In basic metals and fabricated metal products, there’s also a degree of production integration given heightened trade in intermediate inputs. Trade data highlights Canada’s position as a major provider of key minerals, which should only grow given the importance of critical minerals for electric vehicles, batteries, and other advanced manufactured goods. In basic metals, 10.9 percent and 9.8 percent of Canada’s total exports go to Mexico and the United States as intermediate inputs, while 6.8 percent and 6.3 percent of total U.S. exports to Canada and Mexico are for intermediate use. In fabricated metal products, 9.4 percent of Canda’s exports go to Mexico for intermediate use, while 4.4 percent and 4.2 percent of U.S. exports to Canada and Mexico are for intermediate use.
Table 3: 2018 exports for intermediate use by industry ($ millions)[26]
|
US to Canada |
US to Mexico |
Canada to US |
Canada to Mexico |
Mexico to US |
Mexico to Canada |
|
|
Chemical and chemical products |
10,803 |
12,830 |
8,045 |
355 |
3,561 |
304 |
|
Pharmaceuticals, medicinal, chemical, and botanical products |
1,548 |
473 |
833 |
41 |
189 |
38 |
|
Rubber and plastics products |
4,911 |
5,124 |
5,667 |
511 |
3,746 |
383 |
|
Other non-metallic mineral products |
1,602 |
856 |
1,687 |
42 |
2,209 |
129 |
|
Basic metals |
11,281 |
8,520 |
21,032 |
775 |
11,936 |
591 |
|
Fabricated metal products |
7,259 |
5,678 |
4,859 |
672 |
5,281 |
765 |
|
Computer, electronic, and optical equipment |
3,351 |
6,299 |
2,084 |
302 |
21,870 |
1,717 |
|
Electrical equipment |
2,851 |
4,504 |
1,722 |
202 |
8,609 |
804 |
|
Machinery and equipment, nec |
6,872 |
6,361 |
5,145 |
420 |
6,421 |
495 |
|
Motor vehicles, trailers and semi-trailers |
16,868 |
8,906 |
17,630 |
673 |
38,587 |
4,905 |
|
Other transport equipment |
4,271 |
1,735 |
3,895 |
141 |
1,958 |
517 |
|
IT and other information services |
3,418 |
58 |
2,316 |
6 |
7 |
1 |
|
Professional, scientific, and technical activities |
7,337 |
704 |
4,675 |
16 |
253 |
10 |
|
Total Exports |
166,700 |
135,812 |
215,049 |
7,127 |
161,239 |
15,039 |
Table 4: Share of exports for intermediate use by industry[27]
|
Industry |
US to Canada |
US to Mexico |
Canada to US |
Canada to Mexico |
Mexico to US |
Mexico to Canada |
|
Chemical and chemical products |
6.5% |
9.4% |
3.7% |
5.0% |
2.2% |
2.0% |
|
Pharmaceuticals, medicinal, chemical, and botanical products |
0.9% |
0.3% |
0.4% |
0.6% |
0.1% |
0.3% |
|
Rubber and plastics products |
2.9% |
3.8% |
2.6% |
7.2% |
2.3% |
2.5% |
|
Other non-metallic mineral products |
1.0% |
0.6% |
0.8% |
0.6% |
1.4% |
0.9% |
|
Basic metals |
6.8% |
6.3% |
9.8% |
10.9% |
7.4% |
3.9% |
|
Fabricated metal products |
4.4% |
4.2% |
2.3% |
9.4% |
3.3% |
5.1% |
|
Computer, electronic, and optical equipment |
2.0% |
4.6% |
1.0% |
4.2% |
13.6% |
11.4% |
|
Electrical equipment |
1.7% |
3.3% |
0.8% |
2.8% |
5.3% |
5.3% |
|
Machinery and equipment, nec |
4.1% |
4.7% |
2.4% |
5.9% |
4.0% |
3.3% |
|
Motor vehicles, trailers and semi-trailers |
10.1% |
6.6% |
8.2% |
9.4% |
23.9% |
32.6% |
|
Other transport equipment |
2.6% |
1.3% |
1.8% |
2.0% |
1.2% |
3.4% |
|
IT and other information services |
2.1% |
0.0% |
1.1% |
0.1% |
0.0% |
0.0% |
|
Professional, scientific, and technical activities |
4.4% |
0.5% |
2.2% |
0.2% |
0.2% |
0.1% |
Analysis of trade data via the lens of intermediate inputs demonstrates why policymakers need to recognize the critical role that imports play in enhancing economic efficiency, competitiveness, and exports rather than just focusing on export figures broadly. This is especially true for manufacturing, but given the growing role of services in manufacturing, extends to services trade as well. Ultimately, growing trade in intermediate goods also means that the final cost of protectionism is higher than is generally understood, and rising, as tariffs and other restrictions can impact a final product multiple times. This extends to trade shocks, as seen with supply network disruptions during COVID-19. But again, production networks in Canada and Mexico—as opposed to China—are likely to be more resilient and secure given their proximity to the United States and that they operate under a clear and enforceable set of trade rule.
The Hamilton Index: Assessing National Performance in the Competition for Advanced Industries
Nations are in a fierce win-lose global competition for market share in advanced, traded-sector technology industries, because winning enables economic and national security. That is especially true for allied nations, because China’s gain comes at their loss and vice versa. Winning—not only the competition for innovation leadership but also for production capacity—will boost wages, international competitiveness, and economic and national security.
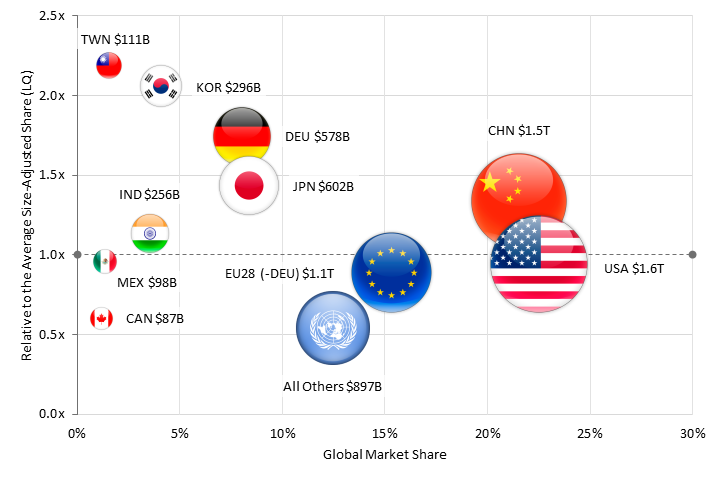
ITIF’s Hamilton Center on Industrial Strategy examined national changes in global shares of output across seven industry sectors that the Center has aggregated into the Hamilton Index of Advanced-Technology Performance: pharmaceuticals; medicinal, chemical, and botanical products; electrical equipment; machinery and equipment; motor vehicle equipment; other transport equipment; computer, electronic, and optical products; and information technology and information services. The report covers three years—1995, 2006, and 2018—for 10 countries and regions, including the United States, Canada, and Mexico, along with Germany, the EU-28 (minus Germany), China, India, Japan, Korea, and Taiwan. See Figure 4 for an aggregate analysis of where these countries place in terms of advanced industrial production.
This section examines nations’ and regions’ global shares of advanced-industry output relative to their changing shares of global GDP, as it enables a more accurate comparison among countries. This ratio, known as a location quotient (LQ), also can be calculated as an industry’s share of national GDP divided by its share of global GDP. LQ provides a global benchmark measure of a country or region’s industrial concentration, and therefore its competitive position, by expressing its market share as a multiple (X) of the size-adjusted global average. Moreover, industries vary significantly in their level sophistication when it comes to production: some are complex and advanced (e.g., exhibiting strength in semiconductor production) and others are more commoditized (e.g., specializing in semiconductor test and assembly). Thus, comparing total output between nations can mask importance differences in technological sophistication. However, even with these challenges, ITIF believes that such an international comparison provides useful information. An LQ of 1 means the country or region’s output of the good in question is proportionally the same as the global average; an LQ greater than 1 means the country’s output is that much more than the global average relative to the size of its economy; and an LQ less than 1 means the country’s relative concentration in the industry that much lower than the global average.
Figure 4: Total production and global market shares in Hamilton Index sectors, 2018
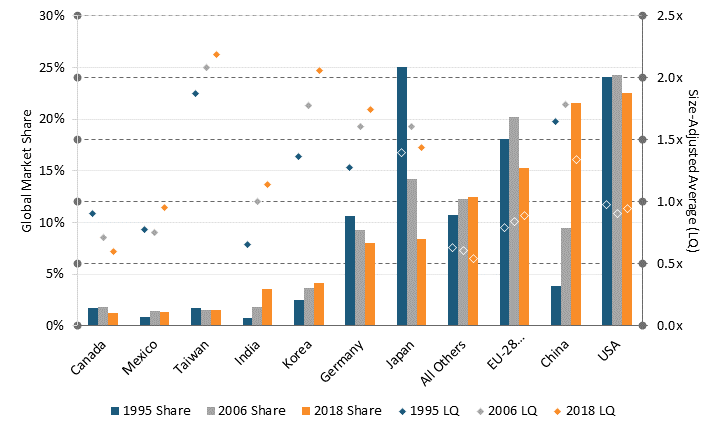
Between 1995 and 2018, many countries’ global shares of advanced-industry output changed significantly. (See Figure 5). Canada’s share dropped from around 11 percent in 1995 to 5 percent in 2018, while Mexico’s increased from around 9 percent to 12 percent. The U.S. share fell slightly. For broader context, as Japan’s overall share of the global economy fell, its share of advanced-industry output plummeted too, while China’s global market share increased by more than a factor of five. In relative terms, most other nations held significantly higher shares of the global market in advanced industries than the United States: In 2018, China’s share was 34 percent above the global average, Japan was 43 percent higher, and Germany 74 percent higher, while South Korea and Taiwan were both more than twice the average. Interestingly, China’s relative share fell, especially after its 2009 peak, while Japan’s relative share stayed largely stable.
Figure 5: Global market shares of Hamilton Index sectors, 1995–2018
Country-By-Country and North American Performance
Countries’ share of global advanced-industry output depends first and foremost on the size of the economy relative to global GDP. This is why the EU, the United States, and China lead and why Japan’s share has dropped so much. But relative strength in these industries also matters. For example, advanced-industry output as a share of the Taiwanese economy is 290 percent higher than for Canada. This is why global share of advanced industries in Canada—whose population is about two-thirds larger than Taiwan’s—is lower than Taiwan’s.
United States
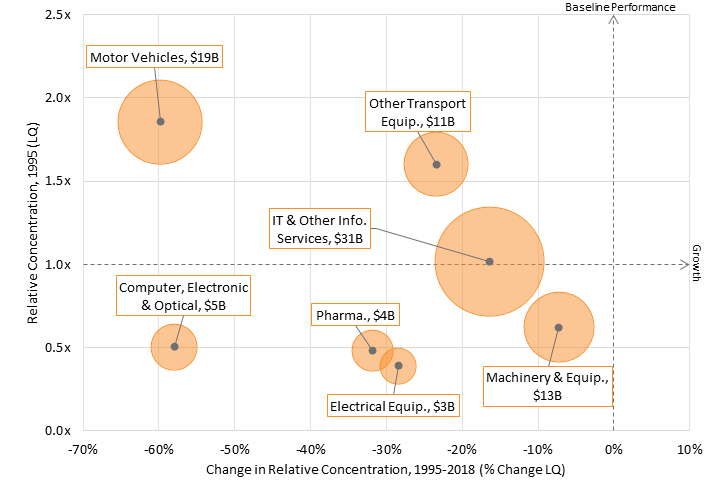
The strongest advanced industries for America in terms of share of global output are other transportation equipment, IT, and other information services and pharmaceuticals, in that order. (See Figure 6). The first two are also the only industries in which America’s share of global output has grown since 1995.
In contrast, the U.S. share in electrical equipment, machinery and equipment, and motor vehicles is quite low (especially when comparing for the size of the U.S. economy), and the United States has lost global share in all three of these industries. Because of the significant growth in the IT and other information services sector, both globally and in the United States, its growth is the main factor why U.S. global share of these industries only declined by 6 percentage points. Leaving out the IT and other information services sector, the U.S. relative share of global advanced-industry output fell by 16 percentage points. In other words, the real strengths of the U.S. software and information sector mask serious weaknesses in most of the rest of America’s advanced industries.
In the midst of significant weaknesses across a number of other sectors, America’s strength in the IT and other information services sector is a saving grace, which is why it is especially troubling to see many policymakers, especially progressives, favor policies such as aggressive antitrust laws and enforcement, which would only weaken U.S. capabilities in the sector. But even though this is a critical sector for U.S. global competitiveness, its success masks deeper vulnerabilities in the overall U.S. advanced-technology sector. Winning in the global competition requires strength across a wide array of advanced industries.
Figure 6: U.S. performance in Hamilton Index industry sectors
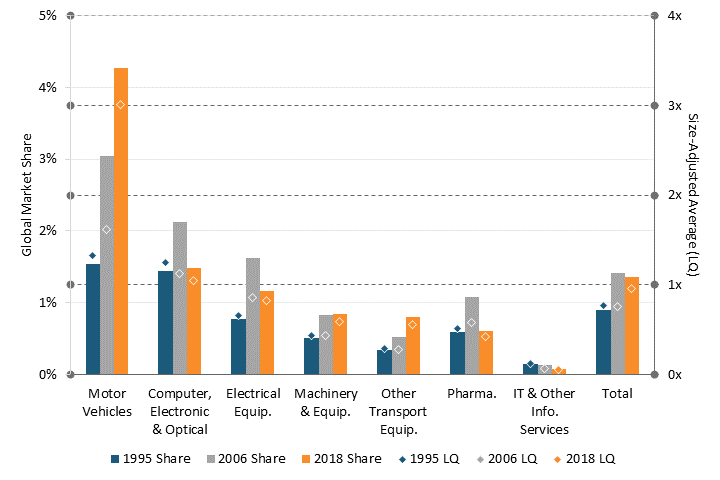
When examining America’s specialization in these industries relative to the rest of the world, the picture is worse. The U.S. share of industries fell for five industries and increased only for other transportation equipment and information services. (See Figure 7). For example, if auto production constituted the same share of the U.S. economy as the industry does as a share of world GDP, the industry would be 77 percent larger, equivalent to $130 billion in annual revenue. This would equate to approximately 14 additional auto factories. If policymakers wanted U.S. advanced industries to constitute the same share of the U.S. economy as they do in the rest of the world, U.S. advanced-industry output would have to expand by $99 billion annually. If they wanted U.S. non-IT and information services output to represent the same share of the U.S. economy it does of the world economy, output would have to expand by more than $250 billion, representing 1.2 percent of U.S. GDP. If policymakers wanted U.S. advanced industries to constitute the same share of the U.S. economy as they do in China, then U.S. output would have to expand by 42 percent, or $679 billion annually—3.3 percent of GDP.
Figure 7: Change in relative concentration of advanced industries in the U.S. economy, 1995–2018 (scaled to production output in 2018)
Canada
Canada lost global market share in all seven industries of the Hamilton Index, with the largest losses in motor vehicles and computer and electronics. Canada’s global share of all advanced industries fell by one-third from 1995 to 2018, from 1.8 percent to 1.2 percent. (See Figure 8).
Relative to GDP, Canada’s performance is even weaker. From 1995 to 2018, advanced-industry output as a share of the Canadian economy fell by 33 percent and now stands at just 60 percent of the global average, well below Mexico and barely above the mostly developing countries included as “rest of the world.” If Canadian policymakers wanted it to equal the same share of the Canadian economy as the global average, advanced-industry output would have to increase by two-thirds, or $57 billion (equal to 3.3 percent of Canadian GDP).
Figure 8: Canada’s performance in Hamilton Index industry sectors
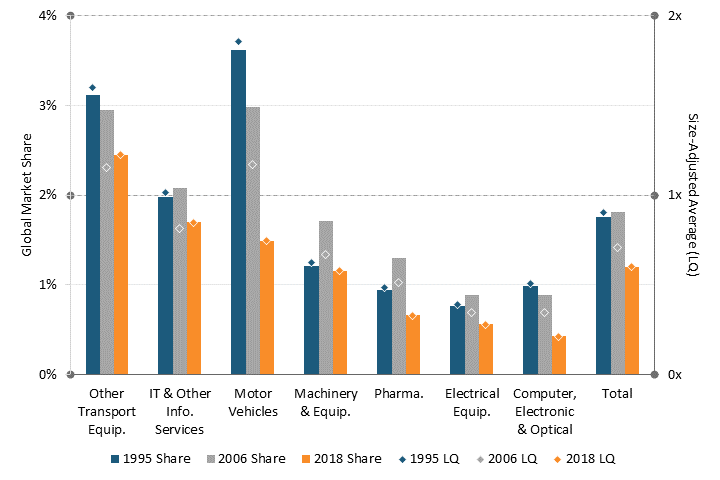
The output of these industries as a share of Canada’s GDP declined in part because of the dramatic decline in the share of motor vehicles (which accounted for 40 percent of advanced-industry output in Canada in 1995, down to 21 percent in 2018), but all seven industries became a smaller share of the Canadian economy. (See Figure 9).
Figure 9: Change in relative concentration of advanced industries in Canada’s economy, 1995–2018 (scaled to production output in 2018)
Mexico
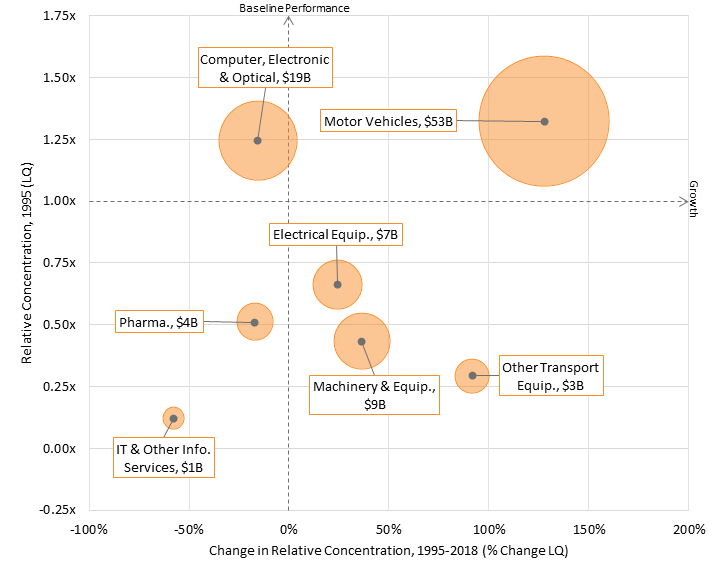
As more automakers have begun to use Mexico as a production platform to serve North America, Mexico’s specialization in motor vehicles has increased considerably. (Figure 10). Similarly, Mexico has grown its computer and electrical equipment industry as multinationals have taken advantage of low-wage labor for routine assembly operations. From 1995 to 2018, Mexico’s global share of advanced production increased from 0.9 percent to 1.4 percent. Interestingly, Mexico made progress in advanced industries production from 1995 to 2006, but then its share fell slightly. The initial surge was likely due to the signing of NAFTA in 1993, while the decline was likely due to China taking market share from what had prior been a lower-wage production platform. This decline is especially apparent in electrical equipment and computer and other electronics, both industries with rapid growth in China.
Figure 10: Mexico’s performance in Hamilton Index industry sectors
On a per-GDP basis, Mexico’s performance has strengthened since 1995, although advanced industries remained marginally underrepresented in 2018 with their share 4 percent less than if they equaled the global average (Figure 10). Interestingly, these industries represent a larger share of Mexico’s economy than they do of the U.S. economy. Mexico’s performance in pharmaceuticals, computer and electronic equipment, and IT and other services all weakened. In particular, its share of IT and other information services is the lowest of any industry for any country examined here, at just 5 percent of the global average. But growth in auto production outpaced the decline in other sectors, thereby driving up the country’s overall performance in the Hamilton index by nearly 20 percentage points from an LQ of 0.77 in 1995 to 0.96 in 2018. (See Figure 10 and Figure 11).
Figure 11: Change in relative concentration of advanced industries in Mexico’s economy, 1995–2018 (scaled to production output in 2018)
The North American Trading Bloc: A Work in Progress for Advanced-Industry Production
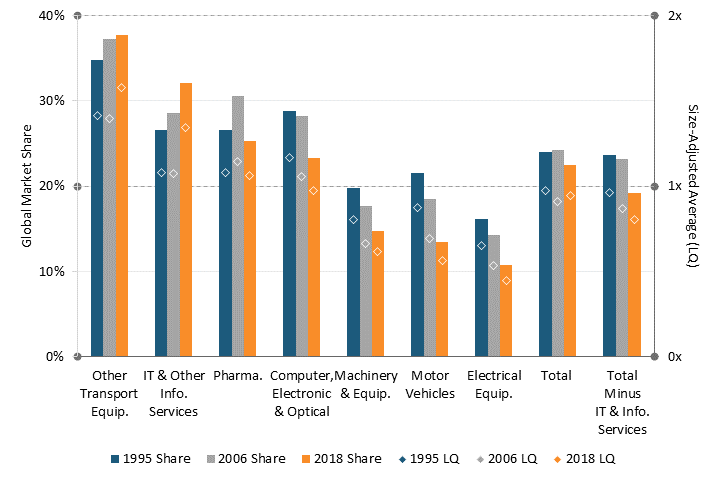
There is considerable interest, and work to be done, to build a globally competitive North American trading and investment bloc that together holds a greater global market share advanced-industry production. (See Figure 12 and Figure 13). The region’s share fell slightly over the last two decades, with five industries in the Hamilton Index experiencing declines (pharma, electrical equipment, machinery and equipment, motor vehicles, and computers and electronics).
Figure 12: The North American trading bloc’s performance in Hamilton Index industry sectors
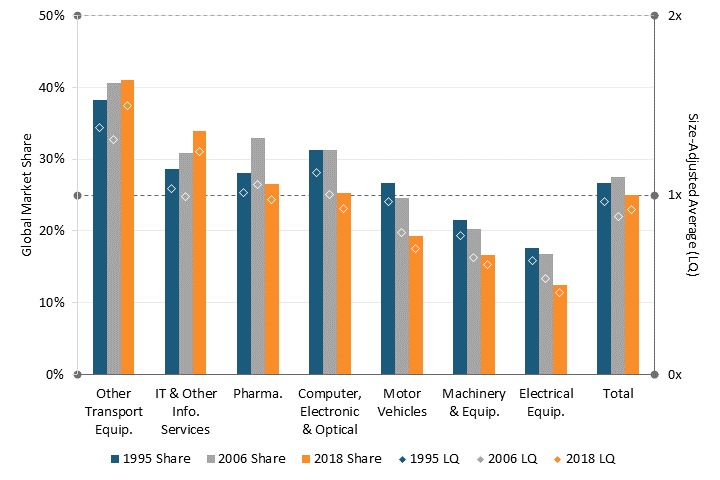
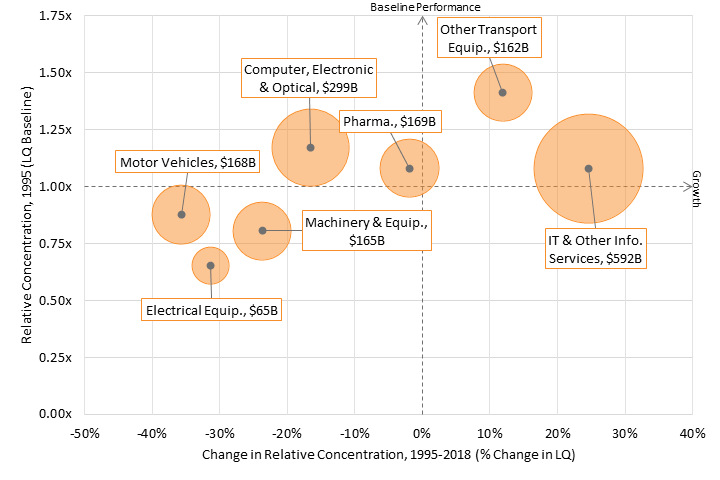
Figure 13: Change in relative concentration of advanced industries in North America, 1995–2018 (scaled to production output in 2018)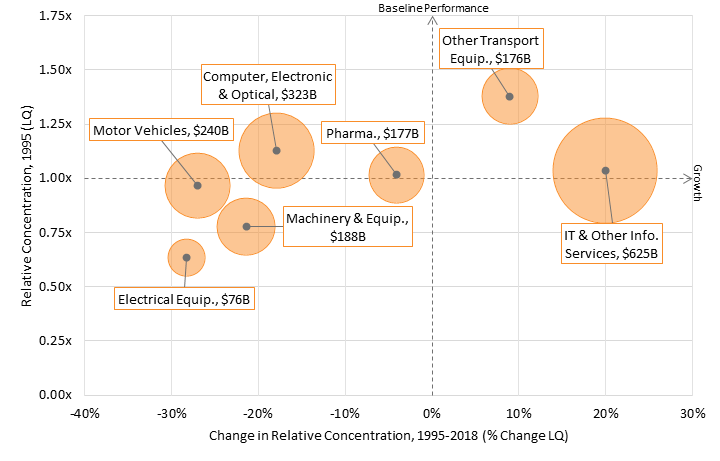
North America’s Diverse Innovation Ecosystem: The North American SubNational Innovation Competitiveness Index
The North American innovation ecosystem is increasingly diverse. In collaboration with the Macdonald-Laurier Institute, Fundación IDEA, and the Bay Area Economic Council Institute, ITIF compiled this index to assess economic differences among states and provinces, identify cross-national innovation performance, and track the continent’s overall competitiveness in the innovation-driven global economy.[28]
Capabilities differ not only among the three nations but also among their 92 states and provinces. The North American Subnational Innovation Competitiveness Index (NASICI) uses 13 measures across 3 categories to quantify the extent to which each state’s economy is knowledge based, globalized, and innovation ready. It calculates composite scores (between 0 to 100) that identify each state’s level of performance in the innovation economy.
ITIF identifies the “innovation economy,” as other economists have, as increasingly directed by a commitment to technological innovation. A state’s competitiveness in the innovation economy comes from its involvement in the global economy, its capacity for innovation, and its advancement of knowledge-based workforces. To measure the extent to which states/provinces in Canada, Mexico, and the United States are knowledge-based, globalized, and innovation-oriented, ITIF compiled data across 13 indicators to devise a composite index score for each state’s level of competitiveness in the innovation-driven economy. This index, and its basis for identifying the “innovation economy,” is heavily informed by ITIF’s recurring “State New Economy Index” (SNEI) and selects both indicators and weights for a composite index based on work from the SNEI series of reports.[29] Ideally, any contintental subnational index would include a considerable number of indicators, but because of data limitations in some nations, especially Mexico, and difficulties in obtaining comparable data for similar indicators, this index uses 13 indicators to examine 92 North American states: the 10 provinces of Canada, 32 federal entities of Mexico, and 50 states of the United States.
With all measures adjusted for the size of each state economy, NASICI uses 13 indicators divided into 3 categories:
▪ Knowledge-Based Workforce: Indicators measure employment in scientific, technical, and professional activities; the educational attainment of the workforce; immigration of knowledge workers; and manufacturing sector productivity.
▪ Innovation Capacity: Indicators measure a state’s share of households subscribing to broadband Internet, venture capital investment, the number of R&D personnel, expenditures on R&D, patents, the extent of movement toward decarbonization, and the creation of new businesses.
The following sections include key excerpts from this NASICI report.
Summary of Findings
At one level, it is not surprising that the divergence between the top state, Massachusetts, and the bottom, Oaxaca, is considerable. Massachusetts is likely the most innovative subnational region in the world, while Oaxaca still contends with development challenges, from education to infrastructure. Interestingly, low-performing U.S. states South Dakota, Mississippi, and Arkansas actually score closer to the median Mexican state (24.2) than to the median U.S. score (50.2). Further, 14 U.S. states perform below the lowest-ranking Canadian province.
America’s innovation leaders—Massachusetts, California, and Maryland—top the overall rankings at first, second, and fourth, respectively. Massachusetts ranks first due to the state’s massive network of software, hardware, and biotech firms in the Greater Boston area. Boston also holds one of the country’s most densely populated clusters of top-performing research universities, many of which focus on science, technology, engineering, and mathematics (STEM) education. California places second due to its bustling tech economy of Silicon Valley and other southern Californian innovation hubs with access to leading research universities such as Stanford, Caltech, and the University of California, San Diego. Maryland earns its spot due to the state’s abundance of D.C.-commuting knowledge workers employed in scientific, technical, and professional activities, alongside its R&D and innovation activities attributable to a plethora of federal contracts. Washington state ranks fifth because of its high-tech exports, cutting-edge tech businesses bringing in foreign investment, patent generation in areas such as artificial intelligence (AI) and cloud computing, and digitalization of the service sector.
Multiple Canadian provinces place highly as well. Ontario ranks highest among Canadian provinces at third, with British Columbia at sixth, and Quebec at ninth. Ontario is the North American runner-up in foreign investment and has attracted national headquarters from tech giants such as Uber, Intel, LG, and Samsung. Ontario also encompasses the Toronto-Waterloo Corridor, Canada’s largest innovation hub harboring more than 15,000 tech companies, over 5,000 start-ups, and a world-leading quantum computing hub.[30] British Columbia ranks high due to its highly educated workforce and attractiveness to migrating knowledge workers. Vancouver remains one of Canada’s most robust tech hubs and is home to almost 100,000 tech workers, helping British Columbia excel in its creation of R&D jobs and its high attraction of FDI.[31]
While Mexico expectedly lags behind U.S. and Canadian states, Nuevo León is the most competitive Mexican state by a very slight margin (ranking 61st out of 92 states), with Mexico City virtually tying. Mexico City, the second-most populous federal entity in Mexico, is home to many professional jobs and burgeoning entrepreneurial activity. As a political and economic door for the United States to the rest of Latin America, many start-ups and larger firms looking to assert their presence in Latin American markets have established second headquarters in Mexico City.[32] These circumstances have allowed Mexico City to attract an exceedingly high volume of foreign-born knowledge workers alongside a rise in foreign investment, each in greater amounts than for many U.S. states. Nuevo León and Mexico City score 10 points higher than the nation’s median state does, and 11 U.S. states score closer to the level of Nuevo León/Mexico City than to the U.S. median. Nuevo León, located just south of Texas, has long been a leading Mexican manufacturing region and has benefited from high levels of FDI due to companies post-NAFTA seeking out large amounts of affordable, skilled labor. However, the state’s manufacturing value added per worker is very low. Similarly, Jalisco, home to Mexico’s rising tech capital Guadalajara, has more workers and higher total value added in manufacturing and ICT sectors than most U.S. states do, yet it maintains few tech jobs as a share of total employment and low per-worker value added in these industries.
While overall index scores strongly correlate with GDP per capita (0.73), wealth is not directly determinant of a state’s competitiveness in the innovation economy. Intra-nationally, these scores correlate far less with wealth. Considering just Canadian provinces, the correlation between index scores and GDP per capita falls to just 0.22. In U.S. states alone, that correlation is 0.46, while it’s 0.51 among only Mexican states. For example, while New York remains one of the wealthiest American states in total and per capita measurements of GDP, it ranks outside the top 10 North American states. Although New York City boasts considerable FDI and a high concentration of venture capital firms plus academic and corporate research labs (including the likes of Microsoft), New York state ranks 14th overall due to a longtime process of bleeding knowledge workers, both in professional services and in advanced manufacturing, across the Hudson to New Jersey and to Connecticut, both of which outrank New York at 7th and 13th, respectively.
Leading competitors in North America’s innovation economy can be found in the continental Northeast. New England states, alongside New York, Quebec, and Ontario, are characterized by highly educated workforces, a plethora of high-tech exports, extensive broadband access, and a wealth of R&D workers. The Pacific Northwest also prevails as another key regional leader in the innovation economy. The West Coast states of British Columbia, California, Oregon, and Washington excel in economic indicators similar to the American Northeast while attracting leading volumes of FDI. Progress made in both regions is assisted by cross-national innovation clusters and economic interdependence forged between the United States and Canada.
Similarly, at the southern border, more cross-national innovation activity is taking place between U.S. states Arizona, California, Nevada, and Texas with Mexican states Baja California, Jalisco, Mexico City, Nuevo León Queretaro, and Tamaulipas. This emerging innovation cluster between the U.S. Southwest and Mexican North was previously shaped heavily by NAFTA, thereby significantly boosting FDI in Mexico, rapidly creating new businesses, and building a bedrock of North American manufacturing in Mexico.[33] The highest-performing Mexican states in the innovation economy have even found their business cycles synchronizing with the economies of states in the American Southwest.[34]
Mexican states remain concentrated at the low-scoring end of the subnational index (rankings 61–92 are all Mexican states). And while the top-performing Mexican states score on par with the United States’ lowest-performing states, Mexico’s most struggling states—Michoacán de Ocampo (89th), Chiapas (90th), Guerrero (91st), and Oaxaca (92nd)—perform at about one-third the level of Mexico’s innovation leaders.
High-Tech Exports
Figure 14: High-tech exports (NAICS 333, 334, & 335) as a share of GDP
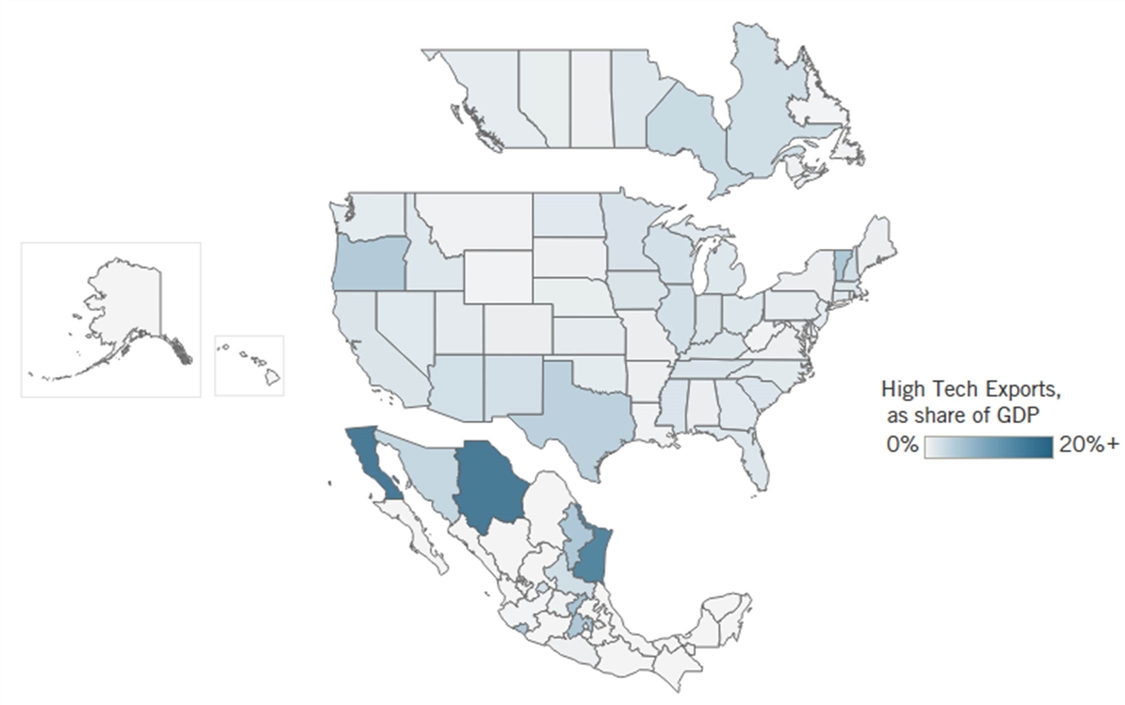
High-tech exports is an important measure, for as technology comprises an ever-larger share of global trade, the extent of technology exports reflects a state’s readiness for trade of products today and into the future. Such innovative technologies traded internationally are defined here as machinery manufacturing (NAICS 333); computer and electronics products (NAICS 334); and electrical equipment, appliance, and component manufacturing (NAICS 335). This indicator measures a state’s sum of exports within these three 3-digit NAICS codes as a share of GDP. These codes contain technologies such as robotics, ICT goods, and computer components, and are selected because they expend the highest amounts of R&D business expenditure compared with any other manufacturing sector.[35]
The Rankings on High-Tech Exports
Chihuahua, Baja California, and Tamaulipas lead all other North American states in exports of high-tech products relative to GDP. (See Figure 14 and Table 5). These states include the major manufacturing cities of Ciudad Juarez, Tijuana, and Matamoros, which together comprise most of Mexico’s “maquiladora” manufacturing plants. These maquiladoras once accounted for nearly half of all Mexican exports, but as U.S. demand for Mexican exports has changed over time, the content of maquiladoras has shifted more toward technology goods. Maquiladoras in Chihuahua have led this transition, accounting for nearly $90 billion worth of Mexican exports in a single year. Further, automatic data processing machinery and equipment are becoming a greater source of technology exports from Chihuahua.[36] High-tech exports from U.S. and Canadian states are significantly lower, as those countries have relatively smaller industrial economies and larger service economies. Interestingly, Vermont leads the United States in its production of high-tech exports, which stems from a concentrated production in computer component technologies. States with low FDI and R&D commitments lagged behind in their trade of high-tech exports—an indication that they lack firms able to develop high-tech products.
Table 5: Exports of high-tech products relative to GDP[37]
|
Top 5 |
State/Province |
High Tech Exports as a Share of GDP |
|
1 |
Chihuahua |
39.0% |
|
2 |
Baja California |
21.4% |
|
3 |
Tamaulipas |
17.8% |
|
4 |
Querétaro |
6.9% |
|
5 |
Vermont |
6.3% |
|
|
Average North American State |
1.3% |
|
|
Average Canadian Province |
1.6% |
|
|
Average Mexican State |
3.7% |
|
|
Average U.S. State |
1.7% |
R&D Intensity
Figure 15: Total R&D investment relative to GDP
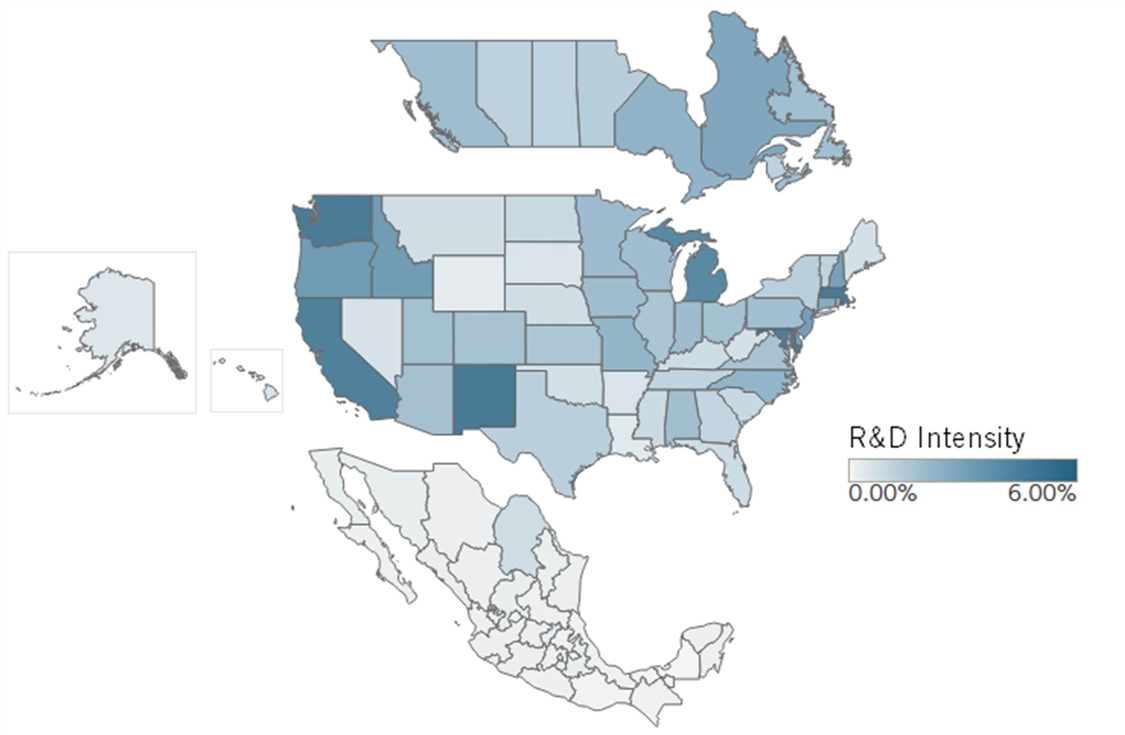
Contributions to R&D come from three main sources: business, government, and academia. Businesses fund R&D to create new products and more-efficient processes, a motivation that has amassed nearly three-fourths of total U.S. R&D.[38] Academic institutions cultivate talent and provide platforms for scientists and engineers to conduct their work. Government can drive innovation in socially valuable areas that may otherwise lack attention. This indicator measures R&D intensity as a state’s total received investment of R&D relative to its GDP. R&D funds invested in a state have a resonating impact on the rest of an economy, as one estimate finds that each dollar allocated by Canadian firms for R&D add another 33 cents to the rest of the economy.[39]
The Rankings on Total R&D Investment Relative to GDP
New Mexico leads North America in R&D intensity due to sizable federal investment in Los Alamos National Laboratories and Sandia Laboratories in Albuquerque. (See Figure 15 and Table 6). Massachusetts places second in R&D intensity due to a concentration of universities and biotech and software firms in the Greater Boston area performing R&D. Both Washington and California rank highly due to robust R&D intensity among high-tech industries. States containing large federal facilities—especially research organizations—such as Maryland, which includes the National Institutes of Health and the National Institute of Standards and Technology, also rank as more R&D intensive than others.
Table 6: R&D intensity as a state’s total received investment of R&D relative to its GDP[40]
|
Top 5 |
State/Province |
R&D Intensity as a Share of GDP |
|
1 |
New Mexico |
7.17% |
|
2 |
Massachusetts |
6.36% |
|
3 |
Washington |
5.92% |
|
4 |
Maryland |
5.81% |
|
5 |
California |
5.63% |
|
|
Average North American State |
1.59% |
|
|
Average Canadian Province |
2.11% |
|
|
Average Mexican State |
0.24% |
|
|
Average U.S. State |
2.31% |
Cross-National Innovation Clusters
Pacific Northwest
A cluster of exceptionally high scores in the NASICI concentrated in the Pacific-Northwest shed new light on the region’s innovation leadership. Washington, British Columbia, and Oregon rank within the top-10 highest-scoring states on the index, ranking 5th, 6th, and 10th. So what are these states doing right, and what makes this region a hot spot for innovation?
First, the Pacific Northwest has long been a region of collaborative innovation activity. Cross-regional development organizations such as the Pacific Northwest Economic Region (PNWER) and Cascadia Innovation Corridor have been successful in their decades-long advocacy for increased investment and activity in cross-border knowledge exchange, transportation development, and human capital enrichment.[41] By building this cross-national economic identity, innovation hubs in Vancouver, Seattle, and Portland have increased economic co-investment, especially in the technology and life sciences industries. For example, the British Columbia Cancer Agency, a Vancouver-based life sciences lab doing groundbreaking cancer research on the BCRA gene, is currently working on codeveloping new isotopes for cancer diagnostics and conducting shared research on mRNA technology with the Seattle-based Fred Hutchinson Cancer Research Center—a partnership made possible through the Cascadia Innovation Corridor’s organizing of enterprise leaders for regional development.[42] This research collaboration is emblematic of the greater innovation cluster taking shape in the Pacific Northwest. Industry-university partnerships are also robust in Seattle and Portland. Oregon alone sports four major universities that operate entrepreneurship centers and programming. Oregon lawmakers have established the University Innovation Research Fund, which provides matching funding of federal investment to Oregon’s research universities from state-level public and private sources.[43] These conditions sustain a vibrant regional innovation cluster and have made Oregon and Washington top exporters in semiconductors (and semiconductor-related tech) and aircrafts, respectively.
U.S.-Mexico Border States
Competitive Manufacturing as a Strategy for Growth
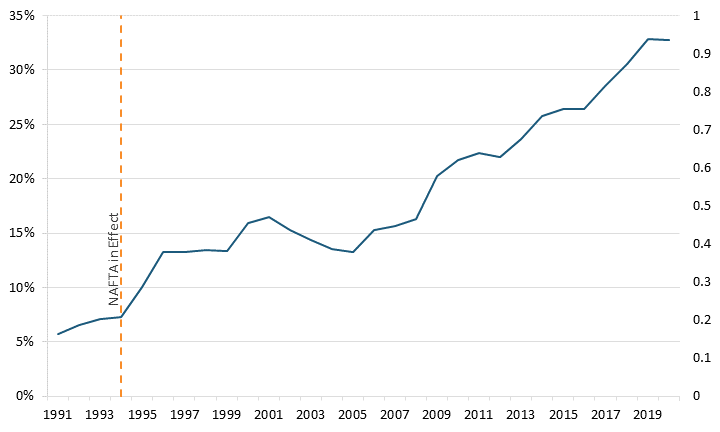
Mexico has become the second-largest exporter of goods to the United States, with more than 11 percent of those exports attributable to the automobile industry. With the passage of NAFTA in 1994, automakers found their global competitiveness improved when doing business inside the United States, as the elimination of tariffs made greater manufacturing investment possible throughout North America. After NAFTA’s implementation, Mexico’s share of U.S. auto imports have grown steadily, with its 1995 share growing by 37 percent over the previous year (compared with 1994’s growth rate over 1993 of just 3 percent). (See Figure 16.) However, while U.S. content of imported vehicles from Mexico was 5 percent before NAFTA, that figure reached 40 percent by 2017.[44] With greater incentives for North American production of automobiles and automobile parts, Mexican states can leverage their comparative advantage in wage-competitive manufacturing to attract more investment from Canadian and U.S. businesses. This partnership has created a win-win for both North American companies enhancing their supply chains to build more vehicles affordably and Mexican states to create domestic production jobs while also growing their economy. The vast majority of Mexico’s vehicle production—90 percent—is ultimately exported, with 76 percent going to the United States.[45] Ultimately, the reality is that “NAFTA has been crucial for North America to remain competitive in world markets by relocating parts of its auto manufacturing based on the cost advantages of three countries.”[46]
Figure 16: Mexico’s share of U.S. auto imports[47]
This process of wealth creation shows the most success in Nuevo León, one of Mexico’s subnational winners from NAFTA, which ranked the highest of any Mexican state in the NASICI. With more than 200 auto parts manufacturers, Nuevo León has more auto suppliers than does any other Mexican state. This leadership in establishing a crucial U.S. import market has brought invaluable economic gains to Nuevo León.[48] Now the state commands a highly industrialized economy comparable to smaller European countries such as Croatia, Poland, or Slovakia. Nuevo León’s growth is due to its attraction of foreign investment and commitment to North American manufacturing. Such efforts have improved its innovation performance across some indicators observed in the North American innovation competitiveness index, with the state ranking 35th in R&D Personnel, 16th in inward FDI, and 11th in VC investment.
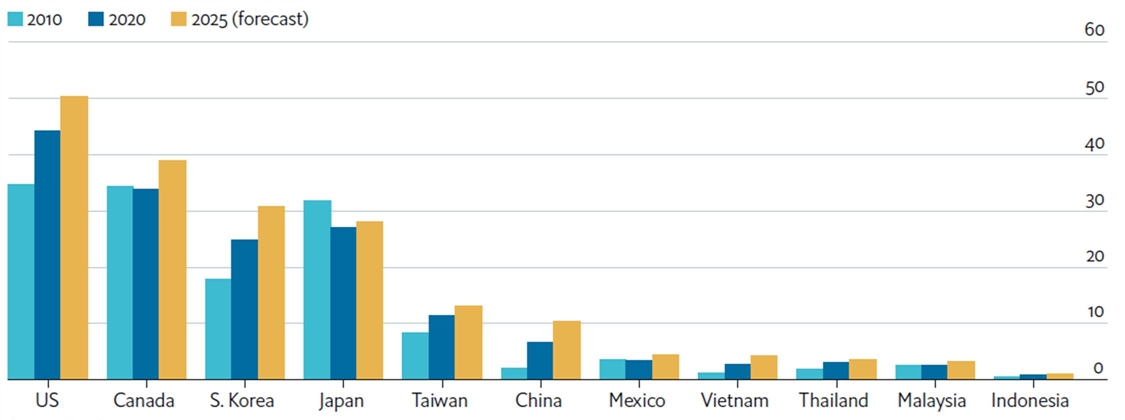
Nuevo León’s growth represents the high-wage/low-wage dynamic that could make North America a far-more significant global manufacturing powerhouse, especially when more cost-efficient labor is needed to support manufacturing efforts. Indeed, Mexico’s production costs, in terms of labor cost per hour, have stayed competitive with those of Asian nations, with the gap to the U.S. wage expected to increase to one-tenth the U.S. level by 2025 (See figure 17).
Figure 17: Average manufacturing labor cost ($US/hour)
Mexico’s Innovation Capital
The state of Jalisco has seen a similar growth trajectory. But while Nuevo León’s growth comes from its involvement in auto manufacturing for North American supply chains, Jalisco’s growth comes from its commitment to new technologies. While its per-worker gross value added (GVA) in the manufacturing and information and communications sectors are $53K and $100K, respectively, Jalisco’s total gross value added in both fields ranks far higher. The state’s total GVA in manufacturing equals $29 billion (just below the total manufacturing GVA of California) and its GVA in the information and communications industry totals nearly $20 billion, on par with that of North Carolina.[49] From these statistics, two key questions weigh on Jalisco’s innovation competitiveness: What accounts for the growth in these industries, and why is there such a gap in performance between total GVA and GVA per worker?
The answer to both questions lies in the state’s capital city of Guadalajara, which has become Mexico’s high-tech capital due to a decades-long transformation that started with manufacturing technology components for the most-innovative firms of the latter half of the 20th century. Companies such as IBM, Motorola, and Hewlett-Packard all relied on the manufacturing capacity of Guadalajara to produce semiconductors and other valuable electronic products. This concentration of big tech names helped develop a cadre of Mexican firm managers, programmers, and engineers. Tech companies producing in Guadalajara expanded their investment into Jalisco’s universities to improve STEM education, shaping the way for the next generation of engineers and innovators to be tapped by multinationals with facilities in Mexico’s tech capital.
With a growing stock of STEM-oriented human capital and rising global competitors in technology manufacturing, the city’s economic strategy has evolved in the last two decades away from manufacturing electronics to designing them instead. The city now maintains R&D facilities from global tech giants—including Amazon, Oracle, IBM, and HP—and serves as an innovation hub that attracts entrepreneurs from Silicon Valley seeking an international alternative to California’s tech capital. This growth shows in Jalisco’s total number of workers employed in scientific, technical, and professional activities, reporting about 230,000 workers in the industry in 2019 (more than in several Canadian and U.S. states). Jalisco also sports roughly the same number of R&D personnel found in the state of Delaware. But Guadalajara’s prosperity is primarily why Jalisco’s performance in per capita economic measurements scores surprisingly low. Jalisco’s total population had climbed to nearly 8.5 million by 2020, whereas Delaware’s population is just under 1 million. Jalisco’s burgeoning capital has drawn in more willing intra-national migrants looking to participate in the urban advancements, higher wages, and safer conditions. But its growing pains from a transitioning economy are nothing new. Economists such as Arthur Lewis have articulated this developmental process of an essentially two-way economy of, on the one hand, rural economic activity akin to subsistence, and on the other, an urban capitalist sector that generates an improved standard of living. Lewis’s problem of the dualistic economy is a problem of fortune that Jalisco will need to navigate in order to complete its transition to that of a higher-income state.
Case Study: TSMC in Arizona: What the Semiconductor Industry Can Learn From the Auto Industry
Arizona presents a poignant case study in the potential for cross-national innovation activity. In 2020, the state attracted $12 billion worth of investment from the Taiwan Semiconductor Manufacturing Company (TSMC) to develop next-generation chips. With the first foundry under construction, TSMC plans to construct as many as six new fabs in the next 10 to 15 years. Semiconductors have become one of the most essential electronic products to the global economy, with TSMC valued at more than half a trillion dollars. In contrast, the worldwide supply shortage of semiconductor chips, which has crippled many technologically advanced industries, has made the manufacturing company’s investment even more valuable. Arizona’s new facilities will be developing TSMC’s new and enhanced 4 nanometer (nm) semiconductor chips, while the second fab scheduled to open will produce 3 nm chips, these products highly demanded by firms creating the next generation of automobiles, smartphones, and other ICTs. TSMC intends to bring as many as 12 of its supplying firms into Arizona to open new facilities to integrate its Arizona-based semiconductor production activities better. And while many complementary firms may hope to land new facilities in Arizona, there is a valuable opportunity to integrate Mexico’s global value chains into U.S. advanced semiconductor manufacturing at the southern border.
The Mexican state of Sonora, which borders Arizona, has made significant contributions in building up the Arizona Innovation and Technology Corridor (AZITC) with its U.S. neighbor. The AZITC refers to the section of Pinal County, Arizona, between Phoenix and Tucson that has attracted a surge of business investment over the last two decades, now most notably containing facilities for electric vehicle companies Lucid Motors and Nikola. These innovative automakers chose AZITC for new facilities for proximity in distributing into key U.S. markets and for direct access to the automotive supply chain in the Arizona-Sonora region.[50] Mexico’s auto parts production for U.S. firms has driven industrial growth in the automotive industry closer to the southern border. Now innovators of next-generation vehicles are finding success in Arizona and the AZITC to host the future of electric vehicles, bringing economic growth to both sides of the southern border. Their economic partnership has seen tremendous growth in Sonora’s three manufacturing cities of Hermosillo, Guaymas, and Empalme, whose production networks generate a constant flow of over 100,000 auto parts shipped across the southern border daily.[51] Now Sonora ranks 68th in the NASICI and 8th among Mexican states, showing particular progress in expanding high-tech exports (11th), broadband access (37th), and PCT patent generation (58th).
With the success of U.S. and Mexican states integrating supply chains for the automotive market, there is high potential for the same integration in advanced-technology production. TSMC basing new operations in Arizona to produce 4 and 3 nm semiconductors will bring more facilities to the region both from TSMC and its suppliers seeking to establish closer operations. Other vertically important production activities toward the development of TSMC’s semiconductor chips would benefit from locating in Mexico for its wage-competitive manufacturing, a large stock of readily available workers, and affordability of industrial space.[52] Nearshoring of these adjacent manufacturing services in the semiconductor industry would significantly improve the vertical organization of North America’s semiconductor supply chains, creating mutual economic gains for the United States and Mexico. U.S.-owned firms still maintain nearly half of the global market share of semiconductors. However, Canada and Mexico’s role is much smaller.
If North America wishes to become more competitive in semiconductor manufacturing, then it should consider how to leverage the unique capabilities of countries in the region to make that happen. For instance, right now, wafers manufactured in Samsung’s fabs in Austin, Texas, or Intel’s in Arizona, are shipped to Southeast Asian nations for final assembly, testing, and packaging (ATP). Why not have that happen in Mexico (or Caribbean nations)? That’s exactly why Sonora is developing an ATP competitiveness strategy for the state. In other words, nearshoring of advanced-technology production in Mexico should be considered a valuable complement to sourcing from Asia.
Policy Recommendations
Building a more robust and competitive North American Production System will require a set of individual and collective policies to support advanced-industry development. The following offers several recommendations for achieving this.
Support United States “Plus” Canada and Mexico as Opposed to a U.S.-Only Strategy
U.S. policymakers need to differentiate between the significant economic benefits that the U.S. economy derives from U.S. firms setting up operations in Mexico (and Canada) as opposed to China. Some Biden administration officials are reflexively against U.S. firms setting up production in Mexico as they see it as zero-sum: Mexico wins, the United States loses. As the data shows, this is not true. U.S. firms depend upon global operations in places like Mexico to remain competitive and often the choice is not between the United States and Mexico as a production location, but between Mexico and an Asian low-wage nation like China. Indeed, such a strategy can help the United States weaken the Chinese manufacturing economy, while helping America’s. As such U.S. policy should recognize and support trade and investment in Canada and Mexico. Each time the United States sweeps up Canada or Mexico in protectionist measures (whether it pertains to steel tariffs or Buy American provisions), it understandably sours relations and efforts to support greater integration of these economies.
The United States should stop sweeping up Canada and Mexico in these domestic protectionist tools and instead recognize the critical role the countries can play in supporting domestic industrial goals and economic growth. The United States should see a North American Production System as part of a “U.S. Plus” strategy for global advanced technology competitiveness, which in this case involves the United States plus Canada and Mexico. In other initiatives and sectors it involves the United States plus the European Union, Japan, South Korea, and others. Together, this hub and spoke model provides critically aligned market scale for likeminded trading partners and their advanced technology firms.
At the same time, a stronger Mexican economy can play a key role in limiting illegal immigration into the United States, given that economic opportunity will be stronger there, and Spanish-speaking illegal migrants may instead choose to stay in Mexico (or other Central American nations whose economies in turn grow and are strengthened by a more robust North American production ecosystem).
Change “Buy America” Provisions to Include Mexico and Canada, so Long as Both Countries Reciprocate
Domestic content rules, and growing concerns about “trusted sourcing” in an era of supply chain disruptions and national security concerns, make federal U.S. procurement policy increasingly important in ensuring the resilience of supply chains that are essential to U.S. national security, economic continuity, and long-term industrial capacity. Given their role in supporting U.S. economic and national security, both Canada and Mexico should be exempted from restrictive procurement rules so long as U.S. firms and products are treated the same in each of their respective procurement systems. For example, in implementing the Infrastructure Investment and Jobs Act, Canada and Mexico should be exempted from restrictive local content and rules of origin restrictions, as long as U.S. firms are similarly able to compete for infrastructure projects in both Canada and Mexico.
Consider Including Mexico in Defense Agreements Like the U.S. has with Canada, the United Kingdom, and Australia
The United States should consider adding Mexico as an extension of the U.S.’s efforts to create a de facto “trusted country system” for defense procurement.[53] The U.S. federal government already does this by including the United Kingdom, Canada, and Australia as part of the National Technology and Industrial Base (NTIB).[54] Such a trusted country list would in effect eliminate and replace most legacy legislation in federal procurement policy—not only the Buy America Act’s (BAA) price preference system and various sector-specific “Buy America” rules but also regional value content rules like those found in the USMCA. Trusted country rules of origin for components in supply chains are easier to oversee, less likely to antagonize U.S. trading partners and military allies, and less likely to require frequent and time-consuming waiver applications than the indiscriminate application of arbitrary price preferences or value-added content quotas. Under such a trusted country system, the cumbersome price preference system of the BAA would be eliminated and with it the need for agencies to waste valuable time submitting waivers for particular goods or contractor.[55]
Improve Information Sharing, Coordination, and Alignment of Defensive Measures
Canada, Mexico, and the United States need to not only support, but defend, what they have and want to build within a North American Production System from predatory Chinese trade, investment, and technology policies. The three countries should establish formal meetings between relevant agencies to discuss and exchange information related to the respective defensive mechanisms they’ve implemented to address predatory, nonmarket-driven, Chinese trade and economic activity, mainly with regard to investment screening, export controls, countering intellectual property (IP) theft, and controlling access to financial markets. The three parties need to work together to ensure they’re on the same page and that their relevant countermeasures are working as necessary to prevent Chinese state-directed, predatory economic activity.
Officials should use a formal meeting and cooperation arrangement to help each other build a more comprehensive picture of foreign investors of concern, their intentions, their products, and the potential impact on the host or a third-party country and sector. This is critical because the Chinese government, often through state owned enterprises, funnels money in nontransparent ways to obfuscate the fact that the real investor is the Chinese government. Each of the countries should also provide semiannual and annual reports covering relevant FDI and transactions to help them identify trends and changes. The parties should be able to provide feedback (on a confidential basis) as to whether they think a particular transaction in a given country would affect their own economic or military security or public order, and why.
Just as with investment screening, the three parties should ensure their export control regimes are comparably defined and applied so as to be compatible. Collective, aligned, and proactive efforts to prevent the export of defense-related products and technical knowledge are necessary to protect national security. In addition, a joint export control regime can be an effective tool to punish Chinese firms that engage in serious IP theft. Joint efforts are critical, as export controls need regular updating in order to reflect the global state of play in advanced technology industries (and hence, require greater international cooperation) as well as the changing ways in which countries and their firms are trying to acquire access to prohibited defense-related products. A coordinated approach is also necessary to avoid firms from one party being put at a competitive disadvantage to their competitors in another country.
Develop North American Trade and Competitiveness Metrics and Competitiveness Consultive Measures
As ITIF highlights above, there is value in developing metrics that measure all three nations’ economies. The U.S. government should take the lead in expanding this. Rather than just publish U.S. data on things like manufacturing jobs, exports, imports, and other measures, the U.S. Bureau of Economic Analysis should start publishing North American integrated data. We should be able to know on an annual basis questions like “what has happened to the region’s trade balance with China?” and how did the region’s manufacturing jobs grow?
The three nations should expand the scope of sub-national data. For the purposes of preparing the NASICI, ITIF and its Canadian and Mexican partners were only able to identify 13 indicators for which data was uniformly and readily available across North America’s 92 subnational regions. Statisticians from Canada, Mexico, and the United States should collaborate to make more such indicators available.
At the same time, the Biden Administration should launch a broader agenda for the USMCA Competitiveness Committee in terms of bringing together key public and private actors to regularly meet, identify issues of joint concern, and recommend joint solutions. One key task for this group would be to identify critical supply chains based on low labor costs that are now produced in China and develop policy strategies for how these can be produced in Mexico. For example, the group could set a goal of shifting half of China’s active pharmaceutical ingredient (API) production for the U.S. market to Mexico. This could involve financial support from the U.S. government, coupled with a commitment by the Mexican government to provide appropriate tax incentives and other key support factors.
Finally, the Canadian, Mexican, and U.S. governments should establish an innovation experts working group to make comparative assessments of innovation strengths and weaknesses between the three countries in sectors such as AI, the Internet of Things, smart cities, data analytics, biotechnology, and global value chain integration best practices. Their work should form part of an integrated platform for collaboration and cooperation in the development of new technologies and industries.[56]
Develop a North American Manufacturing Digitalization Strategy and Ecosystem
Canada, Mexico, and the United States should develop a comprehensive strategy to support manufacturing digitalization.[57] The three countries should also create a mechanism to create a jointly funded initiative to support a North American digital manufacturing ecosystem. Canada and Mexico could establish their own institutes for manufacturing digitalization (the United States already has one, see below) and develop cooperative mechanisms between them. An alternative to standing up their own centers would be for Canada, Mexico, and the United States to negotiate a memorandum of understanding that would allow the Canadian and Mexican governments and their firms to jointly fund and participate in projects in the U.S.’s MxD. MxD, also known as The Digital Manufacturing and Cybersecurity Institute, is one of America’s 16 Institutes of Manufacturing Innovation that constitute the Manufacturing USA program. MxD is a public-private partnership that serves as a central hub for the development, showcasing, access to, and transmission (especially to small and medium sized enterprises) of knowledge, tools, software, and expertise related to manufacturing digitalization. MxD serves as a state-of-the-art proving ground for digital manufacturing and design that links information technology tools, standards, models, sensors, controls, practices and skills, and transitions these tools to America’s design and manufacturing industrial base for full-scale application.[58]
Align Foundational Education and Financial and Tax Incentive Policies to Support Advanced-Technology Production Networks
Canada, Mexico, and United States should enact foundational enablers to support greater (general) advanced technology production. Increasing federal support for scientific and engineering research would also help. The U.S. CHIPS and Science Act is an example of the type of supportive policies the three countries need to consider.
Canada, Mexico, and United States should develop complementary measures to attract firms in advanced technology sectors (as opposed to coercing them via tariffs and buy-local and other restrictions). For instance, the three countries could establish an Advanced Technology Industry Funds (ATIF), which would provide incentives to companies in advanced industries and be matched by state and local governments, for building or expanding R&D and advanced production facilities in their respective countries. This would be similar to the incentives program in America’s CHIPS and Science Act, but it would be applied to a broader set of advanced industries. U.S.-headquartered firms, as well as firms from Canada and Mexico, could qualify for incentives. To ensure that the investments are widely distributed geographically, there could be limits on how much each state could receive in matching funds for their incentives, based on their share of the population.
The three countries could also complement this direct grant program with a targeted tax incentive program, as many lawmakers have proposed for the semiconductor industry. For example, the CHIPS and Science Act provides both capital grants and targeted tax credits (i.e., a 25 percent flat tax credit) for investment in a semiconductor manufacturing facility. These kinds of capital-focused incentives are critical because U.S. capital markets today reward firms that take an asset-light strategy. In other words, firms are pressured by Wall Street to shed capital assets to boost returns on net assets. All too often, the firms that keep or grow capital assets are foreign. We see this in the semiconductor industry where the United States leads in the fabless sector of the market, but lags in the capital-intensive fab sector. Absent a serious overhaul of U.S. (and North American) equity markets, providing incentives to invest in assets such as buildings, machinery, and equipment will be needed to restore North American production in capital-heavy advanced industries.
Expand Collaborative Research Between Leading U.S. and Canadian Centers of Innovation
Competitiveness in the innovation economy is heavily informed by a state’s creation of IP, as new IP provides protections that incentivize high-value innovations in technology and production. Firms engaging in international research collaboration tend to generate more valuable research than firms not collaborating in research or only collaborating among domestic firms do. International collaboration provides more prosperous innovations due to a broader pool of advanced human capital that combines different degrees of comparative advancement in scientific research. Further, states diversifying research collaborations with international research partners pool a wider network of knowledge/research/resource linkages and are more effective in the diffusion of innovations.[59]
Currently, the United States’ research collaboration network is most heavily concentrated with EU firms, most densely in France and Germany.[60] Firms of U.S. and Canadian states/provinces should thus pursue greater research collaboration and co-patenting, given the proven benefits in international research collaboration and diversifying with new research partners. Doing so would help expand the network of shared research knowledge to drive more frequent and impactful innovations for both U.S. and Canadian states.
Endnotes
[1] “GDP of North America,” Statistics Times, https://statisticstimes.com/economy/north-america-gdp.php; “North American supply chains: Will reshoring actually happen?” (The Economist Intelligence Unit, 2021), https://economistchina.com/wp-content/uploads/North-American-supply-chains-Will-reshoring-actually-happen.pdf.
[2]. Robert D. Atkinson, “The Competitive Edge: A Policymaker’s Guide to Developing a National Strategy” (Information Technology and Innovation Foundation, December 2017), http://www2.itif.org/2017-competitive-edge.pdf.
[3]. Christopher E. Wilson, “Working Together: Economic Ties Between the United States and Mexico” (Mexico Institute, Woodrow Wilson International Center for Scholars, November 2011), https://www.wilsoncenter.org/sites/default/files/Working%20Together%20Full%20Document.pdf.
[4]. Luis Torres, “Mexico seeks to solidify rank as top U.S. trade partner, push further past China,” Federal Reserve Bank of Dallas, July 11, 2023, https://www.dallasfed.org/research/economics/2023/0711.
[5]. “America is Ready for Reshoring. Are you?: The Tenth Anniversary of Kearney’s Annual Reshoring Index,” Kearny, 2023, https://www.americanchemistry.com/better-policy-regulation/research/insider-insight/catalog-resources/kearney-america-is-ready-for-reshoring-are-you.
[6]. Luis Torres, “Mexico seeks to solidify rank as top U.S. trade partner, push further past China,” Federal Reserve Bank of Dallas, July 11, 2023, https://www.dallasfed.org/research/economics/2023/0711.
[7]. Caroline Freund, Aaditya Mattoo, Alen Mulabdic, and Michele Ruta, “Is US Trade Policy Reshaping Global Supply Chains?” (Preliminary paper, May, 2023, https://www.imf.org/-/media/Files/News/Seminars/2023/fragmentation-conference/session-5-paper-2-reconfiguration-of-global-value-chains.ashx#:~:text=This%20paper%20examines%20the%20reshaping,chains%20remain%20intertwined%20with%20China.
[8]. Ibid.
[9]. Luis Torres, “Mexico seeks to solidify rank as top U.S. trade partner, push further past China,” Federal Reserve Bank of Dallas, July 11, 2023, https://www.dallasfed.org/research/economics/2023/0711.
[10]. “America is Ready for Reshoring. Are you?: The Tenth Anniversary of Kearney’s Annual Reshoring Index,” Kearny, 2023, https://www.americanchemistry.com/better-policy-regulation/research/insider-insight/catalog-resources/kearney-america-is-ready-for-reshoring-are-you.
[11]. [Translated] “Business Opinion on the Relocation of Companies to Mexico,” Central Bank of Mexico, September, 2022, https://www.banxico.org.mx/publicaciones-y-prensa/reportes-sobre-las-economias-regionales/recuadros/%7BE243D1D1-63F5-6C86-38F0-28BD3CF33CE6%7D.pdf.
[12]. Luis Torres and Aparna Jayashankar, “Mexico awaits ‘nearshoring’ shift as China boosts its direct investment,” Federal Reserve Bank of Dallas, April 14, 2023, https://www.dallasfed.org/research/swe/2023/swe2303.
[13]. Lorenzo Caliendo and Fernando Parro, “Estimates of the Trade and Welfare Effects of NAFTA” The Review of Economic Studies Vol 82, Issue 1 (January 2015): 1-44, http://faculty.som.yale.edu/lorenzocaliendo/ETWENAFTA.pdf.
[14]. United Nations Conference on Trade and Development (UNCTAD), “Key Statistics and Trends in International Trade, 2015” (UNCTAD, 2015), http://unctad.org/en/PublicationsLibrary/ditctab2015d1_en.pdf.
[15]. “Global Value Chains and Trade,” The Organization for Economic Cooperation and Development, https://www.oecd.org/trade/topics/global-value-chains-and-trade/.
[16]. Yuqing Xu, “How the iPhone Widens the US Trade Deficit with China,” VOXeu, April 10, 2011, https://voxeu.org/article/how-iphone-widens-us-trade-deficit-china.
[17]. John B. Benedetto, “Implications and Interpretations of Value-Added Trade Balances” (United States International Trade Commission, July 2012), https://www.usitc.gov/publications/332/journals/implicationsand.pdf.
[18]. Yuqing Xing, “Uncovering Value Added in Trade: New Approaches to Analyzing Global Value Chains” (Asian Development Bank, 2016), https://www.adb.org/sites/default/files/publication/173304/adbi-uncovering-value-added-trade.pdf.
[19]. U.S. Census Bureau, “USA Trade Online,” accessed April 12, 2018, https://usatrade.census.gov/; World Input-Output Database, “World Input-Output Tables 2002, 2014,” accessed April 12, 2018, http://www.wiod.org/database/wiots16.
[20]. Ibid.
[21]. U.S. Census Bureau, “USA Trade Online.”
[22]. “UNSD Classifications,” United Nations Statistics Division, accessed July 16, 2018, https://unstats.un.org/unsd/classifications/unsdclassifications/.
[23]. Robert Pastor, “The Future of North America,” Foreign Affairs, July/August, 2008, 89, https://www.foreignaffairs.com/articles/north-america/2008-06-01/future-north-america.
[24]. Gary Hufbauer, Cathleen Cimino, and Tyler Moran, “NAFTA at 20: Misleading Charges and Positive Achievements” (Peterson Institute for International Economics, May 2014), https://www.piie.com/publications/policy-briefs/nafta-20-misleading-charges-and-positive-achievements.
[25]. Robert Pastor, “The Future of North America,” Foreign Affairs, July/August, 2008, 89, https://www.foreignaffairs.com/articles/north-america/2008-06-01/future-north-america.
[26]. OECD, Inter-Country Input-Output (ICIO) Tables, 2021 edition (2018 intermediate use at basic prices, accessed July 13, 2023), https://www.oecd.org/sti/ind/inter-country-input-output-tables.htm.
[27]. Ibid.
[28] Like Dascoli and Stephen Ezell, “The North American Subnational Innovation Competitiveness Index” (ITIF, June 21, 2022), https://itif.org/publications/2022/06/21/north-american-subnational-innovation-competitiveness-index/.
[29]. Robert Atkinson and John Wu, “The 2020 State New Economy Index” (ITIF, 2020), https://itif.org/publications/2020/10/19/2020-state-new-economy-index.
[30]. Abdulla Snobar, “Why Canada's Largest City Has Become A Heavy-Hitting Global Tech Hub,” Forbes, February 19, 2020, https://www.forbes.com/sites/forbestechcouncil/2020/02/19/why-canadas-largest-city-has-become-a-heavy-hitting-global-tech-hub/.
[31]. Vancouver Economic Commission, “Our Focus, Technology,” https://www.vancouvereconomic.com/focus/technology/.
[32]. Beth Jensen, “Mexico City—Latin America’s Future Tech Hub?” Stanford Graduate School of Business, April 21, 2020, https://www.gsb.stanford.edu/insights/mexico-city-latin-americas-future-tech-hub.
[33]. Andreas Waldkirch, “The effects of foreign direct investment in Mexico since NAFTA” (Colby College, March 2008), https://papers.ssrn.com/sol3/papers.cfm?abstract_id=1115300.
[34]. Pablo Mejía-Reyes and Jeanett Campos-Chávez, “Are the Mexican states and the United States business cycles synchronized? Evidence from the manufacturing production” (Economía Mexicana Nueva Época, December 2009), https://www.academia.edu/53296935/Are_the_Mexican_states_and_the_United_States_business_cycles_synchronized_Evidence_from_the_manufacturing_production.
[35]. OECD.Stat. “Business enterprise R&D expenditure by industry,” https://stats.oecd.org/Index.aspx?DataSetCode=BERD_INDU.
[36]. Tecma, “Mexican exports from the State of Chihuahua increase,” https://www.tecma.com/exports-from-the-state-of-chihuahua/.
[37]. Innovation, Science, and Economic Development Canada, 2019; USA Trade Online, 2019; INEGI-EAEF, 2019
[38]. National Science Foundation, “Science and Engineering Indicators 2020” (Table 4-1),” https://ncses.nsf.gov/indicators/data.
[39]. Myeongwan Kim and John Lester, “R&D Spillovers in Canadian Industry: Results from a New Micro Database” (Centre for the Study of Living Standards August 2019), http://www.csls.ca/reports/csls2019-02.pdf.
[40]. Statistics Canada, 2019; INEGI, 2019; National Science Foundation, 2019
[41]. Cascadia Innovation Corridor (connectcascadia.com) & PNWER - Pacific NorthWest Economic Region.
[42]. Greggory Scruggs, “Life sciences leaders see big opportunity for more collaboration across Seattle and Vancouver,” GeekWire, 2021), https://www.msn.com/en-us/health/medical/life-sciences-leaders-see-big-opportunity-for-more-collaboration-across-seattle-and-vancouver/ar-BB1drFdw.
[43]. University of Oregon, “University Innovation Research Fund - Business Oregon | Research and Innovation,” https://research.uoregon.edu/apply/apply-internal-funding/university-innovation-research-fund-business-oregon.
[44]. “Nafta Briefing: Trade Benefits to the Automotive Industry and Potential Consequences of Withdrawal from the Agreement,” (Center for Automotive Research, 2017), http://www.cargroup.org/wp-content/uploads/2017/01/nafta_briefing_january_2017_public_version-final.pdf.
[45]. “The Mexican Automotive Industry's Long History,” Tetakawi, July 6, 2023, https://insights.tetakawi.com/mexican-automotive-industry-history.
[46]. Pinar Cebi Wilber, “NAFTA/USMCA: Past, Present and Future” (American Council for Capital Formation, Center for Policy Research, May 2019), 3, http://accf.org/wp-content/uploads/2019/05/NAFTA-USMCA-Past-Present-And-Future-FINAL.pdf.
[47]. Author’s own calculations using imports data International Trade Center, “Trade Map Database.”
[48]. Oxford Business Group, “Auto parts and metal segments drive innovation in Nuevo León’s manufacturing industry,” https://oxfordbusinessgroup.com/analysis/steel-front-auto-parts-and-metal-segments-continue-drive-innovation-nuevo-le%C3%B3n%E2%80%99s-manufacturing.
[49]. Author’s calculations using Index values.
[50]. Leo Lew, “What is The Arizona Innovation and Technology Corridor?” (ArcGIS, August 2021), https://storymaps.arcgis.com/stories/7f209d9afda846bca02142de08af1d1c.
[51]. The ILS Company, “Take advantage of the growing Sonora corridor”, https://www.ilscompany.com/sonoran-corridor/.
[52]. NAPS, “Cost of Industrial Buildings in Mexico vs. U.S.,” https://napsintl.com/mexico-manufacturing-news/cost-of-industrial-buildings-in-mexico-vs-u-s/.
[53]. Michael Lind, Jon Comola, Anita D’Souza, “Securing America’s Supply Chains: A Proposal for a Trusted Country System in Federal Procurement Policy" (A report for the Strategic Supply Chain Initiative, October, 2022), http://www.wrgh.org/Docs/SSCI_report_SecuringAmericaSupplyChains.pdf.
[54]. 10 U.S.C. § 2500. See generally Heidi M, Peters, “Defense Primer: The National Technology and Industrial Base,” Congressional Research Service, updated February 3, 2021, https://sgp.fas.org/crs/natsec/IF11311.pdf.
[55]. Michael Lind, Jon Comola, Anita D’Souza, “Securing America’s Supply Chains: A Proposal for a Trusted Country System in Federal Procurement Policy" (A report for the Strategic Supply Chain Initiative, October, 2022), http://www.wrgh.org/Docs/SSCI_report_SecuringAmericaSupplyChains.pdf.
[56]. Chen, “A New Dawn? The New Realities of U.S.-Taiwan Economic and Trade Relations,” 7.
[57]. Stephen Ezell, Robert Atkinson, Inchul Kim, and Jaehan Cho, “Manufacturing Digitalization: Extent of Adoption and Recommendations for Increasing Penetration in Korea and the U.S.” (ITIF, August 13, 2018), https://itif.org/publications/2018/08/13/manufacturing-digitalization-extent-adoption-and-recommendations-increasing/.
[58]. U.S. Department of Defense Manufacturing Technology Program, “Digital Manufacturing & Design Innovation (DMDII) Institute,” https://www.dodmantech.com/Institutes/DMDI.
[59]. Ronald S. Burt, "Structural Holes and Good Ideas." (American Journal of Sociology, 2004), https://www.bebr.ufl.edu/sites/default/files/Structural%20Holes%20and%20Good%20Ideas_0.pdf.
[60]. Takashi et al., “How Does the Global Network of Research Collaboration Affect the Quality of Innovation?” (RIETI Discussion Paper Series, October 2018), https://www.rieti.go.jp/jp/publications/dp/18e070.pdf.
