
Assessing the Evolving Global Competitiveness of the US Auto Industry
To win the techno-economic competition with China, America must be able to assess the factors impacting the global competitiveness of its advanced-technology industries. Using the auto industry as a template, U.S. competitiveness has faltered considerably.
KEY TAKEAWAYS
Key Takeaways
Contents
The Importance of the U.S. Auto industry 4
What Happened to the Once Globally Dominant U.S. Auto Industry? 7
The Decline of the Big Three U.S. Automakers 8
The Evolution of the Auto Industry of the United States 12
International Comparisons of U.S. Auto Industry Competitiveness 20
Assessing U.S. Auto Industry Competitiveness Since 2010. 34
Introduction
If the United States is to win in the ever-intensifying techno-economic competition against China, the federal government is going to have to cultivate the ability to conduct deep and comprehensive industry-level analysis into the health of its national economic power industries.[1] That means understanding every facet of industrial health, domestically and internationally. Domestically, it entails understanding the extent and change in industry output and value added, productivity and quality levels, capital and research and development (R&D) intensity, wage and employment trends, and measures of product and process innovation capacity. Internationally, it means assessing how U.S. industries are faring in global marketplaces in terms of their share of global output and their market share in third-party markets, location quotients (LQs), productivity levels, trade balances, and how foreign imports are affecting U.S. competitiveness.
This isn’t about developing five-year plans for U.S. industries (as China does) but it does mean having a public sector with deep analytical capability (as China does) to understand the health of American advanced industries so that more effective policies can be developed to support the competitiveness of specific industries. While generic policies, such the R&D tax credit, can help all advanced industries, to effectively support U.S. national economic power industries in their struggle with China, more detailed and industry-specific analysis and policies are needed.
When U.S. companies are competing against state-backed competitors in high-tech industries, it’s imperative the U.S. government understand where and how to best support U.S. industries in that global competition.
That matters because it’s no longer companies competing against other peers in global marketplaces; rather, it’s increasingly about U.S. enterprises competing against Chinese companies that are backed directly by the Chinese government through massive industrial subsidies, intellectual property (IP) theft, and other marketing-distorting measures.[2] When U.S. companies are competing against state-backed competitors in high-tech industries, it’s imperative the U.S. government understand where and how to best support U.S. industries in that global competition.
This is the first in a series of three reports that will examine the evolving global competitiveness of America’s auto industry. The first report will examine “what’s happened” to America’s auto industry since the 1960s, the second report will examine the reasons for faltering U.S. auto industry competitiveness (i.e., explain why what has happened has happened), and the third report will lay out a national competitiveness strategy for the U.S. auto industry, replete with specific policy recommendations.
This report proceeds by first explaining the importance of the U.S. auto industry. It then examines what happened to the once globally dominant U.S. auto industry. In doing so, it first examines what has happened to the competitiveness of the Big Three automakers—Ford, General Motors (GM), and Chrysler (now Stellantis)—before examining what’s happened to the overall U.S. auto industry. It then examines the state of international auto industry competition, including in the electric vehicle (EV) sector.
The Importance of the U.S. Auto industry
The auto industry is one of America’s most important sectors. The U.S. automotive ecosystem—including direct, indirect, and induced value added—contributes over $1.2 trillion to the U.S. economy annually, or roughly 5 percent of U.S. gross domestic product (GDP), while automobile manufacturing itself contributes $360 billion to the U.S. economy. The industry further produces significant multiplier effects: for every $1 added to the economy by auto manufacturing, an additional $4.23 in economic value is created.[3] Automobile manufacturing itself supports 2.4 million U.S. jobs, and the industry supports 10.1 million total jobs when direct, indirect, and induced factors are considered, meaning the industry accounts for roughly 1 in every 20 U.S. jobs.[4] Motor vehicles and auto parts (together) represent America’s second-largest export industry, accounting for $143 billion of U.S. goods exports in 2023.[5] The United States shipped nearly $42 billion more in vehicles and parts in 2023 than it did in 2008, as exports of motor vehicles and parts from U.S. ports to destinations around the word increased 33 percent during that timeframe.[6] The industry invests about $32 billion in R&D annually, the fourth-highest amount of any manufacturing sector.[7]
The U.S. automotive ecosystem contributes over $1.2 trillion to the U.S. economy and supports about 1 in every 20 American jobs.
America’s automotive industry is further foundational to the U.S. industrial base, which is why the Information Technology and Innovation Foundation (ITIF) classifies it as a key “enabling industry” to America’s national economic power, as the following box details.
Defining National Economic Power Industries
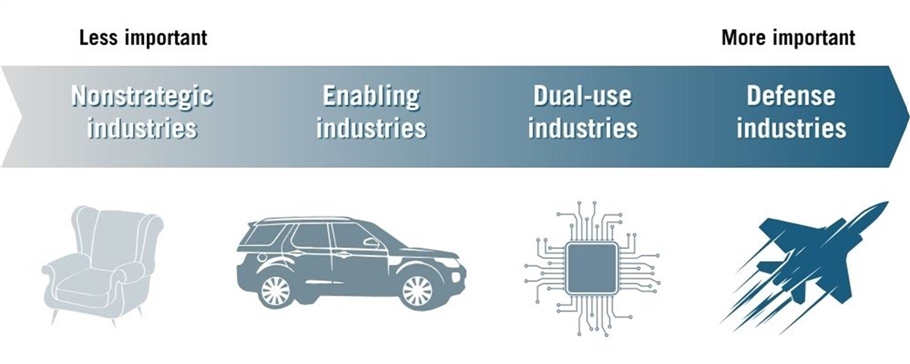
The conventional view is that the only industries that matter to national power are defense industries. But that is now vastly too limiting. As Corelli Barnett wrote, “For munitions production for modern war is not primarily a question of specialized armament industries, as some suppose, but of all those varied industrial and scientific resources that in peacetime make for a successful and expanding export trade.”[8] As such, ITIF has developed a classification of U.S. industries for their relevance to national power.[9] This can be viewed as a continuum between defense industries on one side and nonstrategic industries on the other, with strategic dual-use industries and strategic enabling industries in the middle. (See figure 1.)
At one end of the continuum are defense industries. Clearly industries such as ammunition, guided missiles, military aircraft and ships, tanks, drones, defense satellites, and others are strategic. Not having world-class innovation and production capabilities in these industries means a weakened military capability. Policymakers across the aisle generally (with the exception of the isolationist Right and the pacifist Left) agree that these industries are strategic and that market forces alone will not produce the needed results.
At the other end of the spectrum are industries in which the United States has no real strategic interests. These include furniture, coffee and tea manufacturing, bicycles, carpet and rug mills, window and door production, plastic bottle manufacturing, wind turbine production, lawn and garden equipment, sporting goods, jewelry, caskets, toys, toiletries, running shoes, etc. If worst came to worst and our adversaries (e.g., China) gained dominance in any of these industries and decided to cut America off, we’d survive—in part, because none of these are critical to the functioning of the U.S. economy, as many are final goods that might inconvenience consumers but wouldn’t cripple any industries, and also because, in most cases, domestic production could be started or expanded relatively easily because none of these products are all that technologically complex from either a product or process standpoint and the barriers to entry are relatively low.
Figure 1: Industrial power scale
Next to defense industries, dual-use industries are critical to American strength. Losing aerospace, pharmaceuticals, chemicals, semiconductors, displays, advanced software, fiber optic cable, telecom equipment, machine tools, motors, measuring devices, and other dual-use sectors would give our adversaries incredible leverage over America. Just the threat to cut these off (assuming that they have also deindustrialized our allies in these sectors) would immediately bring U.S. policymakers to the bargaining table. National power industries tend to also need global scale in order to complete. Moreover, many are intermediate goods such as semiconductors and chemicals, wherein a cutoff would cripple many other industries. Finally, these industries are hard to stand up once they’re lost because of the complexity of the production process, product knowledge, and the importance of the industrial commons that support them. In other words, barriers to entry are high, and if lost, they would be very difficult and expensive to reconstitute.
Finally, there are enabling industries. These are industries wherein, if the United States were cut off, the immediate effects on military readiness would be small—and the U.S. economy could survive for at least a while without that production. America could survive for many years without an auto sector, as we would all just drive cars longer. But because of the nature of these industries—including technology development, process innovation, skills, and supporting institutions—their loss would harm both dual-use and defense industries. This is because enabling industries contribute to the industrial commons that support dual-use defense industries. A severely weakened motor vehicle sector would weaken the tank and military vehicle ecosystem. Similarly, a weakened commercial shipbuilding sector would weaken (and has weakened) military shipbuilding. A weakened consumer electronics sector weakens military electronics.
A part of enabling industries is a core set of industries that make up the “industrial commons” —sometimes called the “mother industries.” These include machine tools and dies, metal and alloy fabrications, injection molding, electronic packaging, specialty chemicals, etc. These are core to converting lab technologies into commercial products, building new supply chains, and scaling up U.S. production capacity. And the United States has lost them substantially. They also seem to be in the blind spot of both policymakers and capital investors because they are not the “new shiny toy.”
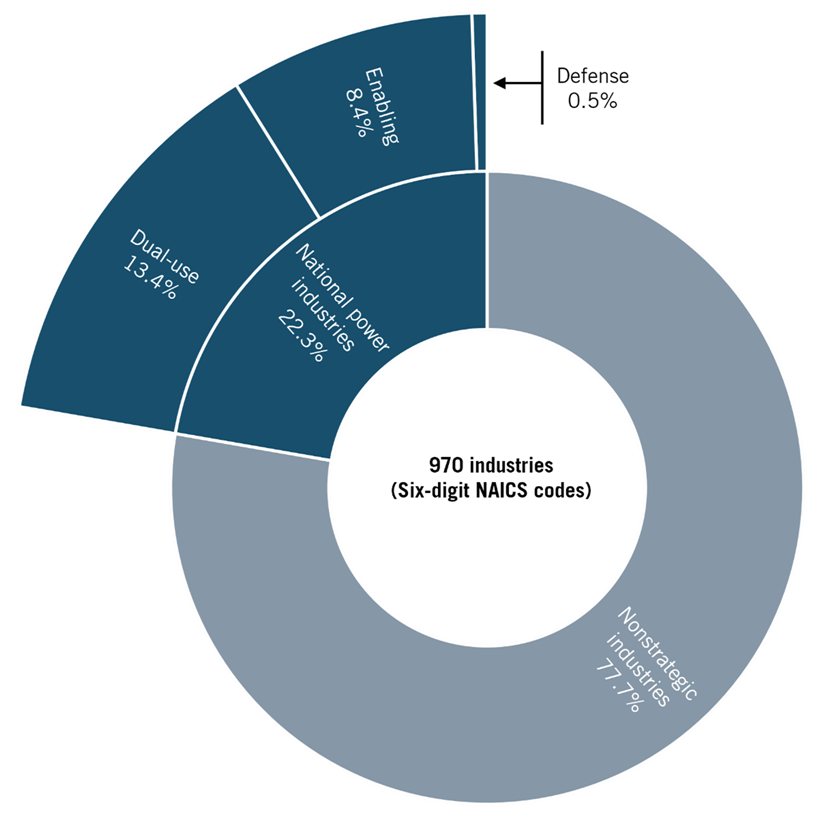
ITIF has placed the 970 industries classified by the North American Industry Classification System (NAICS) codes into the four categories.[10] Power industries account for 22.3 percent of the industries. Most industries are not power industries, in large part because most are nontraded sectors such as law firms and barber shops. Of the 22.3 percent that are power industries, just 0.5 percent are defense industries, and 13.4 percent are dual use. The remaining 8.4 percent are enabling industries. In terms of employment, in 2022, just 9.5 percent of workers were employed in power industries. Of this, 6.4 percent worked in dual-use industries and 2.9 percent in enabling industries, and just 0.2 percent were employed in defense industries. (See figure 2.)
Figure 2: Six-digit NAICS industries by national power type
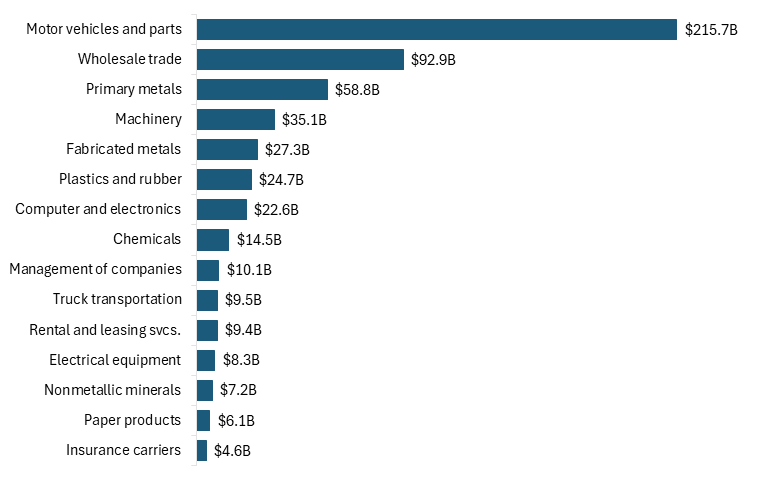
The health of the U.S. auto industry is vital to the health of a number of other downstream industries in the U.S. economy. The industry supports the core of U.S. metal working (e.g., steel and aluminum) and related production capabilities and is a key customer of machine tools, plastics, rubber, electronics, and semiconductor industries, among others. In fact, the U.S. motor vehicles industry produces $591 billion in intermediate value in upstream industries, such as supporting $58.8 billion in output from America’s primary metals industry, $35 billion in machinery manufacturing, $27.3 billion in fabricated metals, $24.7 billion for the plastics and rubber industry, $22.6 billion for computers and electronics, and $14.5 billion for chemicals. (See figure 3.)
Figure 3: Value of commodities used by the U.S. motor vehicle industry[11]
What Happened to the Once Globally Dominant U.S. Auto Industry?
While the automobile was not invented in America—Carl Benz developed the first production series gasoline-powered vehicle in Germany in 1886—the modern automobile industry flourished in the United States, notably in Michigan in the first three decades of the 20th century, as Detroit became the startup capital of the United States. Over 125 auto companies sprang up in Detroit in the early 20th century as the city’s population increased almost sixfold between 1900 and 1930.[12] Henry Ford pioneered the assembly line in 1913, reducing the time for Model T assembly from over 12 hours to 93 minutes, introducing production efficiencies that enabled Ford to offer $5 hourly wages to workers (before, workers were making only about $2.50 an hour).[13]
The U.S. auto industry would reach its zenith in the post-World War II years. In 1950, the United States accounted for 76 percent of global vehicle production.[14] U.S. automakers commanded nearly 95 percent of the U.S. market through most of the 1950s, with just a few imports coming mainly from Germany and the United Kingdom. However, the industry would enter a period of relative decline beginning in the mid-1960s and extending at least through the next three decades.
The following sections of this report present data demonstrating the relative decline of the auto industry of the United States, which occurred from roughly the mid-1960s onward. The report examines the decline of the Big Three automakers, documents the impact of growing import competition from foreign automakers starting in the 1970s, considers the growth of transplants producing in the United States especially starting in the 1990s, and considers the growing international competition from Mexico and China from the 2010s to today.
In other words, from 1965 to 2000, the prevailing dynamic was import and then transplant competition from Japanese, European, and South Korean automakers—and the inability or unwillingness of the Big Three to adequately or effectively respond to it—while in the past 15 years, the challenge has evolved into both offshoring to low-cost production hubs and the China overcapacity/EV challenge, with the U.S. industry now having to adapt to this new set of challenges.
The next report in this series will offer a causal analysis of U.S. auto industry decline, whereas this report presents more the facts of it.
The Decline of the Big Three U.S. Automakers
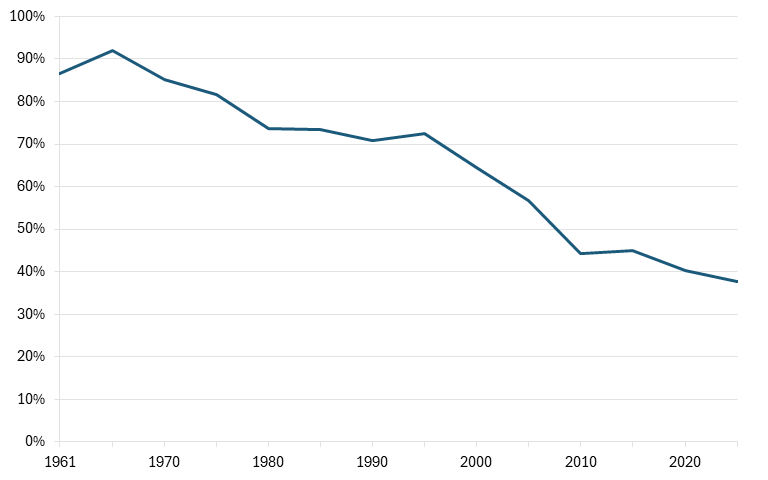
As late as 1965, the Big Three U.S. automakers accounted for 92 percent of the domestic auto market. But the market-share dominance of America’s Big Three automakers would decline significantly over the ensuing decades, falling to 45 percent by 2015, less than half the share of a half-century before. By 2024, the Big Three’s share of the U.S. auto market would slip even further, down to 38 percent. (See figure 4.)
Figure 4: Big Three U.S. automakers’ share of the U.S. auto market (cars and light trucks), 1961–2024[15]
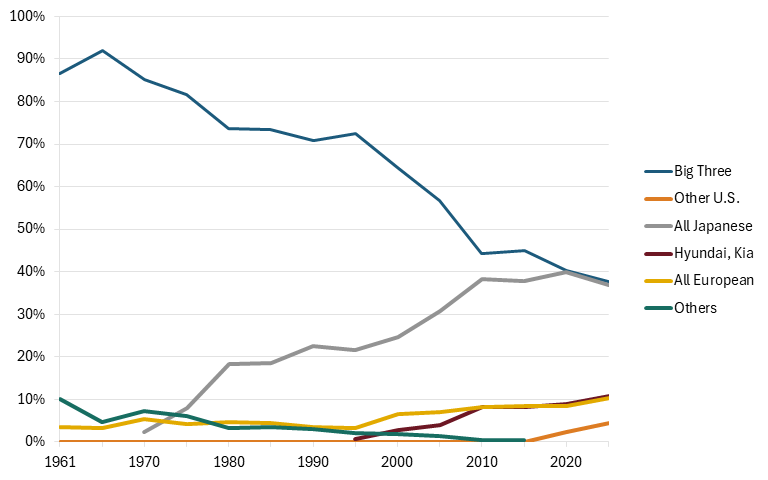
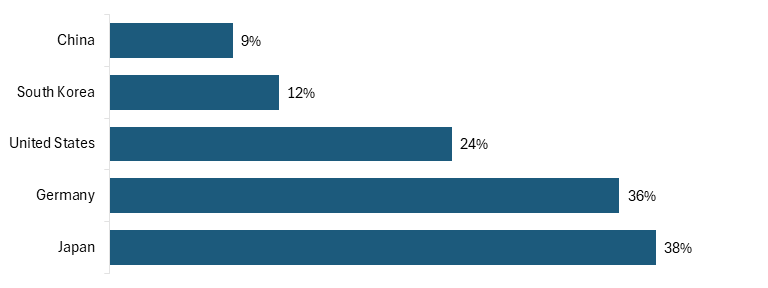
In particular, GM’s share of the U.S. market fell significantly, from 51 percent in 1962—and 46 percent as late as 1978—to just 17 percent by 2016. Ford’s share fell by half from 29 to 14 percent. Chrysler (later Stellantis) would see a smaller decrease in share, from 10 to 8 percent.[16] By 2024, Japanese automakers would have almost as large a share of the U.S. automotive market, 37 percent, as the Big Three, at 38 percent. Meanwhile, by 2024, South Korean companies held an 11 percent share of the U.S. auto market and European companies collectively a 10 percent market share. (See figure 5.)
Figure 5: Automakers’ share of U.S. auto market (cars and light trucks), 1961–2024[17]
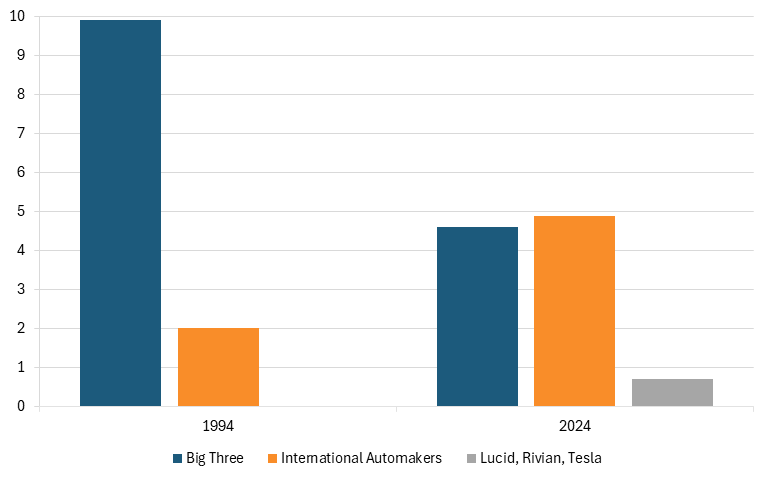
However, over the past three decades, the Big Three’s decline has been particularly marked by the decline of their production of automobiles in the United States. In 1994, America’s Big Three automakers manufactured 9.9 million vehicles in the United States, which was five times more than the 2 million vehicles manufactured by international automakers (i.e., transplants) producing in the United States. However, by 2024, the Big Three automakers would manufacture just 4.6 million vehicles in the United States (a decline of over 50 percent of their U.S. production from 1994), and this output would be even lower than the 4.87 million vehicles produced by international automakers operating in the United States (although new U.S. automakers such as Lucid, Rivian, and Tesla would chime in with about 700,000 new U.S. vehicles produced). (See figure 6.)
Figure 6: Auto production in the United States, by select groupings of firms (millions of units), 1994 & 2024[18]
Over the past three decades, the Big Three’s decline has been particularly marked by the decline of their production of automobiles in the United States.
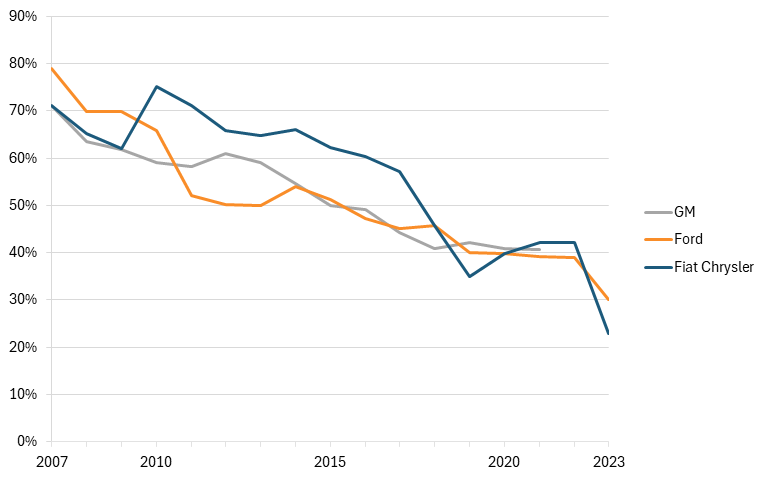
At the same time, the Big Three automakers continue to use progressively less American- or Canadian-made content in their vehicles. The share of U.S.-or Canadian-made content in GM vehicles has fallen from 73 percent to about 40 percent in recent years. Ford and Fiat Chrysler (i.e., Stellantis) vehicles have seen their share of American-made content fall to 30 percent and 23 percent, respectively. (See figure 7.)
Figure 7: Percentage of Big Three automakers’ total car value made with U.S. or Canadian parts, 2007–2023[19]
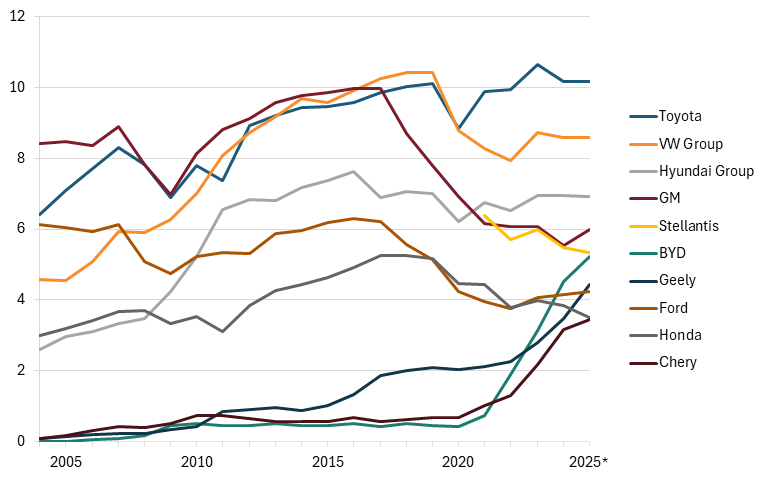
In 2004, GM led the world with the most vehicle sales, at 8.4 million, and Ford placed third, with 6.1 million vehicle sales, just slightly behind Toyota’s 6.4 million. However, by November 2025, GM would fall to fourth in global vehicle sales and Ford to eighth. Over those years, GM’s global sales would drop from 8.4 million units in 2004 to 6 million units in 2024, a roughly 30 percent decline. Ford’s sales would drop from 6.1 million to 4.2 million units, a decline of 32 percent.
By the end of November 2025, Toyota, Volkswagen, and Hyundai had become the top three global automakers by units sold. Toyota increased sales by over 35 percent from 6.4 million to 10.1 million units, while Volkswagen nearly doubled unit sales from 4.5 million units to 8.5 million units. Chinese automakers experienced tremendous growth in sales over this period. BYD increased from virtually nothing to over 5.2 million units sold, while Geely increased its sales to 4.4 million units and Chery grew to rank 10th in global sales with 3.5 million. (See figure 8.)
Figure 8: Top 10 global automotive firms by unit sales, millions of units, 2004–November 2025[20]
The Evolution of the Auto Industry of the United States
Of course, tracing the evolution of the Big Three automakers tells much about how the competitiveness of the U.S. auto industry has evolved over the past 60 years; but as noted, that story is incomplete thanks to the rise of foreign automakers producing in the United States. This section examines the performance of the overall auto industry of the United States considering the contributions of all automakers, both domestic and foreign.
It starts by examining domestic production and sales in the U.S. automotive industry and then the imported vehicle share of the U.S. auto market, the value of U.S. auto exports as a share of the value of U.S. automotive production, and America’s trade balance (in real dollars) in passenger vehicles. It concludes by examining U.S. auto industry employment and the LQ of the sector.
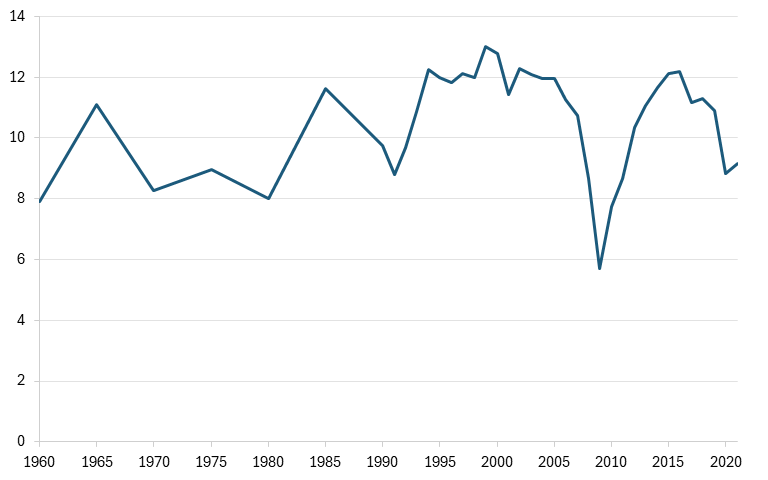
The Bureau of Transportation Statistics provides data on the number of passenger vehicles manufactured in the United States each year since 1960 (with data available through 2021). This figure reached 11 million units in 1965 before declining to around 8 million to 9 million vehicles annually in the following two decades—the decrease being, arguably, at least in part a reflection of intensified Japanese import competition during those decades, although of course business cycles, stagflation, and the oil crisis in the mid- to late-1970s also contributed to this decline. Production peaked at 11.6 million units in 1985, then rose to an all-time high of 13 million units in 1999. Production slid slightly in the 2000s before cratering as the Great Recession (2007–2009) hit, dropping to just 5.7 million units annually. The industry then recovered and enjoyed a relatively productive decade in the 2010s (as explained subsequently) before COVID-19 hit. As a relatively expensive durable goods product, industry production has always been highly cyclical. (See figure 9.)
Figure 9: U.S. domestic production of passenger cars (millions of units), 1960–2021[21]
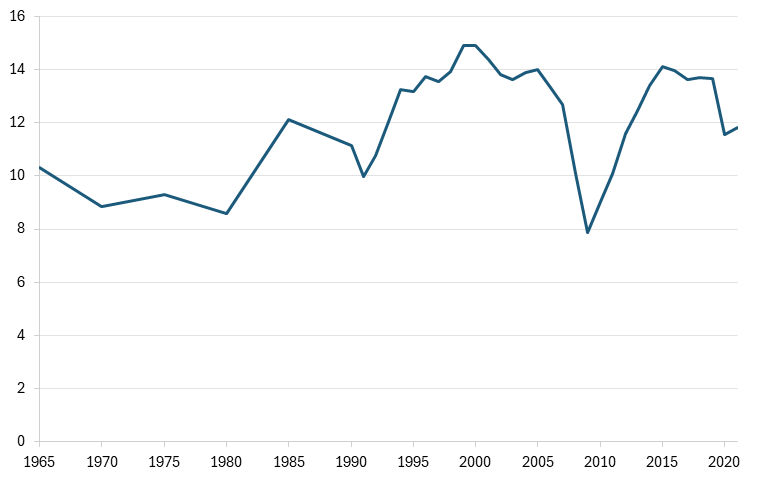
U.S. domestic sales of passenger cars largely tracks production of vehicles, also exhibiting a degree of cyclicality. This figure started with 10.3 million sales in 1965, rose to 12 million in 1985, and reached an all-time high of 14.9 million in 2000, before sinking to just under 8 million vehicles in the wake of the Great Recession. Domestic vehicle sales would recover to 14 million units by 2015, but then fall back to 11.8 million units by 2021. (See figure 10.)
Figure 10: U.S. domestic sales of passenger cars (millions of units), 1965–2021[22]
A defining characteristic of the U.S. auto market starting in the 1970s was the dramatic rise in imported vehicle competition, as ever since, foreign-produced vehicles have constituted a generally ever-growing share of the U.S. auto market. In 1970, imported (nontruck) vehicles accounted for just 15 percent of the U.S. automotive market—although this share had doubled to 30 percent by 1987—and while it dipped in the late-1990s and dipped again leading up to and during the COVID-19 crisis, by 2024, the share was back to 32 percent. (See figure 11.)
Figure 11: Imported vehicle share of U.S. automotive market, 1970–2024[23]
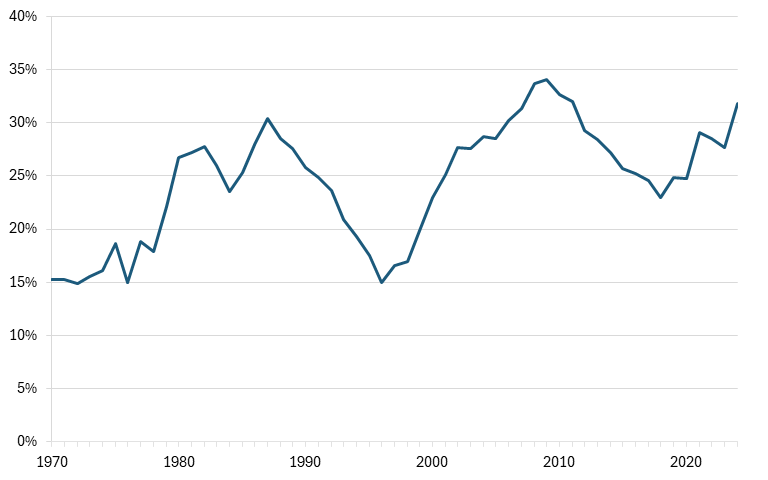
Notably, as figure 9 shows, from 2016 to 2021, the number of domestically produced vehicles fell from 12.2 million units to 9.2 million units, a 25 percent decline; conversely, from 2016 to 2024, the share of imported vehicles in the U.S. auto market grew from 25 percent to 32 percent (figure 10), an increase of 26 percent, demonstrating the intensifying competition from vehicles manufactured abroad (whether by foreign or U.S. manufacturers) and its effect on domestic production.
Cars sold in the United States increasingly incorporate fewer U.S.- or Canadian-made parts and components. In 2007, cars sold in the United States contained 38 percent U.S.- or Canadian-parts on average; that portion declined to 18 percent by 2023. (See figure 12.)
Overall, in 2024, Americans purchased approximately 16 million cars, SUVs, and light trucks, and about 50 percent of those vehicles, or 8 million units, were imports. Of the other 8 million vehicles assembled in America and therefore not imported, the average domestic content can be conservatively estimated at only 50 percent and is likely closer to 40 percent. Therefore, of the 16 million cars bought by Americans, likely only about 25 percent of the vehicle content can be categorized as American made.[24]
Figure 12: Percentage of total car value sold in United States with U.S. or Canadian parts[25]
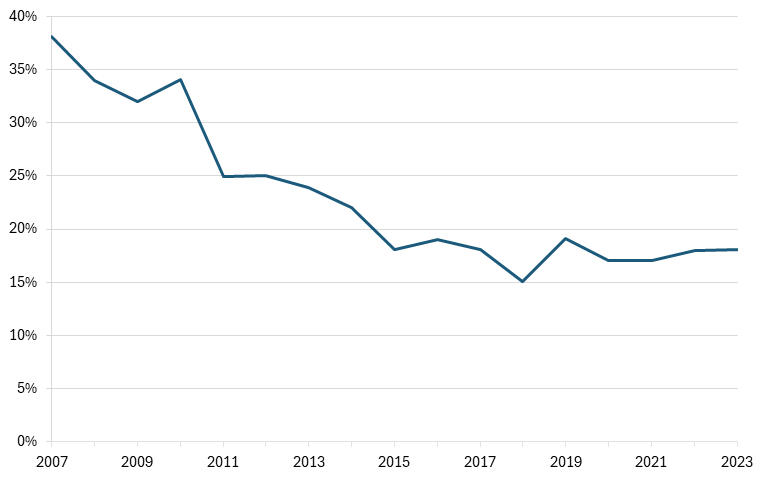
In 2007, cars sold in the United States contained 38 percent U.S.- or Canadian-parts on average; that portion declined to 18 percent by 2023.
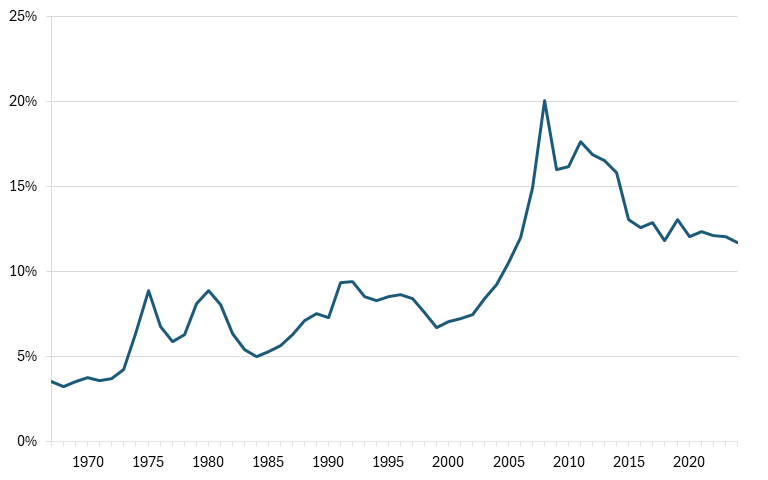
The United States has actually never been a very significant auto-exporting nation. In fact, from 1967 to 2004, the value of U.S. automotive exports as a share of production value never exceeded 10 percent. That this share rose over 20 percent briefly in the late 2000s was largely a reflection of demand contraction after the Great Recession, as, by 2024, the share again had receded to 12 percent. (See figure 13.) The subsequent paper in this series will explain this dynamic in further detail, but it largely pertains to the distinctives of U.S. auto market demand (i.e., preferences for larger, gas-based vehicles) and also the fact that, historically, U.S. automakers would operate subsidiaries in foreign markets to supply foreign demand (e.g., GM’s Opel or Ford of Europe.) This dynamic—minimal U.S. auto exports—played a role in the burgeoning U.S. auto trade deficit that unfolded over these decades, as the following chart shows.
Figure 13: U.S. automotive exports as a share of automotive output, 1967–2024[26]
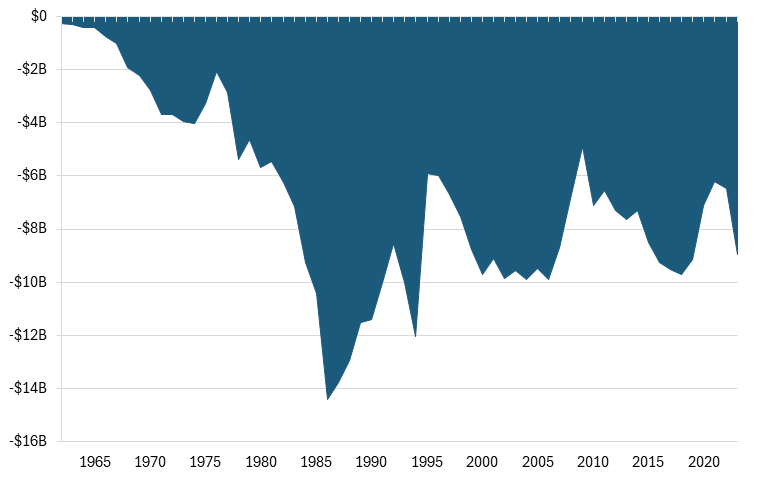
Over the 60 years from 1963 to 2023, the United States ran a consistent trade deficit in passenger vehicles in real (i.e., inflation-adjusted) terms. In 1970, this deficit was just $2.8 billion dollars, but by 1986 it had ballooned to $14.4 billion, an over fivefold increase, clearly demonstrating the effect of foreign, notably Japanese, import competition throughout the 1970s and 1980s. By the early 2000s, this deficit had abated somewhat yet had still generally remained in excess of $8 billion every year from 2003 to 2023. In total, over this 60-year period, the accumulated U.S. motor vehicles trade deficit reached $425 billion. (See figure 14.)
Figure 14: U.S. real trade balance in passenger vehicles (1970 dollars), 1963–2023[27]
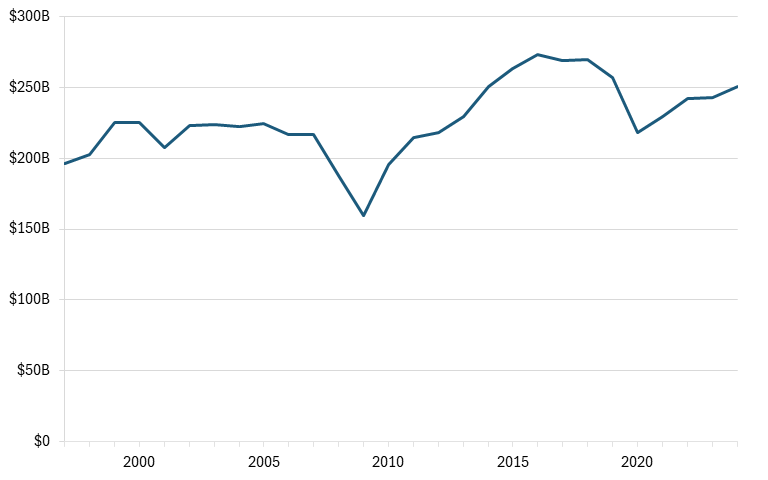
Auto parts represent a very significant component of a nation’s broader auto manufacturing sector, so examining their output and trade measures is important when making a comprehensive analysis of a country’s full automotive industry. Regarding auto parts output, according to U.S. Bureau of Economic Analysis data, the United States manufactured $250.7 billion in auto parts in 2024, slightly down from a pre-COVID high of $273 billion in 2016, but rebounded from a COVID low of $218 billion.[28] From 1997 to 2024, U.S. real output in motor vehicle parts increased from $196 billion to $250 billion, a rise of 22 percent. (See figure 15.)
Figure 15: Real output in motor vehicle parts manufacturing (2017 dollars), 1997–2024[29]
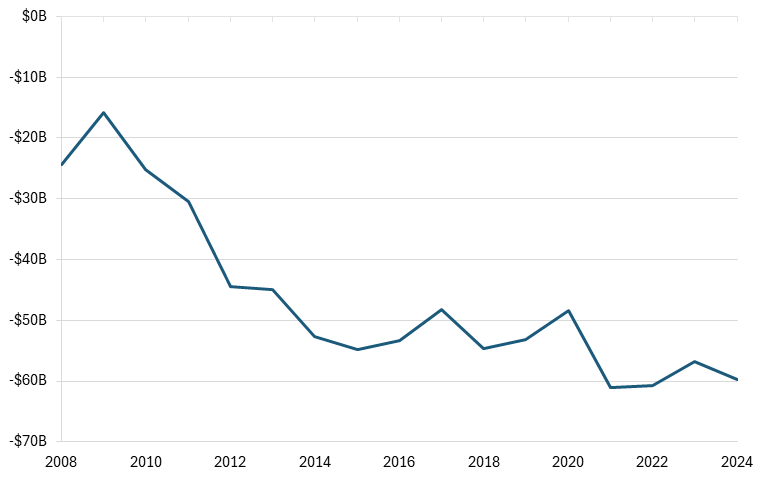
Despite increasing output, since 2008, the U.S. trade balance in auto parts (in real terms) has turned decisively negative, increasing from a deficit of just $15.7 billion that year to a deficit of $60 billion by 2024, an almost 1.5-fold increase in the deficit. (See figure 16.)
Figure 16: Real U.S. trade balance in auto parts, (2008 dollars), 2008–2024[30]
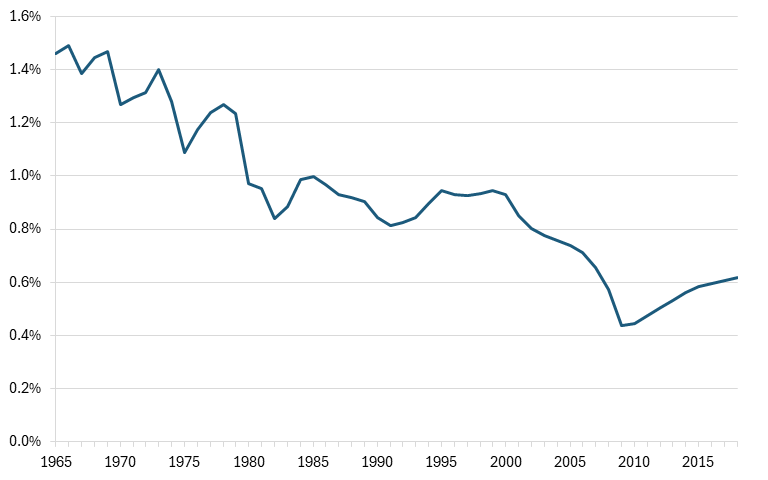
When examining manufacturing employment in U.S. motor vehicle industries as a share of the total U.S. labor force, a sustained and ongoing decline is clear, from a high of 1.5 percent in 1966 to a nearly 50 percent decline to 0.8 percent by 1982. While this share would stabilize between 0.8 percent and 1 percent from 1980 to 2004, the sector’s share of total U.S. labor force employment reached a nadir of 0.4 percent in 2009 in the wake of the Great Recession, and had only recovered to 0.6 percent by 2018.
Figure 17: U.S. motor vehicle, trailer, and semi manufacturing jobs as a share of total labor force, 1965–2018[31]
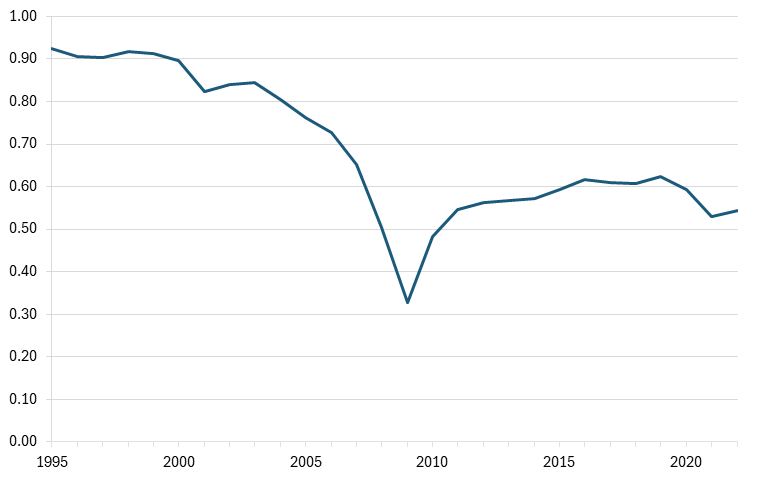
An LQ measures any region’s level of industrial specialization relative to a larger geographic unit—in this case, an industry within a country relative to the rest of the world.[32] An LQ of 1 for a given industry indicates that that industry contributes as much to a nation’s economy as it does to the global economy. The indicator thus demonstrates countries’ relative specializations in certain industries and how those nations’ industries are performing compared with the global norm.
With an LQ of 0.54, the U.S. auto industry today contributes a little over half as much to the U.S. economy as to the global economy.
Starting in 1995 (the earliest year for which this data is available), the United States posted an LQ of 0.92, meaning the U.S. auto industry contributed almost as much (just 8 percent less) to the U.S. economy as the global industry contributed to global GDP. However, by 2007, that share had dipped to 0.65; it would crash to a nadir of 0.33 during the Great Recession, and only recover to 0.54 by 2022, meaning the U.S. auto industry today contributes a little over half as much to the U.S. economy as the global industry does to the global economy. Notably, over the 28-year period, the U.S. auto industry never achieved an LQ over 1, largely a symptom of the weak export ability of American auto manufacturers, as previously noted. (See figure 18.)
Figure 18: Location quotient of the U.S. automotive industry, 1995–2022[33]
International Comparisons of U.S. Auto Industry Competitiveness
This section provides data examining the international competitiveness of the U.S. auto industry against that of other leading nations. It begins by examining LQs, value added, market share, and production (for which the Organization for Economic Cooperation and Development (OECD) provides data from 1995 to 2022).
Location Quotient, Global Value Added, and Global Market Share
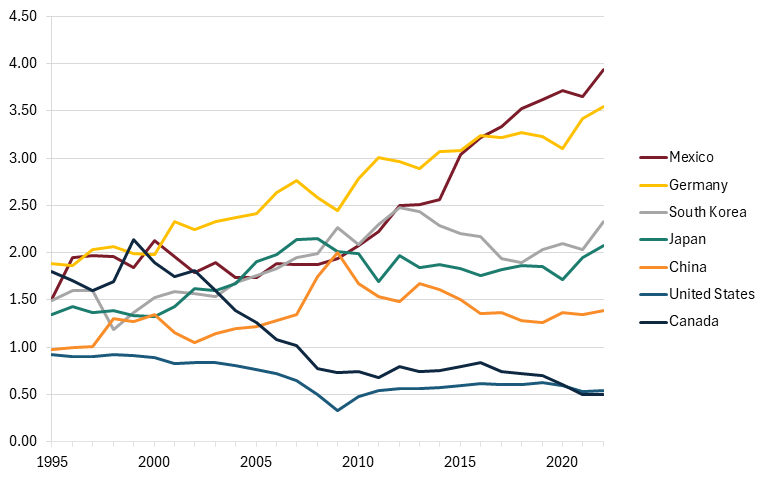
As noted, from 1995 through 2022, the United States’ motor vehicle LQ significantly faltered while it increased notably for peer nations. By far the biggest LQ riser over this period was Mexico, which saw its LQ rise over 2.5-fold from 1.51 to 3.94. Germany’s motor vehicles LQ, already strong at 1.89 in 1995, rose to 3.54; similarly, Japan’s LQ increased from 1.34 to 2.08. China’s LQ rose modestly from 0.97 to 1.39, and South Korea’s from 1.5 to 2.33 (a 56 percent increase). Canada’s LQ cratered from 1.8 in 1995 to 0.5 by 2022. (See figure 19.)
From 1995 to 2022, China’s share of global automotive vehicle output skyrocketed eightfold, from 3 percent to 25 percent, while the U.S. share slid from 23 percent to 14 percent.
It’s important to note that in these statistics there’s a significant difference between ownership of production and location of production. For instance, Mexico lacks indigenous flagship automakers, so the growth of Mexico’s LQ (and value added, as shown next) over this period is largely the result of U.S. automakers and auto parts manufacturers setting up operations in Mexico over the past three decades (and in later years, Chinese automakers doing so as well). (The subsequent report in this series will further explain these dynamics.)
Figure 19: Selected countries’ LQs in motor vehicles (1995–2022)[34]
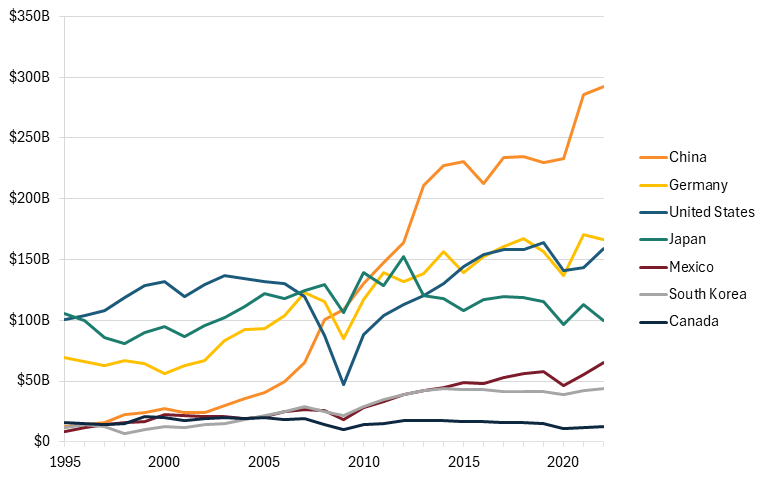
From 1995 to 2022, value added output from the U.S. automotive industry grew nearly 60 percent, from $100 billion to $159 billion (while U.S. GDP grew by 93 percent over that timeframe). However, over that period, China’s output grew 23-fold from just $12 billion to a world-leading $292 billion, nearly twice the output of the United States. Germany’s output increased 139 percent from $69 billion to $166 billion over this period. Japan’s value added started at $105 billion in 1995 and ended 2022 at $100 billion, down after a peak of $152 billion in 2012. South Korea’s output grew nearly fourfold from $12 billion to $42 billion over this timeframe, while Mexico’s value added grew more than sixfold from $8 billion to $65 billion. (See figure 20.)
Figure 20: Value added output of nations’ automotive sectors (billions), 1995–2022[35]
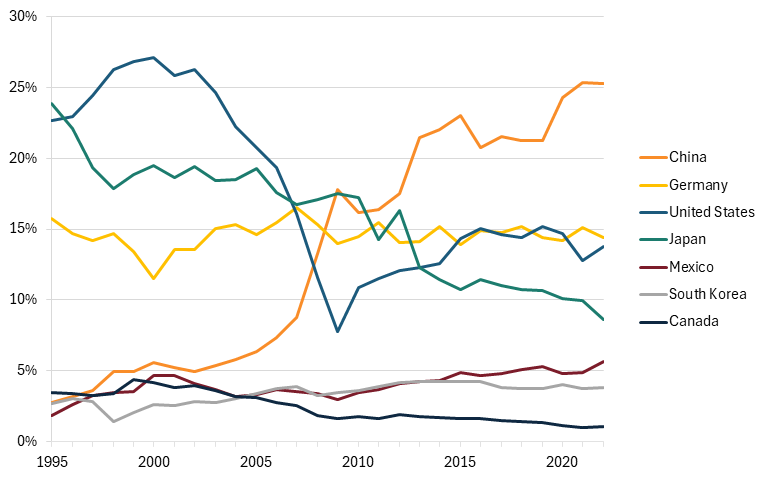
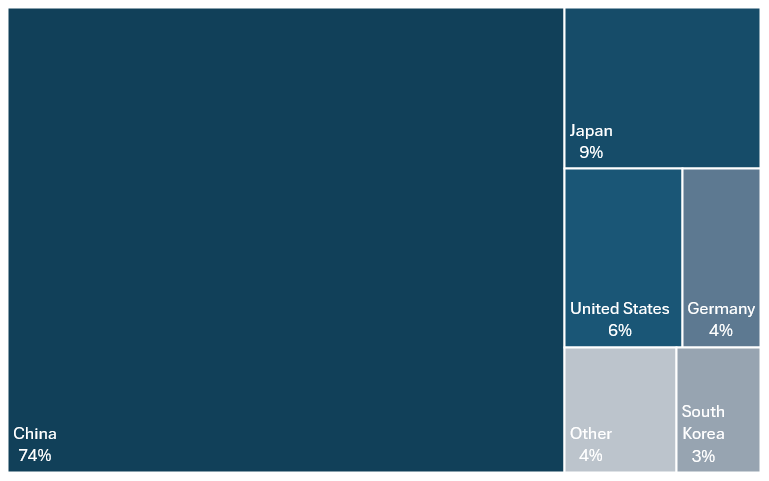
The U.S. share of total global automotive output fell by two-fifths from 1995 to 2022, from a 23 percent share in 1995 (and a high-water mark 27 percent share in 2000) to a 14 percent share in 2022, rebounding from a nadir of 8 percent in 2009 in the wake of the global financial crisis. (See figure 21.) Similarly, Japan’s share of the global automotive industry fell by nearly two-thirds over this period, from 24 percent to 9 percent. Germany’s share remained consistent over this timeframe, mostly stable around the 15 percent market share range. Once again, the tremendous rise came from China, which saw its share of global automotive output skyrocket from just 3 percent in 1995 to 25 percent in 2022, an eightfold increase. Mexico actually tripled its share of global automotive production over this period, albeit from just 2 to 6 percent.
Figure 21: Countries’ share of global automotive vehicle output, 1995–2022[36]
International Vehicle Production and Sales
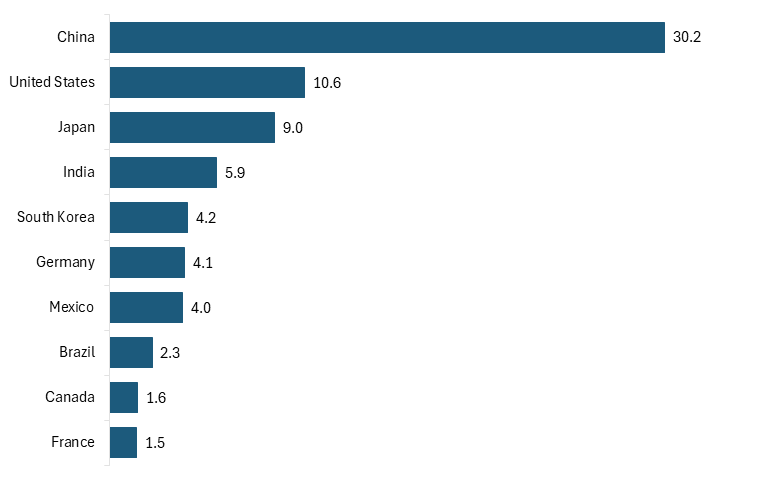
China’s increasingly dominant share of global automotive vehicle output is a reflection of the fact that it has grown to be the world’s leading automotive producer. In 2023, China led the world in automotive production by a significant degree, manufacturing over 30 million vehicles, almost three times more than the United States’ production of 10.6 million vehicles, and well ahead of Japan’s output of just under 9 million vehicles. (See figure 22.)
More than 90 percent of auto production in China, Germany, Japan, and South Korea is by companies headquartered in that country; for the United States, that figure is 44 percent.
Figure 22: Vehicle output of world’s top 10 auto-producing nations (millions of units), 2023[37]
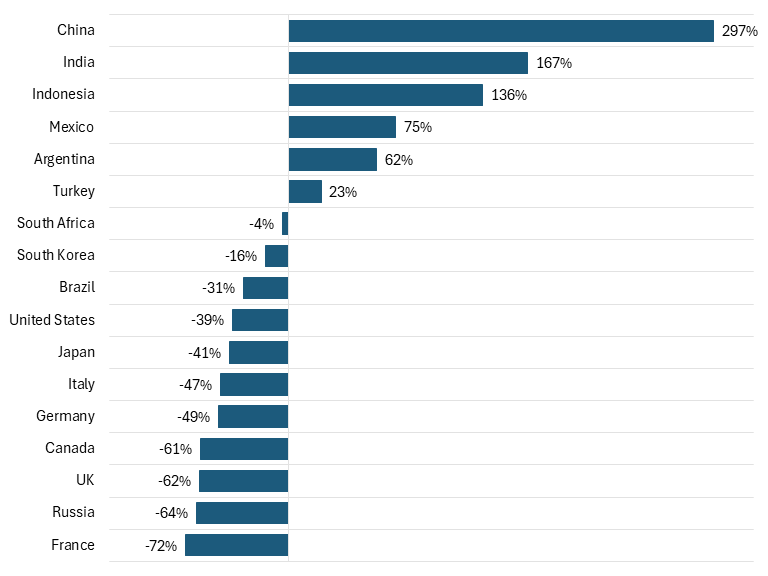
Between 2003 and 2023, U.S. vehicle output fell by 1.3 million units (from 11.9 million to 10.6 million units), resulting in a 39 percent decline in the U.S. global share of vehicle production. Over the same period, China experienced a nearly 300 percent increase in its share of automobile production, India an increase of 167 percent, and Mexico an increase of 75 percent. (See figure 23.)
Figure 23: Percent change in countries’ global share of automotive vehicle production, 2003–2023[38]
Notably, more than 90 percent of auto production in China, Germany, Japan, and South Korea is by companies headquartered in that country; for the United States, that figure is 44 percent.[39]
In terms of 2024 sales, China led the world, selling 34.1 million vehicles, nearly double the United States’ sales and well ahead of Japan, Germany, and South Korea. (See figure 24.)
Figure 24: Sales of new vehicles (millions of units), 2024[40]
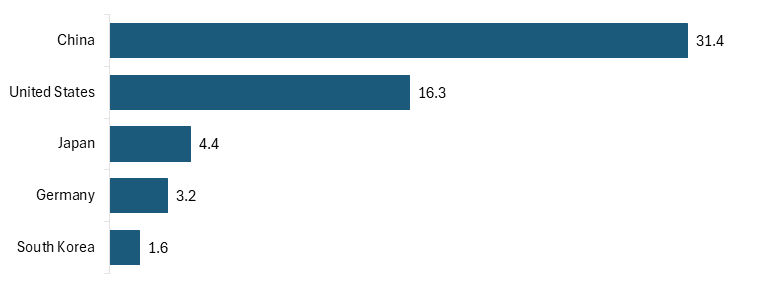
In terms of change in sales between 2005 and 2024, China’s sales of new vehicles increased from 5.7 million units to 31.4 million, an increase of nearly 450 percent, while South Korea’s vehicle sales also increased. Meanwhile, U.S. sales decreased, as did Germany’s and Japan’s. (See figure 25.)
Figure 25: Change in sales of new vehicles, 2005–2024[41]

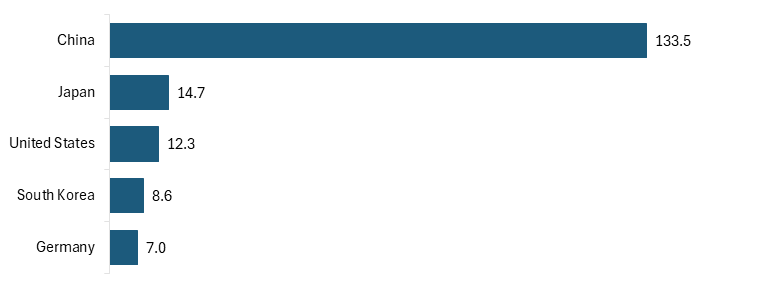
The export prowess of China is truly shown by considering its output of vehicles relative to auto ownership. China has the lowest ownership of motor vehicles per 1,000 citizens out of the leading auto producing nations, but the highest output of motor vehicle production per 1,000 citizens. In 2023, China produced over 130,000 vehicles relative to its car ownership per 1,000 citizens (which was 226). Japan, the United States, South Korea, and Germany produce significantly fewer. (See figure 26.) These figures suggest that a significant share of China’s auto production was being exported. In fact, China still exports about 20 to 25 percent of its auto production monthly.[42]
Figure 26: Countries’ vehicle output relative to population owning vehicles, 2023[43]
International Trade Measures
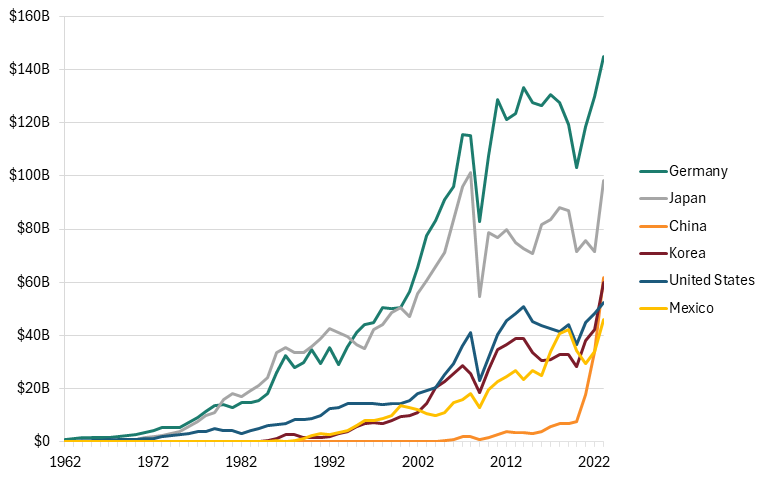
Autos still do remain a significant source of U.S. exports, with the United States exporting $52 billion worth of passenger motor vehicles in 2023, though this was about one-third of Germany’s $145 billion in exports and one-half of Japan’s $98 billion in exports. China recorded $61 billion in exports in 2023, which represented a 17-fold increase in exports over the prior decade. South Korea exported nearly $60 billon in automobiles while Mexico exported $46 billion. (See figure 27.)
Figure 27: Exports of passenger motor vehicles, by select country, 1962–2023[44]
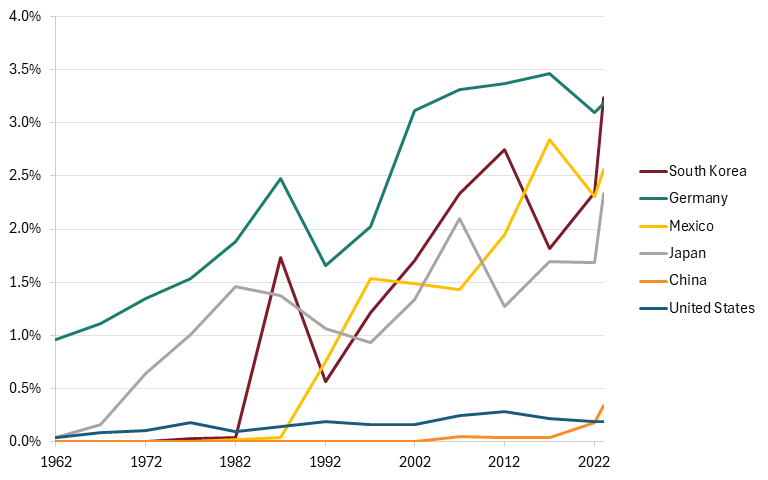
Compared with other world-leading auto manufacturers, the United States trailed in vehicle exports as a share of GDP, at just 0.2 percent in 2023. South Korea and Germany led in auto exports as a share of GDP at 3.2 percent. (See figure 28.)
Figure 28: Passenger vehicle exports as a share of GDP, 1962–2023[45]
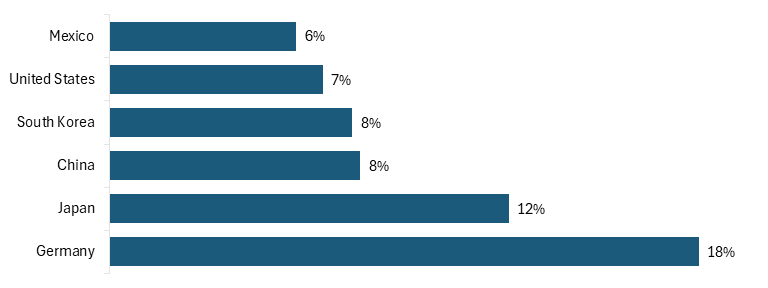
In terms of countries’ shares of global automotive exports, Germany led with 18 percent, followed by Japan with 12 percent, China and South Korea at 8 percent each, the United States with 7 percent, and Mexico with 6 percent. (See figure 29.)
Figure 29: Country share of global motor vehicle exports, 2023[46]
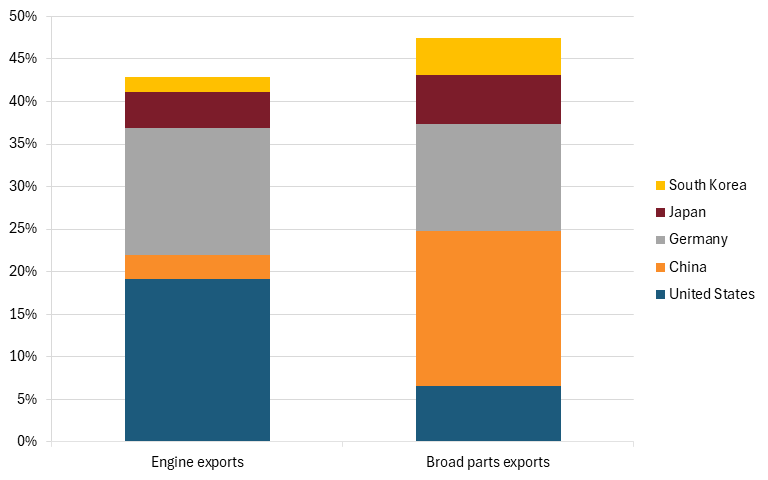
In 2022, the United States led the world in engine exports, with a 19 percent share, followed by Germany with a 15 percent share. China led the world in auto parts exports with an 18 percent share, followed by Germany’s with a 13 percent share. (See figure 30.)
Figure 30: Major vehicle-producing countries’ share of global engine and broad parts exports, 2022[47]
International Productivity Comparisons
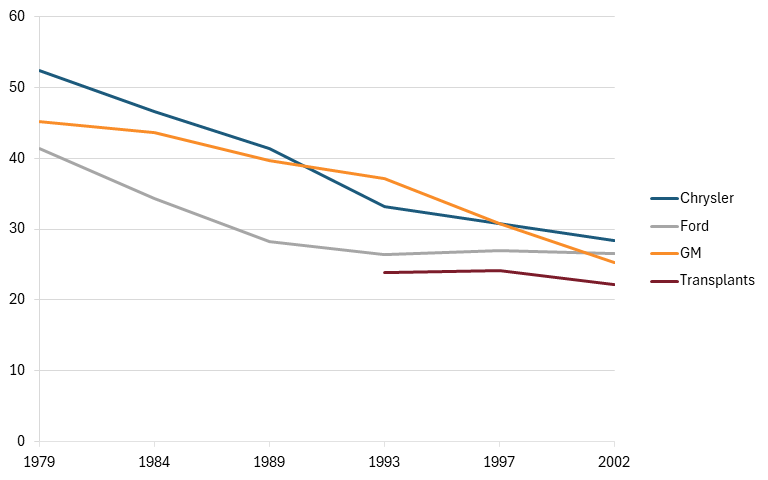
As the next report in this series will elaborate on further, much of the decline of the U.S. auto industry can be explained by its failure to keep up with international peers on productivity levels (especially in the latter quarter of the prior century). As McKinsey & Company wrote in a 2005 report, “It took ten to fifteen years for the Big Three to learn, adopt, and implement lean production techniques [from the foreign transplants] and they succeeded at different rates.”[48] Indeed, the Big Three automakers’ manufacturing efficiency, in terms of hours to manufacture a vehicle, was inferior to foreign transplants, such as the Japanese and German automakers, notably in the period from 1993 to 2002, as the transplants began to take hold in the U.S. market. (See figure 31.)
Figure 31: Manufacturing efficiency: hours per vehicle, select automakers, 1979–2002[49]
Taking the story forward, The Conference Board provides data on real value added (RVA) and employment from 1990 to 2018. Despite Japan enjoying higher productivity than the United States in the auto sector throughout much of the 1970s and 1980s, by 1990, the United States had begun to catch up with international competitors in terms of RVA per worker, when adjusted for purchasing power parity (PPP). Throughout the early 1990s and 2000s, U.S. motor vehicle productivity exceeded Japan’s and was mostly on par with Germany’s until 2009, when it began to fall behind. As of 2018 (the most recently available data), U.S. RVA per worker was roughly $140, 45 percent less than Germany’s, and 40 percent higher than Japan’s. (See figure 32.)
Figure 32: Real value added per worker in the motor vehicles industry (PPP adjusted dollars),1990–2018[50]
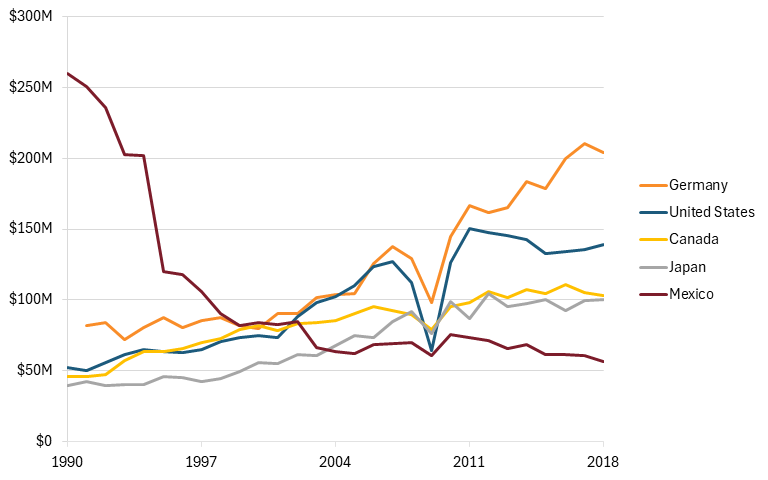
As of 2018, U.S. RVA per worker was roughly $140, 45 percent less than Germany’s, and 40 percent higher than Japan’s.
Innovation Indicators
The United States is increasingly faltering in automotive industry innovation indicators relative to other countries, as reflected in indicators such as R&D investment, share of leading scientific publications, and patenting activity.
As of 2022, Japan led the world in R&D investment in automobiles and parts as a share of the value added produced by its automotive sector. Germany followed in second place and the United States ranked third. (See figure 33.) (Note: value added reflects the value generated by producing goods and services, and is measured as the value of output minus the value of intermediate consumption.)
Figure 33: Private R&D investment in automobiles and parts as a share of automotive value added, 2022[51]
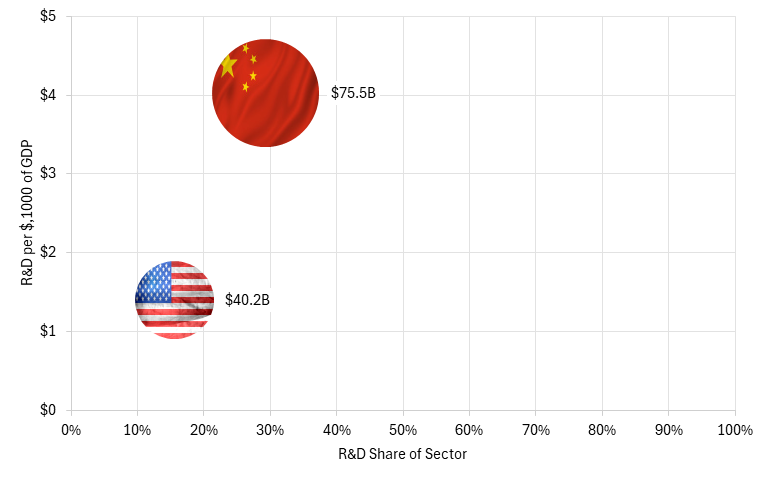
However, when controlling for wages, U.S. firms invest less compared with Chinese firms. In 2025, when controlling for GDP, U.S. firms invested about 65 percent less than Chinese firms did. For every $1,000 of GDP, U.S. firms invested $1.40 in automobiles and parts R&D, while Chinese firms invested $4.03. (See figure 34.)
The United States is increasingly faltering in automotive industry innovation indicators relative to other countries, as reflected in indicators such as R&D investment, share of leading scientific publications, and patenting activity.
Figure 34: U.S. and Chinese firms’ investments in automobiles and parts R&D, 2025[52]
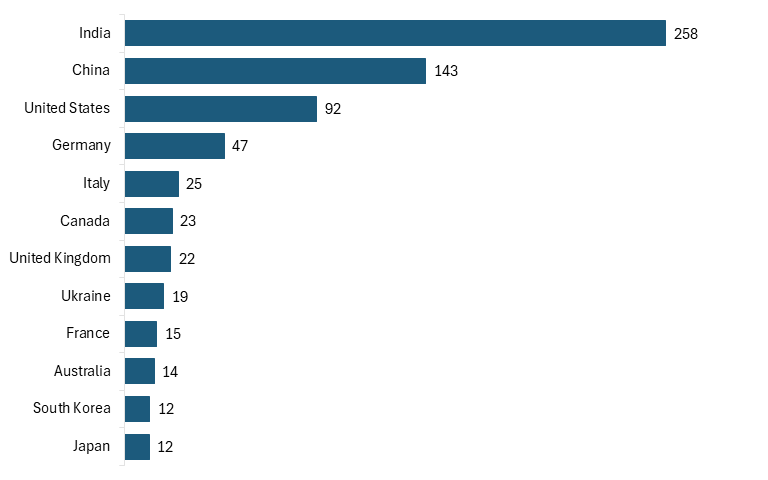
Examining the total number of the 10 percent most-cited scientific publications in automotive engineering by country for 2023, India led with 258 publications, followed by China, the United States, and Germany. (See figure 35.)
Figure 35: Total number of 10 percent most top-cited scientific publications in automotive engineering by country, 2023[53]
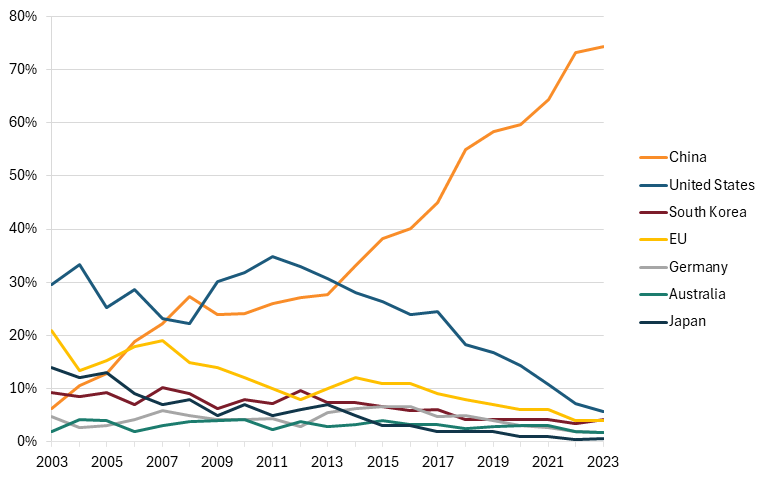
However, when it comes to countries’ share of most-cited publications regarding EV batteries, over the past decade, China has taken a commanding lead. From a mere 6 percent share in 2003, China accounted for three-quarters of the world’s most-cited publications regarding EV batteries by 2023, according to the Australian Technology Policy Institute’s (ASPI’s) Critical Technology Tracker. (See figure 36.) Chinese leadership in EV battery publications closely tracks with its leadership in EV innovation and production, as is explored in this report.
Figure 36: Share of high-impact publications regarding EV batteries in the ASPI Critical Technology Tracker dataset, 2003–2023[54]
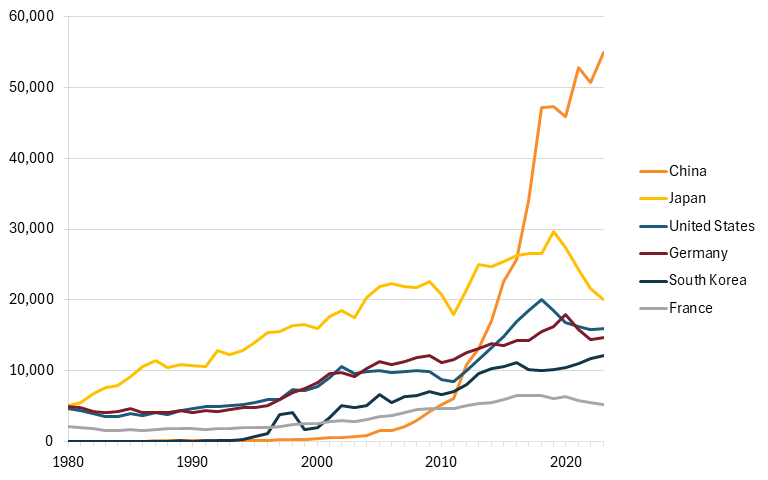
From fewer than 5 patents on average per year from 1980 to 1984—and fewer than 300 per year up to 2000—in 2015, China surpassed Japan to become the world’s leading recipient of patents in the transportation industry; and by 2023, it was receiving nearly 55,000 patents per year, far in excess of America’s just under 16,000 patents and Japan’s 20,000 patents. (See figure 37.) (Note: “Transportation” is the closest patent classification to “motor vehicles” available from the World Intellectual Property Organization.)
Figure 37: Transportation patent publications, by county, 1980–2023[55]
China is as dominant when it comes to patents issued for EV batteries, claiming, by November 2025, 74 percent of the world’s issued patents for EV batteries, followed by Japan and the United States. (See figure 38.)
Figure 38: Cumulative share of global patents issued for EV batteries, by country, as of November 2025[56]
Assessing U.S. Auto Industry Competitiveness Since 2010
The U.S. auto industry survived a series of challenges from the foreign import/transplant competition from the 1970 to the early 2000s and (with some difficulty) weathered the storm of the Great Recession. Actually, as Wharton professor John Paul MacDuffie observed, the U.S. auto industry was “in the middle of a large and successful improvement process” when the Recession hit.[57] Indeed, when it came to manufacturing capability, product development, and supply chain management, MacDuffie noted that, by 2009, U.S. automakers were close to the levels of “any global manufacturer” in most areas.[58]
Thus, by the early-to-mid 2010s, even coming out of the Great Recession’s convulsions, the U.S. auto industry appeared to have stabilized. Certainly, the foreign transplants accounted for a larger share of domestic manufacturing. But, as one 2015 report put it, “The U.S. auto industry has been revitalized in recent years through a commitment to quality, innovative production, and management techniques, a constructive relationship between management and labor, and improved relations with suppliers.”[59] The authors of the report noted both that management-labor strife had abated and that “the union has been a full partner for more than a decade in experimenting with work organization.”[60] Excluding the United Auto Workers strike of 2023, which was resolved six weeks after it began, this trend has held true up to present day.
Another 2015 report by Austan Goolsbee and Alan Kreuger, then with the Council of Economic Advisors under president Obama, similarly noted, “We are both pleased and a bit surprised by how well the past five years have played out for the domestic auto industry. We are both thrilled and relieved with the result: the automakers got back on their feet, which helped the recovery of the U.S. economy.”[61]
However, over the past decade, a new set of challenges has emerged, especially marked by the increasing offshoring of production to Mexico, largely due to the lower costs of labor and capital for manufacturers there, and the China EV/overcapacity issue, as the following section elaborates.
The Rise of Mexico
As noted previously, Mexico’s auto industry has blossomed over the past three decades, with its LQ growing from 1.51 in 1995 to 3.94 in 2002 alone, meaning that now the auto industry contributes about four times as much to the Mexican economy as it does to the global economy. Analysts expect that Mexico will have closed 2025 as the world’s fifth-largest automotive producer and fourth-largest automotive parts producer, exporting 87 percent of its total automotive production, 79 percent of which went to the United States.[62]
Mexico has become deeply integrated into the North American vehicle production ecosystem. As The Economist wrote, “Carmaking across North America is as complex and interconnected as the components of a combustion engine.”[63] Indeed, auto parts and components may cross the borders of North American countries as many as eight times before being installed in a final assembly plant.[64]
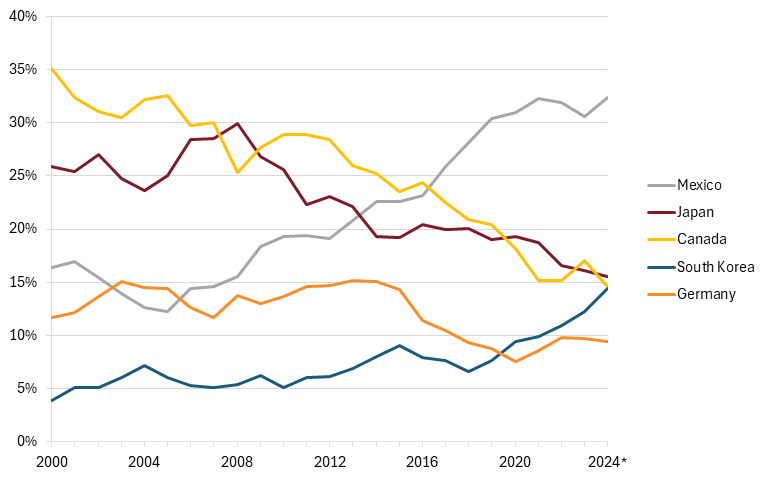
As of 2024, Mexico accounted for 32 percent of America’s vehicle imports by percentage of total value, while that share for Japan, Canada, and South Korea fell to about 15 percent each, making Mexico the single-greatest source of auto imports for the United States. (See figure 39.)
Figure 39: U.S. vehicle imports, by percentage of total value, select countries, 2000–2024[65]
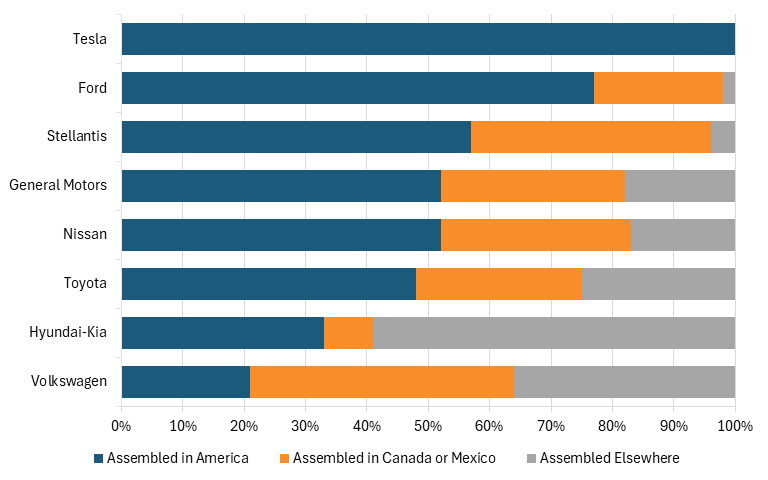
In 2024, 3.6 million cars, around half of America’s car imports by value, arrived via its North American neighbors, with Mexico accounting for about 2.5 million (or 70 percent) of these.[66] Around two-fifths of the cars sold in America by Stellantis come from Mexico or Canada. For GM, the share is nearly one-third. Ford assembles about 20 percent of its vehicles in Mexico or Canada. Mexican and Canadian production accounts for two-fifths of Volkswagen vehicles sold in America. (See figure 40.) Mexico is also a key supplier of auto parts for the U.S. automotive industry: 43 percent of U.S. auto parts imports come from Mexico.
Figure 40: Percentage of U.S. vehicle sales assembled in the United States or elsewhere[67]
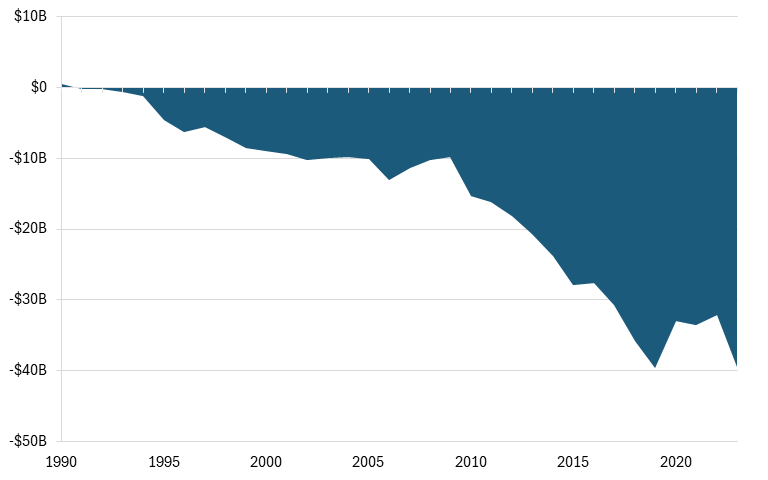
The United States has not had a positive automobile trade balance in real terms with Mexico since 1990. After 2001, the trade deficit began to exceed $10 billion annually and, by 2016, the deficit exceeded $30 billion annually. By 2023, the cumulative U.S. automobile manufacturing trade deficit with Mexico since 1990 had reached $530 billion. (See figure 41.)
Figure 41: U.S. real trade balance with Mexico in road vehicles (1990 dollars), 1990–2023[68]
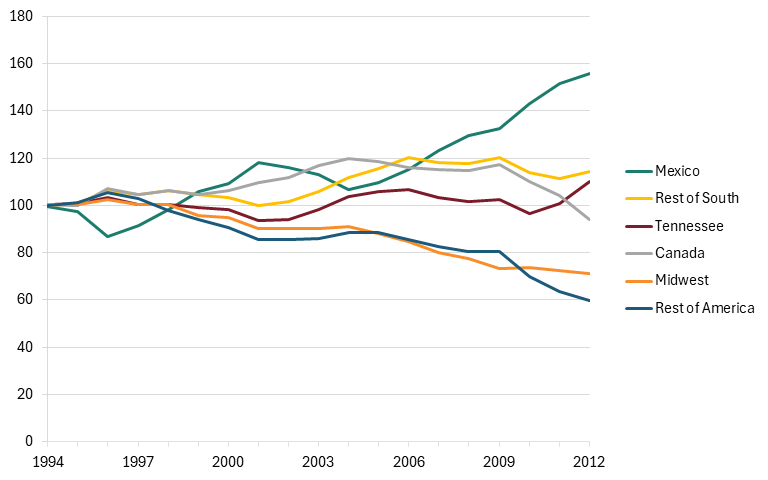
From 1994 (the year the North American Free Trade Agreement (NAFTA), precursor to USMCA, entered force) to 2012, Mexico enjoyed significantly more accelerated growth in motor vehicle manufacturing employment than did any other region of the United States or Canada, while employment in the U.S. Midwest and the United States as a whole showed notable decline. (See figure 42.)
Figure 42: Share of North American motor vehicle manufacturing employment, 1994–2012 (indexed to 100) [69]
As of February 2025, GM had employed about 120,000 people in North America. Of those, 90,000 worked in the United States, 23,000 worked in Mexico, and 6,000 in Canada. Ford Motor Co. had approximately 71,974 employees in North America, per estimates provided on the company’s website for the third quarter of 2024. Of those, 5,480 were employed in Canada and 7,000 in Mexico. Stellantis had about 75,500 total North American employees, with 52,000 in the United States, 8,600 in Canada, and 14,900 in Mexico.[70]
In summary, Mexico remains an opportunity and a challenge for the U.S. auto industry. The country plays a vital role in helping U.S.-located auto manufacturers produce cost-competitive vehicles; at the same time, the country has taken a considerable share of North American automotive employment and production. In this regard, it seems that the partial reshoring of production to Mexico has helped U.S. automakers remain globally competitive without compromising their ability to invest in in-house R&D in the United States, launch new models and features, and improve product quality—all while keeping a large share of their production (than otherwise would have been the case) in the United States.
China’s Dominance in EVs
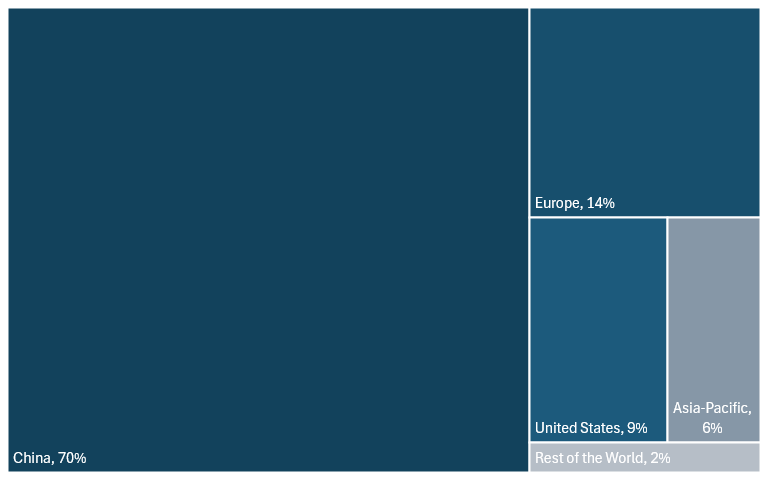
China has come to clearly lead the world in production of EVs. In 2024, it manufactured 12.4 million EVs, compared with European nations’ 2.5 million, America’s 1.6 million, 1 million from all (non-China) Asia-Pacific nations, and 0.3 million from the rest of the world. (See figure 43.) A little under half the vehicles currently manufactured in China are EVs. As of year-end 2024, 53 percent of cars manufactured in China were internal combustion engines (ICEs), 25 percent were pure battery electric vehicles (BEVs), and 22 percent were plug-in hybrids (PHEVs) or self-charging hybrids (HEVs).[71]
Figure 43: Country share of global EV production, 2024[72]
How Did China Come to Dominate EV Innovation and Production?
China’s leadership in EVs and EV batteries is a story of both innovation and innovation mercantilism, starting with the latter.
China’s Innovation Mercantilism in Autos and EVs
As ITIF wrote in its report “How Innovative Is China in the Electric Vehicle and Battery Industries?” certainly China’s unbridled innovation mercantilism has played a catalytic role in the growth of China’s autos/EV industry.[73] From 2009 to 2023 alone, China channeled $230.9 billion in subsidies and other support to its domestic EV sector.[74] Theft of Western IP automotive technologies has been rampant: In February 2020, William Evania, director of the National Counterintelligence and Security Center, singled out two fields where China is putting a priority on technology theft: EVs and aircraft.[75] China has also explicitly favored domestic producers. For instance, China’s Made in China 2025 strategy (released in 2015) stipulated that more than 70 percent of the one million-plus EVs and plug-in hybrids (then sold annually) in China should be from homegrown brands by 2020. The target set for 2025 was 80 percent of the market, a goal that China has achieved (within a percentage point or so.)[76]
China’s Innovation in Autos and EVs
But to simply ascribe China’s burgeoning competitiveness in the global automotive industry as the result of unfair practices would fail to do justice either to the significant extent of automotive process and product innovation occurring in China (as noted in the review of innovation indicators previously) or to the very significant threat Chinese automotive competitiveness creates for Western automakers.
Indeed, as Andrew Bergbaum, global co-leader of the automotive and industrial practice at AlixPartners observed, “The revolution taking place in the global auto industry is driven by the incredible and once unthinkable maturation of Chinese automakers that do a number of things differently.”[77] Research firm Bernstein estimates that Chinese EVs can cost half as much to make as European ones, even while they boast better tech.[78]
EVs and their batteries were invented in the United States. In fact, inventor William Morrison developed the first successful electric car in 1890, and by the early 1900s, about one-third of vehicles on U.S. roads were electric.[79] ICE technology subsequently dominated most of the 20th century, but in the early 1970s, Exxon scientist M. Stanley Whittingham created the first functional lithium-ion battery, which was improved upon by John Goodenough at the University of Oxford and the Japanese scientist Akira Yoshino at Asahi Kasei Corp.[80] In the mid-1990s, researchers at the University of Texas pioneered a new compound called lithium-iron phosphate (LFP) that would become the primary original EV battery chemistry.[81] U.S. EV battery startup A123 commercialized this technology in the late 2000s (famously receiving a $249 million grant from the Obama administration) but went bankrupt in October 2012 and was purchased by the Chinese company Wanxiang Group, transferring much of America’s EV-making knowhow to China.
A wide variety of EV batteries exist, but the two most prominent types have historically been LFP or nickel and cobalt-based batteries, which can come in nickel cobalt aluminum (NCA) or nickel manganese cobalt (NMC) varieties. Nickel/cobalt batteries were actually the dominant battery technology for many years, used in American- and European-produced EVs, such as Teslas.[82] Indeed, as Zeyi Yang wrote in MIT Technology Review, “Just a few years ago, LFP batteries were considered an obsolete technology that would never rival NMC batteries in energy density.”[83] In fact, from 2016 to 2018, LFP batteries accounted for just 10 percent of the global EV battery market.[84] But today, LFP batteries account for about 40 percent of the global market for EVs, and as Yang wrote, “It was Chinese companies, particularly CATL, that changed this consensus through advanced research.”[85]
Max Reid, a senior research analyst for EVs and batteries at research firm Wood Mackenzie, explained that China’s EV battery leadership “is purely down to the innovation within Chinese cell makers. And that has brought Chinese EV battery [companies] to the front line, the tier one companies.”[86]
China clearly dominates EV battery technology today, producing 80 percent of the world’s EV batteries made in 2024.[87] In April 2024, CATL announced that it had developed its fast-charging “Shenxing Plus” LFP battery, which is capable of a driving range of more than 1,000 km (621 miles) off a single charge.[88] CATL asserts that the battery can achieve a range of 400 km off just a 10-minute charge.[89] In October 2025, China’s Chery introduced an all-solid state EV battery capable of going 800 miles on a single charge.[90] Moreover, as The New York Times’ Keith Bradsher noted, “Beyond the battery itself, China also dominates electric motor production, and in designing high-efficiency systems that tie together batteries and motors.”[91]
So dominant are Chinese EVs that Ford is considering a tie-up with Chinese EV battery maker CATL to produce EV batteries in the United States for Ford. In fact, at the 2025 Aspen Ideas Festival, Ford CEO Jim Farley called China’s global lead in EVs and connected-vehicle technology “the most humbling thing I have ever seen.”[92]
As 2026 begins, China has come to clearly dominate in EV batteries: the country now accounts for 85 percent of the world’s global capacity for battery cell manufacturing, and 94 percent of the market share for producing LFP batteries.[93] In fact, China possesses about 12 times more EV battery manufacturing capacity in gigawatt hours than does the United States.[94] (See figure 44.)
Figure 44: EV battery manufacturing capacity in gigawatt hours[95]
China’s EV Export Dominance Leading to Growing Market Share in Third Countries
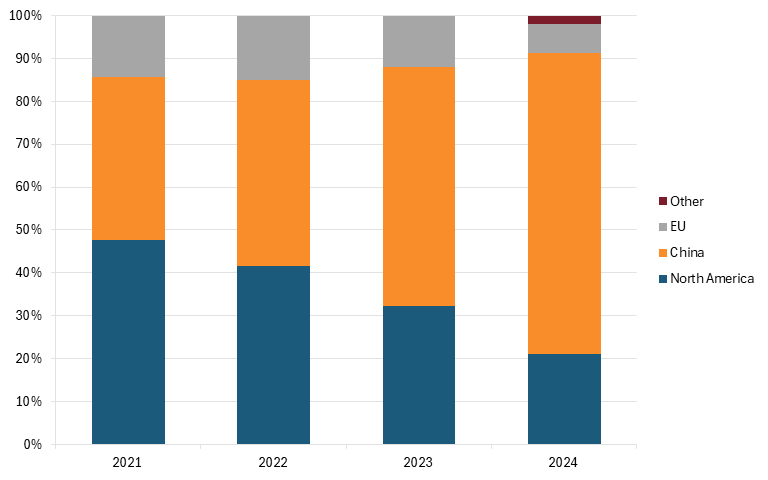
China has come to dominate in global EV exports. As of 2024, Chinese-headquartered firms accounted for 71 percent of overseas sales of EVs, up from 38 percent in 2021. North American-headquartered firms conversely saw their overseas sales of EVs decline from 48 percent in 2021 to just 21 percent in 2024. (See figure 45.)
Figure 45: Overseas sales of EVs by major automakers’ headquarters[96]
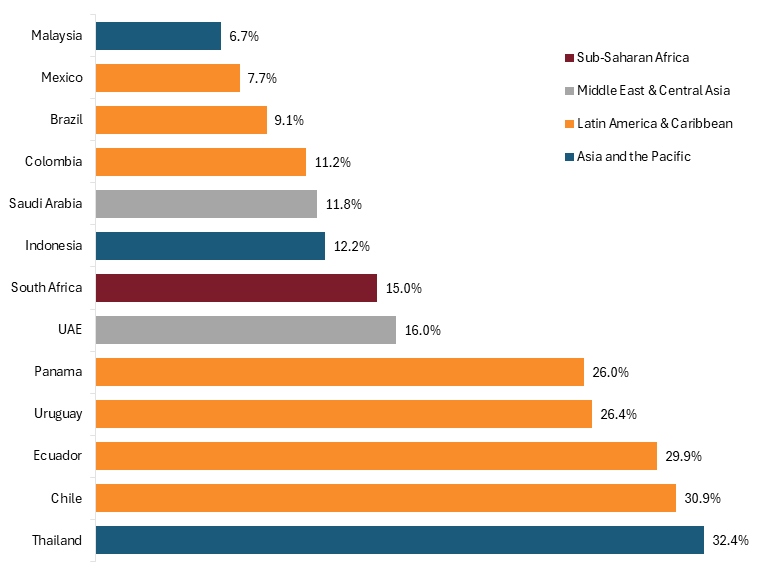
China’s increasing EV exports have contributed significantly to China taking greater market share in third-party countries. Exports of vehicles (both EV and ICE) from China to the Global South increased from 2 percent in 2000 to 22 percent in 2023, while U.S. exports fell from 24 percent to 14 percent during the same period. About 3 out of every 10 cars sold in Chile, Ecuador, and Thailand are manufactured by Chinese automakers. (See figure 46.)
Figure 46: Market share of Chinese vehicles in third-party markets (2024)[97]
Although it is not possible to determine the precise market share across all developing economies using open-source data, some estimates place Chinese EV imports as responsible for 75 percent of the increase in electric car sales in the Global South.[98] In Brazil, analysts estimate that Chinese EVs account for 80 to 99.5 percent of EV market share, while in Malaysia and Thailand, their market share exceeds 80 percent.[99] All in all, reports estimate that U.S. automakers GM, Ford, and Stellantis have lost over 6 percent of global market share due to the expansion of subsidized Chinese EVs.[100]
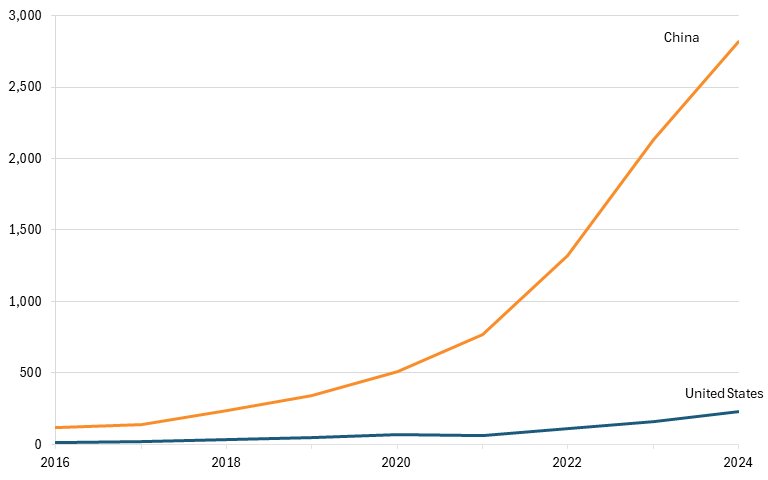
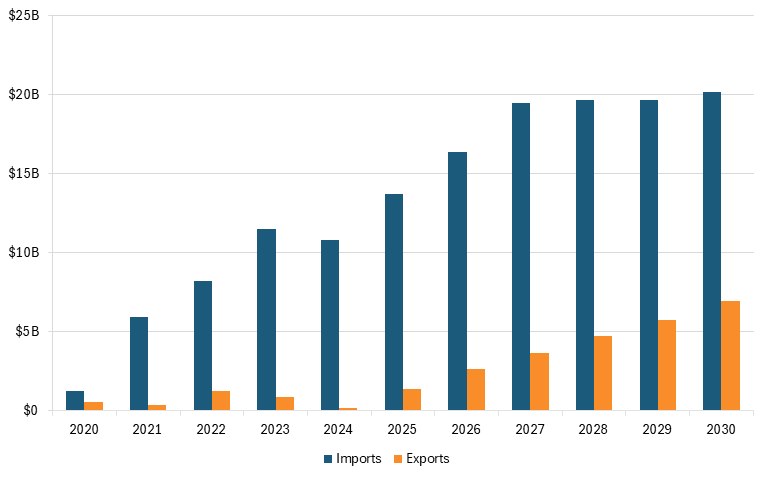
It’s also worth noting that Chinese automakers have come to already command a 6 percent share of the European automotive market.[101] From 2020 to 2025, EU imports of Chinese EVs grew 11-fold, from $1.2 billion to $13.7 billion, an amount expected to increase to $20.1 billion by the end of the decade. (See figure 47.)
Figure 47: EU EV imports from and exports to China[102]
Future Challenges for the U.S. Auto Industry
Taking the story up to the present moment and looking forward, the U.S. auto industry faces several notable additional technological and market challenges.
Technological Challenges
As analyst Stephan Keese of the auto industry analysis firm Roland Berger explained, “There are three key technologies currently transforming the global auto industry: vehicle autonomy, software-defined vehicles, and electrification. American automakers do likely lead in autonomy, but they are clearly lagging in electrification and are at best on par with global peers regarding software-defined vehicles.”[103]
Reports estimate that U.S. automakers GM, Ford, and Stellantis have lost over 6 percent of global market share due to the expansion of subsidized Chinese EVs.
Indeed, this report has documented how U.S. automakers are lagging in EV batteries and vehicle electrification. With regard to vehicle autonomy, U.S.-based players Tesla, Waymo, Cruise, and Zoox have staked the United States to an early lead. The Society of Automotive Engineers has defined six levels of autonomous driving, from Level 0 to Level 5.[104] (Note: See article in the endnotes for a full explication.) But as McKinsey & Company explained in a January 2026 report on the future of vehicle autonomy, Level 4 or Level 5 robotaxis will probably arrive first in North America. Urban piloting of Level 4 autonomous passenger vehicles will likely happen within 12 months of each other between China and North America (around 2030).[105] Yet, the McKinsey report notes that “the industry is in flux {and] the race to win is far from over,” though the report clearly pegs China and the United States as currently ahead of Europe in the vehicle autonomy race.[106]
Software-defined vehicles (SDVs) refer to a modern automobile in which core functions and features are controlled, updated, and enhanced through software rather than fixed hardware systems.[107] SDVs can receive software updates to improve performance, add new features, and enhance functionality such that hardware itself becomes upgradable and “vehicles are always new.”[108] In this case, analysts find that America’s Tesla and Rivian, Germany’s BMW and Mercedes-Benz, and China’s BYD, Nio, and Xpeng are likely the global leaders in deployed SDV technology.[109]
One industry analyst explained, “It’s ‘not unrealistic’ to see the first fully ‘dark’ automotive factory—where everything is done by robots—open in China by 2030.”
Lastly, McKinsey analysts estimate that $150 billion of annual economic potential could be unlocked by accelerating R&D at large automotive companies, the report pegging artificial intelligence and robotization as having some of the most significant potential.[110] To that end, a Gartner analysis finds that 12 out of the 25 top automakers are currently running pilots using advanced robotics in their factories.[111] And a Garter and Warburg Research report finds that “at least one automaker will achieve 100 percent assembly automation by 2030.”[112] As Warburg’s Fabio Hölscher explained, “It’s ‘not unrealistic’ to see the first fully ‘dark’ automotive factory— where everything is done by robots—open in China by 2030.”[113]
Also of note is that Hyundai is aiming “for production-scale deployment of [Boston Dynamics’] humanoids in automotive manufacturing and a scalable production system capable of producing 30,000 robots annually.”[114] Here again, the technology and competitive landscape is in flux, but it’s imperative that U.S. automakers not fall behind in the deployment of the most-advanced automotive production technologies, especially robotization.
Market Challenges
Several other challenges facing the U.S. auto industry bear brief mention. First, the industry has likely reached “peak auto,” as sales of new vehicles have stalled out in North America, Europe, Japan, and South Korea. Fewer new vehicles are sold annually in those markets today than there were a decade ago. Indeed, the Society of Automotive Engineers observed that it’s “unlikely that new car sales will return to their pre-covid levels anytime soon, if ever.”[115] Part of that is because the average age of vehicles on U.S. roads reached a record high of 12.8 years in 2025—as drivers are owning their vehicles for longer.[116] And a partial explanation for that is what’s been dubbed the “affordability crisis,” as, in 2025, the average sale price of a new vehicle in the United States eclipsed $50,000 for the first time.[117] That increasing expensiveness of vehicles helps explain why the average age of a new American car or truck buyer is now 53.[118] In other words, developed country auto markets are contracting, at a time when they are growing across the developing world (as middle-income countries such as India flourish), but U.S.-made vehicles are increasingly uncompetitive in these markets. Lastly, the fluctuating U.S. tariff and trade policy environment introduces new challenges as automakers in the United States seek to manage their global supply chains.
Summary
The competitiveness of the auto industry of the United States has waxed and waned over the past century, from a post-War zenith in the 1950s and 1960s to the relative decline that set in from the 1970s through the 2000s to a stabilization that occurred in the industry in the wake of the Great Recession—and before being again disrupted by the COVID-19 pandemic, increased outsourcing, and an emerging wave of Chinese competition. This report seeks to document that decline with comprehensive data. More broadly, the report seeks to offer a template that policymakers can use to assess the international competitiveness of America’s high-tech industries.
The key takeaway for the current competitiveness of the U.S. auto industry should be this: It’s like the 1980s/1990s all over again—when the industry faced massively disruptive Japanese import competition—only this time the industry cannot take 15 or more years to effectively respond and hope to survive … and it’s already probably through at least 5 of those years.
Assessing the current state of competitiveness of the U.S. auto industry offers a mixed picture, particularly for U.S.-based automakers. In recent years, they have largely concentrated on high-margin, ICE SUVs and trucks that, to be sure, are delivering strong margins. Washington’s fluctuating policy environment—notably the Trump administration’s withdrawal of Biden-era Inflation Reduction Act tax credits for EVs—has encouraged automakers to double down on this approach, although it has led to significant stranded capital as original equipment manufacturers (OEMs) and suppliers have had to readjust their demand forecasts (and investments in tooling and machinery) away from EVs and back to ICE vehicles.
Clear evidence of that was provided in early January 2026 when GM announced that it was taking a $7.1 billion financial hit for “electric vehicle-related charges primarily in North America in Q4 2025 as it realigns its strategy to produce more full-size internal combustion engine trucks and SUVs.”[119]
Also in December 2025, Ford “made a series of announcements that position the company to boost its production of hybrid and ICE vehicles later this decade and reduce its presence in the electric vehicle (EV) battery manufacturing sector.”[120]
On February 6, 2026, Jeep-maker Stellantis announced that it would take a $26 billion write-down, saying that it “overestimated demand for electric vehicles.”[121] In total, a February 13, 2026, Wall Street Journal article estimates that Detroit automakers have announced more than $50 billion in combined EV-related write-downs.[122]
While these moves may make near-term sense, EV battery technology continues to evolve rapidly. Moreover, lower-cost, near- or better-quality Chinese EVs continue to make significant inroads in third-party markets across the world. The overall situation risks a retreat to a “fortress America” dynamic. Meanwhile, as Keese noted, of the three critical future vehicle technologies—electrification, autonomy, and SDVs—U.S. automakers clearly trail in the first, have a slight lead in the second, and are on par in the third. The next report in this series will also demonstrate how the U.S. auto industry lags behind in robotics and automation and adoption. In short, U.S. automakers are no longer the clear global leaders in advanced vehicle technology they once were.
The key takeaway for the current competitiveness of the U.S. auto industry should be this: It’s like the 1980s/1990s all over again—when the industry faced massively disruptive Japanese import competition—only this time the industry cannot take 15 or more years to effectively respond and hope to survive … and it’s already probably through at least 5 of those years.
Having examined in this report what’s happened to the U.S. auto industry over the past six decades, the next report in this series will examine the causal factors of U.S. auto industry decline. Explanations for that decline include factors such as risk aversion, inferior vehicle quality, that decline is naturally explained by product life cycle theory, that decline was the result of automakers’ shift from a “flexible production system” to a “dispersed parallel production system,” and that it was the result of management practices of “relational contracts”—particularly with employees and suppliers—that impeded an effective competitive response when fierce foreign competition appeared. The final report in this series will lay out a comprehensive national strategy to bolster the competitiveness of the auto industry of the United States, replete with extensive policy recommendations.
Acknowledgments
The authors would like to thank Robert Atkinson for his assistance with this report.
About the Authors
Stephen Ezell is vice president for global innovation policy at ITIF and director of ITIF’s Center for Life Sciences Innovation. He also leads the Global Trade and Innovation Policy Alliance. His areas of expertise include science and technology policy, international competitiveness, trade, and manufacturing.
Meghan Ostertag is a policy analyst for economic policy at ITIF. She holds a bachelor’s degree in economics from American University.
About ITIF
The Information Technology and Innovation Foundation (ITIF) is an independent 501(c)(3) nonprofit, nonpartisan research and educational institute that has been recognized repeatedly as the world’s leading think tank for science and technology policy. Its mission is to formulate, evaluate, and promote policy solutions that accelerate innovation and boost productivity to spur growth, opportunity, and progress. For more information, visit itif.org/about.
Endnotes
[1]. Robert D. Atkinson, “Why the United States Needs a National Advanced Industry and Technology Agency” (ITIF, June 2021), https://itif.org/publications/2021/06/17/why-united-states-needs-national-advanced-industry-and-technology-agency/.
[2]. Stephen Ezell, “Krugman Flat Wrong that Competitiveness is a Myth,” Innovation Files, January 25, 2011, https://itif.org/publications/2011/01/25/krugman-flat-wrong-competitiveness-myth/.
[3]. Alliance for Automotive Innovation (AAI), “Data Driven: Navigating the Road Ahead” (AAI, January 2025), 2, https://www.autosinnovate.org/DataDriven.
[4]. Ibid., 3.
[5]. Ibid., 24.
[6]. Ibid., 22.
[7]. Ibid., 27.
[8]. Corelli Barnett, The Collapse of British Power (New York: Morrow, 1972): 85.
[9]. Robert D. Atkinson, “Marshaling National Power Industries to Preserve America’s Strength and Thwart China’s Bid for Global Dominance” (ITIF, November 2025), https://itif.org/publications/2025/11/17/marshaling-national-power-industries-to-preserve-us-strength-and-thwart-china/.
[10]. Meghan Ostertag, “US National Power Industries Are At Risk” (ITIF, November 2025), https://itif.org/publications/2025/11/17/us-national-power-industries-are-at-risk/.
[11]. U.S. Bureau of Economic Analysis, “Gross Domestic Product by Industry and Input-Output Statistics: The Use of Commodities by Industries,” accessed October 28, 2025, https://apps.bea.gov/histdatacore/fileStructDisplay.html?theID=12027&HMI=8&oldDiv=Industry%20Accounts&year=2024&quarter=,%20Q2&ReleaseDate=September-26-2024&Vintage=Annual.
[12]. Stefan Link, “Detroit: Capital of the Automotive Age,” December 6, 2015, https://globalurbanhistory.com/2015/12/06/detroit-capital-of-the-automotive-age/;Thomas J. Sugrue, “Motor City: The Story of Detroit,” History Now Issue 11 (Spring 2007), https://www.gilderlehrman.org/history-resources/essays/motor-city-story-detroit.
[13]. Ford, “The Moving Assembly Line and the Five-Dollar Workday,” September 3, 2020, https://corporate.ford.com//articles/history/moving-assembly-line/.
[14]. U.S. Department of Energy, “Fact #637: August 23, 2010 World Motor Vehicle Production,” https://www.energy.gov/eere/vehicles/fact-637-august-23-2010-world-motor-vehicle-production.
[15]. David G. Anderson, “The US Auto Industry, 1960-2025” (The Data Poet, April 6, 2025), https://thedatapoet.substack.com/p/the-us-auto-industry-1960-2025.
[16]. Paul Niedermeyer, “Chartside Classics: US Market Share by Manufacturer - 1961-2016,” Curbside Classic, https://www.curbsideclassic.com/blog/history/chartside-classics-us-market-share-by-manufacturer-1961-2016/; “Ford Motor Company Sales Data, Trends & Analysis for the U.S Automotive Market,” Good Car Bad Car, accessed February 12, 2026, https://www.goodcarbadcar.net/ford-motor-company-us-sales-figures/; “General Motors Sales Data, Trends & Analysis for the U.S Automotive Market,” Good Car Bad Car, accessed February 12, 2026, https://www.goodcarbadcar.net/general-motors-us-sales-figures/; “Stellantis Sales Data, Trends & Analysis for the U.S Automotive Market,” Good Car Bad Car, accessed February 12, 2026, https://www.goodcarbadcar.net/fca-us-sales-figures/; Data was combined from two different data sources from this chart; the data covering 1961-2016 is sourced from Curbside Classic, while data covering 2017-2025 is sourced from Good Car Bad Car.
[17]. Anderson, “The US Auto Industry, 1960-2025.”
[18]. American International Automobile Dealers Association (AIADA), “International Automakers and Dealers in America” (AIADA, 2025), https://autosdriveamerica.org/wp-content/uploads/2025/08/ADA_8.5X11_2025_final_compressed.pdf.
[19]. AllAmerican.org, “State of American Auto Manufacturing Report,” April 18, 2024, https://allamerican.org/research/auto-manufacturing-report/.
[20]. Marklines (Automotive Sales Dashboard), accessed February 10, 2026, https://www.marklines.com/en/vehicle_sales/dashboard?rf=sales_index#group-sales-panel.
[21]. Bureau of Transportation Statistics (“Annual U.S. motor vehicle production and domestic sales”), accessed January 29, 2026, https://www.bts.gov/content/annual-us-motor-vehicle-production-and-factory-wholesale-sales-thousands-units.
[22]. Ibid.
[23]. Michigan Senate Fiscal Agency (“U.S. Retail Sales of Imported Motor Vehicles: 1970-2025;” July 1, 2025), https://sfa.senate.michigan.gov/Economics/ImportedAutoSales.PDF.
[24]. The White House, “Fact Sheet: President Donald J. Trump Adjusts Imports of Automobiles and Automobile Parts into the United States,” March 26, 2025, https://www.whitehouse.gov/fact-sheets/2025/03/fact-sheet-president-donald-j-trump-adjusts-imports-of-automobiles-and-automobile-parts-into-the-united-states.
[25]. AllAmerican.org, “State of American Auto Manufacturing Report.”
[26]. Federal Reserve Bank of St. Louis (Table Data - Motor vehicle output: Final sales of domestic products: Exports), accessed February 10, 2026, https://fred.stlouisfed.org/data/AB69RC1A027NBEA; Federal Reserve Bank of St. Louis (Consumer Price Index for All Consumer: All Items in U.S. City Average), accessed February 10, 2026, https://fred.stlouisfed.org/series/CPIAUCSL#; Federal Reserve Bank of St. Louis (Motor vehicle output), accessed February 10, 2026, https://fred.stlouisfed.org/series/A953RC1Q027SBEA.
[27]. Harvard Atlas of Economic Complexity (U.S. Imports and Exports of Passenger motor vehicles (excluding buses) 1962–2023), accessed January 29, 2026, https://atlas.hks.harvard.edu/explore/overtime?year=2023&startYear=1962&endYear=2023&productClass=SITC&exporter=group-1&locationLevel=country&view=markets&product=product-SITC-1314&tradeDirection=imports&importer=country-840; Federal Reserve Bank of St. Louis (Consumer Price Index for All Consumer: All Items in U.S. City Average), accessed February 10, 2026, https://fred.stlouisfed.org/series/CPIAUCSL#.
[28]. “United States Auto Parts Manufacturing Industry Report 2025,” Research and Markets, December 3, 2025, https://finance.yahoo.com/news/united-states-auto-parts-manufacturing-170400755.html.
[29]. Bureau of Labor Statistics (Industry Output and Employment, Motor Vehicle Parts Manufacturing), accessed February 5, 2026, https://www.bls.gov/emp/data/industry-out-and-emp.htm.
[30]. U.S. Census Bureau, USA Trade (Imports and Exports of NAICS 3363), accessed February 4, 2026, https://usatrade.census.gov/data/Perspective60/View/dispview.aspx.
[31]. The Conference Board (International labor comparisons, persons employed), accessed January 30, 2026, https://www.conference-board.org/ilcprogram/; Federal Reserve Bank of St. Louis (FRED) (Civilian Labor Force Level), accessed February 3, 2026, https://fred.stlouisfed.org/series/CLF16OV#.
[32]. Robert D. Atkinson and Ian Tufts, “The Hamilton Index, 2023: China Is Running Away With Strategic Industries” (ITIF, December 2023), https://itif.org/publications/2023/12/13/2023-hamilton-index/.
[33]. Robert D. Atkinson and Meghan Ostertag, “The Hamilton Index, 2025” (ITIF, forthcoming report); OECD, “Trade in Value Added (TiVA) 2025 Edition.”
[34]. Ibid.
[35]. Organization for Economic Cooperation and Development (OECD), “Trade in Value Added (TiVA) 2025 Edition,” accessed February 4, 2026.
[36]. Ibid.
[37]. AAI, “Data Driven: Navigating the Road Ahead.”
[38]. AAI, ”Data Driven: Navigating the Road Ahead,” 17. Most of the major automakers in Indonesia are currently foreign, including Toyota, Daihatsu, Honda, Suzuki, Mitsubishi, Hyundai, Wuling (SAIC-GM-Wuling), and Chery. However, new domestic Indonesian automakers, such as Esemeka, Mobil Anak Bangsa, and Polytron, are emerging.
[39]. David Coffin, “National Automotive Competitiveness” (U.S. International Trade Commission, Office of Industry and Competitiveness Analysis, January 2024), 2, https://www.usitc.gov/publications/332/working_papers/national_automotive_competitiveness.pdf. For China, 51 percent is by wholly Chinese companies and 46 percent by joint ventures between Chinese and non-Chinese companies. Wards Intelligence, “Germany Vehicle Production, 1970-2022,” April 17, 2023; Wards Intelligence, “Asia Vehicle Production by Country and Manufacturer, 2022,” April 17, 2023; Wards Intelligence, “Asia Vehicle Production by Country and Manufacturer, 2022,” April 17, 2023.
[40]. International Organization of Motor Vehicle Manufacturers (OICA) (World motor vehicle sales), accessed February 12, 2026, https://oica.net/sales-statistics/.
[41]. Ibid.
[42]. Bill Russo, “State of China’s Auto Market – March 2025,” Automobility, March 18, 2025, https://automobility.io/2025/03/state-of-chinas-auto-market-march-2025/.
[43]. William T. Spitz, “America and the Automobile” (Diversified Trust, May 13, 2024), https://diversifiedtrust.com/blog/america-and-the-automobile; “South Korea’s Ownership Volume of Motor Vehicles,” AAAweekly, July 13, 2023, https://aaa.fourin.com/reports/b45b7830-1c5f-11ee-b9b0-27a0b81553e9/south-koreas-ownership-volume-of-motor-vehicles; Xinhua, “China’s Annual Auto Sales Expected To Peak At 40M Units,” China Daily, July 7, 2023, https://global.chinadaily.com.cn/a/202307/07/WS64a765eca310bf8a75d6dc9a.html.
[44]. Harvard Atlas of Economic Complexity (Exports of Passenger motor vehicles (excluding buses) 1962–2023), accessed January 28, 2026, https://atlas.hks.harvard.edu/explore/overtime?year=2023&startYear=1962&endYear=2023&productClass=SITC&exporter=group-1&view=markets&product=product-SITC-1314&locationLevel=country.
[45]. Harvard Atlas of Economic Complexity (Exports of Passenger motor vehicles (excluding buses) 1962-2023), accessed January 28, 2026, https://atlas.hks.harvard.edu/explore/overtime?year=2023&startYear=1962&endYear=2023&productClass=SITC&exporter=group-1&view=markets&product=product-SITC-1314&locationLevel=country.
[46]. Ibid.
[47]. Coffin, “National Automotive Competitiveness,” 3.
[48]. Martin Neil Baily et al., “Increasing Global Competition and Labor Productivity: Lessons From the US Automotive Industry” (McKinsey Global Institute, November 1, 2005), 12, https://www.mckinsey.com/industries/automotive-and-assembly/our-insights/increasing-global-competition-and-labor-productivity.
[49]. Ibid.
[50]. The Conference Board (International Labor Comparisons), accessed January 29, 2026, https://www.conference-board.org/ilcprogram/.
[51]. Organization of Economic Cooperation and Development, “Trade in Value Added” (motor vehicles value added), accessed 2025, https://stats.oecd.org/OECDStat_Metadata/ShowMetadata.ashx?Dataset=TIVA_2022_C1&ShowOnWeb=true&Lang=en.; European Commission, “The 2023 EU Industrial R&D Investment Scoreboard,” December 14, 2023, https://iri.jrc.ec.europa.eu/scoreboard/2023-eu-industrial-rd-investment-scoreboard#field_data.; International Monetary Fund, Representative Exchange Rates for Selected Currencies for January 2022,” https://www.imf.org/external/np/fin/data/rms_mth.aspx?SelectDate=2022-01-31&reportType=REP.
[52]. Elisabeth Nindl et al., “The 2025 EU Industrial R&D Investment Scoreboard” (European Commission, 2025), https://iri.jrc.ec.europa.eu/scoreboard/2025-eu-industrial-rd-investment-scoreboard.
[53]. Report Linker, “Global Total Number of 10% Top-Cited Scientific Publications in Automotive Engineering by Country,” https://www.reportlinker.com/dataset/e93ea1b1693cd66f1257186ce673c5540c8351f1.
[54]. Australian Technology Policy Institute, “Critical Technology Tracker: How Is United States Performing in Electric Batteries?” https://techtracker.aspi.org.au/tech/electric-batteries/historical-performance?c1=us.
[55]. World Intellectual Property Organization, WIPO IP Statistics Data Center, “Patent publications by technology: transportation” (Data updated by WIPO May 2024), data accessed November 2025, https://www3.wipo.int/ipstats/ips-search/patent?selectedTab=patent&indicator=17&reportType=13&fromYear=1980&toYear=2023&ipsOffSelValues=&ipsOriSelValues=CN,JP,US,KR,DE,FR,MX,CA&ipsTechSelValues=32.
[56]. Patsnap, “Powering the Future of Electric Vehicles: The Battle for Battery Innovation and Patents,” https://www.patsnap.com/resources/blog/power-batteries-electric-mobility-patents.
[57]. Ibid.
[58]. Knowledge at Wharton, “The Auto Bailout 10 Years Later: Was It the Right Call?” September 12, 2018, https://knowledge.wharton.upenn.edu/podcast/knowledge-at-wharton-podcast/auto-bailout-ten-years-later-right-call/.
[59]. Joel Cutcher-Gershenfeld, Dan Brooks, and Martin Mulloy, “The Decline and Resurgence of the U.S. Auto Industry” (Economic Policy Institute, May 6, 2015), 3, https://files.epi.org/2015/the-decline-and-resurgence-of-the-us-auto-industry.pdf.
[60]. Ibid,
[61]. Austan D. Goolsbee and Alan B. Krueger, “A Retrospective Look at Rescuing and Restructuring General Motors and Chrysler” (Princeton University Industrial Relations Section, Working Paper #558, 2015), http://arks.princeton.edu/ark:/88435/dsp01sj139419w.
[62]. PRODENSA, “Mexican Automotive Industry Report [Updated for 2025],” March 10, 2025, https://www.prodensa.com/insights/blog/mexican-automotive-industry-report-2024.
[63]. “No one gains from American tariffs on cars from Mexico or Canada,” The Economist, June 30, 2025, https://www.economist.com/business/2025/01/30/no-one-gains-from-american-tariffs-on-cars-from-mexico-and-canada.
[64]. Robert Pastor, “The Future of North America,” Foreign Affairs, July/August 2008, 89, https://www.foreignaffairs.com/articles/north-america/2008-06-01/future-north-america.
[65]. “America’s Carmakers Win a Tariff Reprieve, But Still Face a Tricky Dilemma,” The Economist.
[66]. Ibid.
[67]. Ibid.; Pallavi Rao, “Visualized: Where Automakers Build Cars Sold in America,” Visual Capitalist, March 26, 2025, https://www.visualcapitalist.com/visualized-where-automakers-build-cars-sold-in-america/.
[68]. Harvard Atlas of Economic Complexity (U.S. and Mexico exports of road vehicles 1990–2023), accessed January 29, 2026, https://atlas.hks.harvard.edu/explore/overtime?year=2023&startYear=1990&endYear=2023&productClass=SITC&exporter=group-1&view=markets&product=product-SITC-1314&locationLevel=country.
[69]. Joel Cutcher-Gershenfeld et al., “The Decline and Resurgence of the U.S. Auto Industry” (Economic Policy Institute, May 6, 2015), https://files.epi.org/2015/the-decline-and-resurgence-of-the-us-auto-industry.pdf.
[70]. Jackie Charniga, “Canada, Mexico integral to US auto manufacturing for a century,” Detroit Free Press, February 4, 2025, https://www.freep.com/story/money/cars/2025/02/04/canada-mexico-us-auto-manufacturing-history-ford-gm-chrysler/78182033007/.
[71]. The Bank of Finland Institute for Emerging Economics, “Half of the cars built and sold in China still only have internal combustion engines,” December 13, 2024, https://www.bofit.fi/en/monitoring/weekly/2024/vw202450_2.
[72]. International Energy Agency, “Global EV Outlook 2025” (IEA, 2025), 33, https://iea.blob.core.windows.net/assets/7ea38b60-3033-42a6-9589-71134f4229f4/GlobalEVOutlook2025.pdf.
[73]. Stephen Ezell, “How Innovative Is China in the Electric Vehicle and Battery Industries?” (ITIF, July 2024), https://itif.org/publications/2024/07/29/how-innovative-is-china-in-the-electric-vehicle-and-battery-industries/.
[74]. Scott Kennedy, “The Chinese EV Dilemma: Subsidized Yet Striking” (CSIS, June 20, 2024), https://www.csis.org/blogs/trustee-china-hand/chinese-ev-dilemma-subsidized-yet-striking.
[75]. Alex Lauer, “China Really Wants to Steal EV Tech, Warns U.S. Counterintelligence,” InsideHook, February 10, 2020, https://www.insidehook.com/autos/china-steal-electric-vehicle-tech-counterintelligence.
[76]. Xiaoying, “The ‘new three’: How China came to lead solar cell, lithium battery and EV manufacturing,” Dialogue Earth, November 7, 2023, https://dialogue.earth/en/business/new-three-china-solar-cell-lithium-battery-ev/.
[77]. Levin, “Chinese Brands Will Sell A Third Of The World’s Cars By 2030: Study,” Inside EVs, June 30, 2024, https://insideevs.com/news/724950/chinese-ev-brands-global-sales/.
[78]. “Jam-packed: Chinese EV-makers are leaving Western rivals in the dust,” The Economist, May 4, 2024, https://www.economist.com/business/2024/05/01/chinese-ev-makers-shine-at-beijings-car-jamboree.
[79]. Shannon Osaka and Naema Ahmed, “How the U.S. lost its lead in electric vehicles and other clean energy inventions,” The Washington Post, July 31, 2025, https://www.washingtonpost.com/climate-environment/2025/07/31/china-clean-energy-united-states-inventions/.
[80]. Ibid.
[81]. Gabrielle Coppola, “America’s Long, Tortured Journey to Build EV Batteries,” Bloomberg, June 8, 2023, https://www.bloomberg.com/news/features/2023-06-08/a-us-startup-s-failure-paved-the-way-for-china-s-ev-battery-dominance.
[82]. Casey Crownhart, “Meet the new batteries unlocking cheaper electric vehicles,” MIT Technology Review, February 17, 2023, https://www.bloomberg.com/news/articles/2023-06-05/china-s-ev-battery-sector-is-preparing-another-technology-breakthrough.
[83]. Zeyi Yang, “How EV Batteries Are Becoming the Next Source of Tension for China and the U.S.” MIT Technology Review, February 22, 2023, https://www.technologyreview.com/2023/02/22/1069032/ev-batteries-politicization-china-us/.
[84]. Crownhart, “Meet the new batteries unlocking cheaper electric vehicles.”
[85]. Yang, “How EV Batteries Are Becoming the Next Source of Tension for China and the U.S.”
[86]. Ibid.
[87]. Zeyi Yang, “Chinese EV Batteries Are Eating the World,” Wired, January 28, 2026, https://www.wired.com/story/chinese-ev-batteries/.
[88]. “Chinese EV battery maker CATL unveils LFP battery with 1,000 km range,” Reuters, April 25, 2024, https://www.reuters.com/business/autos-transportation/chinese-ev-battery-maker-catl-unveils-lfp-battery-with-1000-km-range-2024-04-25/.
[89]. Yasmeta Oon, “China creates groundbreaking electric car battery that fully charges in just 10 minutes,” MSN, May 20, 2024, https://www.msn.com/en-us/autos/news/china-creates-groundbreaking-electric-car-battery-that-fully-charges-in-just-10-minutes/ar-BB1mInh2.
[90]. Suvrat Kothari, “China Is Making 800-Mile EV Batteries. Here’s Why America Can’t Have Them,” InsideEVs, October 21, 2025, https://insideevs.com/news/776394/china-800-mile-solid-state-ev-battery/.
[91]. Keith Bradsher, “China’s E.V. Threat: A Carmaker That Loses $35,000 a Car,” The New York Times, October 5, 2023, https://www.nytimes.com/2023/10/05/business/nio-china-electric-vehicles.html.
[92]. “Exclusive: Ford and Geely in talks for manufacturing, technology partnership, sources say,” Reuters, February 3, 2026, https://www.reuters.com/business/autos-transportation/ford-geely-talks-manufacturing-technology-partnership-sources-say-2026-02-04/.
[93]. Osaka and Ahmed, “How the U.S. lost its lead in electric vehicles and other clean energy inventions”; International Energy Agency (IEA), “Executive Summary: Batteries and Secure Energy Transitions,” https://www.iea.org/reports/batteries-and-secure-energy-transitions/executive-summary.
[94]. Ibid.
[95]. Ibid.
[96]. IEA, “Global EV Outlook 2025,” 2025, https://iea.blob.core.windows.net/assets/7ea38b60-3033-42a6-9589-71134f4229f4/GlobalEVOutlook2025.pdf.
[97]. Juan Felipe Munoz, “Chinese Cars Are Dominating in Asia, Africa, and South America,” Motor1.com, October 23, 2025, https://www.motor1.com/news/776805/chinese-cars-domination-asia-afria-south-america/.
[98]. International Energy Agency, “2025 Global EV Outlook: Executive Summary,” https://www.iea.org/reports/global-ev-outlook-2025/executive-summary.
[99]. Jang Woo-jeong and Lee Young-kwan, “Chinese EVs Dominate Emerging Markets with 80% Share in Thailand, Israel,” Chosun Daily, October 4, 2025; https://www.chosun.com/english/industry-en/2025/11/04/AQ2KWUSWNBFTTKDOPRZADO5T4M/; Merritt Enright, “How Chinese EV makers are winning in Brazil,” CNBC, November 5, 2025, https://www.cnbc.com/2025/11/05/chinese-evs-brazil.html.
[100]. SAE Detroit Section, “The U.S. Automotive Industry at Risk,” White Paper, October, 2024.
[101]. Roland Berger/Lazar, “Global Automotive Supplier Study 2025” (Roland Berger/Lazar, 2025), 53.
[102]. Ibid., 32.
[103]. Phone interview with Stephan Keese, Managing Partner Roland Berger North America and Head of Industrials Americas, January 30, 2026.
[104]. Peter Nelson, “The Six Levels of Autonomous Driving, Explained,” J.D. Power, February 14, 2025, https://www.jdpower.com/cars/shopping-guides/levels-of-autonomous-driving-explained.
[105]. McKinsey & Company, “Where to next? Insights from autonomous-vehicle experts” (McKinsey & Company, January 6, 2026), https://www.mckinsey.com/features/mckinsey-center-for-future-mobility/our-insights/future-of-autonomous-vehicles-industry.
[106]. Ibid.
[107]. IBM, “What is a software-defined vehicle?” https://www.ibm.com/think/topics/software-defined-vehicle.
[108]. Roland Berger/Lazar, “Global Automotive Supplier Study 2025,” 44.
[109]. “Which Car Has the Most Software-Defined Features in 2025?” EV World, August 22, 2025, https://evworld.com/article.php; Lois Jones, “These automakers lead the race to debut software-defined vehicles,” Automotive News, August 12, 2025, https://www.autonews.com/technology/ane-eu-us-china-sdv-software-0818/.
[110]. Lois Jones, “First ‘dark factory’ where robots build the entire car tipped to open in China or U.S. by 2030,” Automotive News Europe, January 15, 2026, https://www.autonews.com/technology/ane-fully-automated-car-plant-china-us-0115/.
[111]. Gartner, “Gartner Predicts Only 5% of Automakers Will Keep Investing Heavily in AI by 2029,” press release, December 8, 2025, https://www.gartner.com/en/newsroom/press-releases/2025-12-08-gartner-predicts-only-5-percent-of-automakers-will-keep-investing-heavily-in-artificial-intelligence-by-2029.
[112]. Jones, “First ‘dark factory’ where robots build the entire car tipped to open in China or U.S. by 2030.”
[113]. Ibid.
[114]. Jerry Hirsch, “Hyundai unveils humanoid robotics strategy, aiming for 30,000 robots annually by 2028,” Automotive News, January 5, 2026, https://www.autonews.com/technology/an-ces-2026-hyundai-robotics-strategy-0105/.
[115]. SAE Detroit Section, “The U.S. Automotive Industry at Risk,” 3.
[116]. Todd Campau, “Average Age of Vehicles in the US Rises to 12.8 Years in 2025,” S&P Global, https://www.spglobal.com/automotive-insights/en/blogs/2025/05/average-age-of-vehicle-in-us.
[117]. Jake Fitzgerlad, “Average New Car Prices Rise Above $50,000 for the First Time Ever,” Car & Driver, October 16, 2025, https://www.caranddriver.com/news/a69047202/average-new-car-price-rises-above-50000/.
[118]. Hedges & Company, “Demographics of Car Buyers,” https://hedgescompany.com/blog/2019/01/new-car-buyer-demographics-2019/.
[119]. Eric Walz, “GM expects a total charge of $7.1B in Q4 as it realigns its North America strategy,” Ward’s Auto, January 9, 2026, https://www.wardsauto.com/news/GM-takes-6-billion-charge-realigns-north-america-ev-strategy/809220/.
[120]. Brian Taylor, “Ford pivots away from EVs,” Recycling Today, December 18, 2025, https://www.recyclingtoday.com/news/ford-electric-hybrid-ice-vehicles-changes-2026-f150-pickup/.
[121]. Stephen Wilmot, “Jeep Maker Stellantis Books $26 Billion Charges in EV Reset,” The Wall Street Journal, February 6, 2026, https://www.wsj.com/business/jeep-maker-stellantis-books-26-billion-charge-in-strategy-reset-54ac32bf.
[122]. Nate Rattner, Terell Wright, and Sharon Terlep, “Detroit Automakers Take $50 Billion Hit as EV Bubble Bursts,” The Wall Street Journal, February 13, 2026, https://www.wsj.com/business/autos/detroit-automakers-take-50-billion-hit-as-ev-bubble-bursts-06a97414.
Editors’ Recommendations
November 17, 2025
Marshaling National Power Industries to Preserve America’s Strength and Thwart China’s Bid for Global Dominance
November 17, 2025
US National Power Industries Are at Risk
January 25, 2011
Krugman Flat Wrong that Competitiveness is a Myth
Related
February 3, 2023
