

The Alarming Performance of US Advanced Technology Product Trade

Over the last decade, U.S. trade performance has deteriorated significantly in advanced industries. That is a major problem because these industries have high fixed costs and require substantial investments in R&D, so they depend on large customer bases to achieve scale economies and remain globally competitive.
KEY TAKEAWAYS
Key Takeaways
Contents
Change in ATP Imports and Exports, 2014–2024. 3
Introduction
In advanced, globally traded industries, U.S. competitiveness hinges on gaining and sustaining global market share. Industries characterized by high fixed costs, particularly those requiring substantial investments in research and development (R&D), engineering, and capital equipment depend on large customer bases to achieve scale economies, reduce marginal costs, and accelerate learning from diverse users. By selling into major foreign markets while maintaining strong domestic market share, U.S. firms can spread innovation costs over greater volumes, sharpen their technological edge, and adapt more quickly to evolving global demand. These advanced industries are not merely sources of economic growth. They are what the Information Technology and Innovation Foundation (ITIF) calls “national power industries,” supplying the technologies, inputs, and capabilities that underpin U.S. military strength, economic resilience, and geopolitical influence.[1]
The stakes therefore transcend mere economics. National power today depends on strength across a spectrum of sectors spanning pure defense production, dual-use technologies employed in both military and commercial applications, and enabling industries that support the broader industrial commons. These industries include semiconductors, aerospace, biopharmaceuticals, telecommunications equipment, advanced chemicals, precision machinery, robotics, artificial intelligence systems, and dozens of other advanced sectors. Weakening or fatally injuring firms in these industries would grant China dangerous leverage over the United States and its allies, while simultaneously eroding U.S. defense production capacity and surge capability in times of conflict.
Despite this, the United States is now running net trade deficits in many strategically important advanced industries. In fact, the Census Bureau publishes trade data on 10 advanced technology product (ATP) groups—ranging from biotechnology to nuclear technology—and U.S. trade performance has deteriorated sharply in most of them over the past two decades, signaling an erosion of America’s advanced industrial base. Putting aside the weapons product group, the United States ran net trade surpluses in four of the other nine ATP groups in 2014.[2] But by 2024, that position had reversed to deficits in eight of those nine ATP groups.[3] Persistent trade deficits in the advanced industries that produce those products are not benign. They reflect declining global market share, weakened scale economies, slower learning effects, and reduced capacity to finance sustained innovation, all of which undermine the power industries that depend on these sectors.
Contrary to prevailing narratives, China has not been the primary driver of the deterioration. While U.S. net trade with China has consistently been in deficit, the largest negative shifts in ATP groups have come from other advanced economies, particularly the European Union and Mexico.[4] U.S. net trade with both regions has shifted from surplus to substantial deficit ATPs, with the magnitude of these changes multiple times larger than the net trade deterioration with China. In this context, European calls for digital sovereignty from the United States ring hollow—the EU already dominates the United States in trade across many ATPs.
The Census Bureau publishes trade data on 10 ATP groups—ranging from biotechnology to nuclear technology—and U.S. trade performance has deteriorated sharply in most of them over the past two decades, signaling an erosion of America’s advanced industrial base.
This data predates the effects of the Trump administration’s liberation day tariffs. Assessing forthcoming Census data therefore will be critical to determine whether those measures materially altered the trajectory of U.S. advanced industry trade performance. Regardless of the impact of the Trump administration’s policies, the broader lesson remains unchanged. The United States lacks a coherent national power industry strategy that recognizes that competition in advanced industries is fundamentally a win-or-lose proposition, not a matter of mutual gain.
As ITIF explains in other reports in this series, such a strategy should be grounded in four key principles:
1. Industries differ fundamentally in their strategic importance, and defense, dual use, and enabling sectors must be prioritized even at short-term economic cost.
2. Markets are indifferent to national power, meaning unregulated market forces will not preserve strategic capabilities without active government direction.
3. Production matters as much as innovation does, and the United States cannot afford a model in which it invents technologies that strategic rivals manufacture.
4. Long-term strategic positioning must take precedence over short-term efficiency, including the acceptance of higher prices, redundant capacity, and sustained subsidies as the cost of not losing the techno-economic competition.
Change in ATP Imports and Exports, 2014–2024
This report examines 9 of the Census Bureau’s 10 ATP groups: biotechnology, life sciences, optoelectronics, information and communications, electronics, flexible manufacturing, advanced materials, aerospace, and nuclear power.[5] The industries that produce these products are dual-use industries that are critical to U.S. national power. And while the United States ran a net trade surplus in these sectors in 2014, it ran a large net trade deficit in 2024.[6]
All Advanced Technology Product Groups
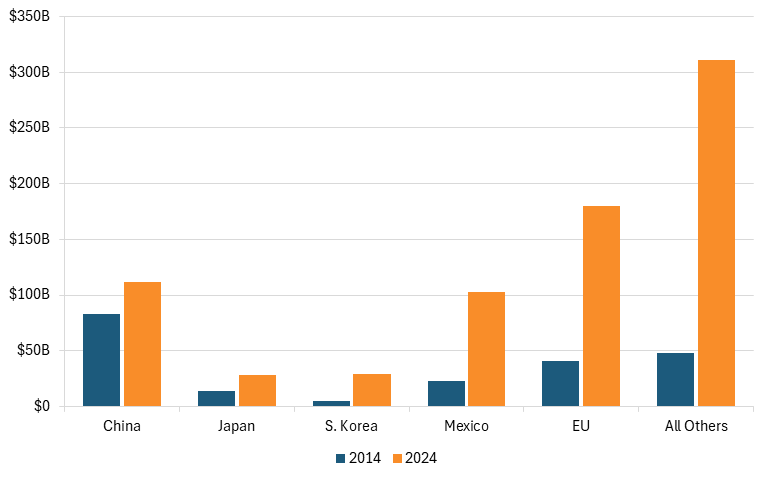
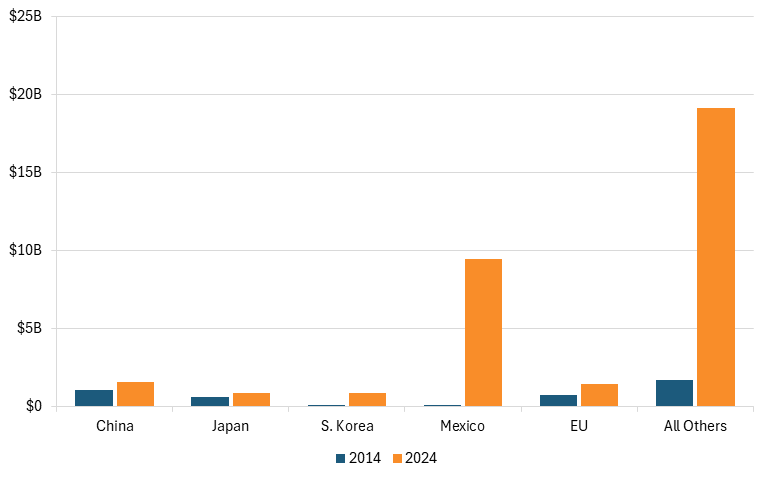
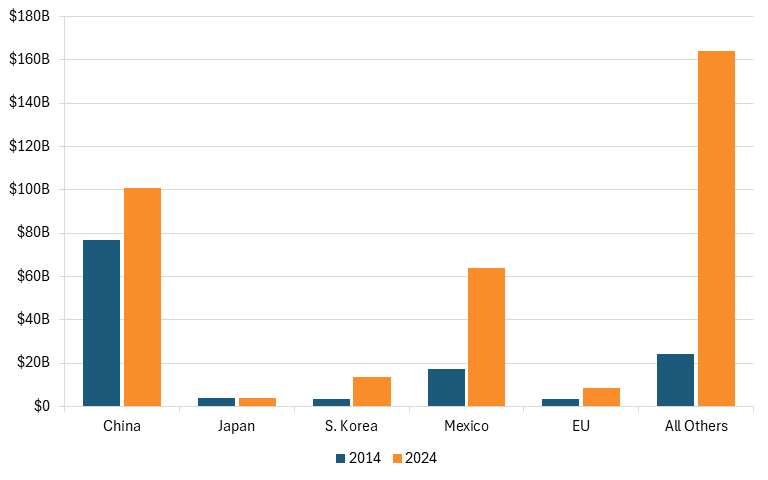
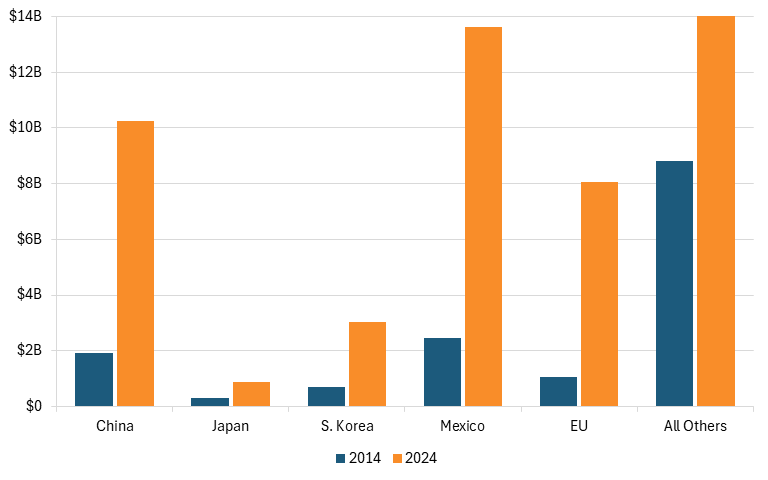
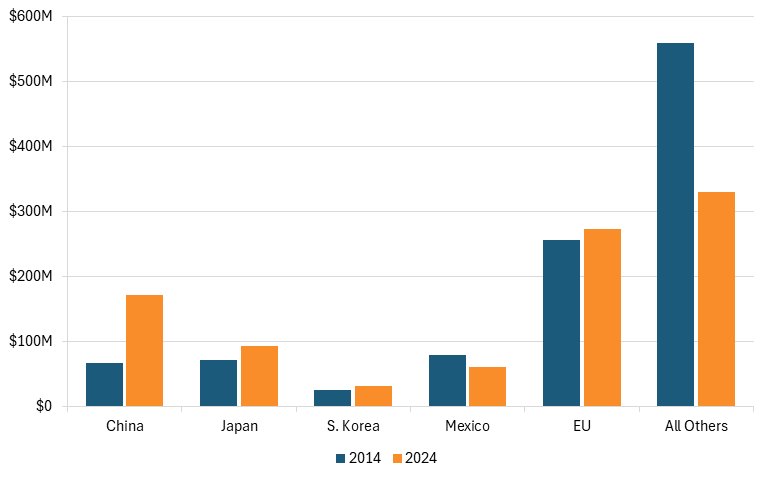
In 2024, the United States imported a cumulative $762 billion in nine ATP groups from around the world, with five countries/regions accounting for 59 percent. This includes $180 billion (24 percent) from the European Union, $112 billion (15 percent) from China, $102 billion (13 percent) from Mexico, $29 billion (4 percent) from South Korea, and $28 billion (4 percent) from Japan. (See figure 1.) These measured imports from countries regardless of the nationality of the company exporting the goods.
In 2014, China was the largest exporter of ATP to the United States; however, much faster growth in the EU has meant that this designation now belongs to Europe. U.S. trade restrictions imposed to counter China’s restrictions, as well as some Western companies moving ATP production out of China, may be behind this slower growth.
From 2014 to 2024, the United States’ ATP imports from the world rose 256 percent from $214 billion to $762 billion. In contrast, U.S. gross domestic product grew just 64 percent.
Imports from South Korea, Mexico, and the European Union grew the fastest at 459 percent, 342 percent, and 339 percent, respectively. Japan had a growth of 106 percent and China had a growth of 35 percent. In other words, South Korea, Mexico, and the EU are becoming a larger share of U.S. ATP imports.
Figure 1: U.S. imports of all ATPs from China, Japan, South Korea, Mexico, the EU, and others[7]
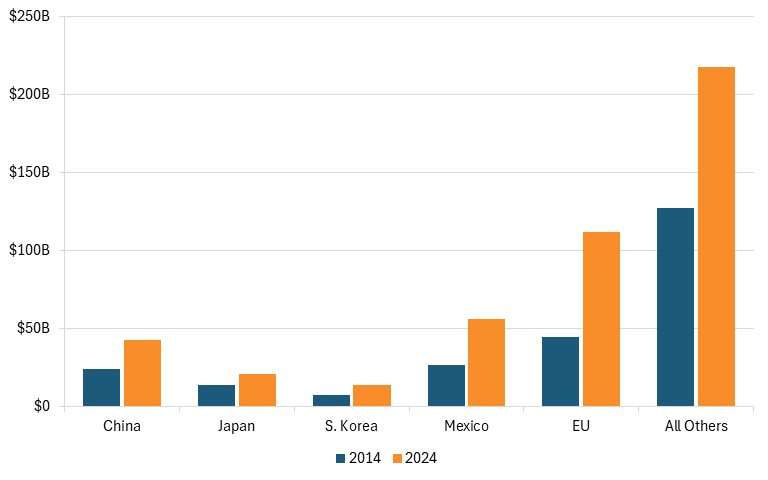
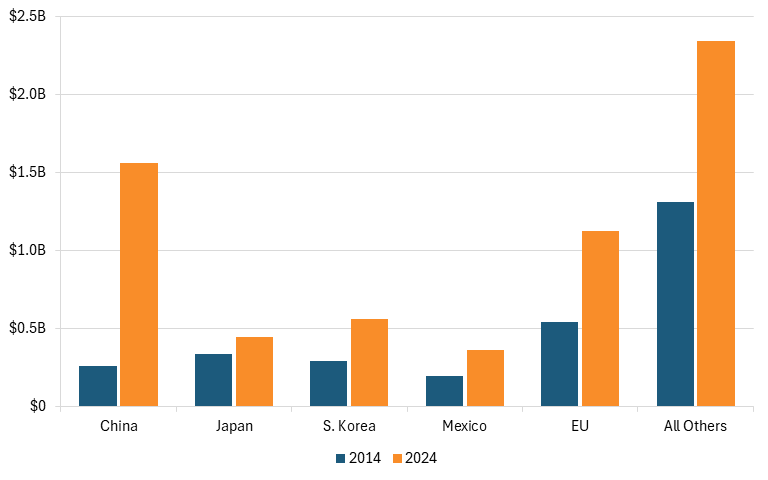
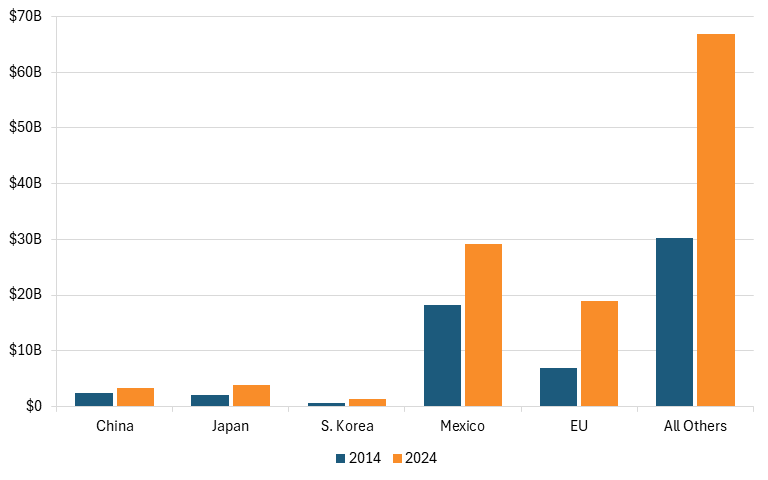
In 2024, the United States exported a cumulative $462 billion in ATP products to the world. Of this $462 billion, the United States exported $112 billion (24 percent) to the EU, $56 billion (12 percent) to Mexico, $43 billion (9 percent) to China, $21 billion (5 percent) to Japan, and $13 billion (3 percent) to South Korea. (See figure 2.)
From 2014 to 2024, while U.S. ATP imports rose 256 percent, U.S. exports rose just 90 percent from $243 billion to $462 billion. Exports to the EU saw the highest growth at 152 percent while Mexico grew at 112 percent; however, these growth rates are still multiple folds lower than U.S. imports from these nations. Falling below this growth rate, South Korea grew at 87 percent, China at 79 percent, and Japan at 51 percent.
Figure 2: U.S. exports of all ATPs to China, Japan, South Korea, Mexico, the EU, and others[8]
Throughout this report, net trade figures were calculated by subtracting each ATP product category’s imports from exports. However, due to the different products in imports and exports for each ATP group, the net trade figures reported here do not represent conventional trade balances. As such, this report examines the relative changes in net trade across nations. The main challenge of calculating net trade balance for each ATP category is that ATP import and export codes do not match up, as imports use HTS codes while exports use Schedule B codes.
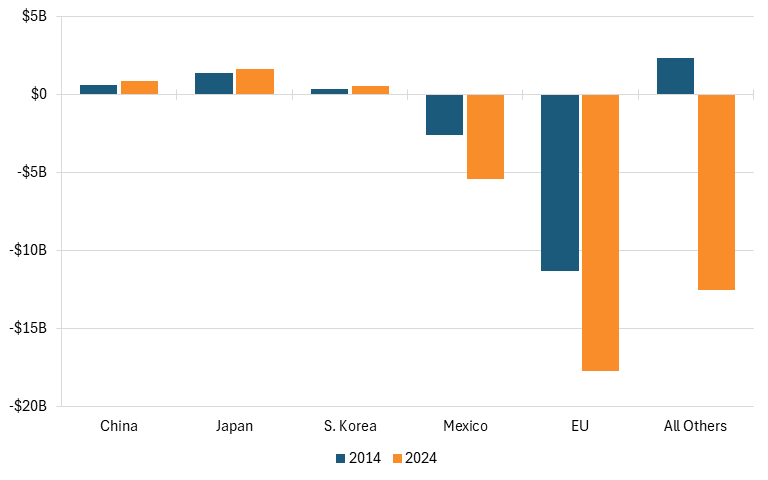
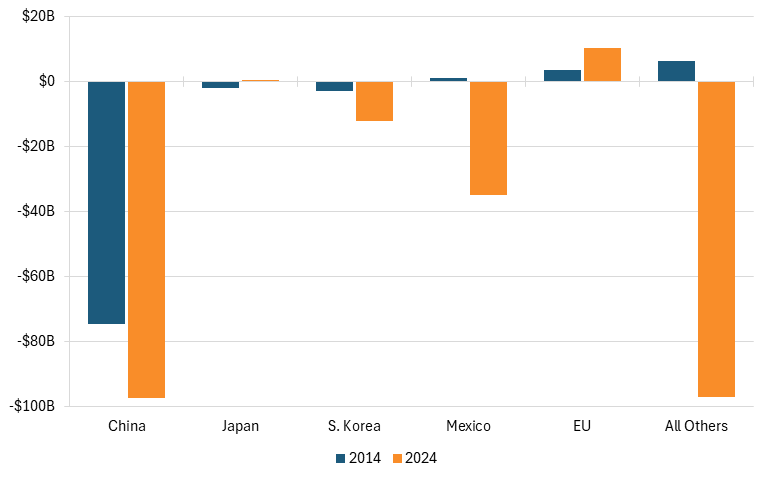
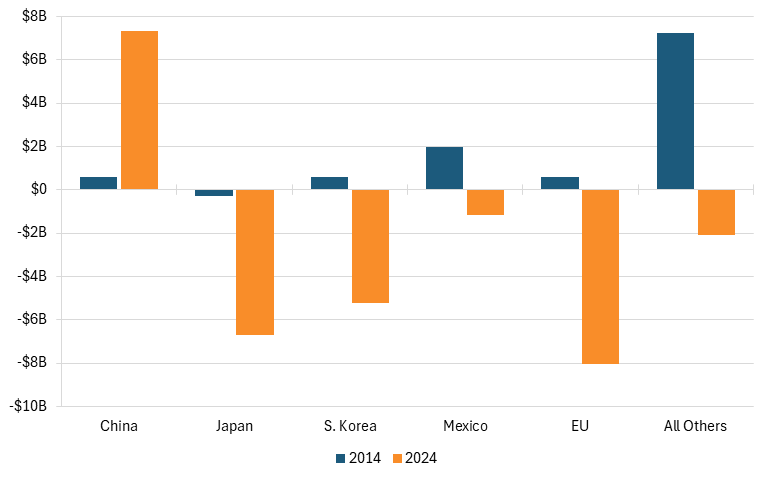
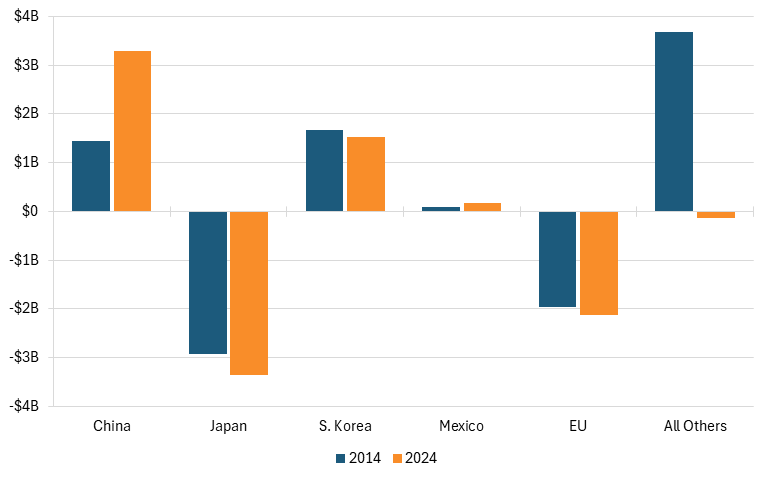
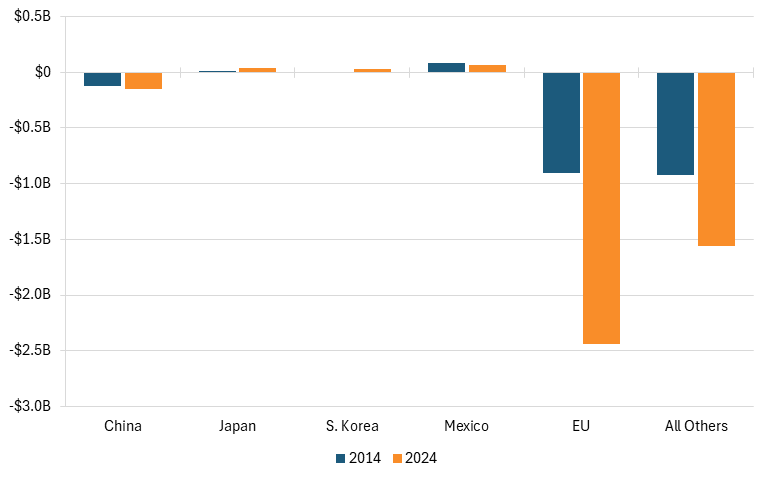
Due to U.S. ATP imports rising faster than exports did, the U.S. ATP net trade with the world fell from a $29 billion surplus (+$29 billion) to a $300 billion deficit (−$300 billion) from 2014 to 2024. With the largest negative change, U.S. ATP net trade with the EU fell from +$3.3 billion in 2014 to a staggering −$68 billion in 2024 while net trade with Mexico fell from +$3.2 billion to a staggering −$46.5 billion. Meanwhile, net trade with Japan fell from +$250 million to −$7 billion while trade with South Korea fell from +$2 billion to a −$15.7 billion. U.S. ATP net trade with China also declined from −$59 billion to −$69 billion. U.S. net trade with the rest of the world declined from +$79 billion to −$93 billion. It should be noted that the rise in deficit with the rest of the world may reflect Chinese transshipments or Chinese firms moving some of their factories to other nations, such as Vietnam. (See figure 3.)
Figure 3: U.S. net trade of ATPs with China, Japan, South Korea, Mexico, the EU, and others[9]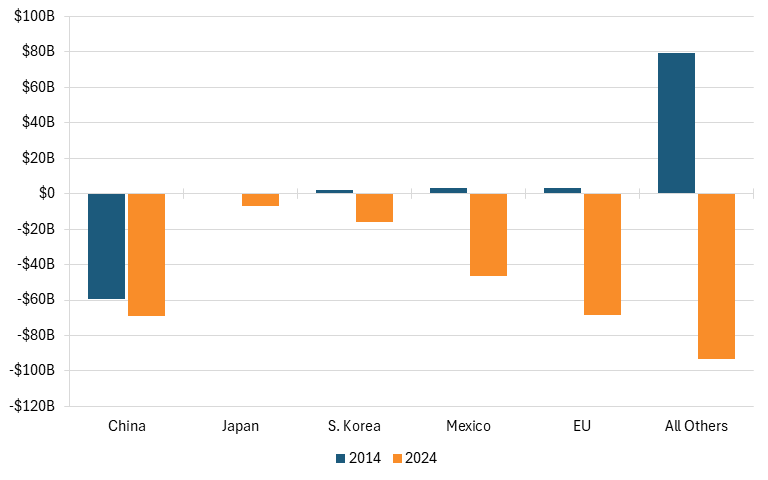
Biotechnology
The biotechnology ATP group is defined as “medical and industrial applications of advanced scientific discoveries in genetics to the creation of new drugs, hormones and other therapeutic items for both agricultural and human use.”[10]
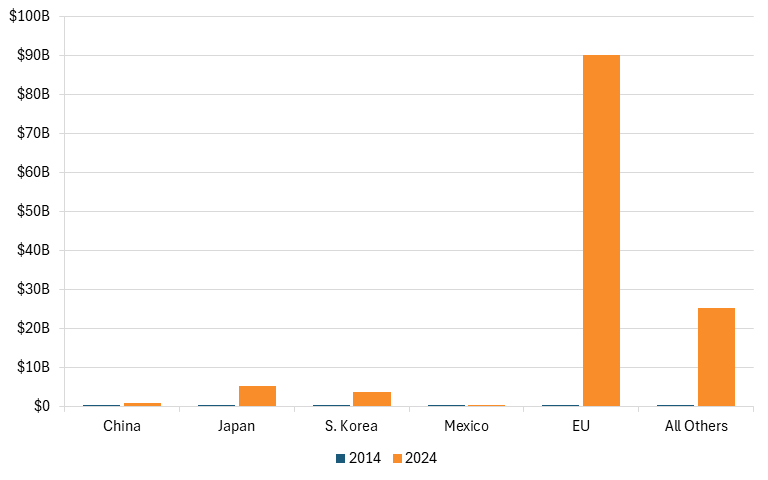
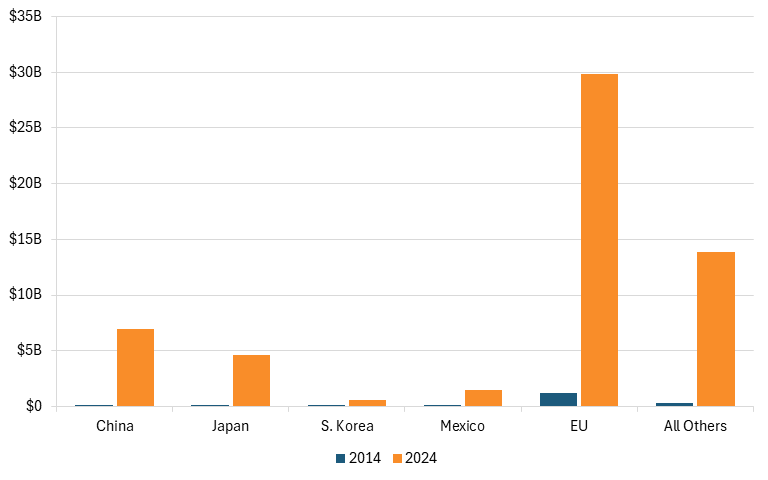
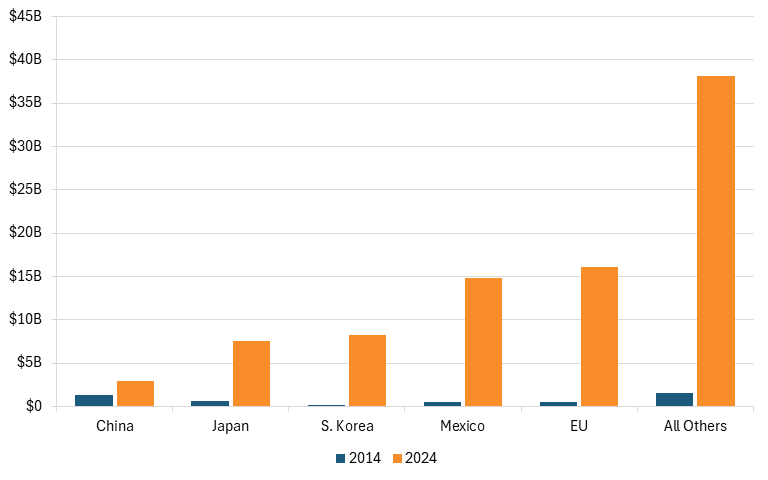
In 2024, the United States imported $125 billion in biotechnology ATP products from the world. Of this $125 billion, the European Union provided 72 percent, or $90 billion. The United States imported $5.3 billion (4 percent) from Japan, $3.7 billion (3 percent) from South Korea, $782 million from China (1 percent), and $19 million (less than 1 percent) from Mexico. (See figure 4.)
From 2014 to 2024, U.S. biotechnology imports rose 301 times, from $415 million to $125 billion, reflecting in large part the rapid growth of the biotech sector. Partly due to its size, the EU continues to be the largest exporter of biotechnology to the United States, rising from $264 million in 2014 to $90 billion in 2024. Of the five regions, China is no longer the second highest exporter, as Japan has taken this spot with exports rising from $17 million to $5.3 billion.
U.S. imports from South Korea, the EU, and Japan were the highest with growth of almost 5,000 times, 341 times, and 314 times, respectively. Meanwhile, U.S. imports from China and Mexico grew 15 times and 1 time, respectively. The significant growth is largely due to 16 of 28 products in this group going from zero imports to a range of hundreds of thousands to billions.
Figure 4: U.S. imports of biotechnology ATP from China, Japan, South Korea, Mexico, the EU, and others[11]
In 2024, the United States only exported $57 billion in biotechnology ATP products to the world, with $30 billion (52 percent) to the EU, $7 billion (12 percent) to China, $5 billion (8 percent) to Japan, $1.5 billion (3 percent) to Mexico, and $605 million (1 percent) to South Korea. (See figure 5.)
From 2014 to 2024, the United States’ biotechnology ATP exports to the world rose from $1.5 billion to $57 billion, which meant it grew only 36 times while imports grew 301 times. U.S. exports to China grew 1,469 times followed by Japan at 264 times, Mexico at 119 times, and South Korea at 59 times. At the lowest, U.S. exports to the EU grew only 24 times despite its imports growing 341 times.
Figure 5: U.S. exports of biotechnology ATP to China, Japan, South Korea, Mexico, the EU, and others[12]
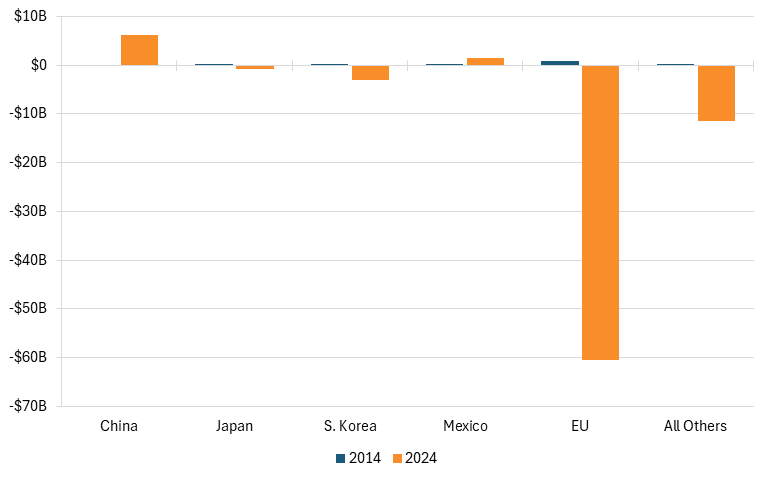
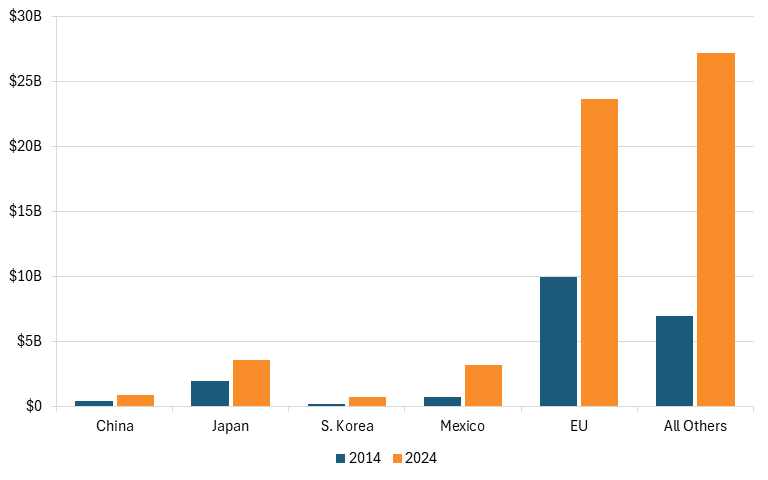
From 2014 to 2024, U.S. biotech net trade with the world declined from +$1.1 billion to −$68 billion. U.S. net trade with the European Union declined the most from +$950 million to −$60 billion.
Meanwhile, U.S. net trade with Japan declined from +$587,944 to −$697 million and South Korea from +$9.3 million to −$3.1 billion. In contrast, net trade with China and Mexico increased. During this period, net trade with China rose from −$43 million to +$6.1 billion surplus while net trade with Mexico increased from +$2.3 million to +$1.4 billion. U.S. net trade with the rest of the world declined from +$204 million to −$11.5 billion. (See figure 6.)
Figure 6: U.S. net trade of biotechnology ATP with China, Japan, South Korea, Mexico, the EU, and others[13]
Life Sciences
The life sciences ATP group is defined as products that are for “the application of scientific advances (other than biological) to medical science. Recent advances, such as nuclear resonance imaging, echocardiography, and novel chemistry, coupled with new production techniques for the manufacture of drugs have led to many new products for the control or eradication of disease.”[14] U.S. trade in the life sciences sector is especially critical, as U.S. pharmaceutical companies need scale to recoup the cost of developing and bringing new drugs to the market.
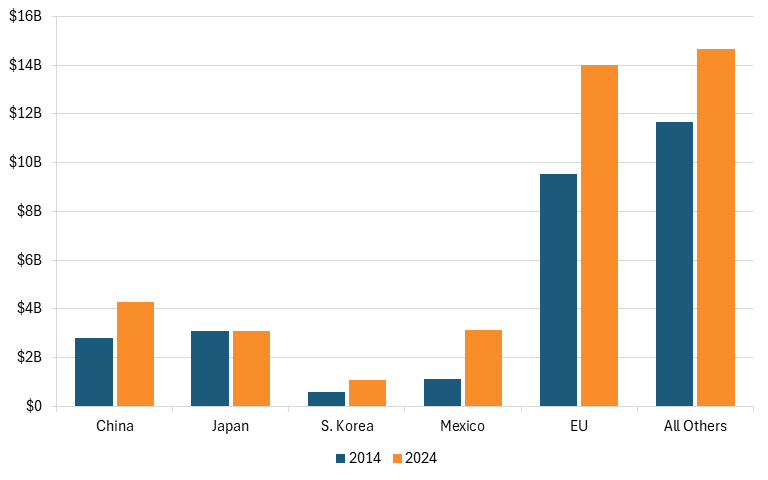
In 2024, the United States imported $73 billion in life sciences ATP products from the world. Of this $73 billion, the United States imported $32 billion (44 percent) from the EU, $8.6 billion (12 percent) from Mexico, $3.4 billion (5 percent) from China, $1.5 billion (2 percent) from Japan, and $541 million (1 percent) from South Korea. (See figure 7.)
From 2014 to 2024, U.S. life sciences ATP imports from the world rose 92 percent from $38 billion to $73 billion. During this period, the EU and Mexico continue to have the highest exports of the five regions.
U.S. life sciences ATP imports from Mexico rose 130 percent while imports from South Korea rose 104 percent. Falling below the growth rate, U.S. imports from China rose 57 percent and imports from the EU rose 52 percent. U.S. imports from Japan fell 12 percent from $1.7 billion to $1.5 billion.
Figure 7: U.S. imports of life sciences ATP from China, Japan, South Korea, Mexico, the EU, and others[15]
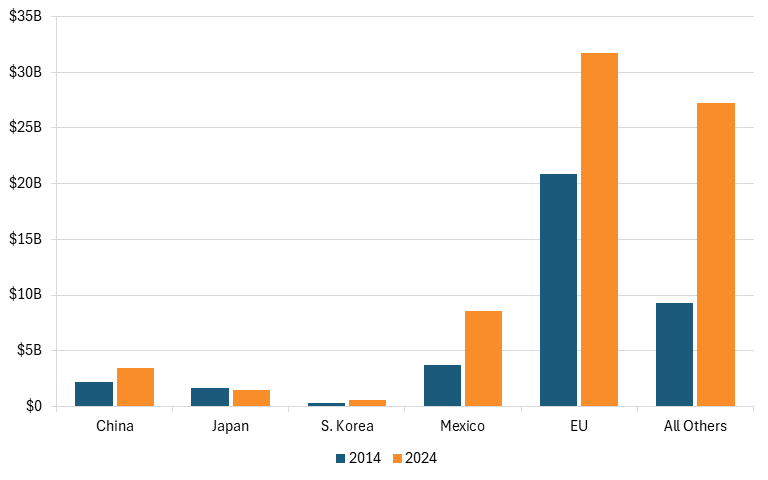
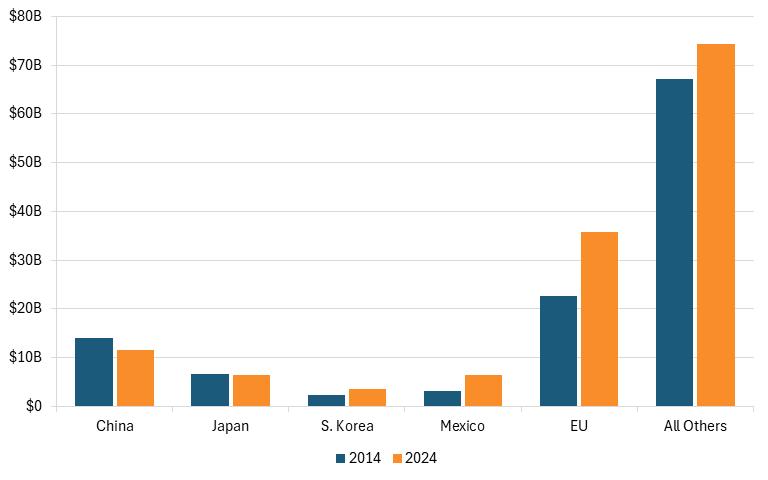
In 2024, the United States only exported $40 billion in life sciences ATP products to the world. Of this $40 billion, the United States exported $14 billion (35 percent) to the EU, $4.3 billion (11 percent) to China, $3.1 billion (8 percent) to Mexico, $3.1 billion (8 percent) to Japan, and $1.1 billion (3 percent) to South Korea. (See figure 8.)
From 2014 to 2024, the U.S. life sciences ATP exports to the world rose 40 percent from $29 billion to $40 billion while imports rose faster at 92 percent. U.S. exports to China also rose 53 percent, the EU 47 percent, Mexico 179 percent, and Japan only 1 percent.
Figure 8: U.S. exports of life sciences ATP to China, Japan, South Korea, Mexico, the EU, and others[16]
From 2014 to 2024, the U.S. net trade with the world in life sciences products declined from −$9.2 billion to −$33 billion . During this period, U.S. net trade in life sciences products with the EU declined the most from −$11 billion to −$18 billion. Coming in second, U.S. net trade with Mexico declined from −$2.6 billion to −$5.4 billion. U.S. net trade with the other three nations saw increases in surplus. U.S. net trade with the rest of the world declined from +$2.4 billion to −$12.5 billion. In other words, U.S. trade deficit was primarily with the EU, Mexico, and the rest of the world. (See figure 9.)
Figure 9: U.S. net trade of life sciences ATP with China, Japan, South Korea, Mexico, the EU, and others[17]
Optoelectronics
The optoelectronics ATP group consists of “electronic products and components that involve the emitting and/or detection of light.”[18] Some products in this group include optical scanners, optical disc players, solar cells, photo-sensitive semiconductors, and laser printers.[19]
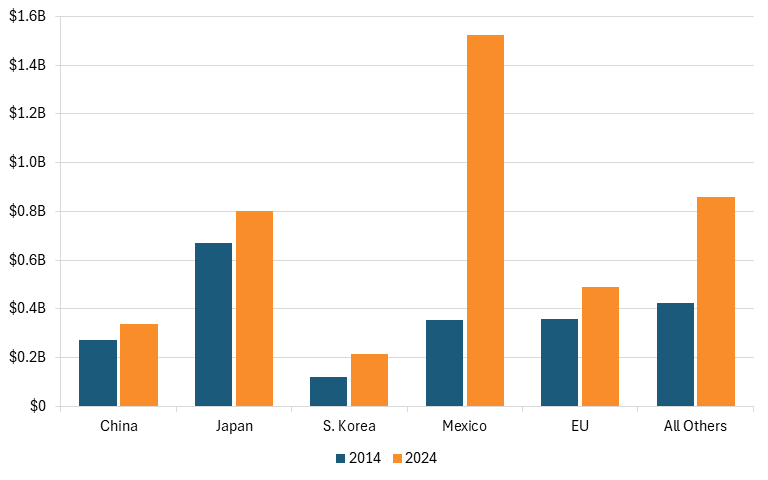
In 2024, the United States imported $33 billion in optoelectronics ATP products from the world. Of this $33 billion, the United States imported $9.4 billion (28 percent) from Mexico, $1.6 billion (5 percent) from China, $1.4 billion (4 percent) from the EU, $887 million (3 percent) from South Korea, and $879 million (3 percent) from Japan. (See figure 10.)
From 2014 to 2024, U.S. imports of optoelectronics ATP products from the world rose seven times from $4.1 billion to $33 billion. While China exported the most to the United States in 2014, Mexico exported the most to the United States as of 2024. Indeed, U.S. optoelectronics ATP imports to Mexico rose 232 times, rising from $40 million to $9.4 billion. U.S. imports from South Korea also grew at 20 times while imports from the EU rose 1 time and Japan and China both rose 0.5 times.
Figure 10: U.S. imports of optoelectronics ATP from China, Japan, South Korea, Mexico, the EU, and others[20]
In 2024, the United States only exported $6.4 billion in optoelectronic ATP products to the world. Of the $6.4 billion, the United States exported $1.6 billion (24 percent) to China, $1.1 billion (18 percent) to European Union, $564 million (9 percent) to South Korea, $444 million (7 percent) to Japan, and $365 million (6 percent) to Mexico. (See figure 11.)
From 2014 to 2024, U.S. optoelectronic ATP exports to the world rose 118 percent, about 6 times less than imports, from $3 billion to $6.4 billion. U.S. optoelectronic ATP exports to China rose 498 percent, the EU rose 108 percent, South Korea 94 percent, Mexico 85 percent, and Japan 33 percent.
Figure 11: U.S. exports of optoelectronics ATP to China, Japan, South Korea, Mexico, the EU, and others[21]
From 2014 to 2024, U.S. net trade with the world in optoelectronic products declined from −$1.2 billion to −$27 billion . At its highest, U.S. net trade with Mexico declined $9.2 billion from +$156 million to −$9.1 billion. U.S. net trade with Japan declined from −$250 million to −$436 million while trade with the EU declined from −$170 million to −$318 million. Meanwhile, U.S. optoelectronics net trade with South Korea declined from +$247 million to −$324 million. In contrast, net trade with China increased from −$785 million to −$26 million. U.S. net trade with the rest of the world declined from −$369 million to −$16.8 billion. (See figure 12.)
Figure 12: U.S. net trade of optoelectronics ATP with China, Japan, South Korea, Mexico, the EU, and others[22]
Information and Communications
The information and communications ATP group consists of products “that are able to process increased volumes of information in shorter periods of time.”[23] Some of the products included in this group are central processing units, disk drive units and control units, modems, facsimile machines, and telephonic switching apparatus.[24] Note that semiconductors are in the electronics category.
In 2024, the United States imported $354 billion in information and communications ATP from the world. Of this $354 billion, the United States imported $101 billion (28 percent) from China, $64 billion (18 percent) from Mexico, $13.5 billion (4 percent) from South Korea, $8.5 billion from the EU (2 percent), and $3.7 billion (1 percent) from Japan. (See figure 13.)
From 2014 to 2024, U.S. information and communications ATP imports from the world rose 175 percent from $129 billion to $354 billion. During this period, China and Mexico both continued to export the most information and communications products to the United Stated States. Despite this, Chinese exports only rose 31 percent, but Mexico’s exports rose 274 percent. Meanwhile, U.S. imports from South Korea rose 282 percent, the EU 143 percent, and China 31 percent. U.S. imports from Japan declined 7 percent from $4 billion to $3.7 billion.
Figure 13: U.S. imports of information and communications ATP from China, Japan, South Korea, Mexico, the EU, and others[25]
In 2024, the United States only exported $123 billion in information and communications ATP to the world. Of the $123 billion, the United States imported $29 billion (24 percent) to Mexico, $19 billion (15 percent) to the EU, $3.9 billion (3 percent) to Japan, $3.3 billion (3 percent) to China, and $1.4 billion (1 percent) to South Korea. (See figure 14.)
From 2014 to 2024, U.S. information and communications ATP exports to the world rose 104 percent from $61 billion to $123 billion while imports rose at a higher rate of 175 percent. U.S. exports to the EU rose 175 percent and exports to South Korea rose 113 percent. Meanwhile, U.S. exports to Japan rose 86 percent, Mexico 60 percent, and China 35 percent.
Figure 14: U.S. exports of information and communications ATP to China, Japan, South Korea, Mexico, the EU, and others[26]
From 2014 to 2024, U.S. net trade with the world in information and communications products declined from −$69 billion to −$231 billion. Of the five regions, U.S. net trade with Mexico saw the largest decline from + $1.1 billion to −$35 billion, indicating that it played a key role in the U.S. net trade deficit.
U.S. net trade with China and South Korea also saw a decline during this period. Indeed, net trade with South Korea saw a decline from −$3 billion to −$12 billion and China declined from −$74 billion to −$98 billion. In contrast, net trade with Japan rose from −$2 billion to +$147 million while net trade with the EU rose from +$3.4 billion to +$10 billion. U.S. net trade with the rest of the world declined from +$6.3 billion to −$97 billion. (See figure 15.)
Figure 15: U.S. net trade of information and communications ATP with China, Japan, South Korea, Mexico, the EU, and others[27]
Electronics
The electronics ATP group consists of products that are “recent design advances in electronic components (with the exception of opto-electronic components) that result in improved performance and capacity and in many cases reduced size.”[28] Some of the products included in this group are integrated circuits, multilayer printed circuit boards and surface-mounted components such as capacitors and resistors. This category includes semiconductors.[29]
In 2024, the United States imported $88 billion in electronic ATP products from the world. Of this $88 billion, the United States imported $16 billion (18 percent) from the EU, $15 billion (17 percent) from Mexico, $8.2 billion (9 percent) from South Korea, $7.6 billion (9 percent) from Japan, and $2.9 billion (3 percent) from China. (See figure 16.)
From 2014 to 2024, U.S. electronics ATP imports from the world rose 18 times from $4.6 billion to $88 billion. During this period, China exported the most to the United States in 2014, but by 2024, the EU was exporting the most to the United States in electronics. Indeed, U.S. imports from the EU rose 34 times while those from China only rose 1.2 times. Meanwhile, U.S. imports from South Korea rose almost 69 times, Mexico 29 times, and Japan 11 times.
Figure 16: U.S. imports of electronics ATP from China, Japan, South Korea, Mexico, the EU, and others[30]
In 2024, the United States only exported $72 billion of electronics ATP product to the world. Of the $72 billion, the United States exported $13.6 billion (19 percent) to Mexico, $10 billion (14 percent) to China, $8.1 billion (11 percent) to the EU, $3 billion (4 percent) to South Korea, and $880 million (1 percent) to Japan. (See figure 17.)
From 2014 to 2024, U.S. electronics ATP exports to the world rose 3.7 times from $15 billion to $72 billion while imports rose a staggering 18 times. U.S. exports to the EU rose 6.7 times, Mexico 4.6 times, and China 4.4 times. Meanwhile, U.S. exports to South Korea rose 3.3 times and exports to Japan rose 1.8 times.
Figure 17: U.S. exports of electronics ATP to China, Japan, South Korea, Mexico, the EU, and others[31]
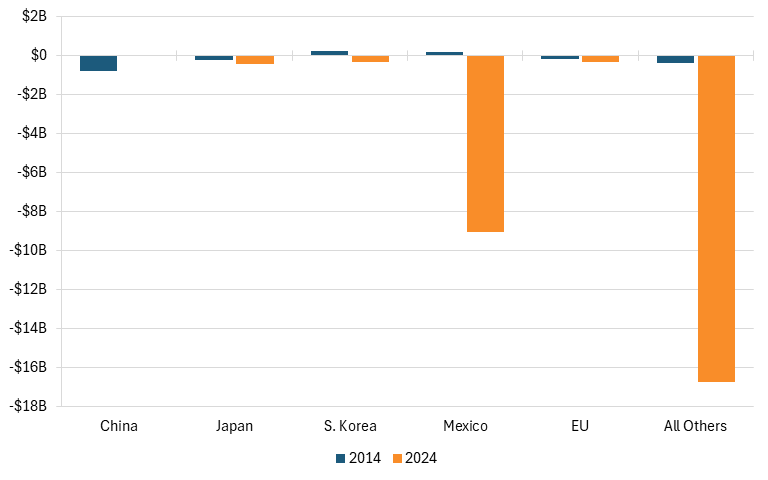
U.S. net trade with the world in electronics products declined from +$10.1 billion to −$16 billion from 2014 to 2024. At the highest, U.S. net trade with the EU declined from +$586 million to −$8 billion, indicating it played the largest role of the five regions in the U.S. net trade deficit. Meanwhile, U.S. net trade with Japan declined from −$301 million to −$7 billion, South Korea from +$587 million to −$5.2 billion, and Mexico from +$2 billion to −$1.2 billion. Only net trade with China increased from +$588 million to +$7 billion. U.S. net trade with the rest of the world declined from +$7.2 billion to −$2.1 billion. (See figure 18.)
Figure 18: U.S. net trade of electronics ATP with China, Japan, South Korea, Mexico, the EU, and others[32]
Flexible Manufacturing
The flexible manufacturing ATP group “encompasses advances in robotics, numerically controlled machine tools, and similar products involving industrial automation that allow for greater flexibility to the manufacturing process and reduce the amount of human intervention.”[33] Some of the products included are robots, numerically controlled machine tools, and semiconductor production and assembly machines.[34]
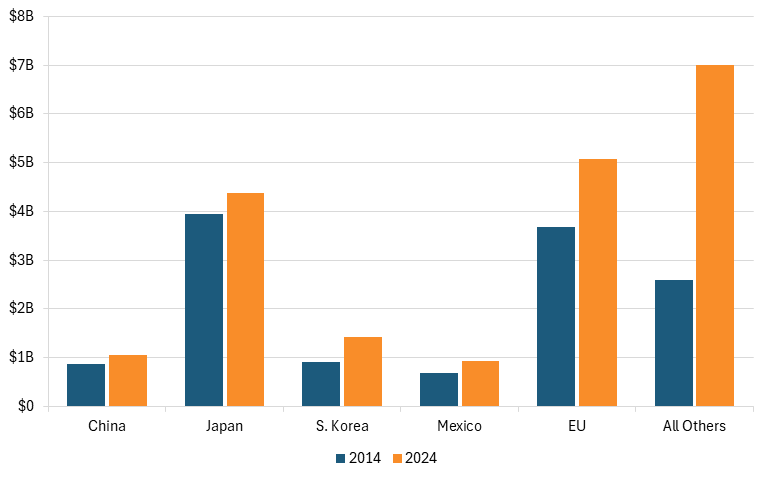
In 2024, the United States imported $19.9 billion in flexible manufacturing ATP products from the world. Of the $20 billion, the United States imported $5.1 billion (26 percent) from the EU, $4.4 billion (22 percent) from Japan, $1.4 billion (7 percent) from South Korea, $1.1 billion (5 percent) from China, and $934 million (5 percent) from Mexico. (See figure 19.)
From 2014 to 2024, U.S. flexible manufacturing ATP imports from the world rose 57 percent from $12.7 billion to $19.9 billion. While Japan was the leading exporter of flexible manufacturing products to the United States in 2014, the EU is now leading in this area. This is partly because the EU export growth rate was 38 percent compared to Japan’s 11 percent. Additionally, U.S. imports to South Korea also grew 55 percent, Mexico 36 percent, and China 22 percent.
Figure 19: U.S. imports of flexible manufacturing ATP from China, Japan, South Korea, Mexico, the EU, and others[35]
In 2024, the United States only exported $19.3 billion in flexible manufacturing ATP products to the world. Of the $19.3 billion, the United States exported $4.3 billion (23 percent) to China, $3 billion (15 percent) to South Korea, $3 billion (15 percent) to the EU, $1.1 billion (6 percent) to Mexico, and $1 billion (5 percent) to Japan. (See figure 20.)
From 2014 to 2024, U.S. flexible manufacturing ATP exports to the world rose 31 percent from $14.7 billion to $19.3 billion compared to imports rising 57 percent. U.S. exports to China rose 88 percent, the EU 73 percent, and Mexico 42 percent. Falling below this rate, U.S. exports to South Korea rose 14 percent while exports to Japan declined 0.4 percent.
Figure 20: U.S. exports of flexible manufacturing ATP to China, Japan, South Korea, Mexico, the EU, and others[36]
From 2014 to 2024, U.S. net trade with the world declined from +$2 billion to −$631 million. Of the five regions, U.S. net trade with Japan declined the most from −$2.9 billion to −$3.4 billion, indicating it contributed the largest share to the U.S. net trade deficit. Meanwhile, U.S. net trade with South Korea also declined from +$1.7 billion to +$1.5 billion and the EU declined from −$2 billion to −$2.1 billion. Net trade with China saw an increase from +$1.4 billion to +$3.3 billion while Mexico saw an increase of $88 million to +$166 million. U.S. net trade with the rest of the world declined from +$3.7 billion to −$136 million. (See figure 21.)
Figure 21: U.S. net trade of flexible manufacturing ATP with China, Japan, South Korea, Mexico, the EU, and others[37]
Advanced Materials
The advanced materials ATP group consists of products that are “recent advances in the development of materials that allow for further development and application of other advanced technologies.”[38] Some products included in this group are semiconductor materials, optical fiber cable, and video discs.[39]
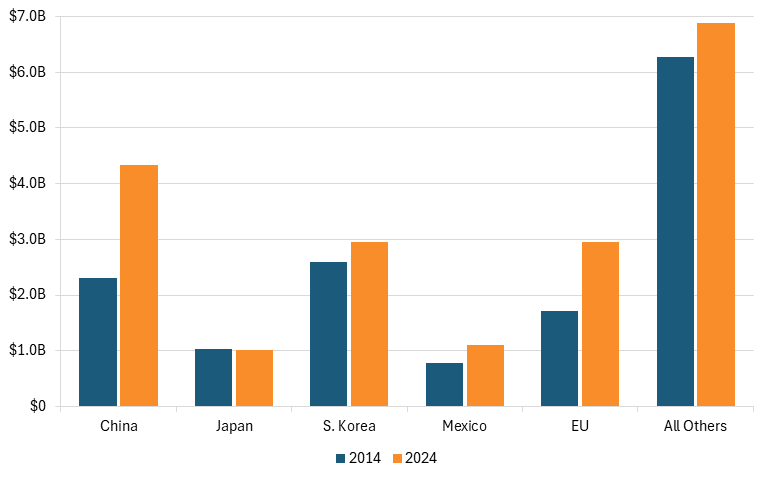
In 2024, the United States imported $4.2 billion in advanced materials ATP products from the world. Of the $4.2 billion, the United States imported $1.5 billion (36 percent) from Mexico, $800 million (19 percent) from Japan, $492 million (12 percent) from the EU, $337 million (8 percent) from China, and $215 million (5 percent) from South Korea. (See figure 22.)
From 2014 to 2024, U.S. advanced materials ATP imports from the world rose 92 percent from $2.2 billion to $4.2 billion. In 2014, Japan exported the most advanced materials to the United States but by 2024, Mexico was the highest exporter of the five regions. This is partly due to Mexico’s exports rising 328 percent compared with Japan’s 19 percent. Meanwhile, U.S. imports from South Korea also rose 80 percent, the EU 37 percent, and China 24 percent.
Figure 22: U.S. imports of advanced materials ATP from China, Japan, South Korea, Mexico, the EU, and others[40]
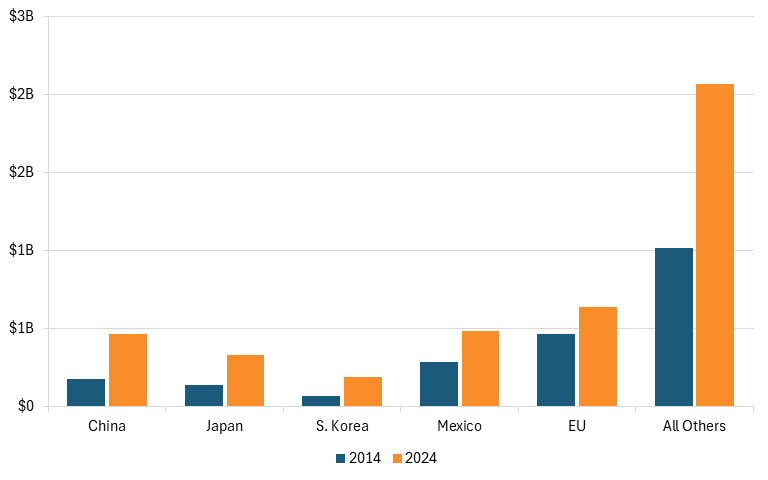
In 2024, the United States exported $4.2 billion in advanced materials ATP products to the world. Of the $4.2 billion, the United States exported $639 million (15 percent) to the EU, $486 million (12 percent) to Mexico, $466 million (11 percent) to China, $328 million (8 percent) to Japan, and $188 million (4 percent) to South Korea. (See figure 23.)
From 2014 to 2024, U.S. advanced materials ATP exports rose 94 percent from $2.2 billion to $4.2 billion while imports only rose 92 percent. U.S. exports to South Korea rose 170 percent, China 163 percent, and Japan 136 percent while U.S. exports to Mexico only rose 71 percent and the EU 38 percent.
Figure 23: U.S. exports of advanced materials ATP to China, Japan, South Korea, Mexico, the EU, and others[41]
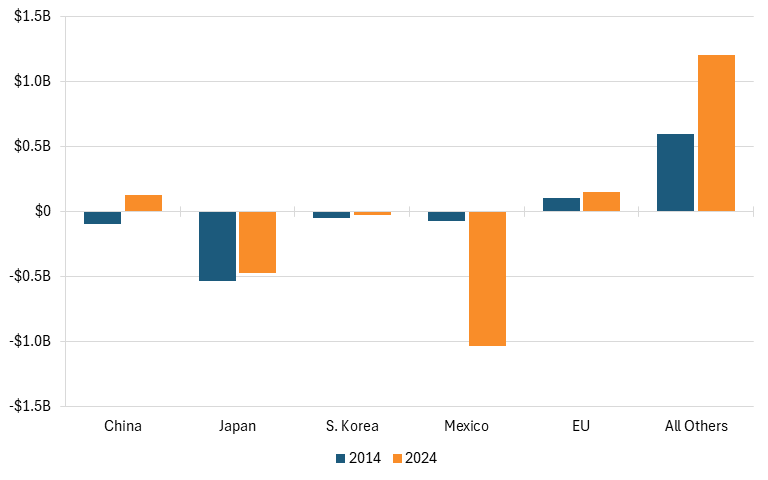
From 2014 to 2024, U.S. net trade with the world in advanced materials products remained relatively the same, declining from −$51 million to −$54 million. Of the five regions, U.S. net trade with Mexico saw the largest decline from −$70 million to −$1 billion, indicating that it played a role in the U.S. net trade deficit. In contrast, U.S. net trade with China rose from a −$95 million to +$129 million. Meanwhile, net trade with Japan, South Korea, and the EU also rose. (See figure 24.)
Figure 24: U.S. net trade of advanced materials ATP with China, Japan, South Korea, Mexico, the EU, and others[42]
Aerospace
The aerospace ATP group consists of “most new military and civil helicopters, airplanes and spacecraft (with the exception of communications satellites that are included under Information & Communications Technology). Other products included are turbojet aircraft engines, flight simulators and automatic pilots.”[43]
In 2024, the United States imported $59 billion in aerospace ATP product from the world. Of this $59 billion, the United States imported $24 billion (40 percent) from the EU, $3.6 billion (6 percent) from Japan, $3.2 billion (5 percent) from Mexico, $844 million (1 percent) from China, and $721 million (1 percent) from South Korea. (See figure 25.)
From 2014 to 2024, U.S. aerospace ATP imports rose 192 percent from $20 billion to $59 billion. During this period, the EU continued to be the largest exporter of aerospace products to the United States. U.S. imports from Mexico rose 322 percent and from South Korea rose 261 percent, while U.S. imports from the EU only rose 137 percent, China 113 percent, and Japan 85 percent.
Figure 25: U.S. imports of aerospace ATP from China, Japan, South Korea, Mexico, the EU, and others[44]
In 2024, the United States exported $138 billion in aerospace ATP products to the world. Of the $138 billion, the United States exported $36 billion (26 percent) to the EU, $12 billion (8 percent) to China, $6.5 billion (5 percent) to Mexico, $6.4 billion (5 percent) to Japan, and $3.7 billion (3 percent) to South Korea. (See figure 26.)
From 2014 to 2024, U.S. aerospace ATP exports to the world rose 19 percent from $116 billion to $138 billion while imports rose 192 percent. U.S. aerospace ATP exports to Mexico rose 103 percent, South Korea 60 percent, and the EU 58 percent. Meanwhile, U.S. exports to China and Japan declined by 17 percent and 4 percent, respectively.
Figure 26: U.S. exports of aerospace ATP to China, Japan, South Korea, Mexico, the EU, and others[45]
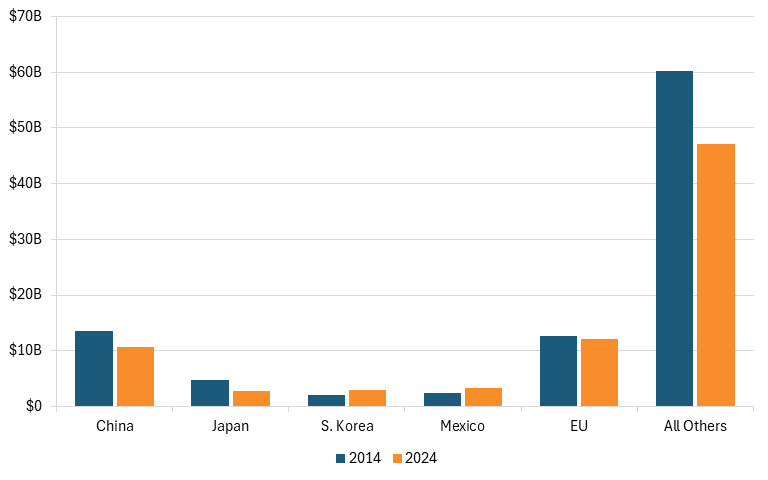
From 2014 to 2024, U.S. net trade with the world in aerospace products declined from +$96 billion to +$79 billion. Of the five regions, U.S. net trade with the China saw the largest decline from +$13.6 billion to +$10.8 billion, indicating that it played the largest role in the U.S. net trade decline. U.S. net trade with Japan and the EU also declined by $2 billion and $510 million, respectively. On the other hand, U.S. net trade with South Korea and Mexico rose by $853 million and $848 million, respectively. U.S. net trade with the rest of the world declined from +$60 billion to +$47 billion. (See figure 27.)
Figure 27: U.S. net trade of aerospace ATP with China, Japan, South Korea, Mexico, the EU, and others[46]
Nuclear Technology
The nuclear technology ATP group “encompasses nuclear power production apparatus. Includes nuclear reactors and parts, isotopic separation equipment and fuel cartridges. Excludes nuclear medical apparatus, which is included under Life Science.”[47]
In 2024, the United States imported $5 billion in nuclear technology ATP products from the world. Of this $5 billion, the United States imported $2.7 billion (54 percent) from the EU, $326 million (7 percent) from China, $57 billion (1 percent) from Japan, $4 billion (0.08 percent) from South Korea, and $656,167 (0.01 percent) from Mexico. (See figure 28.)
From 2014 to 2024, U.S. nuclear technology ATP imports from the world rose 71 percent from $2.9 billion to $5 billion. During this period, the EU has continued to be the largest exporter of nuclear technology to the United States. Indeed, U.S. imports from the EU rose 134 percent during this period. U.S. imports to Mexico also rose 193 percent and China 74 percent. In contrast, U.S. imports to South Korea fell 86 percent while imports to Japan fell 10 percent.
Figure 28: U.S. imports of nuclear technology ATP from China, Japan, South Korea, Mexico, the EU, and others[48]
In 2024, the United States exported only $959 million in nuclear technology ATP products to the world. Of this $959 million, the United States exported $273 million (28 percent) to the EU, $172 million (18 percent) to China, $92 million (10 percent) to Japan, $60 million (6 percent) to Mexico, and $32 million (3 percent) to South Korea. (See figure 29.)
From 2014 to 2024, U.S. nuclear technology exports to the world declined 10 percent while imports rose 71 percent. U.S. exports to China rose 155 percent, Japan 28 percent, South Korea 28 percent, and the EU 6 percent. In contrast, U.S. exports to Mexico declined 24 percent.
Figure 29: U.S. exports of nuclear technology ATP to China, Japan, South Korea, Mexico, the EU, and others[49]
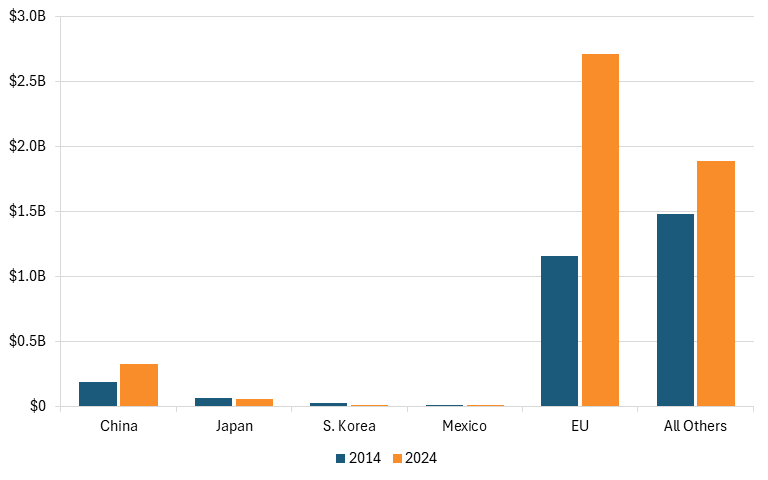
From 2014 to 2024, U.S. net trade with the world in nuclear technology declined from −$1.9 billion to −$4 billion. Of the five regions, U.S. net trade with the EU declined the most—by $1.5 billion—indicating that it contributed most to the U.S. net trade deficit. U.S. net trade with China also declined from −$120 million to −$155 million and Mexico from +$79 million to +$60 million. Meanwhile, net trade with Japan increased from +$8.9 million to +$36 million and net trade with South Korea increased from −$3.9 million to +$27.6 million. U.S. net trade with the rest of the world declined from −$924 million to −$1.6 billion. (See figure 30.)
Figure 30: U.S. net trade of nuclear technology ATP with China, Japan, South Korea, Mexico, the EU, and others[50]
Conclusion
The magnitude of the reversal cannot be overstated. As recently as 2014, U.S. advanced industries were broadly competitive in global trade markets. The United States ran a net trade surplus overall, with only five of nine ATP groups in deficit. A decade later, that position had only worsened. Today, the United States runs a net trade deficit in eight of nine ATP groups, signaling a systemic deterioration rather than isolated sectoral weakness. This is not a marginal shift at the edges of trade performance. It is a wholesale erosion of U.S. standing across the very industries that define technological leadership and future growth.
This depressing trade performance has direct consequences not just for U.S. competitiveness but also for national power itself. As foreign producers, particularly in the EU and Mexico, capture an increasing share of global and U.S. demand while importing less from the United States, American firms lose the scale necessary to sustain high fixed-cost innovation, accelerate learning, and commercialize new technologies rapidly. Over time, shrinking market share erodes scale economies, slows innovation cycles, raises unit costs, and reduces U.S. influence over global standards. These advanced industries, including producers of optoelectronics, aerospace, and nuclear technology, are critical to economic growth, defense readiness, technological edge, and geopolitical influence. Policymakers should implement a national power industry strategy that prioritizes strategically important sectors, directs markets to preserve critical capabilities, balances production with innovation, and emphasizes long-term positioning over short-term efficiency. Without decisive action, the United States risks a long-term loss of competitiveness and reliance on China or other foreign powers for capabilities that underpin both economic resilience and national security.
Acknowledgments
This report is part of a series that has been made possible in part by generous support from the Smith Richardson Foundation. (For more, see: itif.org/power-industries.) ITIF maintains full editorial independence in all its work.
The author would like to thank Robert Atkinson for his guidance and feedback on this report. Any errors or omissions are the author’s responsibility alone.
About the Author
Trelysa Long is a policy analyst at ITIF. She was previously an economic policy intern with the U.S. Chamber of Commerce. She earned her bachelor’s degree in economics and political science from the University of California, Irvine.
About ITIF
The Information Technology and Innovation Foundation (ITIF) is an independent 501(c)(3) nonprofit, nonpartisan research and educational institute that has been recognized repeatedly as the world’s leading think tank for science and technology policy. Its mission is to formulate, evaluate, and promote policy solutions that accelerate innovation and boost productivity to spur growth, opportunity, and progress. For more information, visit itif.org/about.
Endnotes
[1]. Robert Atkinson, “Marshaling National Power Industries to Preserve America’s Strength and Thwart China’s Bid for Global Dominance” (ITIF, November 2025), https://itif.org/publications/2025/11/17/marshaling-national-power-industries-to-preserve-us-strength-and-thwart-china/.
[2]. United States Census Bureau, ATP Data – Imports and Exports – ATP Group by Country (advanced technology products), accessed December 2025, https://www.census.gov/foreign-trade/statistics/product/atp/index.html.; United States Census Bureau, USA Trade (imports and exports in 2014 and 2024 for the world, China, South Korea, Japan, and the EU, accessed December 2025), https://usatrade.census.gov/index.php?do=login.
[3]. Ibid.
[4]. Ibid.
[5]. Ibid. Due to the different products in the 2014 and 2024 categorization of each advanced technology group, the 2024 ATP group product description was used in order to examine the changes in imports and exports over time.
[6]. Ibid.
[7]. Ibid.
[8]. Ibid.
[9]. Ibid.
[10]. U.S. Census Bureau, Advanced Technology Products Code Description, website, https://www.census.gov/foreign-trade/reference/codes/atp/index.html.
[11]. United States Census Bureau, ATP Data – Imports and Exports – ATP Group by Country.; United States Census Bureau, USA Trade
[12]. Ibid.
[13]. Ibid.
[14]. U.S. Census Bureau, Advanced Technology Products Code Description.
[15]. United States Census Bureau, ATP Data – Imports and Exports – ATP Group by Country.; United States Census Bureau, USA Trade.
[16]. Ibid.
[17]. Ibid.
[18]. U.S. Census Bureau, Advanced Technology Products Code Description.
[19]. Ibid.
[20]. United States Census Bureau, ATP Data – Imports and Exports – ATP Group by Country.; United States Census Bureau, USA Trade.
[21]. Ibid.
[22]. Ibid.
[23]. U.S. Census Bureau, Advanced Technology Products Code Description.
[24]. Ibid.
[25]. United States Census Bureau, ATP Data – Imports and Exports – ATP Group by Country.; United States Census Bureau, USA Trade.
[26]. Ibid.
[27]. Ibid.
[28]. U.S. Census Bureau, Advanced Technology Products Code Description.
[29]. Ibid.
[30]. United States Census Bureau, ATP Data – Imports and Exports – ATP Group by Country.; United States Census Bureau, USA Trade.
[31]. Ibid.
[32]. Ibid.
[33]. U.S. Census Bureau, Advanced Technology Products Code Description.
[34]. Ibid.
[35]. United States Census Bureau, ATP Data – Imports and Exports – ATP Group by Country.; United States Census Bureau, USA Trade.
[36]. Ibid.
[37]. Ibid.
[38]. U.S. Census Bureau, Advanced Technology Products Code Description.
[39]. Ibid.
[40]. United States Census Bureau, ATP Data – Imports and Exports – ATP Group by Country.; United States Census Bureau, USA Trade.
[41]. Ibid.
[42]. Ibid.
[43]. U.S. Census Bureau, Advanced Technology Products Code Description.
[44]. United States Census Bureau, ATP Data – Imports and Exports – ATP Group by Country.; United States Census Bureau, USA Trade.
[45]. Ibid.
[46]. Ibid.
[47]. U.S. Census Bureau, Advanced Technology Products Code Description.
[48]. United States Census Bureau, ATP Data – Imports and Exports – ATP Group by Country.; United States Census Bureau, USA Trade.
[49]. Ibid.
[50]. Ibid.
Editors’ Recommendations
November 17, 2025
Marshaling National Power Industries to Preserve America’s Strength and Thwart China’s Bid for Global Dominance
November 17, 2025
US National Power Industries Are at Risk
April 11, 2022
