

Tracking R&D Leadership: US Advantage Narrowing as China Gains Ground

Maintaining R&D leadership in advanced industries is critical to U.S. economic competitiveness and national power. But on a size- and wage-adjusted basis, China is rapidly gaining ground. Congress needs to boost corporate R&D incentives to prevent America from falling behind.
KEY TAKEAWAYS
Key Takeaways
Contents
Software and Computer Services 12
Technology Hardware and Equipment 14
Electronics and Electrical Equipment 20
Pharmaceuticals and Biotechnology 26
Recommendations and Conclusion. 30
Appendix: Caveats About The Dataset 30
Introduction
Advanced, traded-sector industries power the U.S. economy’s global competitiveness.[1] A key indicator of strength in these industries is the amount firms invest in research and development (R&D) to produce new innovations. As China vigorously challenges the United States for global leadership in the innovation economy, it is important to assess where the two countries stand in their advanced industries’ private R&D investments.[2]
This report uses the EU R&D Industrial Scoreboard, which tracks the R&D investments (in euros) of the world’s top R&D investors, covering about 90 percent of the world’s private sector R&D investments, to compare U.S.- and Chinese-headquartered firms’ R&D investments in nine advanced sectors.[3] These nine sectors are aerospace and defense, electronic and electrical equipment, general industrials, industrial engineering, pharmaceutical and biotechnology, software and computer services, technology and hardware equipment, alternative energy, and automobiles and parts. The Scoreboard covers 2,000 companies from 2024 and 2,500 from 2014 because it took 2,500 companies to cover 90 percent of the world’s private sector R&D investments in 2014 but only 2,000 in 2024. Moreover, there are other caveats about this dataset. (See appendix for details.)
Each section of the report examines U.S. and Chinese private-sector R&D in those sectors on a size-adjusted basis—first relative to the size of their respective economies, then as proportions of global R&D in each sector or group of sectors, and finally using an industrial concentration ratio known as a location quotient (LQ), which is R&D as a share of a country’s national economy versus the global average.
The data shows that while U.S. firms’ investment in R&D is growing, China is catching up. On a size-adjusted basis, U.S. firms’ R&D investments in eight of nine advanced sectors in 2014 exceeded that of Chinese firms.[4] But by 2024, U.S. firms had lost their lead in four of the nine sectors, while China had closed the gap in the rest.[5] The United States is likely to lose global R&D investment market shares in the other five sectors as Chinese companies expand R&D investment with government support. In addition, because they benefit from extensive intellectual property theft and forced technology transfers, Chinese firms do not have to invest as much in R&D as American firms do to get the same innovation results.[6] Think of China as a free rider, living on the R&D investments of U.S. and other foreign firms. But in addition to that free-riding strategy and the impact of having R&D workers with lower salaries, Chinese firms also are investing more in their own in-house capabilities. Indeed, when adjusting for R&D workers’ wages, Chinese firms really accounted for 9 percent of advanced sector R&D investments in 2014 and 25 percent in 2024 (rather than 4 percent in 2014 and 13 percent in 2024). More concerningly, Chinese firms’ LQ rose from 0.7 to 1.5 from 2014 to 2024 while U.S. firms’ LQ declined from 1.8 to 1.7.
While U.S. firms’ investment in R&D is growing, China is catching up. On a size-adjusted basis, U.S. firms’ R&D investments in eight of nine advanced sectors in 2014 exceeded that of Chinese firms.
Meanwhile, the rest of the world’s advanced-sector firms’ R&D investments have been relatively stagnant, while U.S. and Chinese firms are becoming the main global R&D hubs. From 2014 to 2024, worldwide firm-level R&D investments increased by 102 percent, but this aggregate figure masks a sharp concentration of growth. U.S. firms expanded R&D investments by 150 percent over the period, while Chinese firms increased theirs by an extraordinary 537 percent. In contrast, firms in the rest of the world increased R&D investments by just 32 percent. These disparities indicate that global innovation capacity is increasingly consolidating around two dominant centers—the United States and China—leaving much of the rest of the world struggling to keep pace rather than shaping the technological frontier. This concentration is particularly concerning from a geopolitical perspective, as China is not a U.S. ally, raising risks of strategic vulnerability as the United States will have to turn to China for advanced technologies rather than to an ally.
In response, Washington needs to do a better job of incentivizing the private sector to expand R&D investment in the United States. This should include expanding programs that fund joint industry-university research, boosting the Alternative Simplified R&D Credit rate from 14 percent to at least 28 percent, and doubling the regular R&D tax credit from 20 to 40 percent. It’s much easier to keep U.S. industries’ global market shares through such policies than to lose them and later have to work much harder to win them back, often in vain.
All Advanced Sectors
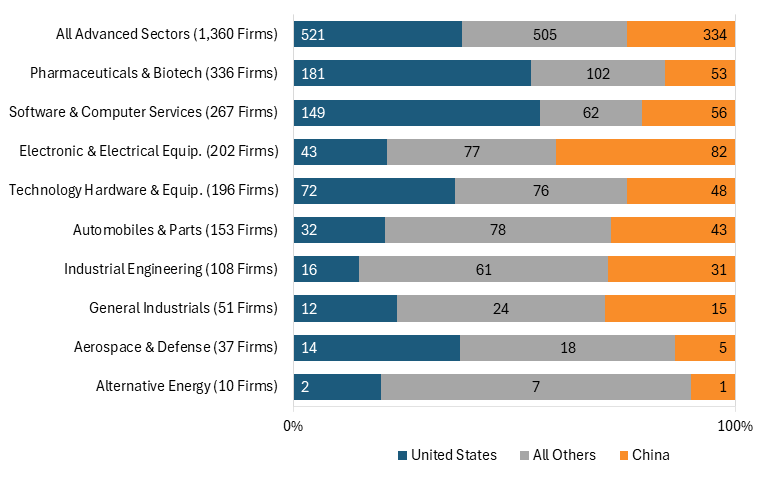
In 2024, the United States and China dominated business R&D investments, accounting for 63 percent of firms (521 U.S. firms, 334 Chinese, and 505 rest of world).[7] For the United States, pharmaceuticals and biotechnology led (181 firms), followed by software and computer services (149 firms) and then IT hardware.[8] China’s top sector was in electronics and electrical equipment (82 firms) and software and computer services (56 firms).[9] (See figure 1.)
Figure 1: Number of U.S. and Chinese firms investing in R&D by industry, 2024 (global total in parentheses)
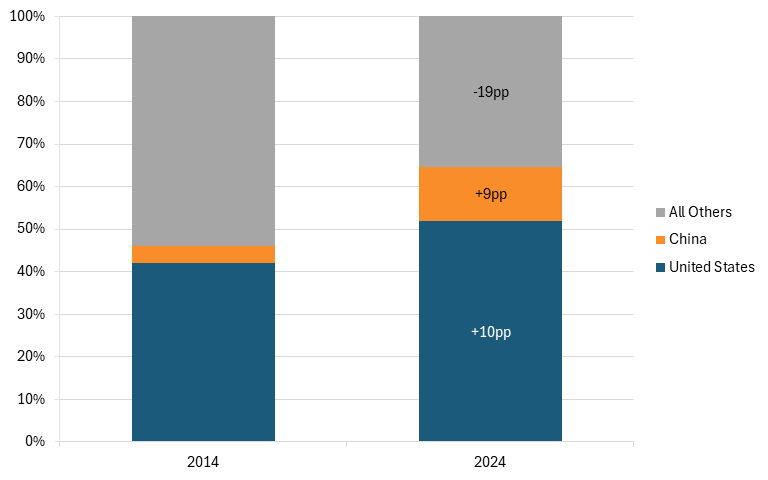
Despite U.S. firms investing more than Chinese firms in R&D, Chinese firms are catching up. From 2014 to 2024, U.S. firms’ share of global R&D in advanced industries rose 10 percentage points from 42 percent to 52 percent—from $270 billion to $675 billion. In comparison, Chinese firms’ rose almost as much as U.S. firms did at 9 percentage points from 4 to 13 percent—from $26 billion to $165 billion.[10] (See figure 2.)
Figure 2: 10-year change in U.S. and Chinese firms’ global shares of R&D in advanced industries
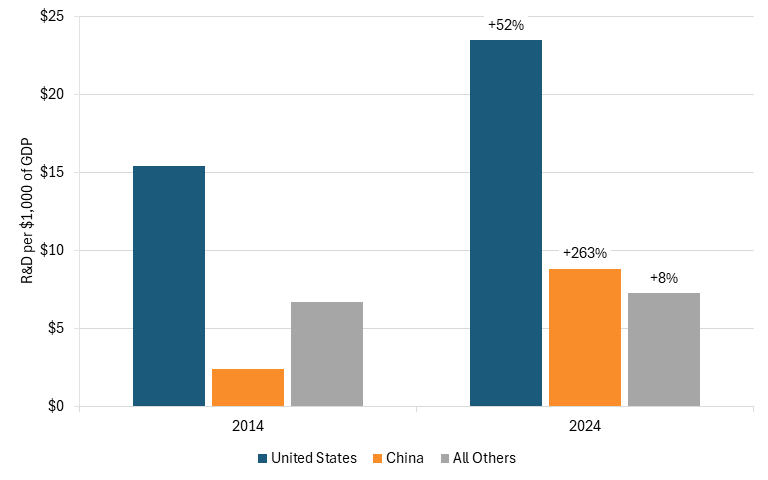
When controlling for gross domestic product (GDP), U.S. firms invested $15.41 per $1,000 of GDP in 2014 and rose to $23.48 in 2024.[11] In comparison, Chinese firms’ investment rose from $2.43 to $8.81 per $1,000 of GDP.[12] Interestingly, the rest of world largely stagnated, not increasing R&D as a share of their economies by much and falling in global share from 54 percent to 35 percent.[13] (See figure 3.)
Figure 3: 10-year change in advanced industry R&D controlling for GDP
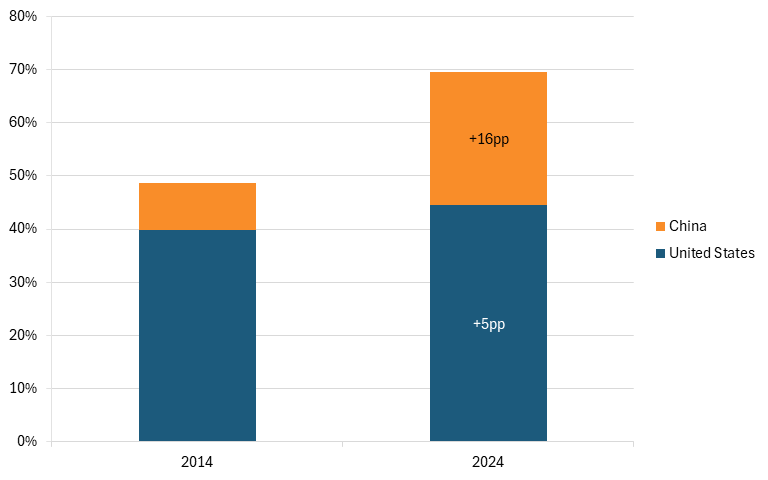
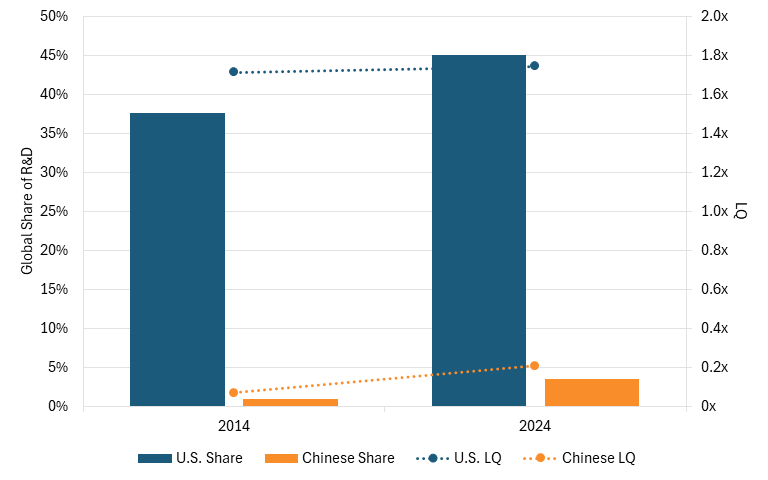
More concerningly, because Chinese R&D is less expensive than U.S. R&D, Chinese firms’ R&D is increasing and catching up to that of U.S. firms at a faster rate than suspected. The Information Technology and Innovation Foundation (ITIF) has found that for every U.S. R&D worker supported by $100,000 of R&D spend, a Chinese firm spending $100,000 on R&D can throw 2.3 workers at the same problem.[14] Indeed, from 2014 to 2024, U.S. firms’ share of the sectors’ R&D investment rose only 5 percentage points from 40 to 45 percent while Chinese firms’ rose 16 percentage points from 9 to 25 percent.[15] (See figure 4.) This is compared with the unadjusted figures wherein U.S. firms rose 10 percentage points and Chinese firms rose 9 percentage points.[16]
Because Chinese R&D is less expensive than U.S. R&D, Chinese firms’ R&D is increasing and catching up to that of U.S. firms at a faster rate than suspected.
Figure 4: 10-year change in U.S. and Chinese firms’ wage-adjusted shares of global R&D in advanced industries
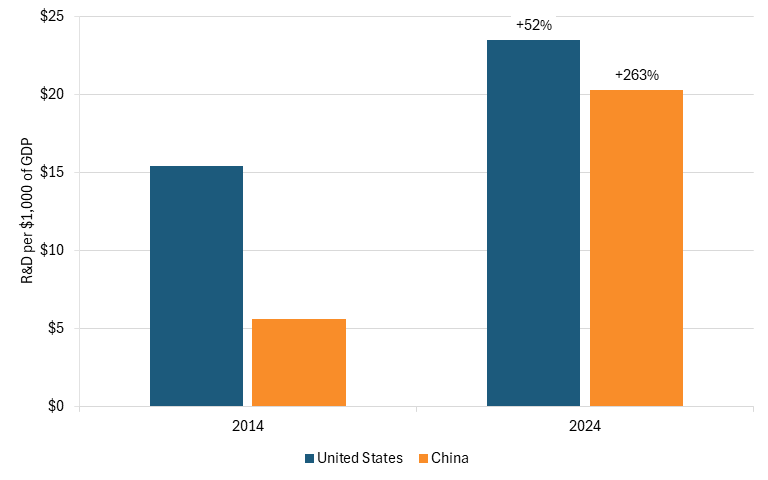
When controlling for GDP, Chinese firms’ investments are also quickly catching up to U.S. firms’. Indeed, while Chinese firms invested $5.59 per $1,000 of GDP in 2014, they had increased that amount to $20.26, just about $3 below U.S. investments of $23.48, by 2024.[17] (See figure 5.)
Figure 5: 10-year change in U.S. and Chinese firms’ wage-adjusted R&D in advanced industries as a share of GDP
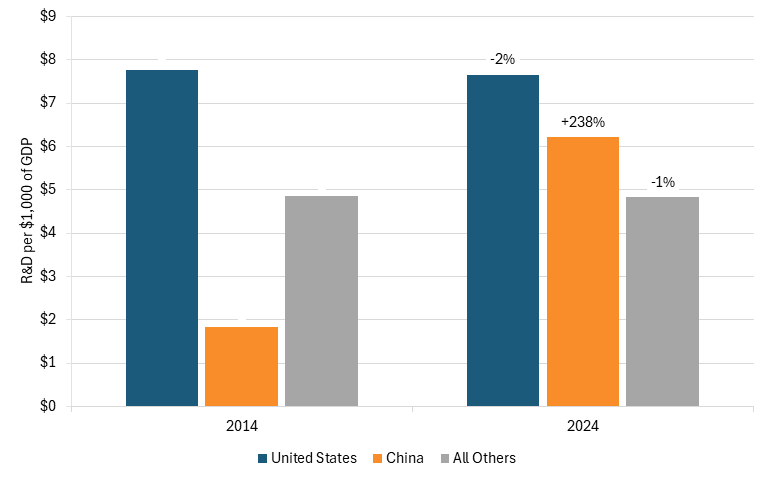
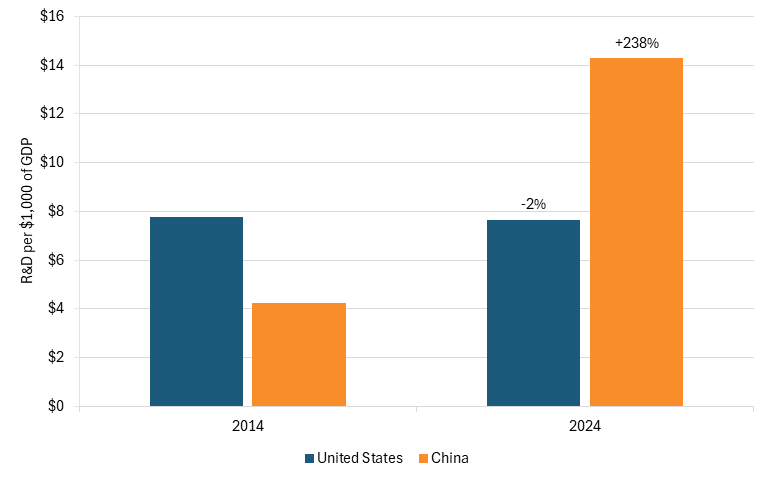
Despite investing more than Chinese firms, U.S. firms’ R&D growth has relied heavily on two sectors: the pharmaceutical and biotechnology, and software and services sectors. Indeed, excluding these two sectors, U.S. firms’ R&D investments rose from only $136 billion in 2014 to $220 billion in 2024, accounting for 33 to 34 percent of the sector.[18] (See figure 6.) When controlling for GDP, U.S. firms’ R&D investments actually declined slightly from $7.78 to $7.66 per $1,000 of GDP, indicating that the biotechnology and software sector were key drivers of growth in R&D investments.[19] (See figure 7.) This is compared with the figures above wherein U.S. firms’ R&D as a share of the sector and when controlling for GDP grew much more when these two sectors were included.
Despite investing more than Chinese firms, U.S. firms’ R&D growth has relied heavily on two sectors: the pharmaceutical and biotechnology, and software and services sectors.
While the United States has relied on these two sectors, China has been less concentrated. When excluding these two sectors, Chinese firms’ R&D grew substantially from $19.6 billion to $116 billion from 2014 to 2024, accounting for 5 percent at first before rising to 18 percent of the these sectors (figure 6).[20] More importantly, without these two sectors, Chinese firms’ R&D investment rose from almost seven times less than U.S. firms to less than two times.[21] Moreover, when controlling for GDP, Chinese firms’ R&D investment increased from $1.84 per $1,000 of GDP in 2014 to $6.21 in 2024 (figure 7).[22] The rest of the world’s R&D investments grew from $252 billion to $306 billion during this period. When controlling for GDP, the rest of the world’s R&D investment declined slightly from $4.85 to $4.82 per $1,000 of GDP.
Figure 6: 10-year change in U.S. and Chinese firms’ global shares of R&D in advanced industries, excluding pharmaceuticals and biotech, and software and services
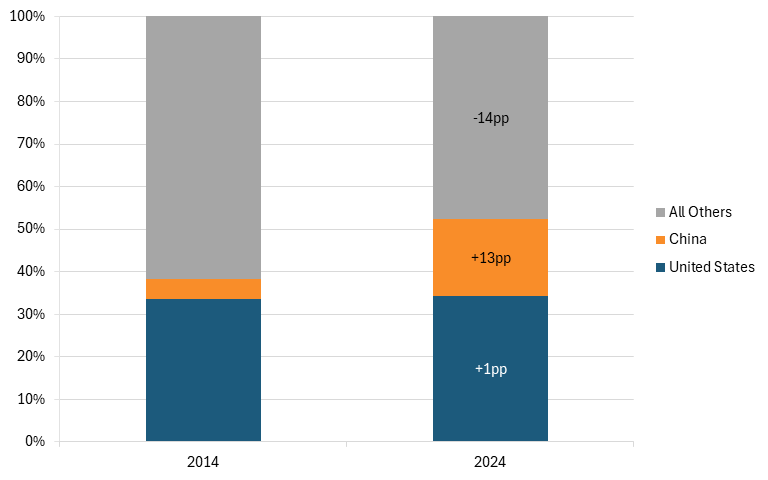
Figure 7: 10-year change in advanced industry R&D controlling for GDP, excluding pharmaceuticals and biotech, and software and services
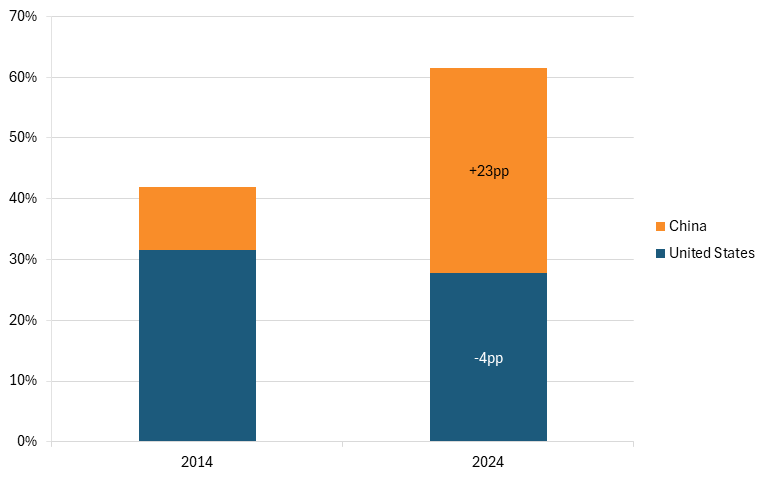
Concerningly, when excluding the software and pharmaceutical sector and adjusting for wage differences, Chinese firms’ R&D investments had surpassed U.S. firms by 2024. Indeed, from 2014 to 2024, U.S. firms’ R&D investment as a share of sector R&D declined 4 percentage points, from 32 percent to 28 percent, while Chinese firms’ rose from 10 percent to 34 percent. (See figure 8.) In raw values, U.S. firms’ investment went from $136 billion to $220 billion while Chinese firms’ went from $45 billion to $268 billion.
Figure 8: 10-year change in U.S. and Chinese firms’ wage-adjusted shares of global R&D in advanced industries, excluding pharmaceuticals and biotech, and software and services
When controlling for GDP, U.S. firms invested $7.78 per $1,000 of GDP in 2014 but then reduced it to $7.66 per $1,000 of GDP by 2024. In comparison, Chinese firms invested $4.22 in 2014 and $14.29 by 2024, almost doubling U.S. firms’ investment. (See figure 9.) Essentially, U.S. firms have fallen behind Chinese firms when key sectors are removed and wages are adjusted for.
U.S. firms’ size-adjusted R&D investment was larger than Chinese firms’ in 2024. The size-adjusted R&D investment compares U.S. and Chinese firms’ R&D investment as a share of their respective country’s GDP to the global average R&D investment as a share of the world’s GDP. This results in an industry concentration ratio known as an LQ, which we express as a multiple. For example, if a country has twice the global average corporate R&D in a given sector, then its LQ in that sector is 2x. The LQ is important in this analysis because it compares the performance of firms in each country with the global average after adjusting for the size of each country’s economy.
Figure 9: 10-year change in U.S. and Chinese firms’ wage-adjusted R&D in advanced industries as a share of GDP, excluding pharmaceuticals and biotech, and software and services
By that measure, U.S. firms’ size-adjusted R&D investment was higher than China’s in five of the nine sectors in 2024. These included software and computer services, technology hardware and equipment, pharmaceuticals and biotechnology, aerospace and defense, and alternative energy. However, in four sectors—general industrials, industrial engineering, automobiles and parts, and electronic and electrical equipment—U.S. firms were lower than Chinese firms in their size-adjusted R&D investment.
In eight of nine sectors, U.S. firms’ size-adjusted R&D investment have either declined or remained stagnant while Chinese investment have risen since 2014.
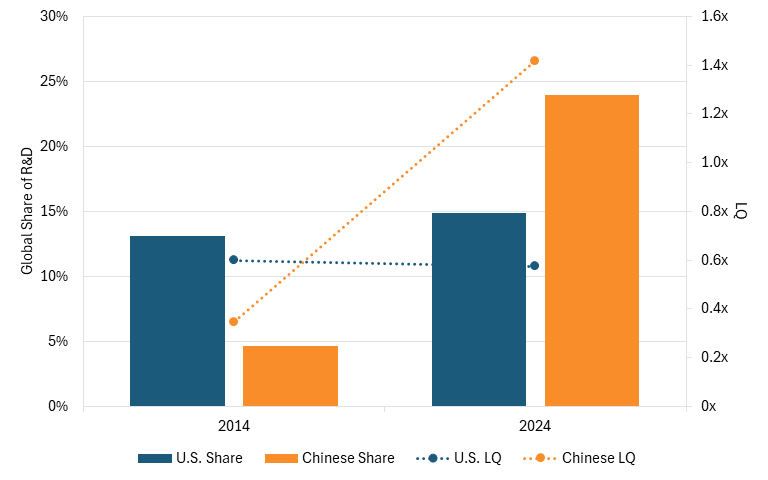
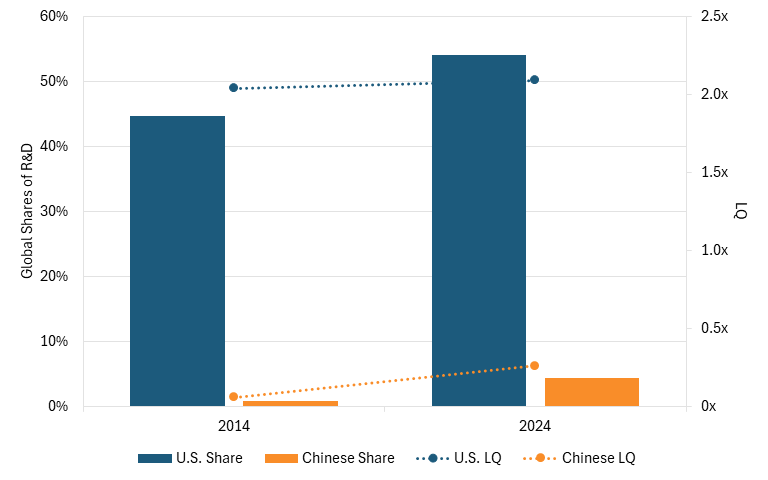
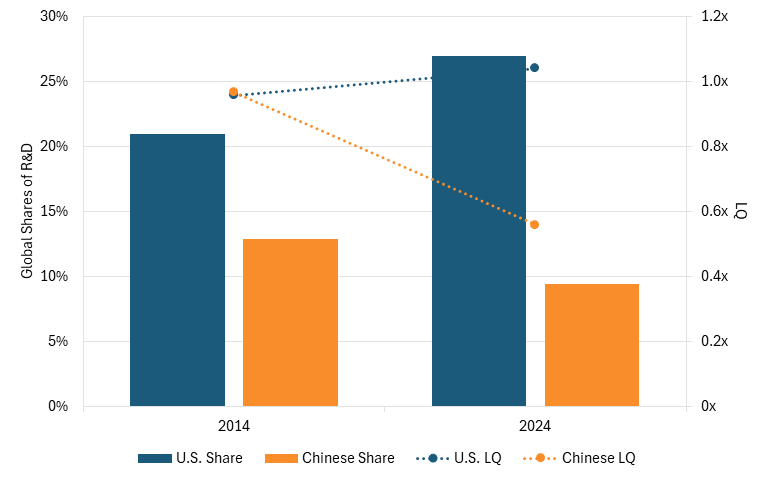
Moreover, Chinese firms are closing the size-adjusted R&D investment gap with U.S. firms in advanced sectors. In eight of nine sectors, U.S. firms’ size-adjusted R&D investment have either declined or remained stagnant while Chinese investment have risen since 2014. As a result, when controlling for GDP, U.S. firms’ R&D investment rose from 90 percent to 100 percent more than the global average (1.9x to 2.0x).[23] In comparison, Chinese firms’ rose from 70 percent below the global average (0.3x) to 25 percent below the global average (0.8x).[24] In addition, U.S. firms’ have historically exceeded Chinese firms’ R&D investments, but Chinese firms’ investments are rapidly catching up. From 2014 to 2024, U.S. firms’ R&D investments rose from 42 percent to 52 percent of the sector.[25] In comparison, Chinese firms’ R&D investments rose from 4 percent to 13 percent of the sector.[26] (See figure 10.)
Figure 10: 10-year change in U.S. and Chinese firms’ shares of global R&D and LQ for all advanced sectors
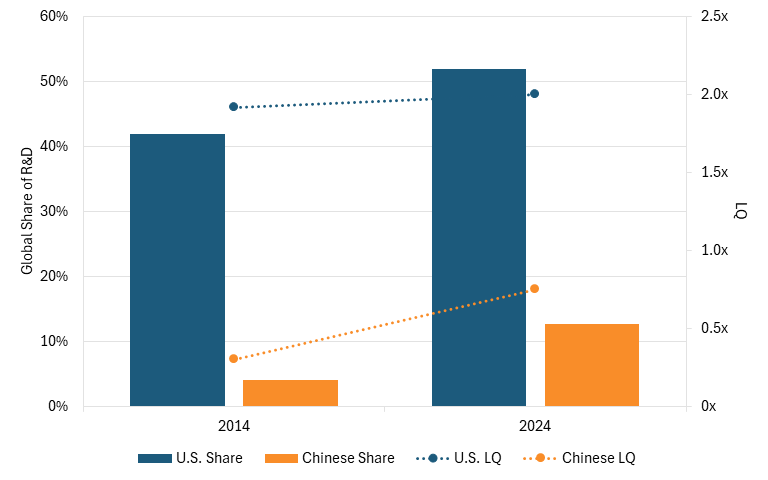
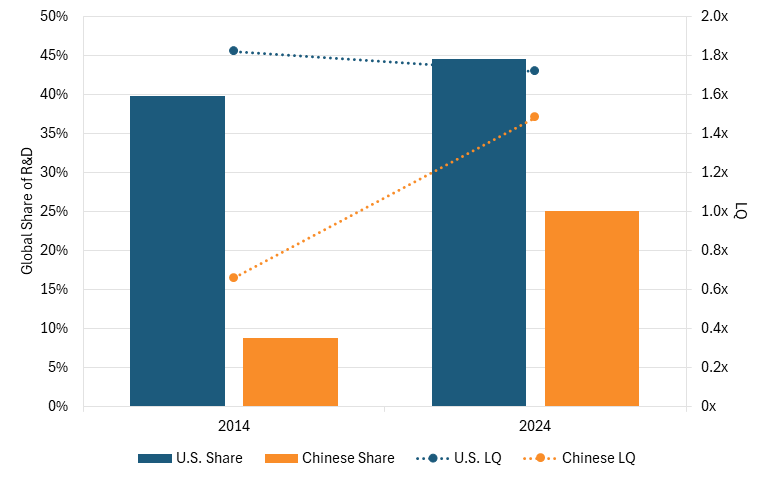
When controlling for wages, Chinese firms really accounted for 9 percent of advanced sector R&D investments in 2014 and 25 percent in 2024 (rather than 4 percent in 2014 and 13 percent in 2024). More concerningly, Chinese firms’ LQ rose from 0.7 to 1.5 from 2014 to 2024, while U.S. firms’ LQ declined from 1.8 to 1.7. (See figure 11.) In other words, Chinese firms are not far from being on par with U.S. firms’ size-adjusted R&D investment.
Figure 11: 10-year change in U.S. and Chinese firms’ shares of global R&D and LQ for all advanced sectors with Chinese firms’ R&D adjusted for wage
Software and Computer Services
The software and computer services sector includes companies that provide consulting or integration services to other businesses relating to information technology: computer-system designers, systems integrators, network and systems operations, cloud computing service providers, distributed ledger technology (DLT) consultants and integrators, data management and storage providers, and repair and technical support services.[27] The sector also includes publishers and distributors of computer software and companies that generate revenue from virtual products using digital platforms.[28]
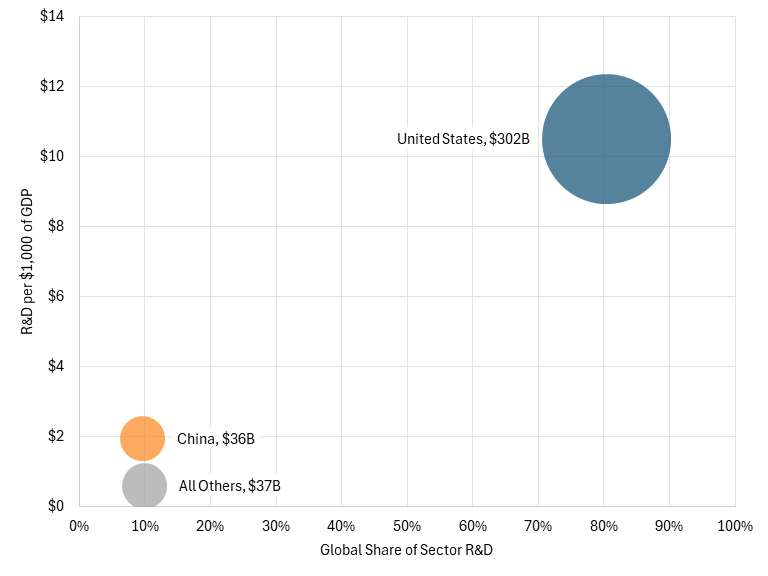
U.S. firms dominate global R&D in this sector, investing $302 billion in R&D, making up 80 percent of the sector’s global R&D investment. In comparison, Chinese firms invested $36.3 billion, making up 10 percent of the global R&D investment.[29] When controlling for GDP, U.S. firms invested about 5.4 times more than Chinese firms did.[30] For every $1,000 of GDP, U.S. firms invested $10.49, while Chinese firms invested only $1.94.[31] This is compared with the rest of the world’s R&D share of 10 percent and investment of $0.59 for every $1,000.[32] (See figure 12.)
Figure 12: U.S. and Chinese firms’ R&D investment in software and computer services, 2024
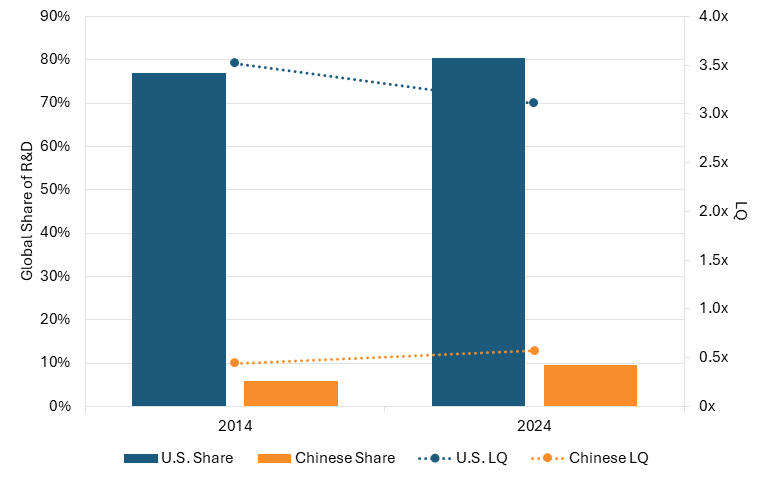
U.S. firms have consistently invested more than Chinese firms in R&D. In 2014, U.S. firms’ R&D share of the global sector was 75 percent compared with Chinese firms’ 6 percent.[33] And in 2024, U.S. firms’ share grew to 80 percent but was still significantly higher than Chinese firms’ 10 percent.[34] Although U.S. firms still invested considerably more than Chinese firms did, Chinese firms’ R&D investments continue to grow. At the current pace of growth, Chinese firms should be investing more in R&D in this sector than is the rest of world combined minus the United States.
Despite U.S. firms dedicating more investments to R&D than did Chinese firms, U.S. firms’ size-adjusted investments compared with the global sector’s declined, while Chinese firms’ was catching up. In 2014, U.S. firms’ size-adjusted R&D investment was 350 percent of the average global (3.5x), while Chinese firms’ was 44 percent (0.4x).[35] By 2024, U.S. firms’ R&D investment had declined to 310 percent of the global average (3.1x), while Chinese firms’ had risen to 60 percent (0.6x).[36] (See figure 13.)
Figure 13: 10-year change in U.S. and Chinese firms’ shares of global R&D and LQ for software and computer services
Technology Hardware and Equipment
The technology and hardware equipment sector includes semiconductor and other chip producers and distributors; “companies involved in the application of high technology parts to finished products” (e.g., printed circuit boards); semiconductors, photonics, and wafers creation equipment manufacturers; computer, servers, and other computer hardware manufacturers and distributors; and electronic office equipment manufacturers and distributors.[37]
U.S. firms’ R&D investment in the technology hardware and equipment sector also dominates. This is partly because U.S. semiconductor firms constitute over half the global semiconductor industry and invested nearly 20 percent of their revenue on R&D to develop the next generation of chips.[38]
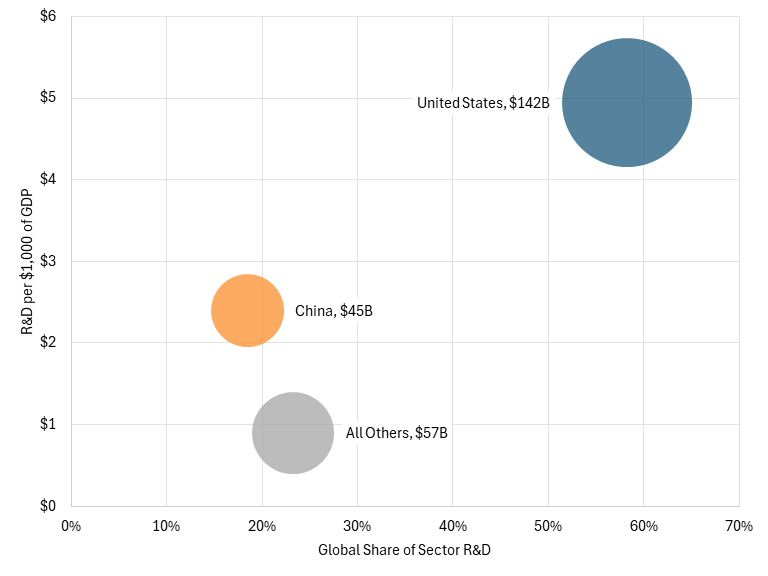
In 2024, U.S. firms invested $142 billion in R&D, making up 58 percent of the sector’s global R&D investment. In comparison, Chinese firms invested $45 billion, making up 18 percent of the global R&D investment.[39] When controlling for GDP, U.S. firms invested about 2.1 times more than Chinese firms.[40] For every $1,000 of GDP, U.S. firms invested $4.95, while Chinese firms invested only $2.40.[41] This is compared with the rest of the world’s R&D share of 23 percent and investment of $0.89 for every $1,000.[42] (See figure 14.)
Figure 14: U.S. and Chinese firms’ R&D investments in technology hardware and equipment, 2024
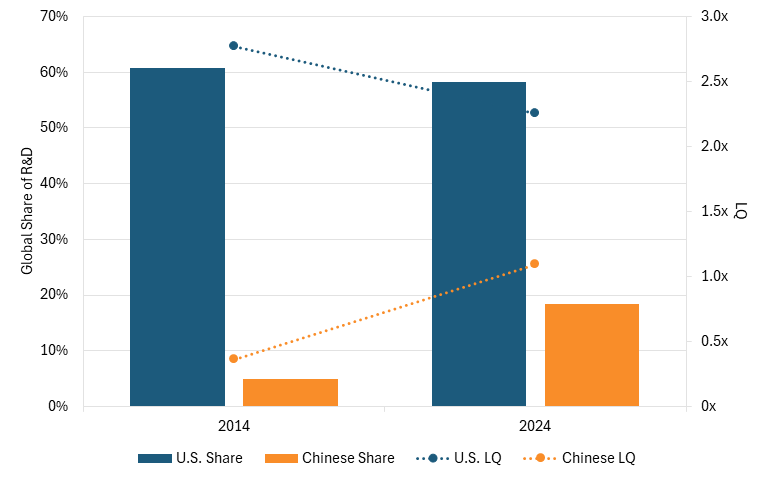
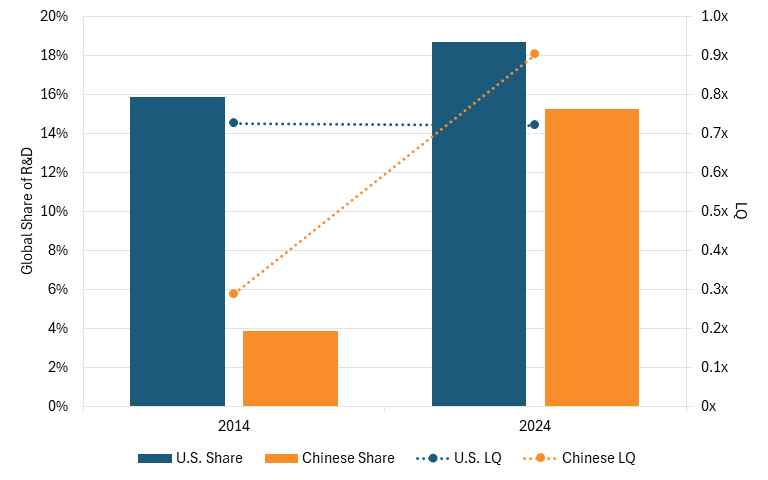
Despite U.S. firms consistently investing more than Chinese firms do in R&D, its share of the sector is declining compared with Chinese firms. In 2014, U.S. firms’ R&D share of the global sector was 61 percent compared with Chinese firms’ 5 percent.[43] And in 2024, U.S. firms’ share had declined to 58 percent. Meanwhile, Chinese firms’ had grown to 18 percent.[44]
More concerningly, in the last decade, U.S. firms’ size-adjusted investment compared with the global sector’s declined, while Chinese firms’ grew. In 2014, U.S. firms’ size-adjusted R&D investment was 277 percent of the average global (2.7x), while Chinese firms’ was 36 percent (0.4x).[45] By 2024, U.S. firms’ R&D investment had declined to 225 percent of the global average (2.3x), while Chinese firms’ rose to nearly 110 percent above average (1.1x).[46] (See figure 15.)
Figure 15: 10-year change in U.S. and Chinese firms’ shares of global R&D and LQ for technology hardware and equipment
In the last decade, U.S. firms’ size-adjusted investment compared with the global sector’s declined, while Chinese firms’ grew.
General Industrials
The general industrials sector includes companies “engaged in three or more industrial business activities, none of which is the dominant business line.”[47] Moreover, the sector also includes companies that manufacture, distribute, or produce paint, material coatings, resin, plastic products, chemicals used in plastic, structural glass and other glass products, and packaging products.[48]
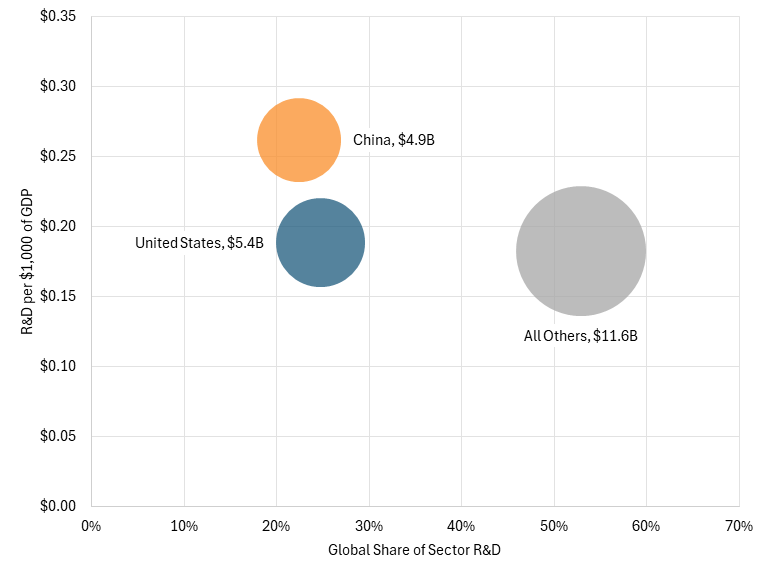
U.S. firms have invested only slightly more than Chinese firms have in overall R&D but less than Chinese firms when accounting for GDP. In 2024, U.S. firms invested $5.4 billion in R&D, making up 25 percent of the sector’s global R&D investments. In comparison, Chinese firms invested $4.9 billion, making up 22 percent of the global R&D investments.[49] However, when controlling for GDP, U.S. firms invested about 28 percent less than Chinese firms did.[50] For every $1,000 of GDP, U.S. firms invested $0.19, while Chinese firms invested only $0.26.[51] This is compared with the rest of the world’s R&D share of 53 percent and investment of $0.18 for every $1,000.[52] (See figure 16.)
Figure 16: U.S. and Chinese firms’ R&D investments in general industrials, 2024
U.S. firms have consistently invested more than Chinese firms have in R&D but their share of the sector has been declining while Chinese firms’ has been rising. In 2014, U.S. firms’ R&D share of the global sector was 40 percent compared with Chinese firms’ 6 percent.[53] Yet, by 2024, U.S. firms’ share had declined to 25 percent while Chinese firms’ had grown to 22 percent, almost catching up to U.S. firms’ 25 percent.[54]
More concerningly, in the last decade, U.S. firms’ size-adjusted R&D investment fell from above the global average to below while Chinese firms’ rose from below to above the global average, surpassing U.S. firms. Indeed, in 2014, U.S. firms’ size-adjusted R&D investment was 181 percent of the average global (1.8x), while Chinese firms’ was 44 percent (0.4x).[55] By 2024, U.S. firms’ R&D investment had decreased to 95 percent of the global average (1.0x), while Chinese firms’ had risen to 133 percent (1.3x).[56] (See figure 17.)
Figure 17: 10-year change in U.S. and Chinese firms’ shares of global R&D and LQ for general industrials
In the last decade, U.S. firms’ size-adjusted R&D investment fell from above the global average to below while Chinese firms’ rose from below to above the global average, surpassing U.S. firms.
Industrial Engineering
The industrial engineering sector includes “companies that design, develop, manufacture, sell, and support general industrial machines and parts;” manufacture farming equipment; manufacture large construction and port industrial equipment; manufacture and distribute energy output devices (e.g., diesel engines); manufacture equipment for heavy industries; and manufacture and market specific types or groups of industrial machines and parts.[57] The R&D invested in this sector is particularly important to a nation’s competitiveness, as it goes to producing more efficient and innovative machinery for manufacturing. As ITIF has highlighted previously, machine tools production plays an essential role in a nation’s manufacturing capabilities and efficiency because manufacturing industries require machine tools for efficient production, especially when it comes to durable goods.[58]
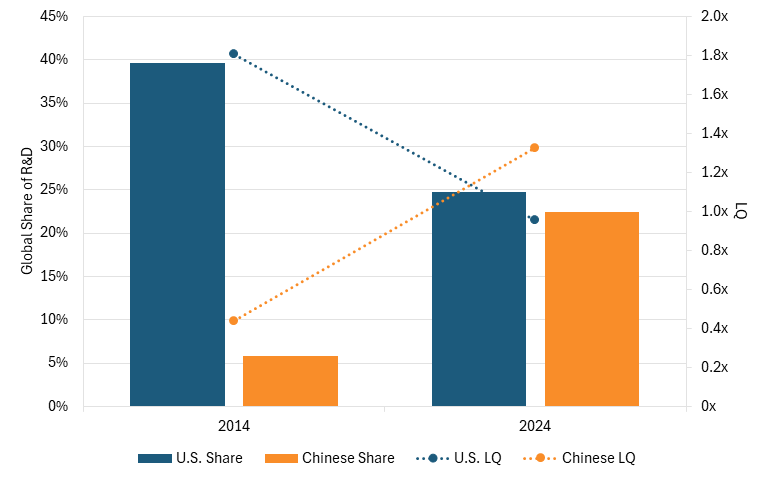
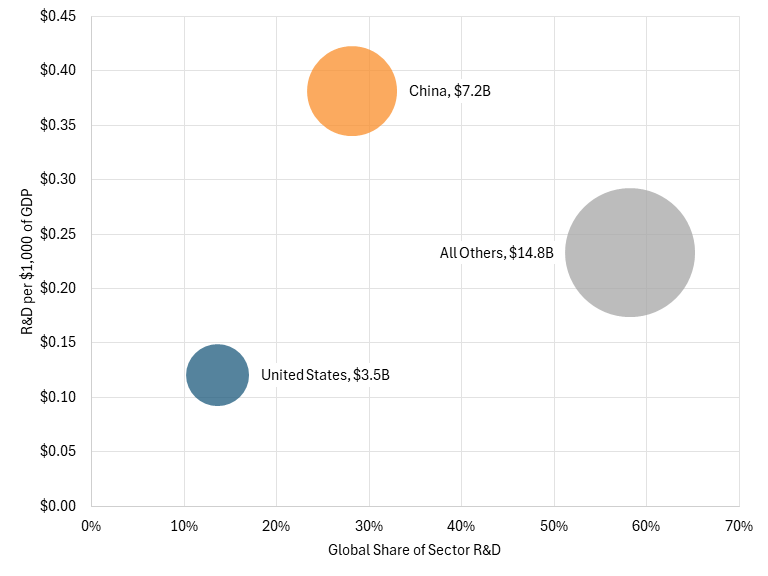
Despite the importance of this sector, U.S. firms have invested less than Chinese firms in R&D. In 2024, U.S. firms invested $3.5 billion in R&D, making up just 14 percent of the sector’s global R&D investments. In comparison, Chinese firms invested $7.2 billion, making up 28 percent of the global R&D investments.[59] When controlling for GDP, U.S. firms also invested about 68 percent less than Chinese firms did.[60] For every $1,000 of GDP, U.S. firms invested $0.12, while Chinese firms invested only $0.38.[61] This is compared with the rest of the world’s R&D share of 58 percent and investment of $0.23 for every $1,000.[62] (See figure 18.)
Figure 18: U.S. and Chinese firms’ R&D investment in industrial engineering, 2024
Partly due to this low investment, the United States has not regained its lost market shares in the machine tool industry, leading U.S. machine tool production LQ to be 70 percent below the global average in 2022.[63] In comparison, Chinese machine tool production LQ is 80 percent above the global average.[64]
U.S. firms used to invest more than Chinese firms would, but Chinese firms have now surpassed U.S. firms’ investments. In 2014, U.S. firms’ R&D share of the global sector was 27 percent compared with Chinese firms’ 11 percent.[65] Yet, by 2024, U.S. firms’ share had declined to 14 percent while Chinese firms’ share had risen to 28 percent.[66]
Moreover, U.S. firms’ size-adjusted R&D investment have also declined from above to below the global average while Chinese firms’ have increased from below to above the global average. In 2014, U.S. firms’ size-adjusted R&D investment was 124 percent of the average global (1.2x), while Chinese firms’ was 83 percent (0.8x).[67] By 2024, U.S. firms’ R&D investments had decreased to 53 percent of the global average (0.5x), while Chinese firms’ had risen to 167 percent (1.7x).[68] (See figure 19.)
Figure 19: 10-year change in U.S. and Chinese firms’ shares of global R&D and LQ for industrial engineering
U.S. firms used to invest more in industrial engineering than Chinese firms would, but Chinese firms have now surpassed U.S. firms’ investments.
Electronics and Electrical Equipment
The electronic and electrical equipment sector includes makers and distributors of electrical parts for radios, including cables and transistors, and other consumer electronics.[69] The sector also includes companies providing mechanical and electronic security; filtration systems; products used in the measurement of electric, gas, and water; pollution control equipment; and electrical devices and components marked to businesses.[70]
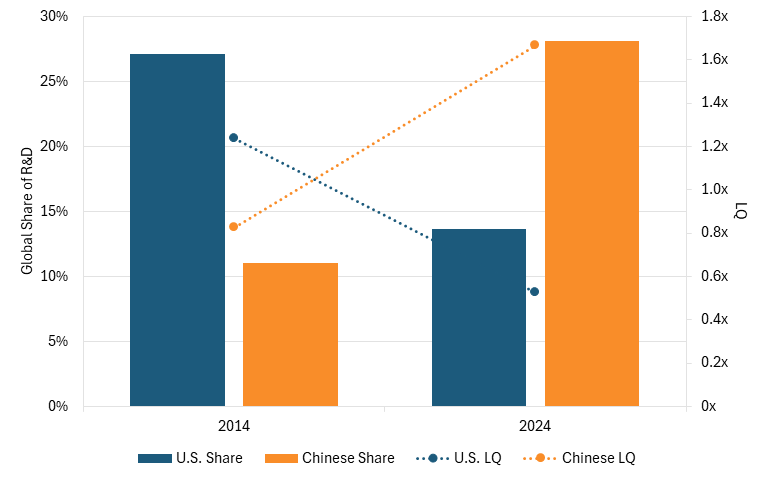
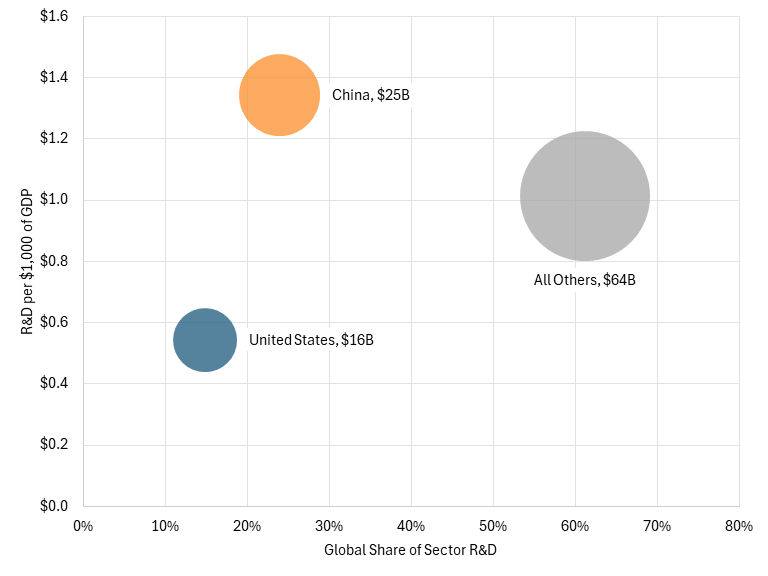
Chinese firms have invested more than U.S. firms have in R&D. In 2024, U.S. firms invested $15.7 billion in R&D, making up 15 percent of the sector’s global R&D investments. In comparison, Chinese firms invested $25 billion, making up 24 percent of the global R&D investments.[71] When controlling for GDP, U.S. firms also invested about 60 percent less than Chinese firms did.[72] For every $1,000 of GDP, U.S. firms invested $0.54 while Chinese firms invested only $1.34.[73] This is compared with the rest of the world’s R&D share of 61 percent and investment of $1.01 for every $1,000.[74] (See figure 20.)
Figure 20: U.S. and Chinese firms’ R&D investment in electronic and electrical equipment, 2024
In the past, U.S. firms invested more than Chinese firms did, but Chinese firms’ investment has now caught up and surpassed U.S. firms’. In 2014, U.S. firms’ R&D share of the global sector was 13 percent compared with Chinese firms’ 5 percent.[75] By 2024, U.S. firms’ share had risen slightly to 15 percent but Chinese firms’ share had surpassed that, rising to 24 percent.[76]
More concerningly, U.S. firms’ size-adjusted R&D investment remains below the global average while Chinese firms’ have risen to above the global average. In 2014, U.S. firms’ size-adjusted R&D investment was 60 percent of the average global (0.6x), while Chinese firms’ was 35 percent (0.4x).[77] By 2024, U.S. firms’ R&D investment had remained about the same at 57 percent of the global average (0.6x), while Chinese firms’ had risen to 142 percent (1.4x).[78] (See figure 21.)
Figure 21: 10-year change in U.S. and Chinese firms’ shares of global R&D and LQ for electronic and electrical equipment
In the past, U.S. firms invested more than Chinese firms in electronic and electrical equipment, but Chinese firms’ investment has now caught up and surpassed U.S. firms’.
Automobiles and Parts
The automobiles and parts sector includes manufacturers and distributors of automobile, truck, and motorcycle tires; makers of cars, SUVs, and light trucks; and manufacturers and distributors of parts, such as engines, for motorcycles and other automobiles. The sector also includes “companies that provide assistance to individual vehicle owners.”[79]
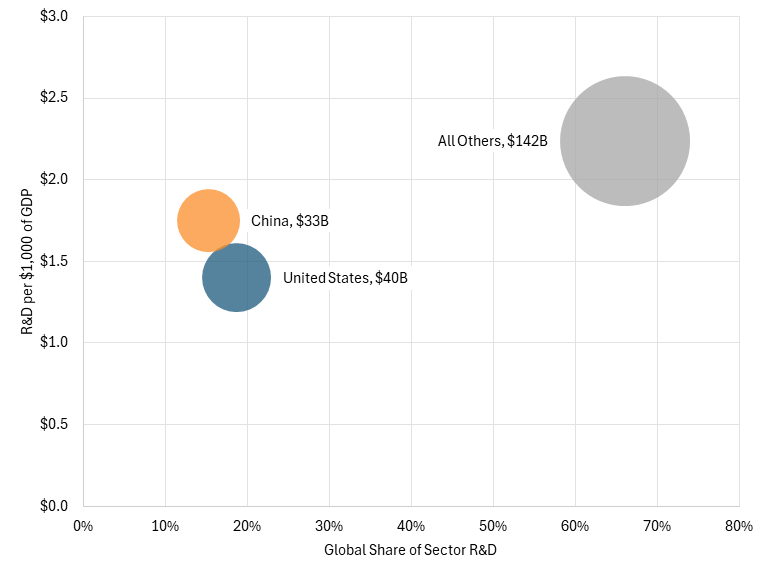
U.S. firms have invested slightly more than Chinese firms in R&D but when controlling for GDP, U.S. firms have invested less. In 2024, U.S. firms invested $40 billion in R&D, making up 19 percent of the sector’s global R&D investments. In comparison, Chinese firms invested $33 billion, making up 15 percent of the global R&D investments.[80] However, when controlling for GDP, U.S. firms invested about 20 percent less than Chinese firms did.[81] For every $1,000 of GDP, U.S. firms invested $1.40, while Chinese firms invested $1.75.[82] This is compared with the rest of the world’s R&D share of 66 percent and investment of $2.24 for every $1,000.[83] (See figure 22.)
Although the United States still retains advantages over China in the traditional auto industry, that lead is narrowing, especially in the area of electric vehicles (EVs). Indeed, ITIF research as found that Chinese automakers already account for 21 percent of global passenger vehicle production, a share projected to rise to 33 percent by 2030.[84] Moreover, as of 2022, Chinese automakers accounted for 62 percent of the world’s EV production.[85] More concerningly, the report finds that “collectively, Chinese EV and EV battery enterprises have at least equaled—and in some cases surpassed—their Western peers in innovation capacity and product quality.”[86]
Figure 22: U.S. and Chinese firms’ R&D investments in automobiles and parts, 2024
U.S. firms have historically invested more than Chinese firms have, but Chinese firms are quickly catching up. In 2014, U.S. firms’ R&D share of the global sector was 16 percent compared with Chinese firms’ 4 percent.[87] By 2024, U.S. firms’ share had risen slightly to 19 percent while Chinese firms’ share had risen to 15 percent and only 4 percent behind U.S. firms.[88]
Although the United States still retains advantages over China in the traditional auto industry, that lead is narrowing, especially in the area of electric vehicles (EVs).
In the last decade, U.S. firms’ size-adjusted R&D investment has remained relatively the same while Chinese firms’ has risen and surpassed U.S. firms. In 2014, U.S. firms’ size-adjusted R&D investment was 72 percent of the average global (0.7x), while Chinese firms’ was 29 percent (0.3x).[89] By 2024, U.S. firms’ R&D investments had remained the same at 72 percent of the global average (0.7x), while Chinese firms’ rose to 90 percent (0.9x).[90] (See figure 23.)
Figure 23: 10-year change in U.S. and Chinese firms’ shares of global R&D and LQ for automobiles and parts
Aerospace and Defense
The aerospace and defense sector includes manufacturers, assemblers, and distributors of aircraft parts, aircrafts, and communication satellites used in both commercial and private air transport.[91] The sector also includes producers of military aircraft, radar equipment, and weapons used in the defense industry.[92]
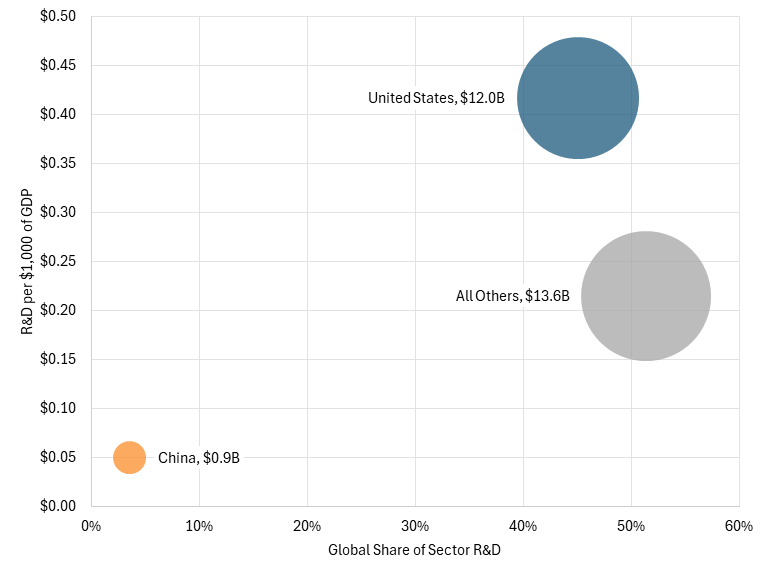
U.S. firms’ R&D investment dominates, especially when compared with Chinese firms’ investments. In 2024, U.S. firms invested $12 billion in R&D, making up 45 percent of the sector’s global R&D investment. In comparison, Chinese firms invested $933 million, making up 4 percent of the global R&D investment.[93] When controlling for GDP, U.S. firms invested about 8.4 times more than Chinese firms did.[94] For every $1,000 of GDP, U.S. firms invested $0.42 while Chinese firms invested only $0.05.[95] This is compared with the rest of the world’s R&D share of 51 percent and investment of $0.21 for every $1,000.[96] (See figure 24.)
Figure 24: U.S. and Chinese firms’ R&D investment in aerospace and defense, 2024
Despite China’s aircraft sector remaining significantly behind the United States in innovation and technological sophistication, it is catching up rapidly as Beijing pours resources into its national champion, the Commercial Aircraft Corporation of China (COMAC). According to Center for Strategic & International Studies (CSIS) analyst Scott Kennedy, COMAC received between $49 billion and $72 billion in state-related support through 2020, largely through policy-bank financing and state-held bonds rather than direct subsidies.[97] By late 2016 alone, Chinese financial institutions had provided RMB 253.5 billion in financing, including RMB 50 billion from the China Export-Import Bank, while COMAC had issued RMB 55.5 billion in corporate bonds likely held by state entities; direct government subsidies totaled just RMB 528 million over a decade.[98] This support has enabled COMAC to build and sell 148 aircraft and to displace more innovative incumbents at home, as China’s state-owned airlines have delayed over 100 Boeing and Airbus deliveries in favor of COMAC planes.[99] While COMAC is unlikely to compete in developed markets soon, subsidized domestic demand and sales to Belt-and-Road countries are accelerating scale and learning, gradually catching up to U.S. aerospace firm Boeing.[100]
U.S. firms consistently invest more than Chinese firms do in R&D but Chinese firms’ R&D is also growing. In 2014, U.S. firms’ R&D share of the global sector was 38 percent compared with Chinese firms’ 1 percent.[101] And in 2024, U.S. firms’ share grew to 45 percent but was still significantly higher than Chinese firms’ 4 percent.[102] Although Chinese firms’ R&D investments are also growing, they are still considerably behind U.S. firms.
In the last decade, U.S. firms’ size-adjusted R&D investment has remained above the global average but has not grown. In contrast, Chinese firms’ investment has remained below the global average but has grown. In 2014, U.S. firms’ size-adjusted R&D investment was 171 percent of the average global (1.7x), while Chinese firms’ was 7 percent (0.1x).[103] By 2024, U.S. firms’ R&D investment had remained about the same at 174 percent of the global average (1.7x), while Chinese firms’ had risen to 21 percent (0.2x).[104] (See figure 25.)
Figure 25: 10-year change in U.S. and Chinese firms’ shares of global R&D and LQ for aerospace and defense
Pharmaceuticals and Biotechnology
The pharmaceutical and biotechnology sector includes “companies engaged in research into and development of biological substances for the purposes of drug discovery and diagnostic development, and which derive the majority of their revenue from either the sale or licensing of these drugs and diagnostic tools.”[105] It also includes manufacturers of prescription and over-the-counter drugs and companies that cultivate and distribute cannabis, or both.[106]
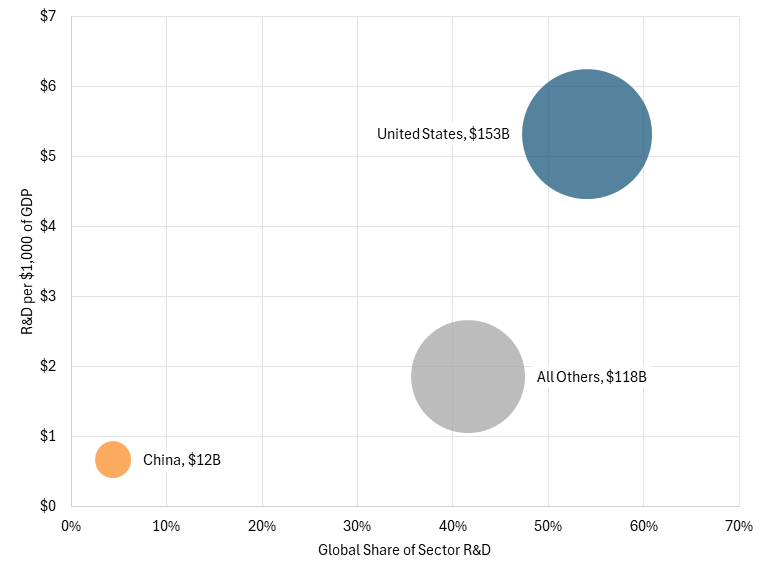
U.S. firms R&D investment dominates in the pharmaceutical and biotechnology sector. In 2024, U.S. firms invested $153 billion in R&D, making up 54 percent of the sector’s global R&D investment. In comparison, Chinese firms invested $12.4 billion, making up 4 percent of the global R&D investment.[107] When controlling for GDP, U.S. firms invested about 8 times more than Chinese firms did.[108] For every $1,000 of GDP, U.S. firms invested $5.32, while Chinese firms invested only $0.66.[109] This is compared with the rest of the world’s R&D share of 42 percent and investment of $1.85 for every $1,000.[110] (See figure 26.)
Figure 26: U.S. and Chinese firms’ R&D investments in pharmaceuticals and biotechnology, 2024
Despite China’s lag behind the United States in biotech innovation, the gap is narrowing quickly. As ITIF has found, a combination of government subsidies, financial incentives, science parks, start-up incubators, talent recruitment programs, public-private partnerships, and regulatory reforms to speed up drug approvals and strengthen intellectual property protection is accelerating growth in China’s biotech sector.[111] The report highlights that signs of rising innovation are increasingly visible: in 2023, the U.S. Food and Drug Administration (FDA) approved three new Chinese-developed drugs, and China’s share of global value-added pharmaceutical output surged from about 5.6 percent in 2002 to 24.2 percent by 2019, underscoring the speed of its catch-up.[112]
Due to the Unted States’ strong pharmaceutical innovation ecosystem, U.S. firms have consistently invested more than Chinese firms have in R&D, though Chinese firms’ investments are also growing. In 2014, U.S. firms’ R&D share of the global sector was 45 percent compared with Chinese firms’ 1 percent.[113] And in 2024, U.S. firms’ share grew to 54 percent but was still significantly higher than Chinese firms’ 4 percent.[114]
In the last decade, U.S. firms’ size-adjusted investment grew slightly while Chinese firms’ grew much more, but U.S. firms’ investment remains above the global average while Chinese firms’ remains below. In 2014, U.S. firms’ size-adjusted R&D investment was 204 percent of the average global (2.0x), while Chinese firms’ was 6 percent (0.1x).[115] By 2024, U.S. firms’ R&D investment had increased to 210 percent of the global average (2.1x), while Chinese firms’ had risen to 26 percent (0.3x).[116] (See figure 27.)
Figure 27: 10-year change in U.S. and Chinese firms’ shares of global R&D and LQ for pharmaceuticals and biotechnology
Alternative Energy
The alternative energy sector includes “companies that produce alternative fuels such as ethanol, methanol, hydrogen and bio-fuels that are mainly used to power vehicles, and companies that are involved in the production of vehicle fuel cells and/or the development of alternative fueling infrastructure.”[117] Moreover, the sector also includes “companies that develop or manufacture renewable energy equipment utilizing sources such as solar, wind, tidal, geothermal, hydro and waves.”[118]
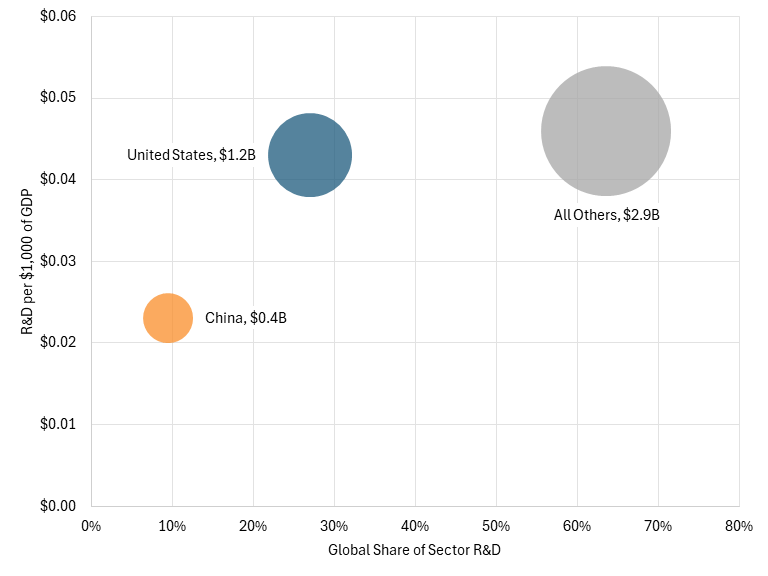
U.S. firms have invested more than Chinese firms in R&D. In 2024, U.S. firms invested $1.2 billion in R&D, making up 27 percent of the sector’s global R&D investments. In comparison, Chinese firms invested $433 million, making up 9 percent of the global R&D investments.[119] When controlling for GDP, U.S. firms invested 1.9 times more than Chinese firms did.[120] For every $1,000 of GDP, U.S. firms invested $0.04, while Chinese firms invested only $0.02.[121] This is compared with the rest of the world’s R&D share of 64 percent and investment of $0.05 for every $1,000.[122] (See figure 28.)
Figure 28: U.S. and Chinese firms’ R&D investments in alternative energy, 2024
Although U.S. firms may be investing more aggressively in alternative energy R&D, Chinese firms are also investing heavily and making progress. For instance, in the area of EV batteries, Chinese institutions today account for 65.4 percent of the high-impact research publications in electric batteries, substantially outpacing U.S. institutions’ 11.9 percent. Chinese entities’ global share of patents in the field of electric propulsion increased from 2.4 percent in 2010 to 26.9 percent in 2020.[123] In other words, Chinese firms may not invest as much as U.S. firms do, but they are nonetheless making progress in alternative energy innovation.
U.S. firms have historically invested more than Chinese firms have in R&D. In 2014, U.S. firms’ R&D share of the global sector was 21 percent compared with Chinese firms’ 13 percent.[124] By 2024, U.S. firms’ share had risen to 27 percent while Chinese firms’ share had declined to 9 percent.[125] In other words, U.S. firms’ R&D investments have grown while Chinese firms’ have declined.
In the area of EV batteries, Chinese institutions today account for 65.4 percent of high-impact research publications, substantially outpacing U.S. institutions’ 11.9 percent.
In the last decade, while U.S. firms’ size-adjusted investments rose to above the global average, Chinese firms’ fell and remained below the global average. In 2014, U.S. firms’ size-adjusted R&D investment was 96 percent of the average global (1.0x), while Chinese firms’ was slightly higher at 97 percent (1.0x).[126] By 2024, U.S. firms’ R&D investment had risen to 104 percent of the global average (1.0x), while Chinese firms’ had fallen to 56 percent (0.6x).[127] (See figure 29.)
Figure 29: 10-year change in U.S. and Chinese firms’ shares of global R&D and LQ for alternative energy
Recommendations and Conclusion
Scientific and engineering research is key to innovation success for firms and economies. This generated knowledge is translated into innovation, including novel products and processes. More importantly, business research resulting in knowledge is a crucial driver of global competitiveness for a nation because manufacturing industries and many service industries rely on R&D for competitive success.[128]
As such, if we want to reverse the process of Chinese firms closing the gap with U.S. firms in R&D investment, Congress should take three key steps. First, it should boost R&D tax incentives. According to a 2020 ITIF study, the United States ranked 24th out of 34 Organization for Economic Cooperation and Development (OECD) countries in the generosity of tax support for R&D, while China ranked 8th.[129] The Chinese credit is 2.7 times more generous than that of the United States.
Congress should at minimum 1) double the R&D tax credit rate from 20 to 40 percent for the regular credit and 2) double the Alternative Simplified Credit, an R&D tax credit, from 14 percent to 20 percent.[130]
Second, Congress needs to expand federally funded R&D, especially R&D related to strategic industries, and spend it in ways that engage with industry, as opposed to simply giving the money to a university or national lab researcher. One way to do this is to expand the Manufacturing USA Center program.
Finally, China unfairly benefits from the R&D done in other countries, including the United States. Congress and the Trump administration need to take stronger steps to limit the ability of Chinese firms to take advantage of U.S. R&D. A forthcoming ITIF report will provide a detailed list of policy recommendations.
Appendix: Caveats About The Dataset
There are some caveats about this dataset. The companies’ locations are categorized by their headquarters rather than where R&D investments occurred; company sectors are classified by main business activities; and most of the data does not adjust for purchasing power parity to reflect lower R&D salaries in China. If it did, Chinese expenditures would be considerably larger. Moreover, the Scoreboard collects R&D investment data from companies’ annual financial records. As a result, companies’ R&D investment is in their nations’ nominal dollars and not adjusted to control for changes in currency values. If the values of the euro and dollar strengthen compared with other nations, then U.S. aggregate R&D investments will appear larger than if the euro or dollar value remained constant.
Acknowledgments
The author would like to thank Robert Atkinson for his guidance and feedback on this report. Any errors or omissions are the author’s responsibility alone.
This report is part of a series that has been made possible in part by generous support from the Smith Richardson Foundation. (For more, see: itif.org/power-industries.)
About the Author
Trelysa Long is a policy analyst at ITIF. She was previously an economic policy intern with the U.S. Chamber of Commerce. She earned her bachelor’s degree in economics and political science from the University of California, Irvine.
About ITIF
The Information Technology and Innovation Foundation (ITIF) is an independent 501(c)(3) nonprofit, nonpartisan research and educational institute that has been recognized repeatedly as the world’s leading think tank for science and technology policy. Its mission is to formulate, evaluate, and promote policy solutions that accelerate innovation and boost productivity to spur growth, opportunity, and progress. For more information, visit itif.org/about.
Endnotes
[1]. Alex Muresianu, “Public and Private R&D Are Complements, Not Substitutes,” Tax Foundation, May 16, 2022, https://taxfoundation.org/private-rd-public-rd-investment/.
[2]. Robert Atkinson, “American needs to sort out its industrial policy confusion,” The Hill, April 15, 2023, https://thehill.com/opinion/technology/3952425-america-needs-to-sort-out-its-industrial-policy-confusion/.; Robert Atkinson, “The Hamilton Index: Assessing National Performance in the Competition for Advanced Industries” (ITIF, June 8, 2022), https://itif.org/publications/2022/06/08/the-hamilton-index-assessing-national-performance-in-the-competition-for-advanced-industries/.
[3]. European Commission, The 2025 EU Industrial R&D Investment Scoreboard (R&D investments for 2024), accessed January 2026, https://iri.jrc.ec.europa.eu/scoreboard/2025-eu-industrial-rd-investment-scoreboard; European Commission, The 2015 EU Industrial R&D Investment Scoreboard (R&D investments for 2014), accessed January 2026, https://iri.jrc.ec.europa.eu/scoreboard/2015-eu-industrial-rd-investment-scoreboard; International Monetary Fund, Representative Exchange Rates (exchange rate for 2014 and 2024), accessed January 2026, https://www.imf.org/external/np/fin/data/param_rms_mth.aspx; World Bank, World Development Indicators (GDP for the United States, China, Canada, and the world), accessed January 2026, https://databank.worldbank.org/source/world-development-indicators#.
[4]. Ibid.
[5]. Ibid.
[6]. Nicole Sganga, “Chinese hackers took trillions in intellectual property from about 30 multinational companies,” CBS News, May 4, 2022, https://www.cbsnews.com/news/chinese-hackers-took-trillions-in-intellectual-property-from-about-30-multinational-companies/.
[7]. European Commission, The 2025 EU Industrial R&D Investment Scoreboard.
[8]. Ibid.
[9]. Ibid.
[10]. Ibid.; International Monetary Fund, Representative Exchange Rates (exchange rate for 2014 and 2024), accessed January 2026, https://www.imf.org/external/np/fin/data/param_rms_mth.aspx.
[11]. Ibid.
[12]. Ibid.
[13]. Ibid.
[14]. Robert Atkinson, “China Is Rapidly Becoming a Leading Innovator in Advanced Industries” (ITIF, September 2024), https://itif.org/publications/2024/09/16/china-is-rapidly-becoming-a-leading-innovator-in-advanced-industries/.
[15]. European Commission, The 2025 EU Industrial R&D Investment Scoreboard.; International Monetary Fund, Representative Exchange Rates.
[16]. Ibid.
[17]. Ibid.
[18]. Ibid.
[19]. Ibid.
[20]. Ibid.
[21]. Ibid.
[22]. European Commission, The 2025 EU Industrial R&D Investment Scoreboard (R&D investments for 2024), accessed January 2026, https://iri.jrc.ec.europa.eu/scoreboard/2025-eu-industrial-rd-investment-scoreboard.; International Monetary Fund, Representative Exchange Rates (exchange rate for 2014 and 2024), accessed January 2026, https://www.imf.org/external/np/fin/data/param_rms_mth.aspx.
[23]. Ibid.; World Bank, World Development Indicators.
[24]. Ibid.
[25]. Ibid.; European Commission, The 2015 EU Industrial R&D Investment Scoreboard.
[26]. Ibid.
[27]. FTSE Russell, Industry Classification Benchmark (ICB) Structure & Definitions (ICB classification and sector descriptions), accessed June 30, 2023, https://www.ftserussell.com/data/industry-classification-benchmark-icb.
[28]. Ibid.
[29]. European Commission, The 2025 EU Industrial R&D Investment Scoreboard.; International Monetary Fund, Representative Exchange Rates.
[30]. Ibid.
[31]. Ibid.; World Bank, World Development Indicators.
[32]. Ibid.
[33]. Ibid.; European Commission, The 2015 EU Industrial R&D Investment Scoreboard.
[34]. Ibid.
[35]. Ibid.
[36]. Ibid.
[37]. FTSE Russell, Industry Classification Benchmark (ICB) Structure & Definitions.
[38]. Trelysa Long, “Decoupling Risks: How Semiconductor Export Controls Could Harm US Chipmakers and Innovation” (ITIF, November 2025), https://itif.org/publications/2025/11/10/decoupling-risks-semiconductor-export-controls-harm-us-chipmakers-innovation/.
[39]. European Commission, The 2025 EU Industrial R&D Investment Scoreboard.; International Monetary Fund, Representative Exchange Rates.
[40]. Ibid.
[41]. Ibid.; World Bank, World Development Indicators.
[42]. Ibid.
[43]. Ibid.; European Commission, The 2015 EU Industrial R&D Investment Scoreboard.
[44]. Ibid.
[45]. Ibid.
[46]. Ibid.
[47]. FTSE Russell, Industry Classification Benchmark (ICB) Structure & Definitions.
[48]. Ibid.
[49]. European Commission, The 2025 EU Industrial R&D Investment Scoreboard.; International Monetary Fund, Representative Exchange Rates.
[50]. Ibid.
[51]. Ibid.; World Bank, World Development Indicators (gdp for the United States, China, Canada, and the world), accessed January 2026, https://databank.worldbank.org/source/world-development-indicators#.
[52]. Ibid.
[53]. European Commission, The 2015 EU Industrial R&D Investment Scoreboard.
[54]. Ibid.
[55]. Ibid.
[56]. Ibid.
[57]. FTSE Russell, Industry Classification Benchmark (ICB) Structure & Definitions.
[58]. Trelysa Long, “Mapping Industrial Strength: US Machine Tool Production and Consumption” (ITIF, December 2025), https://itif.org/publications/2025/12/15/mapping-industrial-strength-us-machine-tool-production-and-consumption/.
[59]. European Commission, The 2025 EU Industrial R&D Investment Scoreboard.; International Monetary Fund, Representative Exchange Rates.
[60]. Ibid.
[61]. Ibid.; World Bank, World Development Indicators (gdp for the United States, China, Canada, and the world), accessed January 2026, https://databank.worldbank.org/source/world-development-indicators#.
[62]. Ibid.
[63]. Trelysa Long, “Mapping Industrial Strength: US Machine Tool Production and Consumption.”
[64]. Ibid.
[65]. European Commission, The 2025 EU Industrial R&D Investment Scoreboard.; European Commission, The 2025 EU Industrial R&D Investment Scoreboard.; International Monetary Fund, Representative Exchange Rates.; World Bank, World Development Indicators.
[66]. Ibid.
[67]. Ibid.
[68]. Ibid.
[69]. FTSE Russell, Industry Classification Benchmark (ICB) Structure & Definitions.
[70]. Ibid.
[71]. European Commission, The 2025 EU Industrial R&D Investment Scoreboard.; International Monetary Fund, Representative Exchange Rates.
[72]. Ibid.
[73]. Ibid. World Bank, World Development Indicators.
[74]. Ibid.
[75]. Ibid.; European Commission, The 2015 EU Industrial R&D Investment Scoreboard.
[76]. Ibid.
[77]. Ibid.
[78]. Ibid.
[79]. FTSE Russell, Industry Classification Benchmark (ICB) Structure & Definitions.
[80]. European Commission, The 2025 EU Industrial R&D Investment Scoreboard.; International Monetary Fund, Representative Exchange Rates.
[81]. Ibid.
[82]. Ibid.
[83]. Ibid.
[84]. Stephen Ezell, “How Innovative Is China in the Electric Vehicle and Battery Industries?” (ITIF, July 2024), https://itif.org/publications/2024/07/29/how-innovative-is-china-in-the-electric-vehicle-and-battery-industries/.
[85]. Ibid.
[86]. Ibid.
[87]. European Commission, The 2025 EU Industrial R&D Investment Scoreboard.; European Commission, The 2025 EU Industrial R&D Investment Scoreboard.; International Monetary Fund, Representative Exchange Rates.; World Bank, World Development Indicators.
[88]. Ibid.
[89]. Ibid.
[90]. Ibid.
[91]. FTSE Russell, Industry Classification Benchmark (ICB) Structure & Definitions.
[92]. Ibid.
[93]. European Commission, The 2025 EU Industrial R&D Investment Scoreboard.; International Monetary Fund, Representative Exchange Rates.
[94]. Ibid.
[95]. Ibid.; World Bank, World Development Indicators (GDP for the United States, China, Canada, and the world), accessed January 2026, https://databank.worldbank.org/source/world-development-indicators#.
[96]. Ibid.
[97]. Scott Kennedy, “China’s COMAC: An Aerospace Minor Leaguer” (CSIS, December 2020), https://www.csis.org/blogs/trustee-china-hand/chinas-comac-aerospace-minor-leaguer.
[98]. Ibid.
[99]. Kevin Gawora, “Fact of the Week: China Has Provided Its State-Owned National Champion in Commercial Aviation as Much as $72 Billion in Development Subsidies” (ITIF, February 8, 2021), https://itif.org/publications/2021/02/08/fact-week-china-has-provided-its-state-owned-national-champion-commercial/.
[100]. Ibid.
[101]. European Commission, The 2025 EU Industrial R&D Investment Scoreboard.; European Commission, The 2015 EU Industrial R&D Investment Scoreboard.; International Monetary Fund, Representative Exchange Rates.; World Bank, World Development Indicators.
[102]. Ibid.
[103]. Ibid.
[104]. Ibid.
[105]. FTSE Russell, Industry Classification Benchmark (ICB) Structure & Definitions.
[106]. Ibid.
[107]. European Commission, The 2025 EU Industrial R&D Investment Scoreboard.; International Monetary Fund, Representative Exchange Rates.
[108]. Ibid.
[109]. Ibid.; World Bank, World Development Indicators.
[110]. Ibid.
[111]. Sandra Barbosu, “How Innovative Is China in Biotechnology?” (ITIF, July 2024), https://itif.org/publications/2024/07/30/how-innovative-is-china-in-biotechnology/.
[112]. Ibid.
[113]. European Commission, The 2025 EU Industrial R&D Investment Scoreboard.; European Commission, The 2015 EU Industrial R&D Investment Scoreboard.; International Monetary Fund, Representative Exchange Rates.; World Bank, World Development Indicators.
[114]. Ibid.
[115]. Ibid.
[116]. Ibid.
[117]. FTSE Russell, Industry Classification Benchmark (ICB) Structure & Definitions.
[118]. Ibid.
[119]. European Commission, The 2025 EU Industrial R&D Investment Scoreboard.; International Monetary Fund, Representative Exchange Rates.
[120]. Ibid.
[121]. Ibid.; World Bank, World Development Indicators.
[122]. Ibid.
[123]. Ezell, “How Innovative Is China in the Electric Vehicle and Battery Industries?”
[124]. European Commission, The 2025 EU Industrial R&D Investment Scoreboard.; European Commission, The 2015 EU Industrial R&D Investment Scoreboard.; International Monetary Fund, Representative Exchange Rates.; World Bank, World Development Indicators.
[125]. Ibid.
[126]. Ibid.
[127]. Ibid.
[128]. Michael E. Porter and Jan W. Rivkin, “The Looming Challenge to U.S. Competitiveness,” Harvard Business Review, March 2012, https://hbr.org/2012/03/the-looming-challenge-to-us-competitiveness.
[129]. John Lester and Jacek Warda, “Enhanced Tax Incentives for R&D Would Make Americans Richer” (ITIF, September 2020), https://www2.itif.org/2020-enhanced-tax-incentives-rd.pdf.
[130]. Joe Kennedy and Robert Atkinson, “Why Expanding the R&D Tax Credit Is Key to Successful Corporate Tax Reform” (ITIF, July 2017), https://www2.itif.org/2017-rd-tax-credit.pdf.
