

An Important Metric Policymaker Should Watch: Foreign Receipts as a Share of GDP
Globalization has long shaped America’s economic footprint abroad and its competitiveness at home. When U.S. companies successfully operate in foreign markets, the resulting revenue can reinforce domestic investment and support job growth. Yet not all foreign activity benefits the United States. In some cases, firms expand or shift operations overseas in ways that reduce domestic R&D, a key driver of U.S. competitiveness.
One way to gauge how U.S. firms are engaging globally is by examining receipts from the rest of the world as a share of gross domestic product (GDP). According to data from the U.S. Bureau of Economic Analysis on foreign receipts and GDP, globalization of U.S. companies has unfolded in three waves and has generally trended upward over the past century.
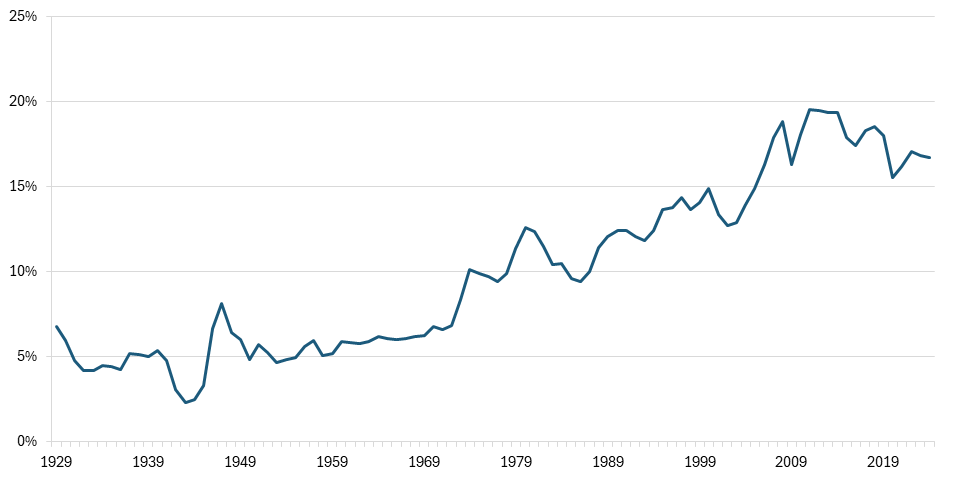
Over the past ninety years, globalization for U.S. firms has progressed through three general phases. In the first phase, from 1932 to 1971 (the year President Nixon took the United States off the gold standard), foreign receipts held steady at about 5 percent of GDP. Few American firms were global in nature; most focused their production and sales on the U.S. market.
From around 1974 to 2004, foreign receipts averaged roughly 12 percent of GDP, in part due to technological innovations that made trade easier—such as container shipping, cheaper long-distance telephony, air travel, and early software systems—as well as faster-growing foreign markets.
The third wave arrived in the early 2000s, ultimately reaching a peak of 19 percent of GDP in the early 2010s. (See figure 1.) This growth appears to have been spurred by additional technological innovations, especially the Internet and e-commerce, and by major economies liberalizing and lowering trade barriers. However, this expansion was also coupled with increasing, and often contradictory, pressures by nations for U.S. corporations to localize production as a condition of market access.
Figure 1: Receipts from the rest of the world as a share of U.S. gross domestic product from 1929 to 2024
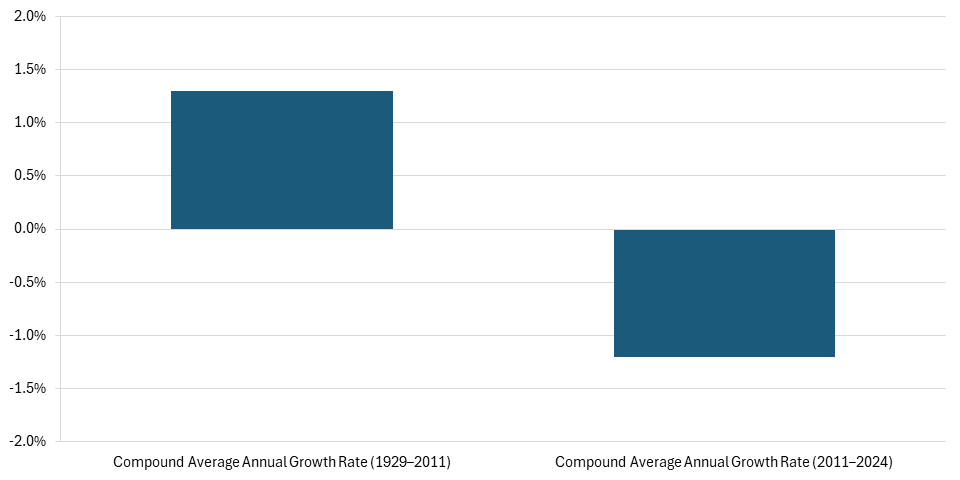
But this rise has reversed in recent years. From 1929 to 2011, foreign receipts as a share of GDP had an average annual growth rate of 1.3 percent. Since the peak in 2011, however, the average annual growth rate has been negative, at -1.2 percent. (See figure 2.) This recent decline is likely related to rising global competition, particularly from China, which led global output in seven of ten strategically important industries in 2020.
Figure 2: Average annual growth rate of foreign receipts as a share of gross domestic product
Policymakers should track foreign receipts as a share of GDP as a standard indicator of how U.S. firms’ global activity is evolving and whether it aligns with national economic interests and strategic objectives. By incorporating this indicator into routine analysis, policymakers can better understand where competitive pressures are intensifying and how those pressures may be shaping the global position of U.S. firms. This is an especially important task as China already leads in multiple advanced industries.
