
Still Insignificant: An Update on Concentration in the US Economy
Despite evidence to the contrary, a persistent narrative during the past two administrations has been that corporate power is getting increasingly concentrated, ergo antitrust breakups are warranted. But the latest Census Bureau data once again puts the lie to that argument.
KEY TAKEAWAYS
Key Takeaways
Contents
The Great Concentration Panic. 3
Census Bureau Concentration Data. 4
Industries With High Increases in Concentration From 2017 to 2022. 9
Advanced Technology Sectors 11
Incorporating Trade Data Into the Analysis 12
Concentration in 2022 Is Lower When Imports and Exports Are Incorporated. 13
Concentration Decreases Over Time When Imports and Exports Are Incorporated. 14
Highly Concentrated Industries When Net Imports Are Considered. 15
How Should Antitrust Move Forward? 16
Introduction
Populist antitrust reformers, in a push to overhaul decades of allegedly flagging antitrust enforcement in the United States, have staked much of their position on evidence of rising market concentration in the U.S. economy.[1] Concentration, in their view, is the most proximate cause of a host of economic ills, such as inflation and harm to consumers, workers, and even the democratic process.
This report leaves these specific issues to the side and inquires whether rising concentration can be found in the data. It documents new evidence contained in the Census Bureau’s most recent release of U.S. industrial concentration data.[2] Overall, the evidence points to a continuing trend found in studies conducted on the release of the 2017 Economic Census data.[3] That is, increases in concentration have been negligent and in many relevant aspects has gone down:
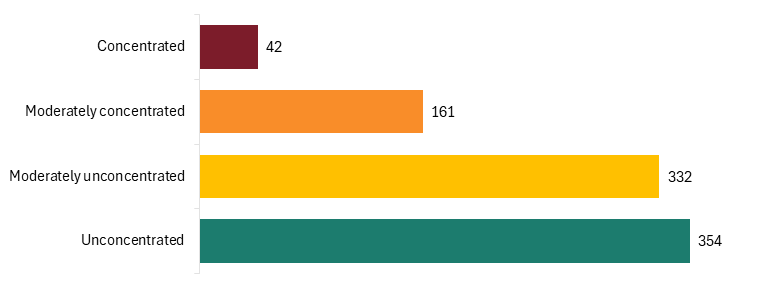
▪ The overall proportion of industries in the data that are highly concentrated—defined as having a four-firm concentration ratio (C4 ratio) of 80 percent or higher—remained low at 42 out of 889 firms, or about 4.7 percent.[4]
▪ Of the 889 industries assessed, about 52 percent became more concentrated and 48 percent became less concentrated between 2017 and 2022.
▪ Out of the industries that became more concentrated, only 15 percent increased by 10 or more percentage points. Most industries either increased moderately (44 percent of the total) or decreased moderately (41 percent of the total).
▪ The relationship between concentration in 2017 and percentage point increase between then and 2022 was slightly negative. The relationship indicates that a higher concentration in 2017 is associated with a decrease in concentration between 2017 and 2022.
▪ Of industries with a C4 ratio of 60 percent or higher in 2017, only eight of them increased in concentration by 10 percentage points or more between 2017 and 2022.
▪ When incorporating trade data, which increases competition, the number of highly or moderately concentrated industries fell, and the number of low concentration industries grew.
▪ Percentage point increases with trade declined as well, and the composition of the most highly concentrated industries changed.
In summary, if there is cause for concern about competition in the U.S. economy, it is not found in aggregate concentration statistics. This result is even more pronounced when taking into account trade data.
The Great Concentration Panic
In recent history, studies of industrial concentration have been used as a justification for stricter antitrust enforcement policies. The Biden administration attempted to overhaul competition policy, claiming that enforcement over the preceding four decades had been a “failed experiment.”[5] Biden’s executive order on competition referred to “excessive concentration” and “overconcentration” four times each.[6] Nearly the entire basis for the overhaul rested on the claim that concentration had increased in many industries, in turn causing harm to consumers, workers, and small businesses.
These views were magnified by studies claiming to show that concentration in the U.S. economy had been increasing since the late 1990s.[7] Despite detailed warnings from experienced antitrust economists about reading too much into this evidence, this was taken by many to be a sign of flagging competition and growing monopoly power across sectors.[8] It further buoyed progressive enforcers who attempted to institute an “anti-big tech” antitrust enforcement program.[9] These reformers argue that, due to the welfare harms they believe to be associated with concentration, further concentration should be cut off in its incipiency through, for instance, stricter merger enforcement.[10]
Supporters of this enforcement program have argued for policies that would automatically disqualify a merger, such as a “structural presumption,” if such a merger would increase concentration in a relevant industry by a certain percentage, or above a certain absolute threshold.[11] In light of this, it is important to continue estimating how concentration is changing. If such policies are instituted unnecessarily, it could cause avoidable harm to efficiency, innovation, and consumer welfare.
The rhetoric of harmful concentration and needed structural remedies has continued, albeit in a slightly different form under the second Trump administration. While the administration has revoked the Biden executive order on competition, it has signaled continued concern about the “private power” present in certain industries it views as highly concentrated, such as “big tech.”[12] Indeed, in many ways it seems that the “big is bad” mentality of the Neo-Brandeisians is alive and well in the America First Antitrust movement.[13] It is therefore worthwhile to review the evidence on industrial concentration in the aggregate as a check on whether overall concentration should give enforcers cause for concern.
Studies using data from the 2017 Economic Census have found that the panic over increasing concentration was starkly overblown. For instance, in a 2021 Information Technology and Innovation Foundation (ITIF) report by Robert Atkinson and Filipe Lage de Sousa, of which this report is a substantive update, the authors found little cause for concern about “runaway corporate concentration.”[14] Their dataset contained C4 ratios tracked from 2002 to 2017 in the Census data.[15] Robert Kulick and Andrew Card showed that the distribution of concentration across percentiles largely declined between 2002 and 2017.[16]
In a substantive overview and synthesis of the evidence on trends in competition in the United States, including studies on industrial concentration, Carl Shapiro and Ali Yurukoglu find no cause for alarm about overall competition in the U.S. economy and confirm that industry-level analysis is needed to assess harm to competition.[17]
Census Bureau Concentration Data
This section looks at the U.S. Census concentration data for 2022 and compares it with the concentration data for 2017.[18] We used concentration data from the U.S. Census Bureau’s Economic Census, conducted every five years, which provides data on the number of firms in industries classified according to the North American Industrial Classification System (NAICS), which assigns codes to different sectors and industries. Two-digit codes are the broadest categorization of sectors, and six-digit codes are assigned to the narrowest classification and are the finest grained and get the closest to economic markets, which are composed of goods that are substitutes and therefore compete with one another.
There is an important conceptual difference between market concentration, which is based on demand-side substitution patterns between specific goods, and industrial concentration, which is derived from an industrial classification system. The latter is relied upon as a matter of expediency because the deep analysis needed to obtain the data to determine market concentration is not scalable and amenable to aggregate analysis, though economists have provided a framework for how this would work.[19] This is the primary reason that analyzing aggregate concentration can never be a substitute for the industry-specific research required to determine how competition is faring in a particular industry.[20]
Another issue with relying on Census data is that it does not include imports, which compete with the goods produced by domestic firms, and exports, which are produced in the U.S. to be sent abroad and therefore are not part of the option set for U.S. consumers. We control for this in a following section of this report by matching six-digit NAICS code industries from the Census data with data on imports and exports from the U.S. International Trade Commission (ITC). We are able to match 297 industries, primarily in the manufacturing sector, and find that it pushes concentration down overall for those industries.
A further caveat about the use of industrial concentration measures is that it does not capture potential competition, which is of paramount importance in dynamic markets wherein large market shares can mask the pervasive competition faced by incumbent firms. Aggregate concentration measures are of necessity a static and imperfect representation of private sector competition. Yet, industrial statistics cover a substantial swath of economic activity and are thus still a useful indicator.
This study focuses on the C4 ratio—the percentage of industry output controlled by the top four largest firms. This is the most informative measure of concentration short of the Herfindahl-Hirchman Index (HHI), which is closer to what antitrust agencies calculate for investigations but is only available for select industries in the Census data.[21] Therefore, C4 ratios were used to balance relevance and breadth of coverage. If an industry has a C4 of 80 percent, for example, the top four firms have an average of 20 percent of the market each. This is considered a concentrated market, as shown in table 1.
Table 1: C4 concentration levels and thresholds
|
Market Concentration Levels |
C4 Thresholds |
|
Concentrated |
80% to 100% |
|
Moderately concentrated |
50% to 80% |
|
Moderately unconcentrated |
25% to 50% |
|
Unconcentrated |
0% to 25% |
NAICS codes are updated between each new Economic Census in an attempt to account for changing industrial conditions.[22] Most changes between 2017 and 2022 occurred by grouping two or more six-digit codes that were separated in the 2017 data into one combined new code in the 2022 data. For example, Surface Coal Mining (code 212114) in 2022 was a combination of two 2017 codes (212111 and 212113). To deal with these changes and homogenize our dataset so that each six-digit code in 2022 had a matching code for 2017, we took the weighted average of the C4 ratio for each 2017 code that was combined into the new 2022 code. The ratios of the two industries were weighted by their total shares of sales.[23]
Concentration in 2022
In 2022, industries covered by the Economic Census overall were unconcentrated. A majority of industries (77 percent) had C4 ratios lower than 50 percent. In other words, the top four firms had on average just 12.5 percent of market share. Only 4.7 percent of industries had a highly concentrated C4 ratio of 80 percent or more. Only 161 industries (18 percent) were moderately concentrated. This was down from 2017, when 20 percent were moderately concentrated.
Figure 1: Count of C4 concentration levels among all 889 six-digit NAICS industries, 2022
Changes in Concentration
The overall average C4 ratio for the 2022 Census data was 34.6 percent. The average of our matched 2017 Census data was 34.3 percent. Therefore, aggregate concentration increased by less than a single percentage point. And, as ITIF’s 2021 report found no significant increase in concentration from 2002 to 2017, this increase was from a low average to another low average. The median C4 ratio declined from 32 percent to 30.6 percent. The 90th percentile was 66.48, meaning only 10 percent of industries had a concentration ratio above 66.48 percent.
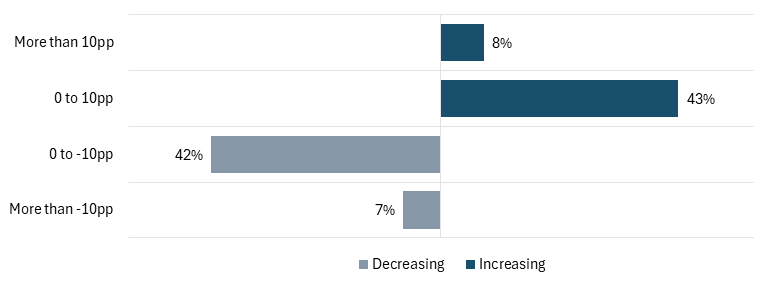
Overall, 51 percent of the 889 industries increased in concentration, while 49 percent decreased (see figure 2). Only about 8 percent of the industries concentrated by more than 10 percentage points and almost as many (about 7 percent) declined by 10 percentage points or more. Most industries either increased moderately (43 percent of the total) or decreased moderately (42 percent of the total).
Figure 2: Range of C4 concentration changes among six-digit NAICS industries, 2017–2022
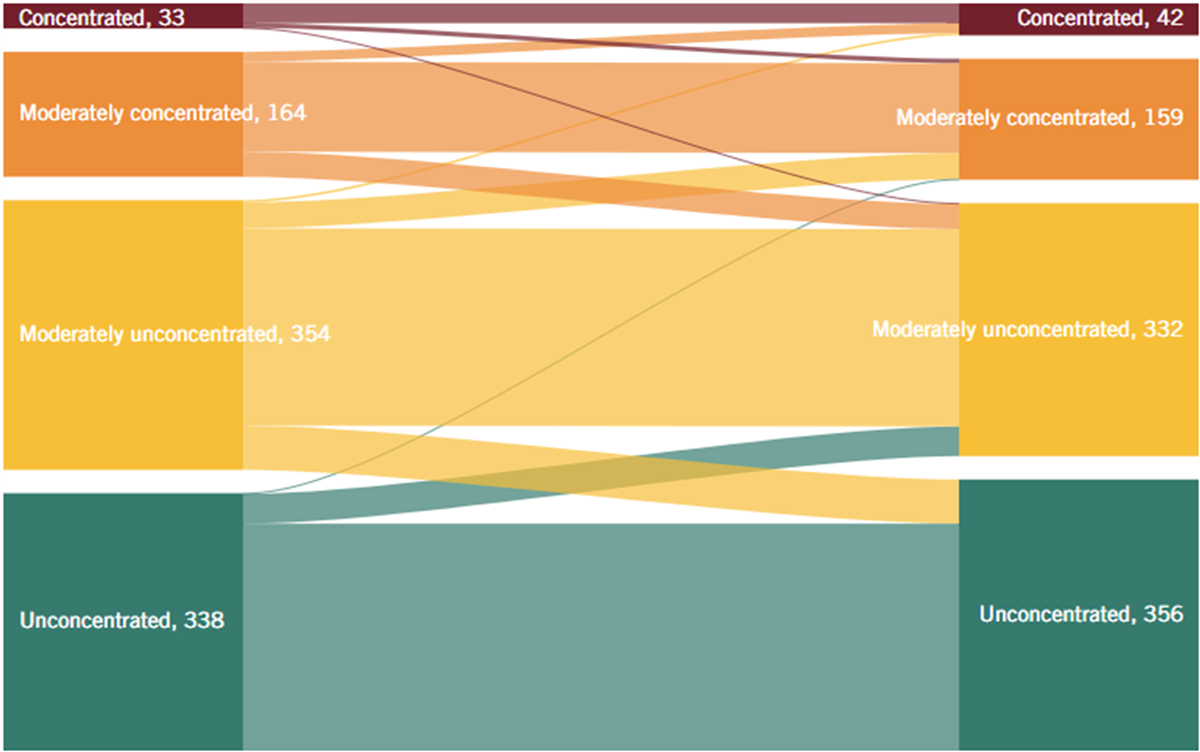
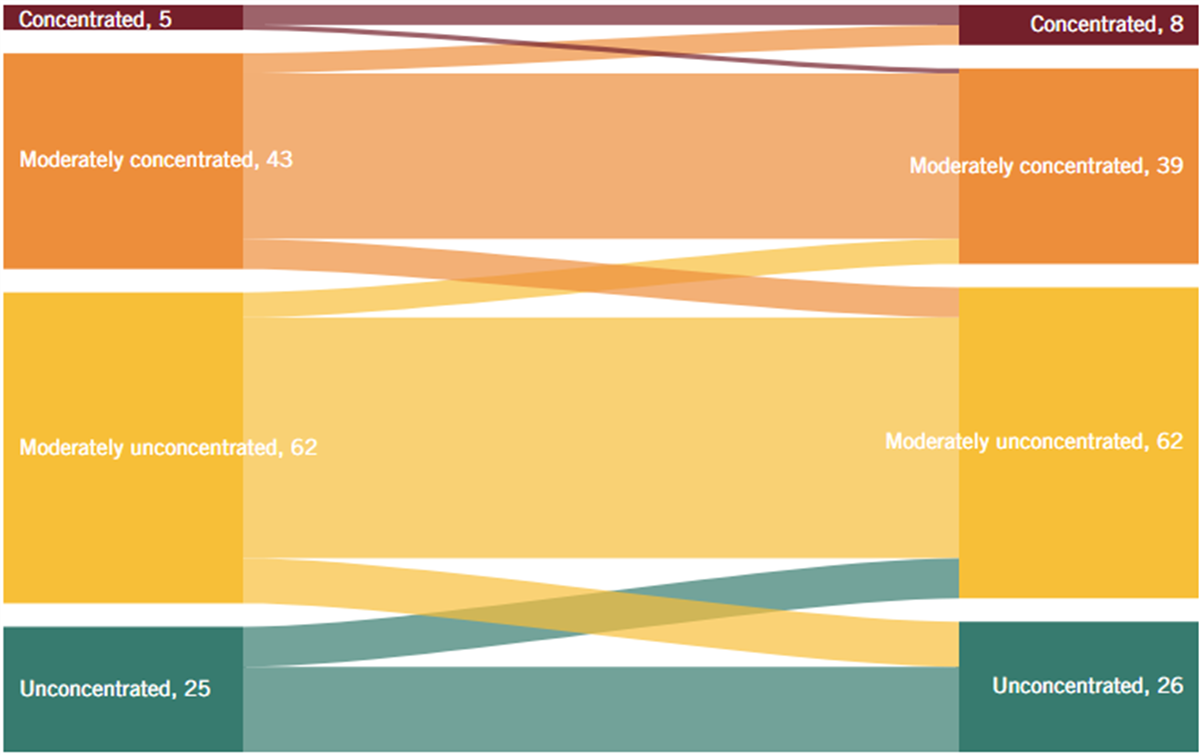
Did industries that were highly concentrated in 2017 get more concentrated by 2022? It appears not to any substantial degree. As shown in figure 3, the number of industries that were either concentrated or moderately concentrated rose by less than 1 percent, from 197 in 2017 to 201 in 2022. Meanwhile, the number of industries that were unconcentrated rose by 9.5 percent from 338 in 2017 to 356 in 2022.
Figure 3: Change in C4 concentration levels among six-digit NAICS industries, 2017–2022 (left to right)
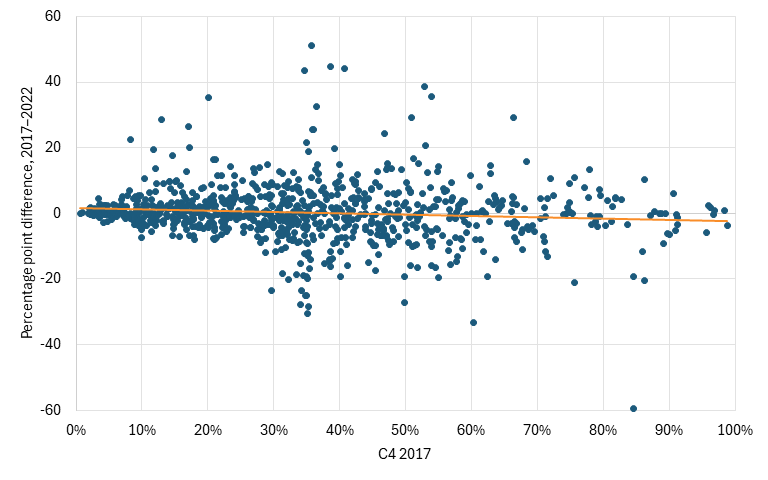
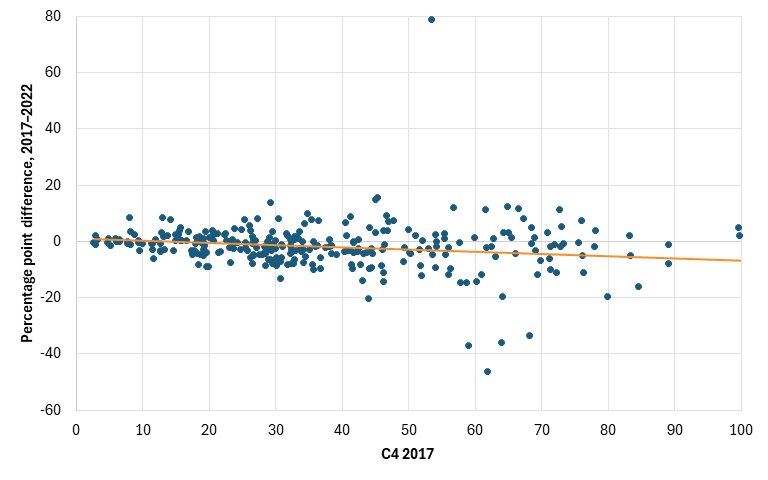
Moreover, the correlation between industries’ concentration ratio in 2017 and its percentage point change between 2017 and 2022 was slightly negative, with a correlation coefficient of ‑0.10 (see figure 4). This implies that concentrated industries in 2017 were slightly more likely to be less concentrated by 2022. This is hardly a sign that corporate monopolies were rampantly barring new entry.
Figure 4: Relationship between C4 ratio in 2017 and change in C4, 2017–2022
To further investigate what happened to industries that were relatively concentrated in 2017, figure 5 lays out the number of industries with a 2017 C4 of 60 percent or greater and their percentage point change from 2017 to 2022. Given that the 90th percentile of C4 concentration for 2017 was 64.3 percent and the 80th percentile was 51.8 percent, this analysis covers within the top 20 percent most concentrated industries of 2017, which totaled 113 industries. Figure 5 shows that, of these 113 industries, only 8 (about 7 percent) became more concentrated by 10 percentage points or more; 12 (about 11 percent) decreased by 10 percentage points or more. A majority of these firms, 52 percent, were more likely to become unconcentrated, confirming the findings of figure 4.
Figure 5: Percentage point increase to 2022 for industries with 2017 C4 ratio of 60 percent or more
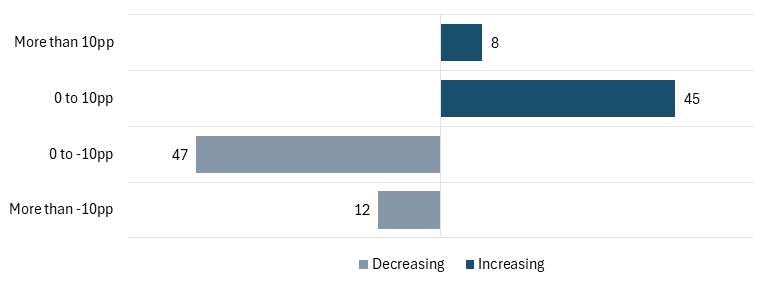
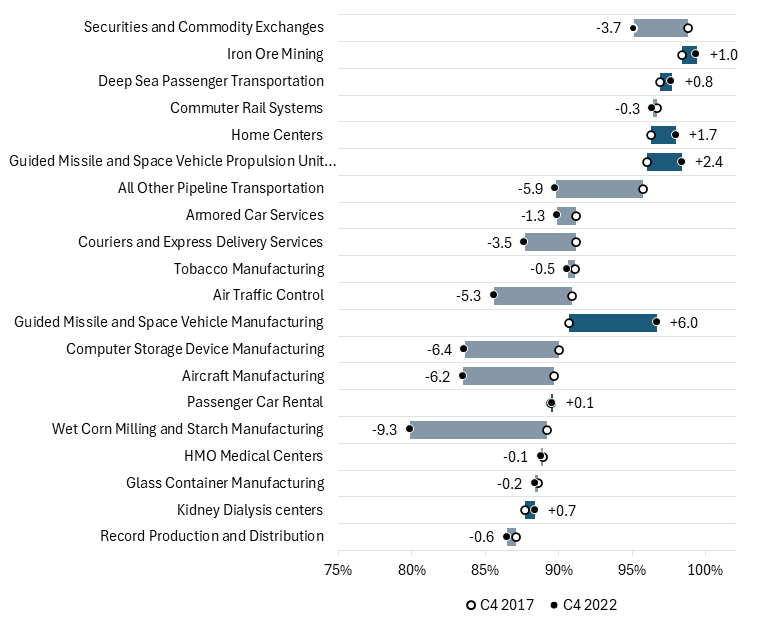
Figure 6 shows the top 20 industries with the highest C4 ratios in 2017 ordered by their percentage point increase or decrease from 2017 to 2022. On the whole, these industries were less concentrated in 2022 than they were in 2017. Seven became more concentrated while 13 became less concentrated, with an average decline among the 20 industries of -1.53 points.
Figure 6: Top 20 industries with the highest C4 ratios in 2017 and their percentage point changes, 2017–2022
Industries With High Increases in Concentration From 2017 to 2022
When deciding whether concentration is problematic, it is useful to look at industries individually. Figure 7 lays out the 20 industries with the highest increases from 2017 to 2022.
All of the retailing industries in this list (having codes that start with a “4”) experienced a concordance change since the last iteration of the Census data and may be skewed toward higher percentage point increases as a result. These industries are a combination of NAICS code 454110 (Electronic Shopping and Mail Order Houses) and others.[24] While 454110 was unconcentrated in 2017 (C4 of 36.6 percent), it comprised high sales numbers (over $515 billion for the entire industry and over $188 billion for the largest four firms).
This code was divided and combined with other industries that tend to be more concentrated and have fewer overall sales. Given 454110’s significantly higher degree of sales than the other industries, the weighted average C4 ratio for 2017 may look significantly less concentrated than the 2022 C4 ratio. If, for instance, only a handful of firms from 454110 produced leather goods, and accounted for a large volume of sales, it would tend to make the 2022 ratio look much larger than the 2017 ratio.
Therefore, the changes for these industries are likely to be overstated. On one hand, the change likely makes sense because it no longer bundles all of e-commerce and mail-order websites into one industry and recognizes that online sellers compete with traditional brick-and-mortar stores. However, if there are only a handful of successful competitors in each category, it will tend to make the markets they joined look more concentrated than they were before.
Figure 7: Top 20 industries with the highest percentage point increase in the C4 ratio, 2017–2022
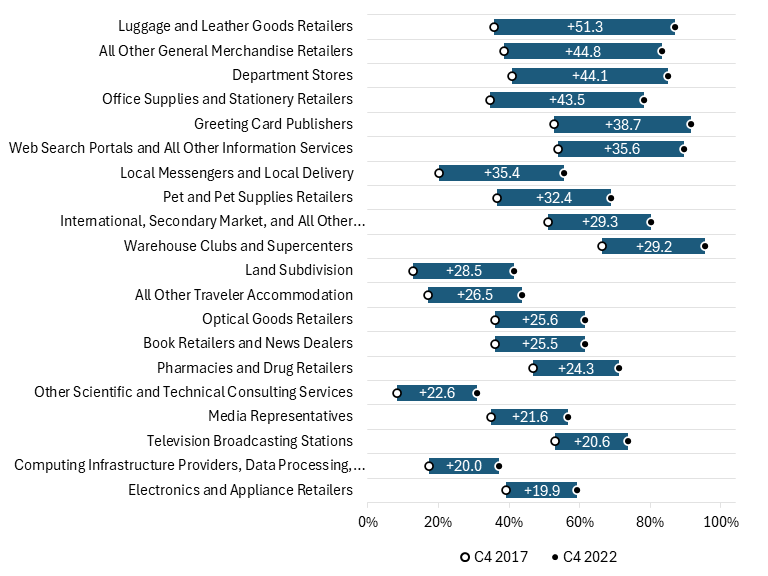
Furthermore, in dynamic markets, increasing concentration can be a response to disruptive competition from innovators.[25] As disruptive new sellers, such as online retailers or streaming services in the case of Television Broadcasting Stations (516120), enter the market and successfully compete away business, the number of other sellers shrinks. Further concentration in the industry, through, for example, mergers, can allow existing competitors to obtain the scale and investment necessary to compete with these disruptive firms.[26]
Advanced Technology Sectors
A lot of handwringing occurs over advanced technology sectors and how they might become concentrated and monopolistic. As Lina Khan wondered of nascent artificial intelligence (AI) technologies at the Federal Trade Commission (FTC) Tech Summit in 2024, “Will this be a moment of opening up markets to fair and free competition, unleashing the full potential of emerging technologies? Or will a handful of dominant firms concentrate control over these key tools, locking us into a future of their choosing?”[27]
If she had past concentration and control over advanced technologies by only a few firms in mind when expressing this concern, the concentration data should assuage her worries. As seen in figure 8 and figure 9, only 8 of the 135 industries ITIF classified as “advanced technology industries” (less than 6 percent) had high levels of concentration, defined as having a concentration ratio of 80 percent or more, in either 2017 or 2022.[28] This is at odds with the Neo-Brandeisian claim that tech markets are rife with concentration and failing competition. Indeed, in 2022, nearly two-thirds of advanced industries (65 percent) had concentration levels below 50 percent.
Figure 8: Number of advanced technology industries in C4 concentration ratio groups, 2017 and 2022[29]
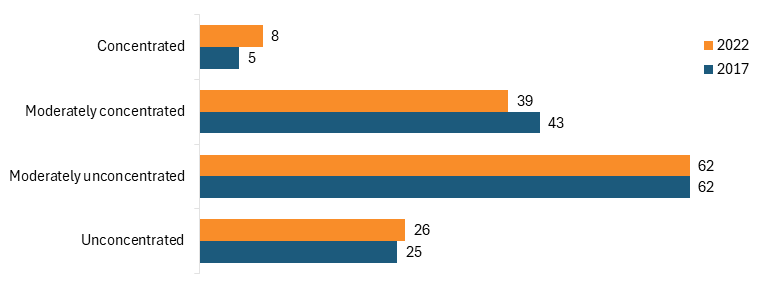
Figure 9: Change in C4 concentration levels among 135 advanced industries, 2017–2022 (left to right)
Of the eight advanced industries that were concentrated in 2022, most were unsurprising usual suspects such as aircraft and guided missile manufacturing. However, one, Web Search Portals and All Other Information Services (NAICS code 519290), is relevant to concerns about big tech. This industry’s C4 increased by over 35 percentage points from 2017 to 2022. One may be tempted to jump to the conclusion that this is a sign of harm to competition. However, recent waves of innovation in AI since these data were collected have already begun to likely erode the market share of firms in this industry as search engines such as Google face increasing search competition from large language models such as ChatGPT and Claude.[30]
Incorporating Trade Data Into the Analysis
The Economic Census data used in the previous sections cover what is produced in the United States, not the set of options facing the final consumer or the buyer side of the market.[31] This can be problematic because the concentration level based on production may not reflect the concentration that the buyer faces. A given industry may exhibit high levels of concentration, but if it substantially competes with imported goods, then the level of concentration based on Census data alone is missing that competition, and de facto concentration is lower.
To address this gap, this section includes trade data to consider concentration levels, which include imports and discount exports. The total market size was established as the total U.S. production reported in the Census data, discounted by what is produced in the United States but goes to third countries (exports) and adding what is consumed in the United States but produced abroad (imports). This information was determined at the NAICS six-digit level, matching data from the Economic Census for U.S. production and the ITC for imports and exports.[32] ITC data considers “Exports: Domestic” (i.e., exports of goods produced in the United States) and “Imports: For Consumption” (i.e., imports for consumption). Considering that this analysis involves combining six datasets—Economic Census, imports, and exports for 2017 and 2022—the sample size was reduced from 889 to 297 industries.
Additionally, the sample used to incorporate trade data is skewed toward manufacturing industries. Out of the 297 industries, 6 of them are part of the “mining, quarrying, and oil and gas extraction” sector, and the remaining 291 are manufacturing (between 31–33 sectors at the NAICS 2-digit level).
The new levels of concentration were established using the formula below for a given industry ![]() in year
in year ![]() . The adjusted concentration level (
. The adjusted concentration level (![]() ) considers net imports (imports minus exports) in addition to the total sales for a specific industry.
) considers net imports (imports minus exports) in addition to the total sales for a specific industry.
![]()
A seemingly strange possibility using this method is that it can lead to an adjusted level of concentration of above 100 percent if exports are very high. In a particular industry, if the level of exports is significantly higher than the local U.S. market, it causes the denominator in the formula above to shrink. A C4 above 100 percent indicates that the combined sales of total U.S. production with net imports of the top four companies in a given industry exceed the U.S. consumer market for that industry.[33] This occurs when net imports are negative (i.e., exports exceed imports), so U.S. production of the top four companies in a given industry significantly competes internationally as well as in the domestic U.S. market. This is the case, for example, for the products under the “all other petroleum and coal products manufacturing” category (NAICS code 324199) for 2022.
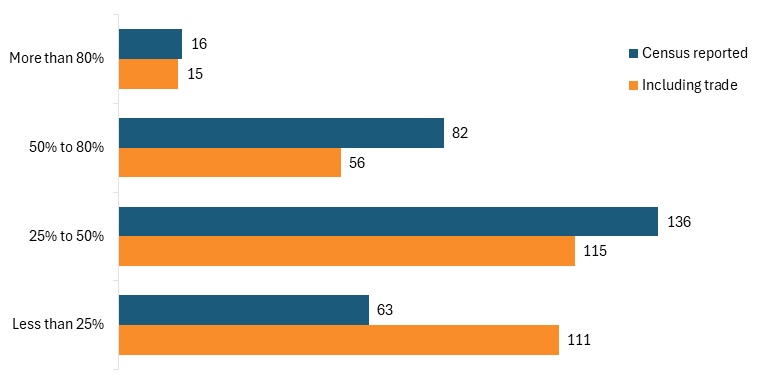
Concentration in 2022 Was Lower When Imports and Exports Are Incorporated
The concentration of the top four companies in an industry is, on average, lower when imports and exports are considered in the calculation. Figure 10 shows the 297 industries used to compare the C4 concentration of U.S. production with ITC’s trade data for 2022. On average, C4 considering trade is 6 percentage points lower, averaging 36.6 percent, than without considering trade (42.6 percent). While 16 industries showed a level of C4 of 80 percent considering only U.S. production (i.e., the Economic Census data), the number decreases to 15 when trade data is incorporated. In contrast, while 63 of these industries showed a C4 lower than 25 percent based on U.S. production, this increases to 111 industries when net imports are taken into account.
Figure 10. Ranges of C4 concentration in 2022 NAICS codes, considering imports and exports
Concentration Decreases Over Time When Imports and Exports Are Incorporated
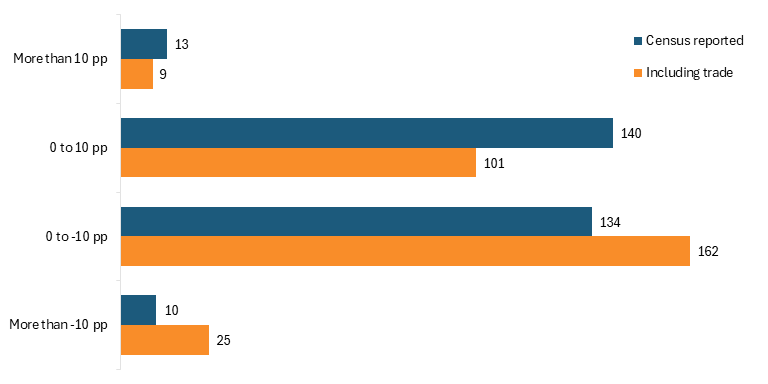
The market concentration decreased between 2017 and 2022 when net imports are included. Based on the 297 industries used for the analysis, C4 in 2022 was 2 percentage points lower than in 2017 when trade data is considered. In contrast, without trade data, the C4 between 2017 and 2022 was 0.4 percentage points higher for these same 297 industries. Figure 11 shows this pattern also applies at the extreme levels of the distribution. Fewer industries saw an increase in their concentration by more than 10 percentage points from 2017 to 2022 when net imports are included—9 industries considering trade versus 13 when only U.S. production is analyzed. In contrast, the number of industries that experienced a decrease in their concentration by more than 10 percentage points from 2017 to 2022 more than doubles when net imports are taken into account.
Figure 11. Change in C4 concentration among six-digit NAICS industries, 2017–2022, considering trade
The Negative Correlation Between C4 Concentration Ratio and Changes in Percentage Point Is More Pronounced When Including Net Imports
When including trade data, the correlation coefficient between 2017 concentration and the percentage change from 2017 to 2022 becomes more negative, at -0.20. This provides even clearer proof that consumers are not facing monopolized markets with little recourse, as these industries must compete with imports. (See figure 12.)
Figure 12. Relationship between C4 ratio in 2017 and change through 2022, considering trade
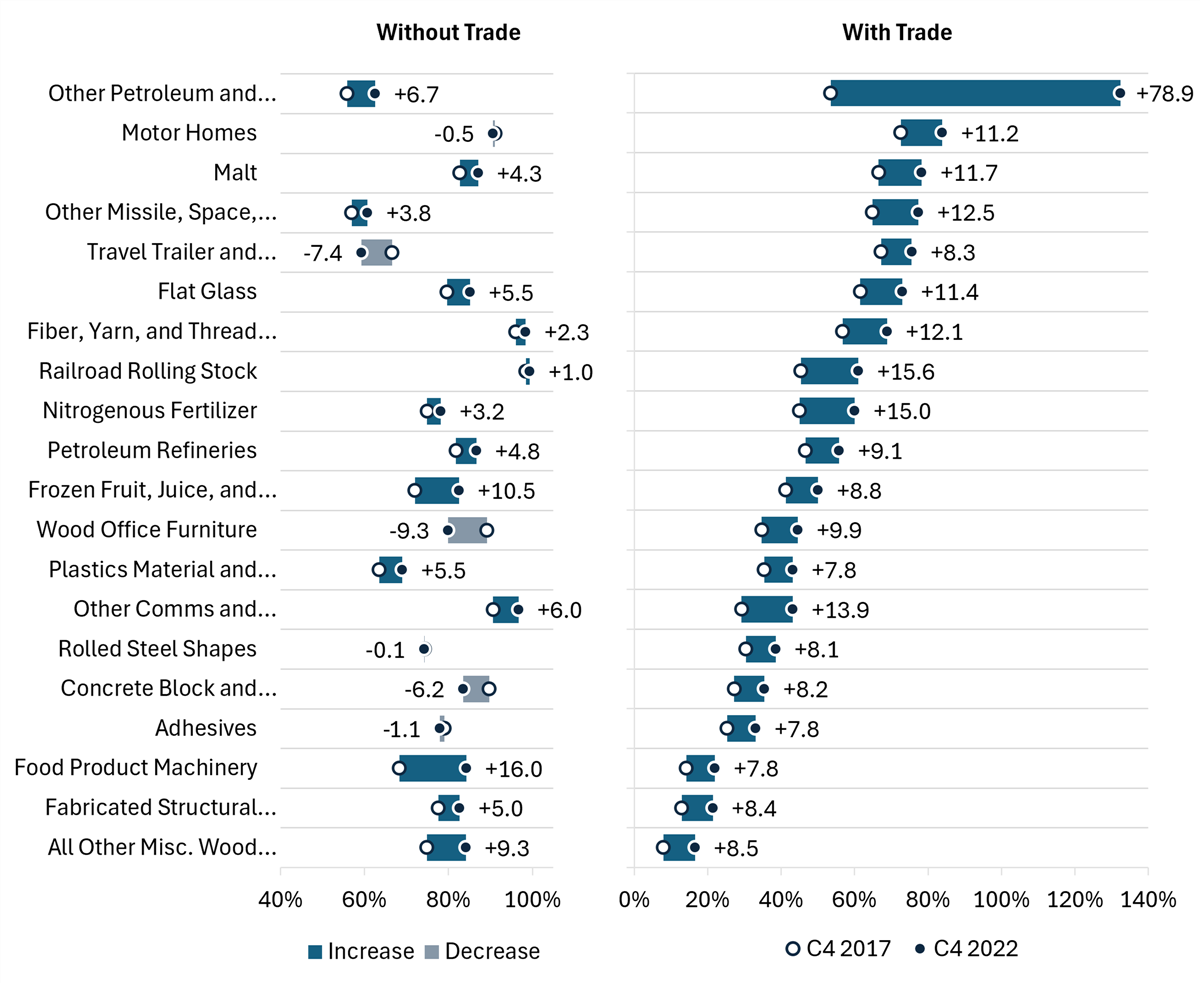
Highly Concentrated Industries When Net Imports Are Considered
When we incorporate trade data, most industries look less concentrated and had lower percentage point increases in concentration between 2017 and 2022. Yet, some look to have become more concentrated. As previously explained, this means exports have grown. Take “All other Petroleum and Coal Products” (324199) as a standout example, where the trade-adjusted C4 is over 100 percent. This would be unsurprising in an industry experiencing a significant ramp-up in exports, as might be expected for this U.S. industrial category between 2017 and 2022. The majority of the other most highly concentrated industries with trade taken into account (as seen in figure 13) exhibited some increase in concentration between 2017 and 2022, but significantly lower overall C4s with trade than without trade in both years.
Figure 13: Change in C4 among most highly concentrated industries, 2017–2022, factoring trade
How Should Antitrust Move Forward?
Given the panic about concentration and the subsequent studies, such as this one, that have continued to show insignificant trends in concentration in recent years, it begs the question, how much emphasis should enforcers put on aggregate concentration? Should we be jumping for joy when concentration is falling and wringing our hands when it is increasing?
Research on aggregate concentration over the most recent decade conforms to the idea that concentration waxes and wanes due to economic forces such as technological change and developments that make large scale a more efficient form of business organization. Furthermore, different industries can become concentrated for different reasons. Context matters. This suggests that enforcers should care less about aggregate concentration and worry more about anticompetitive conduct on a case-by-case basis.[34]
It is problematic to treat concentration as an exogenous variable that has a causal effect on market performance measures, such as profits and prices. While this was once a standard practice in industrial organization economics, the literature has recognized its pitfalls and has moved on from it.[35] Economist Harold Demsetz provided an early attempt to explain concentration itself, rather than taking it as exogenously given.[36] In his paper, he provided a theory and evidence that greater market share could be caused by greater productivity—by successfully competing. This is still an active research area, and some recent research seems to confirm the Demsetz hypothesis.[37]
Finally, as Chinese competition in what ITIF refers to as “national power industries” grows, U.S. firm size is becoming a more important defense.[38] The Chinese Communist Party sees firm size and concentration as critical weapons in its global national power industry war. Such large Chinese firms are more easily able to defeat foreign firms that are smaller. It’s time U.S. antitrust policymakers take this competitive reality into account.
Conclusion
Evaluating the Census data in terms of industrial concentration shows that aggregate concentration grew insignificantly between 2017 and 2022, and in many relevant aspects, fell. Given previous studies’ findings that concentration between 2002 and 2017 largely fell, these results point to little cause for concern about rising monopoly power throughout the U.S. economy. Aggregate concentration statistics are never a full substitute for detailed, industry-specific analysis such as that conducted by agencies during antitrust investigations. Small firms can run afoul of the antitrust laws just as large ones can. It is important to remember that big is not necessarily bad; bad is bad.
Acknowledgments
The authors would like to thank Robert D. Atkinson for substantial discussion and support for this report. Any remaining errors are the authors’ own.
About the Authors
Giorgio Castiglia is a policy analyst for the Schumpeter Project at ITIF. He is also a Ph.D. Student in the Department of Economics at George Mason University and has obtained his M.A. in economics from the same institution.
Rodrigo Balbontin is an associate director covering trade, IP, and digital technology governance at ITIF. He has extensive experience in policy design and research on science, technology, and innovation governance; digital economy and trade; and Internet governance. He earned his master’s degree in science and technology policy at the University of Sussex and a bachelor’s degree in economics at the University of Chile.
Trelysa Long is a policy analyst for ITIF. She was previously an economic policy intern with the U.S. Chamber of Commerce. She earned her bachelor’s degree in economics and political science from the University of California, Irvine.
About ITIF
The Information Technology and Innovation Foundation (ITIF) is an independent 501(c)(3) nonprofit, nonpartisan research and educational institute that has been recognized repeatedly as the world’s leading think tank for science and technology policy. Its mission is to formulate, evaluate, and promote policy solutions that accelerate innovation and boost productivity to spur growth, opportunity, and progress. For more information, visit itif.org/about.
Endnotes
[1]. It is important to note the difference between “market concentration” and “industrial concentration.” Market concentration is determined by industries that are defined by demand-substitution patterns, and industrial concentration is based on industries that are defined by an industrial classification system, such as NAICS, of which this report makes use. Market concentration would be the most economically salient measurement of concentration, but industrial classification is used as a matter of expedience and the availability of data.
[2]. As such, this report follows Robert D. Atkinson and Felipe Lage de Sousa, “No, Monopoly Has Not Grown” (ITIF, June 2021), https://itif.org/publications/2021/06/07/no-monopoly-has-not-grown/
[3]. Atkinson and de Sousa, “No, Monopoly Has Not Grown”; See also Robert Kulick and Andrew Card, “Industrial Concentration in the United States: 2002-2017,” NERA Economic Consulting and U.S. Chamber of Commerce, March 2022, https://www.nera.com/content/dam/nera/publications/2022/2022.03_CoC%20NERA%20Report_FINAL.pdf.
[4]. This report uses data from the 2022 Economic Census released by the Census Bureau. The total number of industries at the six-digit NAICS code level used in this report is 899. However, 10 of these industries were dropped from our data set because sufficient data was unavailable in either the 2017 or 2022 Economic Census. This small set of omissions is unlikely to affect the analysis significantly.
[5]. See Joseph V. Coniglio, “A Four-Year Failed Experiment: Khan Leaves the FTC” (ITIF Innovation Files, January 31, 2025), https://itif.org/publications/2025/01/31/four-year-failed-experiment-khan-leaves-ftc/. The “failed experiment” comment was made in conversation with reports at the signing of the administration’s Executive Order (EO) on Promoting Competition in the American Economy. Even though this EO was rescinded by the second Trump Administration, conservatives have continued to promote the idea that concentration is bad for competition; see for instance, Mark Meador “Antitrust Policy for the Conservative,” Federal Trade Commission, May 1, 2025, https://www.ftc.gov/system/files/ftc_gov/pdf/antitrust-policy-for-the-conservative-meador.pdf.
[6]. The White House, “Executive Order on Promoting Competition in the American Economy,” National Archives, last accessed October 27, 2025, https://bidenwhitehouse.archives.gov/briefing-room/presidential-actions/2021/07/09/executive-order-on-promoting-competition-in-the-american-economy/
[7]. Such studies included “Too Much of a Good Thing,” The Economist, March 2016, https://www.economist.com/briefing/2016/03/26/too-much-of-a-good-thing, Jason Furman, “Prepared Testimony to the Hearing on ‘Market Concentration,’” OECD, May 27, 2018, DAF/COMP/WD(2018)67, https://wwwoecd.org/daf/competition/market-concentration.htm; Sam Peltman, “Industrial Concentration Under the Rule of Reason” Journal of Law & Economics, 57 no. 53, (2014).
[8]. Gregory J. Werden and Luke M. Froeb, “Don’t Panic: A Guide to Claims of Increasing Concentration,” SSRN (2018), https://papers.ssrn.com/sol3/papers.cfm?abstract_id=3156912; See also Carl Shapiro, “Antitrust in a Time of Populism,” International Journal of Industrial Organization, 61: 714–748, (2018); Atkinson and de Sousa “No, Monopoly Has Not Grown” for many examples; See also Joe Kennedy, “Are Markets Becoming More Concentrated?” (ITIF, June, 2020), https://itif.org/publications/2020/06/29/monopoly-myths-are-markets-becoming-more-concentrated/.
[9]. The group of enforcers referred to here is known as “Neo-Brandeisians.” Neo-Brandeisians are a group of antitrust reformers that sought to overhaul competition under the Biden administration. They have also found a sympathetic audience in many prominent members of the Trump administration. Broadly, they view large corporate size as inherently suspect with respect to harm to competition and seek to ground antitrust enforcement in more political rather than economic considerations. See Tim Wu, The Curse of Bigness (Columbia Global Report, 2018); See also Lina Khan, “The New Brandeis Movement: America’s Antimonopoly Debate,” Journal of European Competition Law & Practice, 2018, https://awards.concurrences.com/IMG/pdf/12._khan_-_the_new_brandeis_movement.pdf.
[10]. See Wu, The Curse of Bigness. Wu has been an intellectual leader of Neo-Brandeisian antitrust thinking. In this book, he proposes merger enforcement as the most important reform area for the movement.
[11]. For instance, John Kwoka has argued for a structural presumption that would presume a merger’s illegitimacy if it were to increase concentration in the industry by a certain percentage or below a certain number of firms; see John Kwoka, “Closing the Merger Enforcement Gap” ProMarket (June 22, 2023), https://www.promarket.org/2023/06/22/closing-the-gap-in-merger-enforcement/.
[12]. Revocation of the Executive Order on Competition, https://www.whitehouse.gov/presidential-actions/2025/08/revocation-of-executive-order-on-competition/; The “America First Antitrust Policy,” as articulated by Gail Slater and Andrew Ferguson, has been much more concerned about specific industries rather than concentration writ large. For instance, while Biden and the Neo-Brandeisians referenced across-the-board concentration, the second Trump administration enforcers are more likely to reference concentration in the context of private corporate power or “censorship” of conservative voices. See Gail Slater, “The Conservative Roots of America First Antitrust Enforcement” (Address Given at Notre Dame Law School, April 28, 2025), https://www.justice.gov/opa/speech/assistant-attorney-general-gail-slater-delivers-first-antitrust-address-university-notre.
[13]. Meador, “Antitrust Policy for the Conservative.”
[14]. This language is from the Biden-Sanders Unity Taskforce language from 2021, quoted in Atkinson and de Sousa, “No, Monopoly Has Not Grown.”
[15]. Ibid.
[16]. Kulick and Card, “Industrial Concentration in the United States.” .
[17]. Carl Shapiro and Ali Yurukoglu “Trends in Competition in the United States: What Does the Evidence Show?” Journal of Political Economy: Microeconomics (Forthcoming), NBER Working Paper 32762 (August 2024), https://www.nber.org/papers/w32762.
[18]. The data was obtained from the U.S. Census Bureau website, last accessed June 30, 2025, https://data.census.gov/table/ECNSIZE2017.EC1700SIZECONCEN?codeset=naics~N0600.00&q=Concentration+Ratio.
[19]. See Werden and Froeb, “Don’t Panic: A Guide to Claims of Increasing Concentration.” The data is limited due to the nature of the undertaking, but shows a compelling picture nonetheless.
[20] . See Werden and Froeb, “Don’t Panic: A Guide to Claims of Increasing Concentration” for a detailed discussion of how industrial measures of concentration fall short of the analyses antitrust agencies conduct in delineating a relevant market for antitrust cases.
[21]. The HHI measure of concentration in an industry is preferable to the C4, but not available for a large portion of industries in the census data. The C4 shows the top four firms’ total share of sales but does not show the relative share of this proportion split between the firms. The HHI does this by weighting the proportion of shares control by each of these firms through summing their squared market shares. However, this detailed level of market shares for each individual firm is not provided for most NAICS industries.
[22]. These changes are reflected in a “concordance” chart provided by the census and is available at https://www.census.gov/naics/concordances/2022_to_2017_NAICS.xlsx.
[23]. For instance, the C4 ratio for 212111 in 2017 was 47.7 percent and the total revenue for the industry was over $11 million. The C4 for 212113 in that year was 65.5 percent, yet total revenue for this industry was less than $260,000. Therefore, the new code in 2022, 212114, was the sum of the C4 ratios divided by the sum of each total industry revenue, for a C4 ratio of 48.08 percent.
[24]. All these changes are detailed in the Census’s concordance table for 2022 data. See endnote 24.
[25]. Atkinson and de Sousa “No, Monopoly Has Not Grown” and Kulick and Card “Industrial Concentration in the United States: 2002-2017” both discuss concentrated 2017 industries in this context, including Taxi Services, that consolidated in the face of innovative disruption by ride-sharing platforms. Kulick and Card provide a detailed case study and discussion of the retail sector as well.
[26]. See Giorgio Castiglia, “Rethinking Antitrust: The Case for Dynamic Competition Policy” (ITIF, October 14, 2025), https://itif.org/publications/2025/10/14/rethinking-antitrust-the-case-for-dynamic-competition-policy/ for a discussion of how high market shares and profits can be a persistent feature of dynamically efficient, innovative markets.
[27]. “Remarks of Chair Lina M. Khan FTC Tech Summit,” Federal Trade Commission, January 25, 2024, https://www.ftc.gov/system/files/ftc_gov/pdf/2024.01.25-chair-khan-remarks-at-ot-tech-summit.pdf.
[28]. ITIF’s list of 135 advanced industries is derived in part from a broader list of 50 four-digit NAICS industries compiled by the Brookings Institution: Mark Muro et al., “America’s Advanced Industries: What They Are, Where They Are, and Why They Matter” (Brookings, 2015), https://www.brookings.edu/articles/americas-advanced-industries-what-they-are-where-they-are-and-why-they-matter/. ITIF first compiled a list of 209 six-digit NAICS industries that fall under Brookings’ list of four-digit NAICS industries. We then omitted miscellaneous manufacturing industries such as Clay Building Material and Refractories Manufacturing (NAICS code 327120) and Broom, Brush, and Mop Manufacturing (NAICS code 339994).
[29]. Ibid.
[30]. As Judge Mehta noted in his opinion on remedies in the Google Search Case, “Today, tens of millions of people use GenAI chatbots, like ChatGPT, Perplexity, and Claude, to gather information that they previously sought through internet search.” U.S. v. Google LLC (2020) Memorandum Opinion, https://ecf.dcd.uscourts.gov/cgi-bin/show_public_doc?2020cv3010-1436.
[31]. This distinction is important because industrial concentration data includes production of intermediate goods, which are sold to other producers rather than final consumers.
[32] U.S. International Trade Commission, “DataWeb,” https://dataweb.usitc.gov/trade/search/Import/NAIC.
[33]. A fake numerical example may make this more concrete. If the total output of the top four firms in the U.S. market is 50, total sales in the U.S. are 100, exports are 80, and imports are 20, this would result in the equation yielding an adjusted C4 with trade of 50/40, which is above 100 percent. The output of the top four firms plus exports (130) is greater than total U.S. output plus imports (120).
[34]. Shapiro and Yurukoglu, “Trends in Competition in the United States.”
[35]. See Steven Berry, Martin Gaynor, and Fiona Scott-Morton, “Do Increasing Markups Matter? Lessons from Empirical Industrial Organization” Journal of Economic Perspectives 33, no. 3 (2019), https://www.aeaweb.org/articles?id=10.1257/jep.33.3.44.
[36]. Harold Demsetz, “Industry Structure, Market Rivalry, and Public Policy,” Journal of Law & Economics 16 no. 1 (1973), https://www.jstor.org/stable/724822.
[37]. Sam Peltzman, “Productivity, Prices, and Concentration in Manufacturing: A Demsetzian Perspective” Journal of Law & Economics 65, no. S1 (February 2022), https://www.journals.uchicago.edu/doi/abs/10.1086/718855.
[38]. Robert D. Atkinson, “Marshaling National Power Industries to Preserve America’s Strength and Thwart China’s Bid for Global Dominance” (ITIF November 17, 2025), https://itif.org/publications/2025/11/17/marshaling-national-power-industries-to-preserve-us-strength-and-thwart-china/.
Editors’ Recommendations
June 7, 2021
