

US National Power Industries Are at Risk

Instead of treating manufacturing as a monolith to be revived, policymakers must focus on national power industries. These industries protect U.S. national defense and economic security, and are eroding at an alarming rate.
KEY TAKEAWAYS
Key Takeaways
Contents
Implications for U.S. Power 17
Appendix 1: Full Methodology 18
Appendix 2: Changes in Value Added. 19
Introduction
In recent years, there has been increasing concern about the health of U.S. manufacturing, with the voices that long argued that manufacturing doesn’t matter finally becoming a minority.
But why does manufacturing matter? The answer to that question shapes the kind of manufacturing policy a nation has. The conventional view is that manufacturing matters because it provides good jobs, especially for non-college-educated workers; drives economic growth through higher productivity and a higher employment multiplier; supports innovation; and reduces the trade deficit. These are mostly not strong arguments.
Manufacturing jobs now pay, on average, slightly less than jobs in the overall economy do.[1] And manufacturing labor productivity has grown more slowly than overall economy productivity for over a decade.[2] With regard to the employment multiplier, this is largely irrelevant given that the U.S. economy is at or near full employment, except in economic downturns, and even then the Federal Reserve responds with monetary policy. As for innovation, there is no reason foreign manufacturers can’t drive global innovation. However, a strong manufacturing sector does help reduce the U.S. trade deficit, but services and natural resources exports also play a big role in reducing the deficit.
National power industries drive growth and both national and economic security, and must be the focus of strategic industry trade policy.
The principal reason for concern with manufacturing should be national power. Certain industries enable a strong military or give the United States leverage over other nations, especially China. At the same time, Chinese dominance in other industries would give it enormous leverage over the United States. We see this already with rare earth minerals. We call these “national power industries.”
Traditional measures of manufacturing health treat the sector as a monolith, but some industries are far more critical to U.S. power than others are. The United States is at risk of losing its national power industries, which are essential to the country’s economic and national security. If these industries were to be lost, it will be difficult, if not impossible, to regain them.
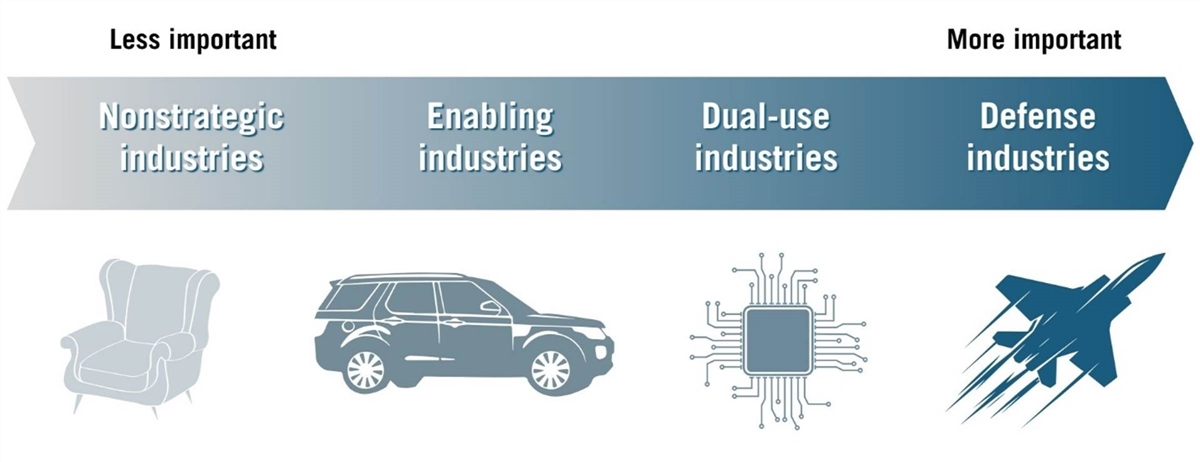
In a novel framework, the Information Technology and Innovation Foundation (ITIF) has classified all 970 industries delineated by the North American Industry Classification System (NAICS) at the six-digit level on a continuum of defense, dual-use, enabling, and nonstrategic. The first three are power industries.
Most industries are not power industries because most firms primarily serve domestic demand and are not exposed to international competition or predation. Consider the neighborhood pizza shop or local bank. If these companies go out of business, some jobs and money will be lost, but American power will be unaffected. Other “local serving” businesses will emerge, or existing ones will gain market share.
Some traded industries are nonstrategic, meaning their loss would not weaken U.S. power or provide leverage to China. Case in point: wind turbines. If the Chinese dominated all wind turbine production and wanted to cut off exports to the United States to force U.S. government policy change, the impact would be minimal. Utilities would simply utilize alternative energy-generation technologies, and if even temporary shortages occurred, America would just pay a bit more for energy and conserve energy for a few years.
The principal reason for concern with manufacturing should be national power.
Compare that to a dual-use industry such as semiconductors. If China dominated this industry—which it is seeking to do—the simple threat of cutting off access to semiconductors would lead policymakers to scramble to avoid that outcome. And of course, if the worst were to happen and the United States and China engaged in a kinetic war, China’s ability to produce vastly more weapons than the United States could, combined with the fact that Chinese suppliers still play a key role in U.S. weapons systems supply chains, would introduce dangerous vulnerabilities and weaknesses.
In a utopian globalist world where no country uses trade for power and all are responsible stakeholders, countries can afford to be agnostic to their industrial composition. But in the real world, where the People’s Republic of China seeks to become the global hegemon and the dominant producer of most, if not all, strategic industries, that long-dominant and comforting framework is as realistic as the Washington Naval Treaty of 1922, which attempted to prevent an arms race by limiting naval construction but was later renounced by key signatories.
As such, it is time for a U.S. and allied national industry power strategy. A companion ITIF report lays out the need for and framework of such a strategy.[3]
This report analyses the performance of U.S. national power industries between 2007 and 2022. It finds that U.S. dual-use and enabling manufacturing industries declined faster than non-power industries, with greater losses in employment, establishments, capital expenditures, and value added than in nonstrategic and defense sectors. We would expect defense industries to perform reasonably well because they face limited global competition, and the U.S. government is their principal end-use customer. But the finding that dual-use and enabling industries declined more than nonpower manufacturing industries have is troubling.
Should this continue, the United States will find itself in a position of even greater vulnerability to China, in which institutional knowledge is lost and economic independence is at risk, and the country is able to hold America hostage.
Methodology
The concept of categorizing industries isn’t new, having been undertaken by both public and private institutions to rank industry importance and influence policy decisions. The Brookings Institution, Bureau of Labor Statistics (BLS), and the Organization for Economic Cooperation and Development (OECD) have each developed their own methodology for classifying advanced or high-tech industries, using criteria such as research and development (R&D) intensity, knowledge of STEM (science, technology, engineering, and mathematics), and capital intensity.[4] These industries are identified in relation to their capacity to generate innovation and growth. The Cybersecurity and Infrastructure Security Agency has taken a different approach, classifying critical infrastructure sectors essential for national security, the economy, and public health. Many of these sectors are defense oriented, including nuclear materials and the defense industrial base.[5]
While these approaches shed light on innovation and infrastructure, none explicitly assess industries through the lens of national power. Our methodology does that, considering an industry’s relevance to both U.S. national security and power. We use both quantitative and qualitative means to classify 970 six-digit NAICS codes into one of four classifications based on this grouping: nonstrategic, enabling, dual-use, and defense. (See appendix 1 for the full methodology.)
Figure 1: ITIF’s industrial power scale
 In our analysis, power industries account for 22.3 percent of the 970 industries. (See figure 2.) Most industries are not power industries, in large part because a number are nontraded sectors such as law firms and barber shops. Of the 22.3 percent that are power industries, just 0.5 percent are defense industries, and 13.4 percent are dual-use. The remaining 8.4 percent are enabling industries. In terms of employment, in 2022 for example, just 9.5 percent of workers were employed in power industries. Of this, 6.4 percent worked in dual-use industries and 2.9 percent in enabling industries, and just 0.2 percent were employed in defense industries.
To be clear, at one level, every industry could be considered strategic. For example, we classify the perfume industry (NAICS 325620) as nonstrategic. But firms in this industry employ chemists, and they may contribute innovations that spill over to more traditional chemical industries. Likewise, the tortilla industry (NAICS 311830 and nonstrategic) employs machine operators who, in case of war time, could work in defense factories.
But arguing that everything is strategic means that nothing is strategic. Not only does the U.S. government lack the resources to establish independence in all industries, but attempting to do so would take resources away from truly strategic industries. As such, we believe that such a typology provides a valuable framework for guiding strategic planning and resource allocation.
Figure 2: Six-digit NAICS industries by national power type
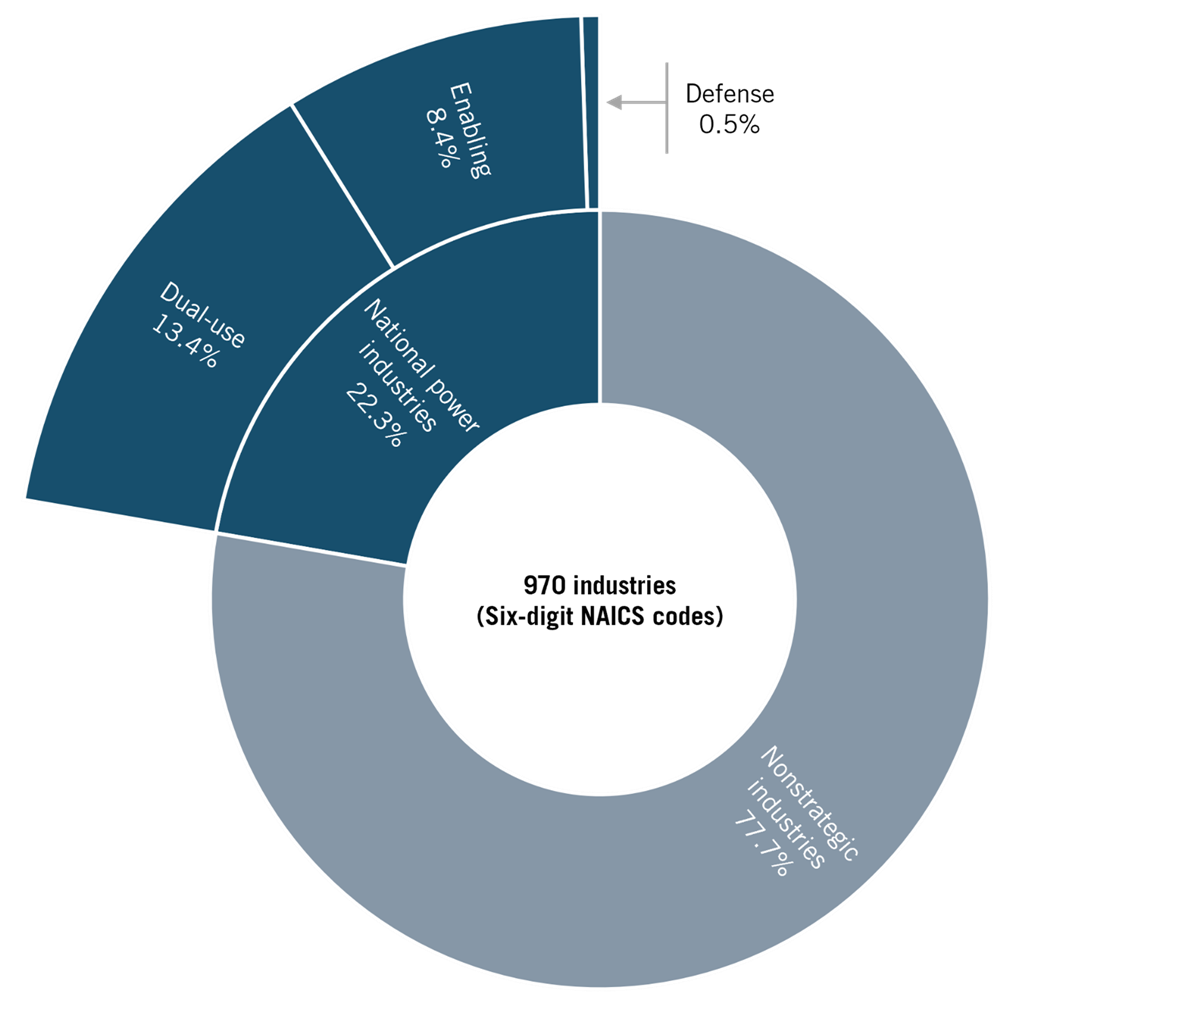
Nonstrategic industries, including nontraded sectors such as professional services and retail, as well as traded industries such as furniture, food, soda, paper, clothing, office equipment, and board game production, are largely irrelevant to national and economic security. These industries may have other values, such as enabling innovation or driving domestic productivity, but their health is not critical to national power. Seventy-eight percent of industries (including manufacturing and nonmanufacturing) fall into this first classification. The other three categories are national power industries.
Enabling industries produce goods in the industrial commons that, while not central to power, do strengthen the ecosystem for the production of dual-use and defense goods, and are necessary for economic well-being.[6] Many of these industries produce largely final consumer goods; therefore, losing these industries would not have an immediate effect on American security—the U.S. economy would perform fine, at least in the near and moderate term, if, for example, no new cars were available.
However, the loss of these industries would erode U.S. production and innovation in dual-use and defense industries, as the technological advances made in industries such as motor vehicles and appliances have downstream effects on the supply chains of dual-use and defense equipment. These industries contribute to the industrial commons that dual-use and defense industries live in, which include science and engineering knowledge, university and technical training programs, professional associations, standards bodies, research institutes, and more. These industries also often share suppliers with defense and dual-use industries.
The automotive sector is a perfect example. It employs 47,000 engineers and invests over $26 billion in R&D annually.[7] The industry plays a key role in metalworking, mechanical engineering, and machinery manufacturing ecosystems, participating in training and higher education programs and industrial standards groups. And it sources parts from over 5,600 specialized domestic suppliers, which provide essential components and capabilities, such as precision machining and casting, that are crucial for many dual-use and defense industries.[8]
U.S. dual-use and enabling industries are declining faster than non-power industries are, with greater losses in employment, capital expenditures, and value added than nonstrategic and defense sectors.
Dual-use industries produce goods with civilian as well as defense applications, including the production of chemicals, semiconductors, displays, aircraft, sensors, and telecommunications equipment. Many of the products produced by these industries are intermediate goods, meaning a shortage or loss of domestic production would have negative impacts on other sectors, including defense. Consider China invading Taiwan, which would cut the United States off from its largest semiconductor supplier. Without access to Taiwanese chips, all data center, machinery, and automobile construction would come to a halt. The loss of domestic production in these industries would give China even more leverage over the United States, where it could use export controls as a powerful weapon to compel behavior change and force U.S. subservience to the Chinese Communist Party. And of course, weakness in dual-use goods would be catastrophic if the United States and China were to engage in military conflict. Moreover, the production of these goods also involves substantial investment in R&D and tacit knowledge by workers. Meaning that once these industries are lost, it would prove difficult to resurrect them.
Defense industries produce goods predominantly for defense applications, such as shipbuilding and the production of missiles, large ammunition, military vehicles, and fighter jets. For obvious reasons, domestic production and innovation in these industries are essential to national security.
Using this classification, we used data from the Census Bureau’s Annual Survey of Manufacturers (ASM) and Economic Census to identify trends in manufacturing activity over 16 years.[9] Although U.S. manufacturing began its steepest decline after China’s accession to the World Trade Organization (WTO) in 2001, government data limitations restrict the time period that can be assessed.[10] To ensure data consistency across all variables, our assessment spans the period from 2007 to 2022, the latest year of available data.
It is important to note that data obtained from the Census Bureau differs slightly from data from other government institutions. Research by Andrew Reamer highlights the differences between Census Bureau data and data from the Bureau of Economic Analysis (BEA) and BLS in their reporting of wages and employment. Differences in information access, specifically the Census Bureau’s ability to access federal tax information that is limited or inaccessible to the BEA and BLS limit the agencies’ ability to synchronize data, reducing consistency and quality.[11] In an effort to maintain consistency, all variables were sourced from the Census Bureau.
This analysis relies on nominal figures for all dollar amounts, including value added, as real or inflation-adjusted data was not available at the industry level and for the time series assessed. This is a significant drawback, as productivity growth rates, and hence nominal price and employment changes, can differ between industries that experience the same real value-added growth. But in the absence of inflation-adjusted value-added measures, this data provides the best available indicators. Also, it’s not clear that productivity growth should be significantly different between the four industry groups. The fact that the averages for the industries are similar across all variables, including energy use, which is less likely to be affected by differential industry productivity, suggests that the findings are reasonably strong.
Empirical Analysis
Evaluating the health of U.S. manufacturing requires an analysis of the key inputs and outputs of the industries, namely sales, capital, labor, energy, and value added.
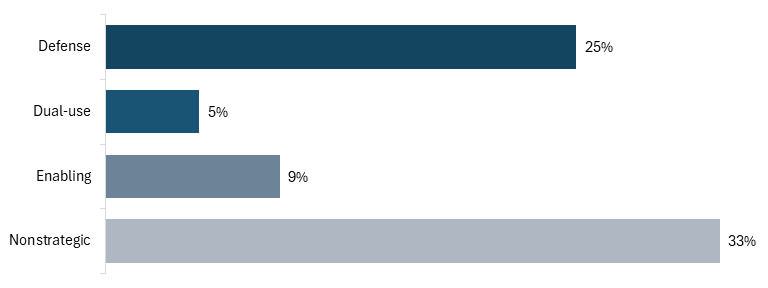
The value of shipments in manufacturing industries is a proxy for sales, as it measures the net selling value of all products a firm ships.[12] Sales in nonstrategic and defense industries surged compared with enabling and dual-use industries, with growth ranging from 25 percent to 35 percent. In contrast, enabling and dual-use classifications experienced sales increases of less than 10 percent during those 16 years. However, as these values are in nominal dollars, when considering that inflation increased by 40 percent over this period, sales in all industries fell relative to overall price changes.[13]
Figure 3: Change in value of manufacturing shipments (2007–2022)
Real value added is the best indicator of the performance of the manufacturing sector, which is measured by the output of an industry minus its inputs. But as noted, only nominal figures are available. Nominal value added grew across sectors, yet growth was weakest among the core manufacturing base of enabling and dual-use industries (see figure 4). Nonstrategic industries saw the highest increase in value added, and defense industries also saw substantial growth. As shown in figure 6, the fact that enabling and dual-use industries experienced less or even negative growth in capital equipment suggests that their nominal value-added growth was not due to superior productivity and resultant price declines. Appendix 2 lists the industries that experienced the largest growth and greatest decline in value added in each classification.
Figure 4: Change in U.S. manufacturing value-added (2007–2022)[14]
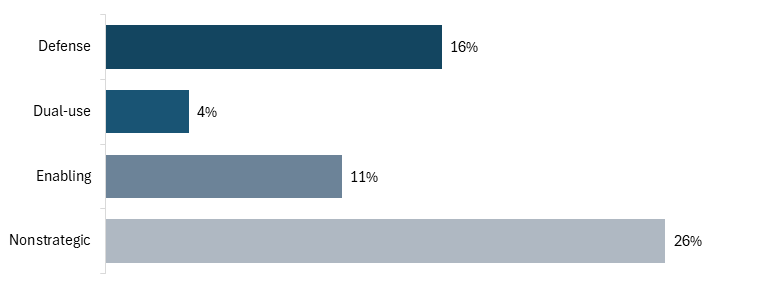
Change in value added was weakest among enabling and dual-use industries.
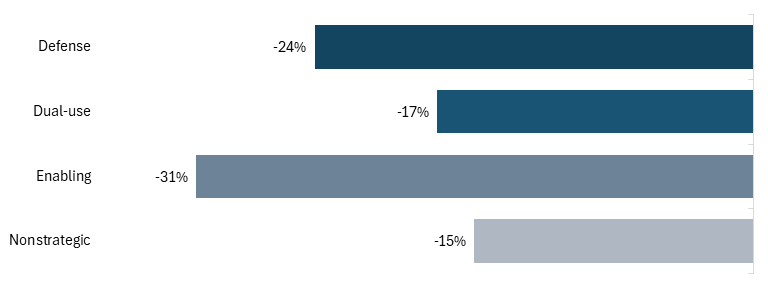
When controlling for producer price index (PPI), which shows the change in price levels for producers over a given period, it’s evident that value added actually declined across all classifications, though worst of all in enabling industries, at approximately 31 percent.[15] A decline in value added has repercussions across the rest of a firm’s operations, including capital investment, and employment. Figure 5 depicts change in value added relative to PPI.
Figure 5: Change in U.S. manufacturing value added, PPI adjusted (2007–2022)
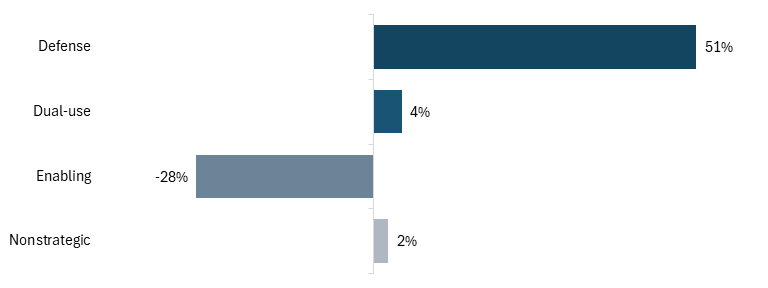
One of the most critical drivers of productivity and competitiveness is better tools, or capital investment.[16] Capital expenditures include the purchase of a range of tools for business operations, including desks for offices, the construction of new buildings, and the purchase of new machinery and software. In power industries, changes in capital expenditures range widely, with a decline in enabling industries, while defense industries experienced an increase of over 50 percent (figure 6). Dual-use and nonstrategic industries saw minimal change. These differences may be the result of a changing number of firms in the various categories (fewer firms means less capital investment, all else equal) or existing firms simply cutting back on investment due to a weaker financial position or decline in sales.
Figure 6: Change in U.S. manufacturing capital expenditures (2007–2022)
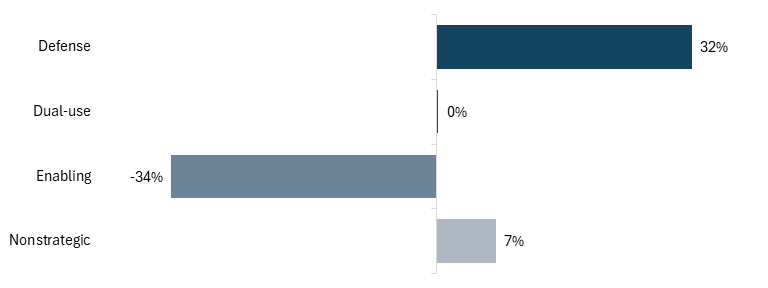
While capital expenditures broadly are an important indicator of performance, the type of capital purchased can have a significant impact on business operations and productivity. Productivity-enhancing equipment, such as machinery and equipment, has a more impactful effect on productivity and growth because, while a new machine in a factory will have a tangible impact on the number of motor vehicles a factory can produce, the construction of a new building or the purchase of a new office chair will not have that same productivity-enhancing effect. Figure 7 shows how investment in machinery and equipment changed between 2007 and 2022. Investment declined in enabling industries, while it rose slightly in nonstrategic and significantly in defense industries.
There is a very strong and positive correlation between capital investment generally and investment in machinery and equipment (correlation coefficient of 0.96), suggesting that there have been no broad initiatives to invest greater output into machinery and equipment over other forms of capital. Investment in machinery and equipment also has a slightly stronger correlation to value added than broad capital investment, with a coefficient of 0.32.
Figure 7: Change in U.S. manufacturing expenditures machinery and equipment (2007–2022)
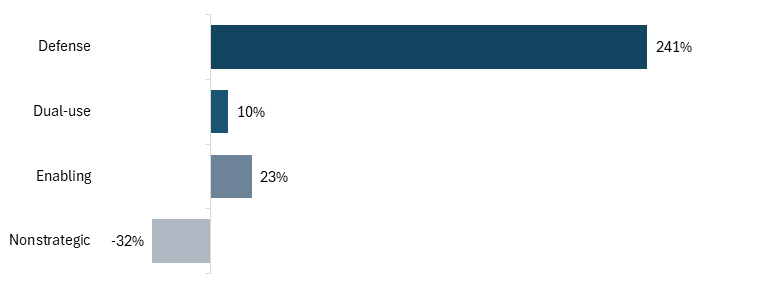
Like machinery and equipment, data processing equipment and computers have a positive effect on productivity. Enabling and dual-use industries experienced relatively little growth in their expenditures on this equipment, especially considering the growing necessity for technological equipment in modern-day industry. Defense industries, on the other hand, exhibited a rapid boom in these types of capital expenditures, increasing by 241 percent.
Investment in computers and data processing equipment is also highly correlated to overall capital investment, with a correlation coefficient of 0.82. In many ways, the defense spending figures indicate what U.S. manufacturing performance in the other three sectors would look like in the absence of stiff international competition.
Figure 8: Change in U.S. manufacturing expenditures on computers and data processing equipment (2007–2022)
Following the trends seen in capital expenditures, electricity purchases in enabling and dual-use industries trail those of the defense sector, demonstrating a shrinking capacity to produce goods in these strategic sectors. In enabling and dual-use firms, a reduction in electricity purchases or consumption is likely related to a shutdown of factories and a decrease in output as firms move abroad to nations with lower costs or lose market share to imports. On the other hand, defense industries have seen a relatively significant increase in electricity production, a clear bifurcation in our manufacturing base. Defense industries face little to no international competition—the Pentagon will always purchase missiles and fighter jets from American manufacturers—and this insulation shields defense sectors from the cost pressures that have driven offshoring elsewhere, reinforcing their domestic concentration.
Figure 9: Change in U.S. manufacturing electricity purchases (2007–2022)
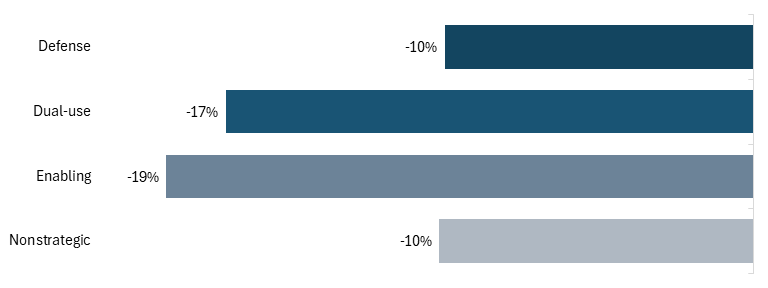
Employment in manufacturing industries experienced a broad decline in all industries, with the steepest decreases occurring in enabling and dual-use sectors (19 percent and 17 percent, respectively). The trends in these two industries follow those in capital investment, energy purchasing, and value added, reinforcing the conclusion that dual-use and enabling industries performed the weakest of the four groups.
Figure 10: Change in U.S. manufacturing employment (2007–2022)
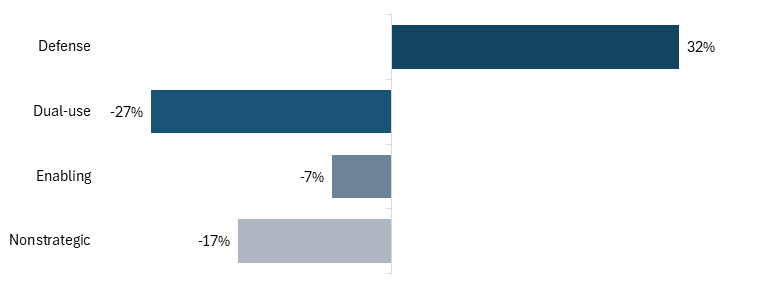
Considering overall employment in the United States rose by 11 percent between 2007 and 2022, this decline in the manufacturing workforce is even more troubling. Looking at manufacturing employment as a share of economy-wide employment across the four classifications, figure 11 shows that relative employment fell even more across all manufacturing classifications. Enabling and dual-use industries experienced the greatest decline, at 26 percent and 25 percent, respectively.
Figure 11: Change in U.S. manufacturing employment relative to the overall economy[17]
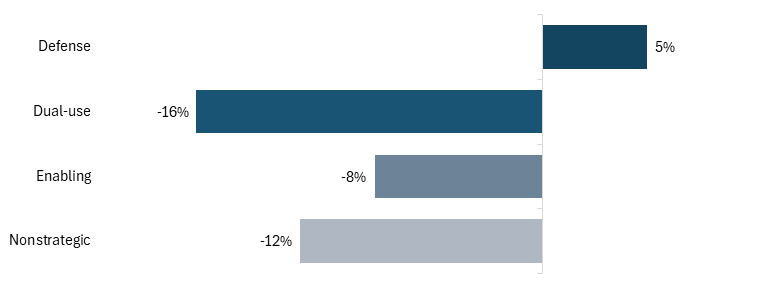
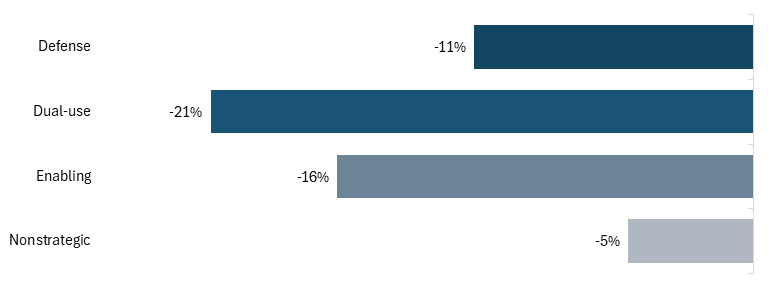
Taking a deeper look into the fall in employment, production manufacturing workers fell the most in dual-use industries, a 16 percent decline (figure 12). And again, defense industries performed the best, experiencing a growth in production workers by 5 percent.
Figure 12: Change in U.S. manufacturing production workers (2007–2021)[18]
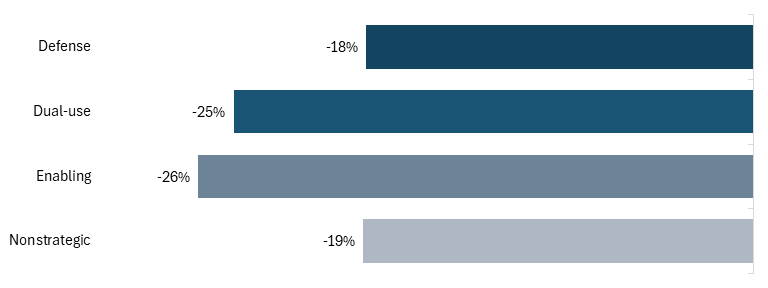
Change in nonproduction workers was consistent with overall trends, with enabling and dual-use seeing the steepest declines. Non-production workers include managerial and R&D positions, among others.
Figure 13: Change in U.S. manufacturing non-production workers (2007–2022)
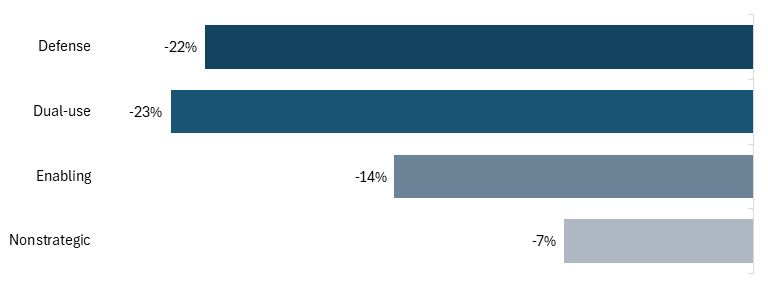
A reduction in the manufacturing workforce has corresponded to a decrease in the number of establishments, or physical locations of a firm. A firm can have multiple establishments, so a decline in establishments does not necessarily mean that the number of firms in an industry has fallen, just that the number of factories or office buildings has been reduced.
Dual-use and defense industries saw the most significant reduction in the number of establishments, with each falling by over 20 percent between 2007 and 2022. Enabling industries experienced a relatively moderate decline of 14 percent.
Figure 14: Change in U.S. manufacturing establishments (2007–2022)
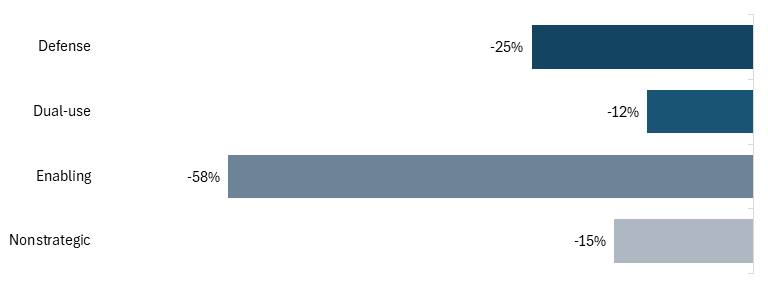
As employment has declined in manufacturing, so has the number of employees per establishment. Enabling industries experienced the greatest decline, with the number of employees in each enabling industry establishment falling by more than half. Dual-use industries saw the smallest decline of 12 percent. The larger decline in sales of dual-use industries likely reflects the greater loss of number of establishments.
Figure 15: Change in average employment per U.S. manufacturing establishment (2007–2022)
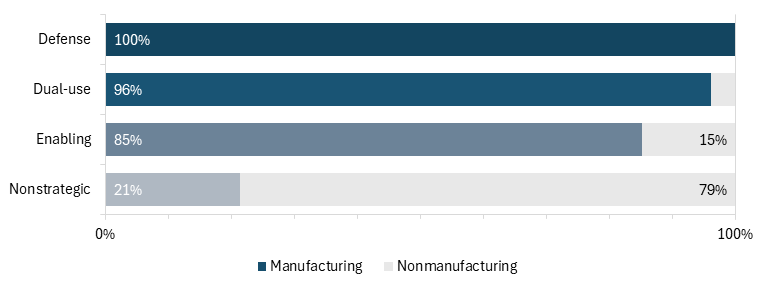
While most national power industries are in manufacturing, some are not. For example, biotechnology research (NAICS code 541714) is a dual-use industry, as its discoveries can be used to develop medicines or create and defend against biological weapons. Similarly, the satellite telecommunications industry (NAICS code 517410) is an enabling industry, as it deploys critical service for civilian and military usage and requires significant investment in R&D. But if the United States lost this industry, the country could function temporarily on the existing satellite and ground infrastructure. All defense industries in this analysis are manufacturing industries. See figure 16 for the share of each classification engaged in manufacturing versus nonmanufacturing activities.
Figure 16: Share of U.S. industries in manufacturing vs. nonmanufacturing
Expanding the analysis of employment beyond strictly manufacturing industries reveals a different set of trends. While employment in manufacturing power industries fell significantly, and much more than in nonstrategic industries (figure 10), the opposite is true for nonmanufacturing and services industries. Dual-use industries outside of manufacturing almost doubled in workforce size over between 2007 and 2022, driven largely by the rise in software publishers, which increased by 167 percent, while enabling industries grew by 60 percent.
Figure 17: Change in employment of nonmanufacturing industries (2007–2022)

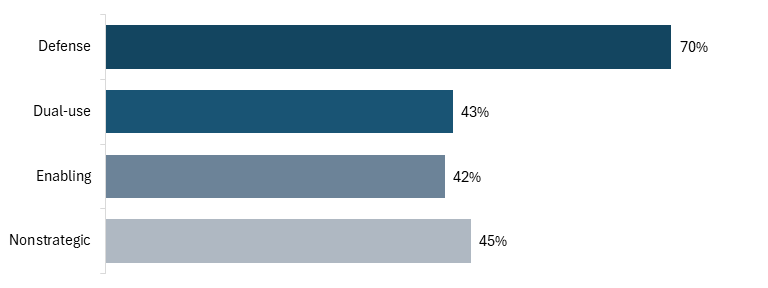
Despite varying trends in every other indicator, median nominal wages increased at roughly similar rates across the nonstrategic, enabling, and dual-use industries, with growth ranging from 42 to 45 percent. Defense industries, however, saw significant growth over this timeframe, with the median wage increasing by 70 percent. Median wages in nonstrategic industries were the lowest, at about $58,000, while wages in defense industries were highest at $97,500.
Figure 18: Change in manufacturing median wages (2007–2022)
Implications for U.S. Power
This data suggests that of the four industry groups, dual-use and enabling industries declined even more than nonstrategic and defense.
The hollowing out of the industrial commons of the United States is evident, and its consequences are severe. Enabling industries have experienced the steepest decline in capital expenditures and employment, and the loss of dual-use industries, as evidenced by the significant decrease in employment, energy purchases, sales, and almost stagnant value added, should serve as a warning for the United States. The sectors most critical to U.S. national security, those that support domestic supply chains and national power, are losing ground to international competitors.
Unchecked Chinese dominance in advanced industries will translate into sustained cost advantages; persistent price, profit, and employment losses for American advanced manufacturers; and vulnerabilities that will leave the United States subject to Chinese market manipulations.
China has demonstrated its ability and willingness to disrupt American supply chains. In 2025, China has implemented and continues to expand restrictions on the sale and export of rare earths to the United States, creating a chokepoint in the U.S. supply chains most critical for dual-use and defense industries. China processes more than 90 percent of global rare earths and extracts over 60 percent, giving it a practical monopoly and unimpeachable power over the industry.[19] Without access to China’s supply of these minerals, U.S. firms in downstream industries face shortages, delays, and reduced competitiveness against Chinese firms with ample access to these resources. This pattern extends to batteries, basic metals, and advanced electronics—products in which China is consolidating global market share.[20] Unchecked Chinese dominance in advanced industries will translate into sustained cost advantages for its firms; persistent price, profit, and employment losses for American advanced manufacturers; and vulnerabilities that will leave the United States subject to Chinese market manipulations.
Conclusion
Current debates on the manufacturing industry focus on the state of manufacturing as a whole, encompassing everything from textiles to tortilla production, but these industries are not the point. While defense industries grew and strengthened between 2007 and 2022, the core of U.S. manufacturing—enabling and dual-use industries—eroded, weakening national power and leaving the country vulnerable to national and economic security concerns as China continues to consolidates its control over these same sectors. Allowing these industries to fail is not an option; doing so would weaken supply chain security, reduce innovation and R&D investment, and increase U.S. dependence on China. America’s continued success and security will rely on defending and supporting these industries through targeted policies and a strategic and comprehensive industrial plan. If the United States fails to do this, it will lose not only factories, but also the foundation of its innovative and military strength.
Appendix 1: Full Methodology
The methodology for categorizing industries as defense, dual-use, industrial commons, or nonstrategic is the following. Some industries are reclassified based on judgment:
1. If an industry’s Defense Department contracts as a share of total receipts for fiscal year 2022 were above 50 percent, then the industry is automatically classified as a defense industry.[21]
2. Of the remaining industries, if the industry produces one of the Commerce Control List (CCL) products and the product is also traded, then the industry is a dual-use industry.[22]
3. Of the remaining industries, if the industry produces one of the CCL products but the product is not traded, then the industry is an enabling industry.
4. Of the remaining industries, if the industry does not produce a product on the CCL but produces intermediate or capital goods, then the industry is also an enabling industry.[23]
5. The remaining industries are classified as nonstrategic industries.
Table 1: National power industry categorizations based on ITIF’s methodology
Appendix 2: Changes in Value Added
Table 2: Change in value added among national power industries, 2007–2022
Acknowledgments
This report is part of a series that has been made possible in part by generous support from the Smith Richardson Foundation. (For more, see: itif.org/power-industries.) The author would like to thank Trelysa Long and Robert Atkinson for their assistance with this report. Any errors or omissions are the author’s responsibility alone.
About the Author
Meghan Ostertag is a research assistant for economic policy at ITIF. She previously interned with the Federal Deposit Insurance Corporation. She holds a bachelor’s degree in economics from American University.
About ITIF
The Information Technology and Innovation Foundation (ITIF) is an independent 501(c)(3) nonprofit, nonpartisan research and educational institute that has been recognized repeatedly as the world’s leading think tank for science and technology policy. Its mission is to formulate, evaluate, and promote policy solutions that accelerate innovation and boost productivity to spur growth, opportunity, and progress. For more information, visit itif.org/about.
Endnotes
[1]. Federal Reserve Bank of St. Louis, Average Hourly Earnings of All Employees, Manufacturing, accessed October 16, 2025, https://fred.stlouisfed.org/series/CES3000000003#; Federal Reserve Bank of St. Louis, Average Hourly Earnings of All Employees, Total Private, accessed October 16, 2025, https://fred.stlouisfed.org/series/CES0500000003.
[2]. Meghan Ostertag, “The Census Bureau Confirms US Manufacturing Has Declined” (ITIF, August 9, 2024), https://itif.org/publications/2024/08/09/census-bureau-confirms-us-manufacturing-declined/.
[3]. Robert D. Atkinson, “Marshaling National Power Industries to Preserve America’s Strength and Thwart China’s Bid for Global Dominance” (ITIF, November 2025), http://itif.org.
[4]. Mark Muro and Siddharth Kulkarni, “America’s Advanced Industries: New Trends” (Brookings, August 4, 2016), https://www.brookings.edu/articles/americas-advanced-industries-new-trends/; Michael Wolf and Dalton Terrell, “The High-Tech Industry, What Is It and Why It Matters To Our Economic Future” (BLS, May 2016), https://www.bls.gov/advisory/bloc/high-tech-industries.pdf; Thomas Hatzichronoglou, “Revision of the High-Technology Sector and Product Classification” (OECD Science, Technology and Industry Working Papers, 1997/02), https://www.oecd.org/en/publications/1997/01/revision-of-the-high-technology-sector-and-product-classification_g17a152c.html.
[5]. “Critical Infrastructure Sectors,” CISA, accessed October 15, 2025, https://www.cisa.gov/topics/critical-infrastructure-security-and-resilience/critical-infrastructure-sectors.
[6]. Gary P. Pisano and Willy C. Shih, “Restoring American Competitiveness,” Harvard Business Review, July-August 2009, https://hbr.org/2009/07/restoring-american-competitiveness.
[7]. Bureau of Labor Statistics (BLS), Occupational Employment and Wage Statistics Query System, accessed October 20, 2025, https://data.bls.gov/oes/#/occInd/One%20occupation%20for%20multiple%20industries; National Center for Science and Engineering Statistics (NCSES), Research and Development: U.S. Trends and International Comparisons, accessed October 20, 2025, https://ncses.nsf.gov/pubs/nsb20246/u-s-business-r-d.
[8]. American Automotive Policy Council, “State of the U.S. Automotive Industry” (AAPC, October 2017), https://www.americanautomakers.org/sites/default/files/2017%20Economic%20Contribution%20Report.pdf.
[9]. U.S. Census Bureau, 2008 Annual Survey of Manufacturers: Tables, accessed August 22, 2025, https://www.census.gov/programs-surveys/asm/data/tables.html; U.S. Census Bureau, Economic Census by Industry 2022, accessed September 24, 2025, https://www.census.gov/programs-surveys/economic-census/data/tables/industry.html.
[10]. Robert D. Atkinson and Stephen Ezell, “Toward Globalization 2.0: A New Trade Policy Framework for Advanced-Industry Leadership and National Power” (ITIF, March 24, 2025), https://itif.org/publications/2025/03/24/globalization2-a-new-trade-policy-framework/.
[11]. U.S. Department of Treasury, General Explanations of the Administration’s Revenue Proposals, U.S. Department of Treasury, Washington DC, March 2024, https://home.treasury.gov/policy-issues/tax-policy/revenue-proposals.
[12]. “Glossary of Fields and Variables,” U.S. Census Bureau, accessed October 16, 2025, https://www.census.gov/programs-surveys/economic-census/year/2017/economic-census-2017/about/fieldsandvariables.html#par_textimage_1747915268.
[13]. Federal Reserve Bank of St. Louis, FRED, Consumer Price Index for All Urban Consumers: All Items in U.S. City Average, accessed October 16, 2025, https://fred.stlouisfed.org/series/CPIAUCSL.
[14]. U.S. Census Bureau, 2008 Annual Survey of Manufacturers: Tables, accessed August 22, 2025, https://www.census.gov/programs-surveys/asm/data/tables.html; U.S. Census Bureau, Economic Census by Industry 2022, accessed September 24, 2025, https://www.census.gov/programs-surveys/economic-census/data/tables/industry.html.
[15]. BLS, Producer Price Index (PPI) Data Retrieval Guide, accessed October 20, 2025, https://www.bls.gov/ppi/data-retrieval-guide/#tabs-2.
[16]. Robert Atkinson, “Think Like an Enterprise: Why Nations Need Comprehensive Productivity Strategies” (ITIF, May 4, 2016), https://itif.org/publications/2016/05/04/think-enterprise-why-nations-need-comprehensive-productivity-strategies/.
[17]. Federal Reserve Bank of St. Louis, FRED, All Employees, Total Nonfarm, accessed October 20, 2025, https://fred.stlouisfed.org/series/PAYEMS#; U.S. Census Bureau, 2008 Annual Survey of Manufacturers: Tables, accessed August 22, 2025, https://www.census.gov/programs-surveys/asm/data/tables.html.
[18]. Please note that figure 7 shows the trends in production employment over a 15-year period, not a 16-year period like all other variables. The Economic Census stopped releasing data for this variable in 2021.
[19]. Helene Nguemgaing et al., “The Strategic Game of Rare Earths: Why China May Only Be in Favor of Temporary Export Restrictions” (Resources for the Future, October 7, 2025), https://www.rff.org/publications/issue-briefs/the-strategic-game-of-rare-earths-why-china-may-only-be-in-favor-of-temporary-export-restrictions/.
[20]. Robert D. Atkinson and Ian Tufts, “The Hamilton Index, 2023: China Is Running Away With Strategic Industries” (ITIF, December 13, 2023), https://itif.org/publications/2023/12/13/2023-hamilton-index/; Varun Sivaram et al., “Winning the Battery Race: How the United States Can Leapfrog China to Dominate Next-Generation Battery Technologies” (Carnegie Endowment for International Peace, October 2024), https://carnegieendowment.org/research/2024/10/winning-the-battery-race-how-the-united-states-can-leapfrog-china-to-dominate-next-generation-battery-technologies?lang=en.
[21]. USAspending.gov, Defense Department Contract Awards for Fiscal Year 2022, https://www.usaspending.gov/search?hash=34e88a0f1795135287ccfc0ccf2faaa3.
[22]. Bureau of Industry and Security, “Part 774 – The Commerce Control List” (Washington DC: U.S. Department of Commerce, last updated October 21, 2025), https://www.bis.gov/regulations/ear/774#supplement-1-774.
[23]. ITIF categorizations.
Editors’ Recommendations
Related
April 26, 2011
The Case for a National Manufacturing Strategy
June 6, 2025
No, American Manufacturing Hasn’t Been Revived
February 20, 2013
