
A Truck Mileage Traveled Tax to Enhance US Roadway Sustainability
Insufficient, inequitable, and poorly incentivized tax structures are leading to counterproductive behaviors in the trucking industry that threaten the sustainability of the U.S. highway network. An axle-adjusted vehicle mileage traveled tax would address many of these inefficiencies and help address the shortfall to ensure the sustainability of the U.S. Interstate network.
KEY TAKEAWAYS
Key Takeaways
Contents
U.S. Highway Infrastructure: Current Condition. 4
Trucking Costs to the U.S. Road Network. 4
U.S. VMTT Implementation Experience 5
Introduction
The Highway Revenue Act of 1956 created the U.S. Highway Trust Fund (HTF) to fund the U.S. Interstate Highway System. It was designed to assure that adequate funds were available to maintain and expand the U.S. roadways to ensure their sustainability. The HTF is funded primarily through fuel taxes at a flat rate per gallon, which slowly rose from its inception to 18.4 cents per gallon for ethanol and 24.4 cents per gallon of diesel in 1993, but has not risen since due to its unpopularity and subsequent political resistance.[1] As a result, the fund is chronically in deficit, and projected by the Congressional Budget Office (CBO) to be a cumulative total of $188 billion short by 2030.[2] In order to stay solvent, the HTF is funded by the U.S. public via transfer payments from the general fund. For example, the JOBS Act in 2022 allocated $550 billion to help revive the nation’s transportation infrastructure, with $350 billion allocated to U.S. roadways; and in 2015, the Fixing America’s Surface Transportation (FAST) Act allocated $52 billion to the HTF.[3]
The two laws represent a transfer payment, subsidizing heavy users of the roadway system at the expense of light users and nonusers. The public subsidization of the road network treats it as a public good rather than one that is funded by user fees, an inherently inefficient funding structure. Winston (2013) pointed out that the root cause of the inefficiency lies in the pricing of the road resource, creating what is commonly referred to as the “tragedy of the commons.”[4] A shared resource will be overutilized if it is free or underpriced; individually, rational users pursuing their own self-interest do so at the expense of the greater good, and the common pool resource deteriorates. Thus is the case with the U.S. highway network.
The problem has grown as the public subsidy has grown over time, allowing users to pay less and less of the total usage cost and forcing a transfer payment from nondrivers and light drivers to heavy drivers. Certainly, the deficit has grown as the fuel-based tax has not kept up with inflation over the 30+ years since 1992. Further, vehicles have become more fuel efficient and some are using alternative fuels, obviating the tax altogether while still contributing to the deterioration of the road network. The HTF will continue to be underfunded at higher and higher deficits if the structure of the tax is not altered.
A Vehicle Mileage Traveled Tax (VMTT) has been proposed as an alternative approach. The VMTT is a well-known concept. Manson (1906) was the first published suggestion found by the author for such a fee in the United States, and that article makes reference to Roman taxation of a per use road fee.[5] More recently, the National Surface Transportation Infrastructure Financing Commission recommended VMTT as a means of financing road infrastructure that would eventually replace the fuel tax.[6] This sentiment was echoed by CBO in its own independent report, which emphasized the disproportionate damage caused by trucking.[7] Given the magnitude of this problem, the ongoing failure of a gasoline-based tax, and the future prognosis of expanded shortfalls due to more fuel-efficient and alternative-energy technologies, an alternative tax structure is required to produce sufficient funds to support the U.S. road infrastructure.
This research summarizes the literature on and current state of the funding of the U.S. transportation infrastructure, focusing on the vehicle mileage tax option to support the interstate highway network. In order to limit the scope of the research, it will focus mostly on applying VMTT to trucking. There are three reasons for this focus. First, though a healthy transportation network may be considered a public good, a vast portion of the benefits from the use of the network by the trucking industry goes to private profit-seeking organizations, and as such is not acting as a public good for those private entities. Further, it might be argued that the taxation of road usage to the public in the form of a VMTT on vehicles is regressive and thereby unfair to the poor because a smaller portion of a wealthy budget goes to transportation.[8] There are also distributional impacts of changing from a gasoline tax to a vehicle-mile tax for light vehicles: a case study in Oregon found that a mileage tax restricted the mobility of low income households on the basis of cost.[9] Such a critique does not apply to trucking companies, which generally profit from per ton mile; thus, their use of the road network can be charged per ton mile.[10]
The Highway Trust Fund will continue to be underfunded at higher and higher deficits if the structure of the tax is not altered.
Second, because trucking is a commercial undertaking, there is little or no consideration for any privacy issues often attached to the application of VMTT to passenger vehicles. Many of the obstructions surrounding VMTT implementation emanate from privacy concerns; to what degree will individual movement be monitored in order to measure usage? Trucking has no such concerns, as truck movement tracking and reporting is commonplace throughout the industry.
Third, the trucking industry is the most logical way to start using a VMTT. Trucks create far more pavement damage per vehicle mile than do passenger vehicles, making the VMTT more important for these heavier vehicles. There is already in place extensive tracking of miles traveled by in-cab systems, making the implementation of taxes based on miles driven much easier. There are far fewer large trucks than passenger vehicles, which allows for a far lower administration cost. Thus, the cost of tracking miles is low and the benefit is high by imposing a VMTT on trucks. Importantly, the privacy concerns held by the general public are not an issue for the commercial entities, removing the largest political obstacle to the VMTT. For all these reasons, truck-based VMTT is very likely to be the first style of VMTT to be enacted on a wide-scale basis.
This research proposes an optimization-based approach to structuring a VMTT for trucking. It allows for parameter-based goal setting depending on varying objectives. It proposes a budget-balancing, efficient taxation structure that captures both distance and tonnage. It allows for any combination of fees and taxes for trucking, but focuses on interstate highway funding and the HTF.
U.S. Highway Infrastructure: Current Condition
Maintaining a sound transportation infrastructure to ensure its sustainability is essential for commerce and quality of life. The current state of U.S. roadways is rather poor, despite the regular contributions from the general fund. The American Society for Civil Engineers (ASCE, 2021) provides a report card on the condition of U.S. roadways, finding that 43 percent of all roads are in mediocre or poor condition, with an estimated $786 billion backlog in maintenance and expansion projects, estimating that current spending levels would need to be increased by 29 percent in order to both make up backlogs and overcome existing deficits.[11] Additionally, roadway safety has grown worse, with a 60 percent increase in fatalities from 2011 to 2021. Finally, extreme whether events and atmospheric warming cause additional maintenance needs.
Another source of concern is the growth in usage rates. Per U.S. Department of Transportation Bureau of Transportation data, highway road milage increased 7 percent and highway lane miles 10 percent from 1993, when the tax was last increased, to 2023, while truck miles increased more than 75 percent over that same interval.[12] Of course, the mismatch of supply and demand has caused ever growing congestion delay, another result of deferred maintenance and expansion. The American Society for Civil Engineers notes that congestion delay rose over 25 percent between 2014 and 2021, and this congestion costs the nation $166 billion each year, or approximately $1,080 annually in wasted time and fuel for the average auto commuter, not to mention additional greenhouse gasses.[13] It might be noted that congestion is a highly localized phenomena, and is less central to the maintenance of the road network. Nonetheless, it is another externality of additional traffic.
Trucking Costs to the U.S. Road Network
Though estimates vary widely, it is well established that the weight of trucks causes significant damage to pavement, driving the need for substantial maintenance. In a now-famous four-year study from the 1950s, the American Association of State Highway and Transportation Officials (AASHTO) estimated that a 40-ton fully loaded truck causes 9,600 times more damage to pavement than a standard 2-ton vehicle, from which the well-known fourth power rule was derived. In another example, Winston (1991) estimated that the average truck does 1,000 times the damage of a standard vehicle. In either case, the estimated damage is exponential with the weight of the truck.[14]
The U.S. Federal Highway Administration (FHWA) determined that trucks’ all-in external costs to society, including damage to pavement, congestion, crash, air pollution, and noise, were as high as 70 cents per mile for the heaviest trucks.[15] For each mile they traveled in 2000, combination trucks were estimated to impose a road repair cost average of 8 cents per mile. For all trucks, the study estimated that road maintenance cost per truck mile traveled ranged from 2 cents for trucks carrying the lightest loads to 20 cents for those with the heaviest loads. Passenger vehicles constituted the largest group of vehicles in use and were estimated to account for about 60 percent of federal highway costs, even though their cost per mile of highway use was estimated to be approximately 1 cent. Trucks accounted for the remaining 40 percent of federal highway costs but provided about one-third of the HTF’s revenues, while they represented approximately 6 percent of the total vehicle miles traveled in the United States. By those numbers, a truck mile creates 10 times more damage on average than a passenger vehicle mile.
The costs of road transportation include not only wear and tear on roads and bridges but also “external” costs to society such as delays caused by traffic congestion; injuries, fatalities, and property damage from accidents; and harmful effects from exhaust emissions. Forkenbrock estimated that for trucks to compensate for all of the externalities imposed by the trucking industry, the total fees would need to triple, and the internalized external costs would account for 13.2 percent of total internal trucking costs.[16]
Simple economics tells us that if truck transportation were more expensive, trucks would be driven less, and the reduction in miles traveled would lessen wear and tear on the roads. The remaining truck freight would likely shift mostly to rail. U.S. railroads privately maintain the rail network; thus, there is no “wear and tear” cost externality upon the public. In 2015, CBO estimated that the unpriced external costs (per ton mile) of transporting freight by truck were about eight times the unpriced external costs of transporting freight by rail; those costs, net of existing taxes, represented about 20 percent of the cost of truck transport and about 11 percent of the cost of rail transport.[17] Fourteen years earlier, Forkenbrock came to a similar finding by estimating the external costs of rail and concluding that those costs were less than one quarter of the external costs of trucks per gross ton mile, making rail a more efficient environmental and societal option.[18]
By CBO’s estimate, adding unpriced external costs to the rates charged by each mode of transport—via a weight-distance tax plus an increase in the tax on diesel fuel—would have caused a 4 percent shift of ton miles from truck to rail and a 1 percent reduction in the total amount of tonnage transported.[19] Gorman noted that such a move creates benefits for shippers, railroads, and the public by improving safety and reducing harmful environmental discharge by shifting 15 percent of truck freight to rail.[20]
The remainder of this report discusses implemented programs and research efforts to estimate impact of changes in tax structure and proposes an optimization model that could capture a mix of taxes to match the negative externalities created.
U.S. VMTT Implementation Experience
Four states have passed such a fee: Kentucky, New York, New Mexico, and Oregon.[21]
▪ Oregon instituted a weight mile tax to commercial operations on public roads for vehicles with a weight of 26,000 pounds or more. It imposed an increasing cost per ton, with a linear approximation estimate of approximately 2.5 cents per 10,000 pounds, ranging from 7 cents to 24 cents per vehicle mile.
▪ The state of Kentucky implemented a 2.8 cent per mile fee for all vehicles 60,000 pounds and above. Martin, Bell, and Walton (2014) reported that in such a case, there is a concern about record accuracy and tax compliance. Their work was proposed as an alternative, increasing the intrastate license fee by 129 percent.[22]
▪ The State of New York begins taxing heavy trucks at 18,000 pounds and collects over $100 million from this tax according to the American Transportation Research Institute.[23]
▪ New Mexico’s VMT fee begins at 26,000 pounds at 1 cent per mile, and grows to a maximum of 4.5 cents per mile for the heaviest trucks, which amounts to 21 percent of the New Mexico State Road Fund’s annual revenue, according to the New Mexico Department of Transportation.[24]
Luechinger and Roth (2016) examined the impacts of a VMTT in Switzerland in 2001 through an analysis of trucking data both before and after a tax increase (1997–2004).[25] They found that the introduction of the Swiss heavy vehicle fee reduced the number of trucks on the road by 4.7 percent to 5.1 percent, The tax is graduated by weight, ranging from 5.6 percent to 20.9 percent of operating and vehicle costs per mile.
The vast majority of the research concentrates on the fee per mile or ton mile, and rarely is adjusted for axles. Many have proposed a combined fuel and miles tax structure. The following is a subset of these:
▪ Parry (2006) evaluated the optimal heavy-duty truck tax, accounting for external costs from congestion, accidents, pavement damage, noise, energy security, and local and global pollution, and suggested that the most efficient tax structure involves a diesel fuel tax of 69 cents per gallon and charges on trucks that vary between 7 and 20 cents per mile. Implementing this tax structure would yield welfare gains of $2.06 billion.[26] From a public welfare perspective, it is preferred over the best fuel-only tax of $1.12 per gallon.
▪ Nehiba (2020) looked primarily at the loss of property and life impact of trucking from 3.5 billion truck-level observations.[27] He found that both truck miles and truck weight increase the quantity of collisions, and truck weight increases skew the collision distribution toward fatal outcomes. His research suggests a 37 cent per gallon fuel tax increase to mitigate the disproportionate negative accident externality trucks create for both their distance traveled and weight.
▪ Rodriguez and Pulugurtha (2001) evaluated the vehicle miles tax for all vehicles to meet the deficit in Charlotte, North Carolina.[28] Their results indicate that charging 0.625 cents per each mile traveled or 1.00 cent per additional mile exceeding 5,000 miles per year, to complement the gas tax, could generate enough revenue to mitigate the transportation finance deficit estimated equal to $30 million–$35 million.
An Efficient VMTT
The external costs of trucking are fourfold: pavement damage, environmental concerns, congestion effects, and the safety of other drivers.[29] Of primary interest in this research is pavement repairs, the cost of which is a function of three things: distance traveled, truck weight, and number of axles. Of course, more weight causes more damage. Having more axles distributes the weight to more surface points and thereby reduces damage. However, more axles tend to reduce fuel efficiency and increase acquisition and maintenance costs, so freight companies have a perverse incentive to use trucks with fewer axles whenever legally permitted to do so. Thus, there are constraints on the minimum number of axles allowable for trucks of various weights, which varies by state, but for this research, commonly legislated policy values are used: two axles up to 33,000 pounds, five (tandem) axles from 33,000 to 80,000 pounds, and six axles (tridem) above 80,000 pounds. The simple VMTT based on mileage alone captures the first factor but fails to consider the other two. A vehicle ton mile tax, which is a function of both weight and distance, would capture the damage of additional weight but not the mitigating effects of more axles. A vehicle ton mile tax adjusted for the number of axles captures all three effects. The one damage component that is not captured is for driving on less-heavily engineered roads, which, ceteris paribus causes more damage than to roads that are more heavily engineered. That condition generally does not apply to U.S. interstates, and for that cost, location-specific taxes would need to be levied.
A second cost is damage to the environment caused by greenhouse gasses and particulate matter release. This is the primary driver of a fuel tax, which approximates distance indirectly but fails to measure the fuel efficiency of a truck and imposes no cost on electric vehicles. (The presumption here is that if the source of electricity is a greenhouse gas creator, a tax would be imposed at the source.) It does capture emissions well, thus it is a more suitable tax for greenhouse gases.
A third cost is congestion, which is a function of the level of traffic and therefore often related to the time of day and day of the week. As this issue is highly urban and localized, it is emphasized in this research, which focuses on the U.S. Highway network infrastructure.
The final cost is any uncompensated life and property damage that trucks create. This cost is difficult to account for from a tax perspective and is likely better accounted for in insurance premiums and by individual case in the legal system.
In summary, the efficient tax structure for the trucking industry may look like equations 1–3:
1. Minimize Efficient Tax = (X * Ton-Miles/Axles) + (Y * Gallons of Fuel Consumed) + (Z * Location/Congestion Specific Fees)
Subject to:
2. Efficient Tax >= Road Damage Created
3. Y * Gallons of Fuel Consumed >= Greenhouse Gas and Particulate Costs Created
Where X is the VMTT per mile and tons are per axle; Y is the traditional diesel gas tax; and Z is a congestion charge, which is location specific and is disregarded from this point forward. Constraint (2) assures that the HTF is in balance for truck-related damage (vehicle tax revenues and damage are omitted from this analysis). Constraint (3) assures that due consideration is given to greenhouse gasses. Note that, as is currently the case, the diesel tax revenues are allocated toward the HTF, and not toward any sort of mitigation efforts for greenhouse gasses.
Which elements are included and emphasized depends on the goals of the tax structure. For this analysis, which focuses on the U.S. HTF deficit, we omit the third component of the tax structure (congestion), which would be the domain of local authorities. The objective of Congress might be to balance the HTF (for truck-related damage) annually and to continue to incentivize low or no emission trucks by at least paying for the environmental damage (carbon dioxide, particulate emissions, etc.) that trucks create. To the extent that policymakers may want to encourage a transition to cleaner energy, fuel taxes are an efficient and direct means. Short of using that funding for greenhouse gas mitigation, they could be used in place of a VMTT as it is today to support road infrastructure.
To parameterize the model, we turn to CBO, Department of Transportation and Environmental Protection Agency data sources. Table 1 shows key data with basic VMTT calculations. Walking through the calculation for combination trucks is as follows. Total outlays in 2023 for the HTF (omitting mass transit) were $69 billion (line a). According to an FHWA study that has not been updated since 2000, combination trucks produce 29 percent of the highway maintenance and expansion expense (b), or $20 billion (c).[30] Total truck taxes in 2023 were 17 billion (f), with 59 percent of that, or $11.7 billion (f), coming from combination trucks, leaving a $8.3 billion deficit (j) created by combination trucks. In 2022, there were 157.8 billion total combination truck miles driven in the United States (g).[31] This implies a 5.3 cent per mile shortfall (k), if other truck taxes remain unchanged. Applying the same methodology to single-unit trucks yields a 3.2 cent per mile VMTT (k). Blending the two truck types leads to an overall average of 4.6 cents per mile (k).
Table 1: Estimated trucking revenue shortfall to the HTF
|
Revenues and Expenditures |
Combination |
Single Unit |
Blended |
|
2023 Outlays |
|||
|
a) U.S. DOT HTF[32] |
$69.0B |
||
|
b) Truck Share[33] |
29.0% |
11.0% |
40.0% |
|
c) Truck Total (a * b) |
$20.0B |
$7.6B |
$27.6B |
|
2023 Sources of Truck-Based Revenue |
|||
|
d) Diesel Fuel Taxes[34] |
$7.4B |
$3.4B |
$10.8B |
|
e) Heavy Vehicle Sales, Use, Tire Taxes[35] |
$4.3B |
$1.9B |
$6.2B |
|
f) Truck Total Taxes (d + e) |
$11.7B |
S5.3B |
$17.0B |
|
Truck Highway Usage |
|||
|
g) Highway Miles Travelled (2022)[36] |
157.8B |
71.3B |
229.1B |
|
h) Share of Total Truck Miles by Size[37] |
68.9% |
31.1% |
100.0% |
|
i) Total Taxes by Size (f * h) |
$11.7B |
$5.3B |
$17.0B |
|
VMTT Calculations |
|||
|
j) Truck Tax Shortfall (c - i) |
$8.3B |
$2.3B |
$10.6B |
|
k) HTF Balancing VMTT with Current Taxes (g/j) |
5.3¢/mi |
3.2¢/mi |
4.6¢/mi |
A number of assumptions are included in this calculation. First, to the author’s knowledge, FHWA has not conducted a subsequent analysis on the percentage of road damage attributable to trucks since 1999. Since that time, trucks have generally become 15 percent heavier and the VMT for trucks has grown as a percentage from 2.6 percent to 4.2 percent of total VMTs.[38] Thus, the current damage attributable to trucks is likely to be higher, which would increase the estimated VMTT. Total truck miles on all roads were used to calculate combination trucks’ contribution to the HTF as a function of diesel use and tire wear, but solely truck miles on interstates and rural roads, to which the HTF is most commonly applied, were used to calculate the shortfall per mile. As such, the estimated deficit caused by trucks on all roads is understated; trucks do damage to secondary roads for which local funds often are used to maintain. Diesel fuel and tire depreciation revenues are applied in all truck miles for which diesel is used, but interstate-only miles are used for the road damage estimates because this research is focused solely on the HTF, which primarily supports interstate financing. The resulting deficit estimate also excludes any mass transit funding or shortfalls. Extra heavy trucks (over 80,000 pounds) are excluded due to their low prevalence (less than 4 percent of the total operating truck miles), their tendency to be shorter-distance operations off the interstates, and their complex axle rules that would require more detailed study of those particular sectors.
Of course, table 1 is based only on truck miles and omits any consideration of weight. An efficient tax would be a function of weight and axles, as damage is a function of the weight per axle. Table 2 reproduces the most recently released data from FHWA (2024) on the number of trucks by weight in 2002.[39] Given that combination trucks generally operate on five axles over 34,000 pounds (at which weight it is mandatory to use five-axle vehicles), we assume that generally fewer axles are used at lower weights to reduce the acquisition, fuel, and operating costs faced by the trucking industry. Under the assumption that truck weight distribution hasn’t changed drastically (which it had not in the decade prior to 2002 in these categories per BTS data), one can apply these weight distributions to the average VMTT calculated in table 1 to create a charge per axle ton mile.
Table 2: BTS reported number of single-unit and combination trucks by weight range
|
Vehicle Weight (Pounds) |
2002 Count (Thousands) |
2002 Share |
Average Weight |
Axles |
Weight/Axle (Pounds) |
||
|
10,001–14,000 |
4,170 |
55% |
12,000 |
2 |
6,000 |
||
|
14,001–16,000 |
758 |
10% |
15,000 |
2 |
7,500 |
||
|
16,001–19,500 |
829 |
11% |
17,750 |
2 |
8,875 |
||
|
19,501–26,000 |
986 |
13% |
22,750 |
2 |
11,375 |
||
|
26,001–33,000 |
788 |
10% |
28,000 |
2 |
14,000 |
||
|
33,001–40,000 |
458 |
11% |
36,500 |
5 |
7,300 |
||
|
40,001–50,000 |
637 |
16% |
43,500 |
5 |
8,700 |
||
|
50,001–60,000 |
653 |
16% |
50,500 |
5 |
10,100 |
||
|
60,001–80,000 |
2,357 |
57% |
70,000 |
5 |
14,000 |
||
Applying the well-known fourth power law, which states that road damage varies with the fourth power of the axle load, produces an axle load tax that more correctly adjusts for vehicle weight damage to roadways.[40] The percent change in weight per axle from that baseline raised to the fourth power times the baseline value equals the recommended VMTT for that weight. The calculation is repeated for each 1000-pound increment in truck weight. Calculations assume a uniform distribution within each weight class. Calculations further assume that the miles traveled by truck are proportionally shared across all weight ranges in table 2. Assigning baseline weights of 15,000 pounds for single units and 52,000 for combination trucks, and applying the fourth power law repeatedly from 10,000 to 33,000 for single unit trucks and from 33,000 to 80,000 for combination trucks yields a sufficient tax for these two classes of vehicles.
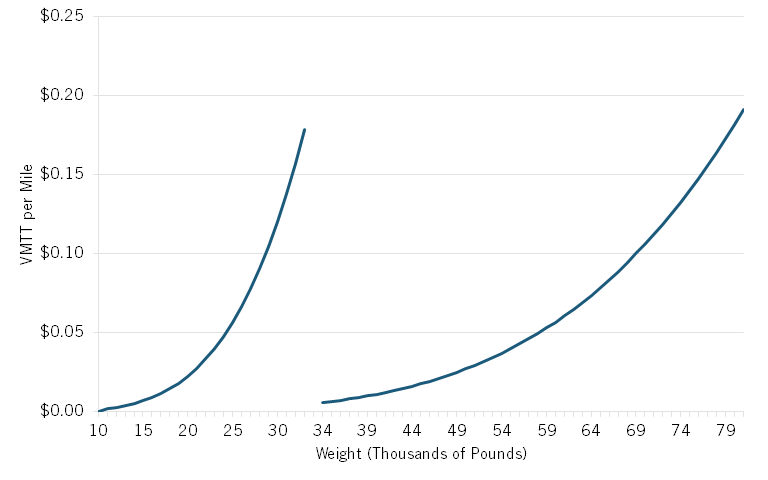
Figure 1 and figure 2 show the results. Figure 3 shows both truck types on the same graph for comparison purposes. Two different estimation equations are provided: an order two polynomial which generated the curve, and a simpler linear estimate. In both cases, the polynomial estimate provides a nearly perfect fit due to the use of the fourth power rule to generate the curve. A linear estimate is provided for simplicity of interpretation and eventual implementation. The linear fit leads to a negative intercept, thus the intercept is (arbitrarily) set to zero to avoid negative taxation at low weights; in practice, a higher intercept value could be established. Following a linear estimate with this restriction causes higher tax load at lower weight classes, and under taxes the heaviest trucks.
For single-unit trucks, the VMTT ranges from 0.1 cents to 18 cents. For combination trucks, the VMTT ranges from 1.4 cents to 20 cents. The single unit trucks’ tax increases by 5.1 cents per 10,0000 pounds; combination trucks’ tax increases by 3.8 cents per thousand pounds. The difference is due to the number of axles; 10,000 pounds on a two-axle single unit trucks increase weight per axle by 5000 pounds whereas the same increase in a five-axle combination truck increases the weight per axle by 2000 pounds per axle. In that sense, combination trucks pay a slightly higher tax per axle weight. There is a sense of fairness to it; the tax for an 80,000-pound combination truck approximates the tax per mile for a 32,000-pound single unit truck, and they both put 16,000 pounds per axle pressure on the pavement. (Though of course, the combination truck has more points of contact with the pavement, increasing the total damage.)
Figure 1: VMTT per truck mile by weight
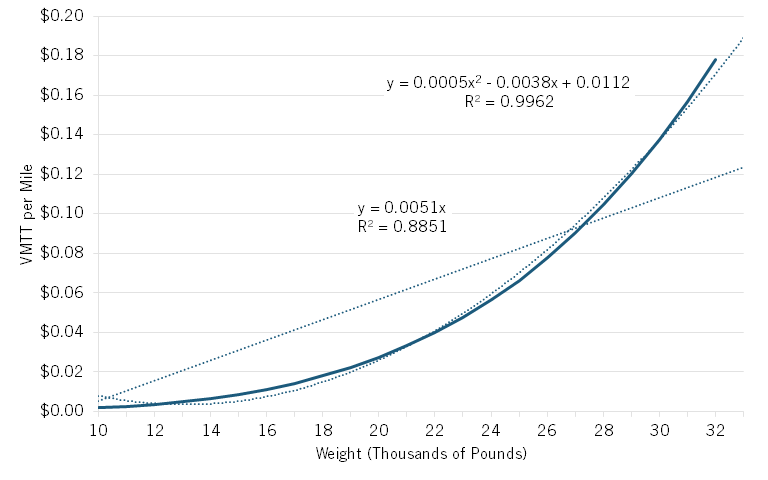
Figure 2: VMTT per truck mile by weight
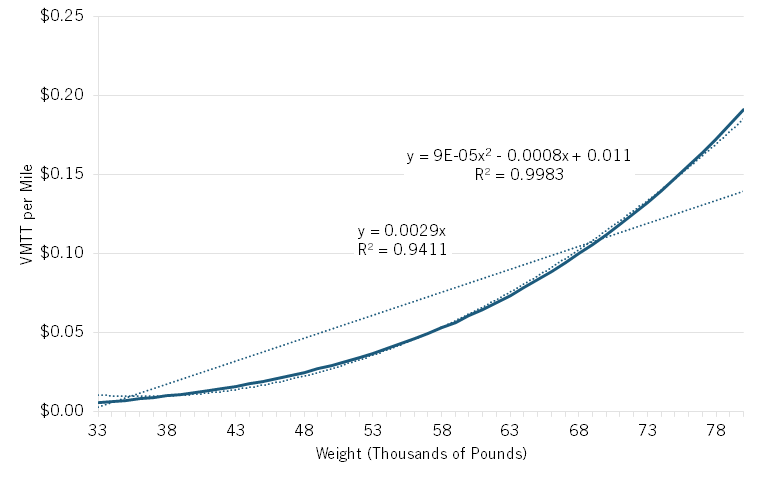
Figure 3: Blended truck VMTT per truck mile
Conclusion
A framework for an HTF-balancing VMTT for trucking has been established. With a focus on balancing the HTF to ensure the sustainability of the U.S. highway network, consideration is made for all trucking externalities. (The same method could be applied to secondary roads.) All results presented assume current diesel and truck taxes remain in place unchanged, and a VMTT augments funding for maintaining and expanding U.S. highways. To the extent that policymakers want to discourage greenhouse gas emissions through increased diesel taxes, the proposed VMTT could be reduced. Based on recent data, trucking could be budget neutral with a graduated 0.1 cents to just over 18 cents for single unit trucks, and for combination trucks, the VMTT ranges from 1.4 cents to 20 cents.
There are avenues for further research. Though considerations were made for many dimensions of truck externalities, the focus here was primarily on road deterioration; an expanded scope to include greenhouse gas emissions, congestion, and property damage could be pursued, lending to a trade-off between milage and fuel-based taxes. Due mostly to their rarity and their varying operating rules, extra-heavy trucks were not treated in this work, but should be considered, as is the case with passenger vehicles. (HTF deficits due to passenger vehicles were not in scope.) Within the context of standard trucking, a more expansive, game-theoretic view might account for trucking industry operating practice reaction to such a tax (e.g., use more axles to avoid taxes).
As far as administrative costs of such a tax goes, a possible simplification is to tax trucking companies on average VMTT per axle. Trucking companies actively track both total tonnage shipped and truck miles; an end-of-year tally would reveal both total miles and tons. This simplification would lend itself to easier implementation and tracking, but would under-tax the extremely heavy shipments and would over-tax the lighter ones, which is contrary to the sustainability of the highway network. Due to the convexity of the VMTT curves, the simplification would increase tax revenues overall relative to a shipment-by-shipment tally, while decreasing administrative burden. In short, a simple linearization of the relationship between weight and tax would be a boon to policymakers on both cost and revenue counts.
The sustainability of the U.S. highway network is essential to the quality of life of U.S. citizens and the health of the economy. Current insufficient, inequitable, and poorly incentivized tax structures are leading to behaviors in the trucking industry that threaten the sustainability of the highway (and other road) network. An axle-adjusted VMTT would address many of these inefficiencies and help mitigate the shortfall to ensure the sustainability of the U.S. Interstate network.
About the Author
Professor Michael F. Gorman holds the Niehas Chair of Operations and Analytics at the University of Dayton department of MIS, OPS and Analytics. He has over 23 years of academic experience at University of Dayton, and 10 years’ practical experience at BNSF Railway. He has over 60 academically reviewed publications and over 100 conference and invited presentations. His specialty is in the applications of analytics, with a focus on transportation and logistics issues. He is the former editor in chief of the INFORMS Journal on Applied Analytics (formerly Interfaces) and serves on three editorial boards. He has been a finalist in the Edelman and Wagner Awards of INFORMS and has won the INFORMS Award for the Teaching of Applied Analytics and the POMS Wick Skinner award for teaching. He helped found the Analytics Society of INFORMS as its first president and created the Innovative Applications of Analytics Award. He has held numerous other elected and volunteer positions at INFORMS. Gorman has a Bachelor's degree in Computer Science and Economics from Xavier University, an MS in Economics, and a Ph.D. in Business and Economics at Indiana University.
About ITIF
The Information Technology and Innovation Foundation (ITIF) is an independent 501(c)(3) nonprofit, nonpartisan research and educational institute that has been recognized repeatedly as the world’s leading think tank for science and technology policy. Its mission is to formulate, evaluate, and promote policy solutions that accelerate innovation and boost productivity to spur growth, opportunity, and progress. For more information, visit itif.org/about.
Endnotes
[1]. Department of Transportation, Bureau of Transportation Statistics, “Government Transportation Revenues and Expenditures: Highway Trust Fund,” Transportation Economic Trends, accessed July 14, 2025, https://data.bts.gov/stories/s/6bdc-i7mh#highway-trust-fund.
[2]. Congressional Budget Office, “Highway Trust Fund Accounts,” Baseline Predictions, May 2023, https://www.cbo.gov/system/files/2023-05/51300-2023-05-highwaytrustfund.pdf
[3]. Department of Transportation, “Government Transportation Revenues and Expenditures: Highway Trust Fund.”
[4]. C. Winston, “On the Performance of the U.S. Transportation System: Caution Ahead,” Journal of Economic Literature, 51(3), 771–824, http://dx.doi.org/10.1257/jel.51.3.773.
[5]. E. Manson, “The Regulation of Motor-Cars at Home and Abroad,” Journal of the Society of Comparative Legislation, (1906), 7(2), 333–355.
[6]. Robert D. Atkinson, “Paying our way: a new framework for transportation finance,” final report for the U.S. National Surface Transportation Infrastructure Financing Commission, February 1, 2009, https://rosap.ntl.bts.gov/view/dot/17160.
[7]. Congressional Budget Office, “Alternative Approaches to Funding Highways,” March 2011, https://www.cbo.gov/publication/22059.
[8]. B.S. McMullen, L. Zhang, and K. Nakahara, “Distributional impacts of changing from a gasoline tax to a vehicle-mile tax for light vehicles: A case study of Oregon,” Transport Policy, (2010), 17(6), 359–366.
[9]. Ibid.
[10]. Ibid.
[11]. American Society for Civil Engineers, “Report Card for America’s Infrastructure,” https://infrastructurereportcard.org/cat-item/roads-infrastructure/.
[12]. U.S. Department of Transportation Bureau of Transportation Statistics, “Vehicle Miles Traveled by Highway Category and Vehicle Type,” data for 2023, https://www.bts.gov/browse-statistical-products-and-data/freight-facts-and-figures/vehicle-miles-traveled-highway.
[13]. American Society for Civil Engineers, “Report Card for America’s Infrastructure.”
[14]. C. Winston, “Efficient transportation infrastructure policy,” Journal of Economic Perspectives, 5(1), 113–127, http://www.jstor.org/stable/1942705.
[15]. Federal Highway Administration, “Addendum to the 1997 Federal Highway Cost Allocation Study Final Report,” May 2000, www.fhwa.dot.gov/policy/hcas/addendum.cfm.
[16]. D.J. Forkenbrock, “External costs of intercity truck freight transportation,” Transportation Research Part A: Policy and Practice, 33(7-8), 505–526, https://doi.org/10.1016/S0965-8564(98)00068-8.
[17]. David Austin, “Pricing Freight Transport to Account for External Costs, 2015. Congressional Budget Office March , Working Paper 2015-03. www.cbo.gov/publication/50049.
[18]. D.J. Forkenbrock, “Comparison of external costs of rail and truck freight transportation,” Transportation Research Part A: Policy and Practice, 35(4), 321–337, https://doi.org/10.1016/S0965-8564(99)00061-0.
[19]. Austin, “Pricing Freight Transport to Account for External Costs.”
[20]. M.F. Gorman, “Evaluating the public investment mix in US freight transportation infrastructure,” Transportation Research Part A: Policy and Practice, 42(1), 1–14, https://doi.org/10.1016/j.tra.2007.06.012.
[21]. J. Macumber-Rosin and A. Hoffer, “Vehicle Miles Traveled Taxes Rollout across States,” Tax Foundation, May 9, 2024, https://taxfoundation.org/blog/state-vmt-vehicle-miles-traveled-taxes/.
[22]. A. Martin, M. Bell, and J. Walton, “Analysis of Alternative to Kentucky Weight–Distance Tax,” Transportation Research Record, 2450(1), 172–178, https://doi.org/10.3141/2450-21.
[23]. American Society for Civil Engineers, “Report Card for America’s Infrastructure”; American Transportation Research Institute, “An Analysis of New York State’s Ton-Mile Tax,” August 2017, https://yankeeinstitute.org/wp-content/uploads/2021/02/FINAL-TMT-Analysis-8-2017.pdf.
[24]. New Mexico Department of Transportation, “NMDOT Tax Revenue Sources and Distribution A Brief Overview,” presentation, July 6, 2022, https://www.nmlegis.gov/(X(1)S(xrraljo22wt0uigx0hz3ynjf))/handouts/RSTP%20070522%20Item%206%20Transportation%20Revenue%20Sources%20Distributions%20State%20Comparisons.pdf.
[25]. S. Luechinger and F. Roth, “Effects of a mileage tax for trucks,” Journal of Urban Economics, 92, 1–15, https://doi.org/10.1016/j.jue.2015.09.005.
[26]. I.W. Parry, “How should heavy-duty trucks be taxed?” Journal of Urban Economics, 63(2), 651–668, http://dx.doi.org/10.2139/ssrn.900917.
[27]. C. Nehiba, “Taxed to death? Freight truck collision externalities and diesel taxes,” Regional Science and Urban Economics, 85, 103577, https://doi.org/10.1016/j.regsciurbeco.2020.103577.
[28]. A. Rodriguez and S. Pulugurtha, “Vehicle miles traveled fee to complement the gas tax and mitigate the local transportation finance deficit,” Urban Planning and Transport Research, 9(1), 18–35, https://doi.org/10.1080/21650020.2020.1850334.
[29]. Forkenbrock, “External costs of intercity truck freight transportation.”
[30]. Federal Highway Administration, “Addendum to the 1997 Federal Highway Cost Allocation Study Final Report.”
[31]. Federal Highway Administration, Highway Statistics (Washington DC: Annual Issues), Table VM-1, available at https://www.fhwa.dot.gov/policyinformation/statistics.cfm.
[32]. Department of Transportation, “Vehicle Miles Traveled by Highway Category and Vehicle Type.”
[33]. Federal Highway Administration, “Addendum to the 1997 Federal Highway Cost Allocation Study Final Report.”
[34]. Tax Policy Center, “What is the Highway Trust Fund and How is it Financed,” 2023, https://www.taxpolicycenter.org/briefing-book/what-highway-trust-fund-and-how-it-financed.
[35]. Ibid.
[36]. Department of Transportation, Highway Statistics, Table VM-1.
[37]. Department of Transportation, “Vehicle Miles Traveled by Highway Category and Vehicle Type.” Calculation.
[38]. Ibid.
[39]. Department of Transportation, Highway Statistics, Table VM-1.
[40]. Federal Highway Administration, “AASHTO Road Test,” Accessed July 7, 2025, https://www.fhwa.dot.gov/infrastructure/50aasho.cfm.
Editors’ Recommendations
Related
June 17, 2025
Paving the Way: A Fair Funding Future for US Roads
March 3, 2021
