
Closing the Trucking Gaps: Priorities for the Department of Energy’s RD&D Portfolio

Transitioning heavy-duty trucks to net-zero emissions is an important yet formidable challenge. Expanded RD&D support is needed to meet emission goals at price-performance parity.
KEY TAKEAWAYS
Key Takeaways
Contents
Emissions Reduction Opportunities. 4
Fundamental Challenges: Energy and Gravimetric Density. 9
Hurdles and Innovation Potential 12
Refueling Stations and Infrastructure. 15
Battery and Fuel Cell Chemistry. 17
Appendix 1: Tabulations of HDT Subsector’s GHG Emissions. 20
Appendix 2: 2002 VIUS, 1997 VIUS, and 1992 TIUS Comparison (Selected Statistics). 21
Appendix 3: Overview of DOE’s SuperTruck Program.. 23
Appendix 4: Department Of Transportation FHWA’s 13-Class Vehicle Classification System.. 24
Data Gap #1: Total Cost of Ownership. 27
Data Gap #2: Lack of Data on HDTs’ Drive Cycle and Duty Cycle. 28
Data Gap #3: Different Vehicle Classification Systems Describe Different Datasets. 28
Data Gap #4: Missing VMT Data—Average VMT Is Not a Good-Enough Metric. 31
Introduction
Reducing truck emissions is a global challenge.[1] Low-carbon innovations to achieve price-performance parity (P3) with diesel trucks is key to widespread adoption of low-carbon options.
Medium and heavy-duty trucks (MHDTs) account for 30 percent of the road transportation’s emissions despite representing only five percent of the vehicles.[2] They also emit 32 percent of the nitrogen oxides (NOx) and 10–30 percent of the particulate emissions in certain urban areas.[3] Finally, global economies will continue to grow and the amount of freight hauled by heavy-duty trucks (HDTs) is expected to grow.
Federal research, development, and demonstration (RD&D) investments for decarbonizing HDTs are disproportionately low relative to their greenhouse gas (GHG) emissions. Moreover, investments in HDTs are predominantly focused on battery-electric powertrains, which limits the experimental experience with hydrogen fuel cell technologies that could offer more flexibility and higher energy densities. The federal RD&D strategy needs a diversified portfolio. Furthermore, investments in cost reductions tend to focus on batteries instead of other electronic components such as thermal management, onboard chargers, and electronic accessories that comprise a notable portion of powertrain costs.[4] To effectively address these issues requires significantly more investment than the current level.
Approaches to address the emissions footprint include energy-source changes (e.g., electricity, fuel cell, natural gas, biofuels), improving powertrain performance, aerodynamics, efficiency, and weight reduction.[5] But only the first energy sources using batteries, fuel cells, or biofuels can get close to net zero. In parallel, expanding capabilities for electric vehicle (EV) and fuel cell electric vehicle (FCEV) technologies are expanding the options that are available. Yet, the fit between key performance attributes and end-user needs varies with vehicle class, so there is no one solution for all HDT users and vehicle classes. Major challenges include expanding vehicle operating ranges, decreasing costs, and meeting the wide range of customer needs in multiple vehicle categories.
RD&D for medium-duty trucks (MDTs) and HDTs has lagged behind that of passenger vehicles. Even now, most of the attention and RD&D investments in on-road transportation have gone to the light-duty segment. As such, Congress needs to appropriate increased funds for RD&D in the sector. In addition, the Department of Energy (DOE) should embrace a more diversified portfolio to open additional opportunities for innovation in these other components as well enhancing the spillover potential to other transportation subsectors such as passenger cars, aviation, and maritime.
This report explores the HDT emissions-reduction opportunity, alternative fuel and powertrain options, hurdles, and the rationale for innovation investments. It also probes how solving complex challenges and lowering costs could accelerate technology spillovers to other vehicle classes.
Emissions Reduction Opportunities
Addressing the emissions footprint of HDTs is an opportunity to reduce GHGs such as carbon dioxide (CO2) and other co-pollutants including NOx and particulates. Pursuing co-pollutant reductions is part of the overall opportunity to reduce long-term health impacts. The following section examines the potential to reduce co-pollutant and CO2 emissions.
Carbon Dioxide
From 2009 to 2019, CO2 emissions from MHDTs averaged 440 million metric tons of CO2 equivalent emissions per year (MMTCO2e/year) in the United States, rising 16 percent by the end of this period, even as total on-road transportation emissions declined slightly.[6] In 2019, GHG emissions from this subsector accounted for almost 30 percent of the national total, up from 25 percent in 2009.[7] MHDT emissions in the United States made up a quarter of global emissions, which totaled 1,770 MMTCO2e.[8]
HDTs of Class 7 and 8 (exceeding 26,000 pounds by gross vehicle weight rating (GVWR) account for most of the MHDT subsector’s GHG emissions and a disproportionate share of fuel consumption and CO2 emissions relative to vehicle miles traveled (VMT) as shown in figure 1.[9] HDTs account for the larger proportion of CO2 emissions in the heavy group, followed by MDTs and buses. Diesel is the dominant source of energy used in HDTs.
Figure 1: VMT, CO₂ emissions, and energy consumption by on-road transportation subsector[10]
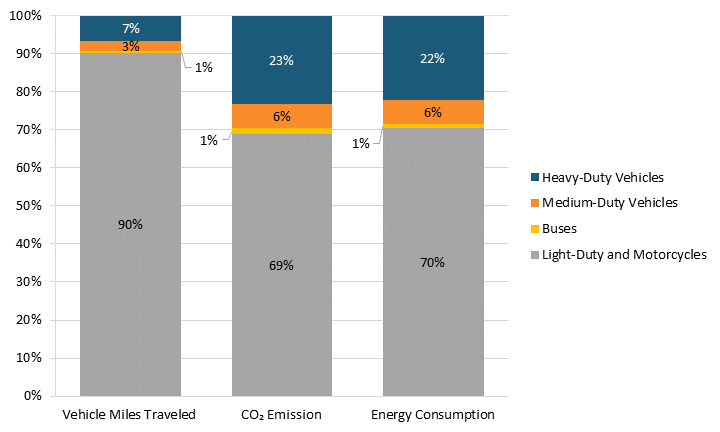
Almost all GHG emissions from the MHDT subsector (98 percent) come from CO2, with the balance of methane, and nitrous oxide totaling another 10 MMTCO2e in 2019. Indirect emissions from electricity contribute an additional 4.9 MMTCO2e for transportation.
Compared with the light-duty vehicles (LDVs), fuel efficiency gains for MDTs and HDTs have been minimal—with the fleet average hovering at just over six miles per gallon (mpg) for combination trucks (e.g., semitrucks). For single-unit trucks, the fleet average was 7.5 mpg in 2019.[11] Although state-of-the-art semitrucks can reach 8 to 10 mpg, these efficiency improvements have not impacted GHG emissions reductions at the aggregate level.[12]
Federal RD&D programs to improve HDT efficiency gained traction in the 2010s; DOE’s SuperTruck I (2010–2016) and SuperTruck II (2017–2021) programs focused on improving freight and thermal efficiencies. DOE’s SuperTruck III program, launched in 2021, is the first one focusing on electrification. Table 6 in Appendix 3 summarizes DOE’s SuperTruck program objectives, investment amounts, results, and achievements. SuperTruck I raised fuel economy to almost 10 mpg and SuperTruck II targets 13 mpg, but considering adoption rates, the 2022 Annual Energy Outlook (AEO) forecast projects that the average fuel economy will be lower than eight mpg by 2050.
Under current projections, fuel consumption (energy use) and emissions would decrease slower after 2030. Despite some improvements in fuel economy (+25 percent from 2021 to 2050), fuel consumption and emissions are expected to decline by only 13 percent due to the increase expected in VMT. Although these projections show increased energy use from electricity and hydrogen, they are projected to make up only 0.1 percent of the freight truck fuel mix by 2050.
Co-Pollutants
In addition to CO2, several co-pollutants are associated with fuel combustion from internal combustion engines (ICEs) including NOx, hydrocarbons (also known as volatile organic compounds or VOCs), carbon monoxide, and particulate matter including carbon black. Successive emissions standards have lowered NOx and non-methane hydrocarbon emissions from HDTs by 95 percent since 1988.[13] To meet emissions standards, several advanced post-engine emissions treatment systems have been devised and implemented, including three-way catalytic converters, lean NOx traps, selective catalytic reduction, and diesel particulate filters.[14]
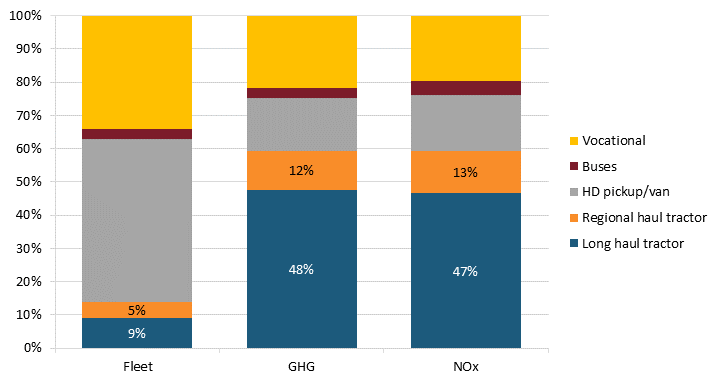
Across the MHDT category long-haul trucks account for almost half the GHGs, NOx, and particulate emissions, despite being only nine percent of the MHDT vehicles on the road, as shown in figure 2. It’s also noteworthy that the heaviest classes rely on diesel with a small share (< five percent) of compressed natural gas engines.
Figure 2: MHDT fleet shares versus emission shares[15]
The emissions of these co-pollutants vary during vehicle performance. On-road studies show that NOx emissions are five times higher than the certification limit at low speeds (under 25 mph) and 2.7 times higher at mid-speeds (25–50 mph).[16] As HDTs spend some 43 percent of their driving time at lower speeds, this can count for a disproportionate amount of NOx emissions. Whether an engine is cold or warmed up, the frequency of starts/stops, type of fuel (heavy-duty diesel, gasoline, or compressed natural gas), and model year of the HDT can influence the rate of co-pollutant emissions.[17] Recent emissions regulations aim to reduce NOx emissions across all driving conditions, including cold start and urban operations.
To provide a marker on the potential reduction in health impacts, Anenberg et al. estimated 22,000 premature deaths and health damages of $210 billion (in 2015 dollars) associated with particulate emissions and ozone (NOx is a contributor to ozone) from the transportation sector.[18] Exposure to airborne particulate matter, especially below 2.5 microns (PM2.5), has been implicated in the increased risk for type-two diabetes, dementia, and low birth weight.[19]
The Environmental Protection Agency’s (EPA’s) December 2022 rule for NOx reductions would require substantial innovation to achieve technically and economically viable solutions.[20] Reducing the rate of emissions of CO2 and co-pollutants requires more research and development (R&D) to further address the emissions during high-emitting run conditions, as well as during steady-state operations.[21]
Solution Options
Emerging low-carbon energy sources and powertrains are expanding the range of options, improving capabilities, and extending performance ranges for HDTs. Yet, considering the wide variation in how vehicles are used in the MHDT category, there is no one solution across all uses.
Energy Sources
Over 98 percent of HDTs run on diesel. Current lower-carbon fuel options include synthetic diesel, natural gas, and biodiesel, but these are only temporary alternatives that will not help the subsector reach zero emissions. These transitory alternatives also have very low adoption currently, especially for HDTs, wherein over 95 percent of vehicles run on diesel fuel. The world urgently needs true zero-emission options. The expanding portfolio of alternatives provides additional options for the path to zero-emissions vehicles.
Biofuels and natural gas options have proven to be the least disruptive alternative fuel technologies. Biodiesel and synthetic diesel can provide emissions-reduction benefits without major engine or infrastructure changes and offer fleets a near-term option for reducing emissions. Biodiesel is blended with fossil fuel-based fuels and accounts for one percent of transportation sector fuel use.[22] Another bio-related option, renewable natural gas (RNG), is obtained from biogas. RNG accounts for 64 percent of the on-road fuel used in natural gas vehicles.[23] A recent waste-to-wheels analysis shows CO2 reductions of more than 80 percent for RNG fueled vehicles.[24] This provides a near-term route for emissions reductions wherein RNG is readily available and reuses a portion of waste streams—potentially reducing methane emissions.[25] However, the supply of RNG is limited and is not an option for getting to zero emissions, so other solutions are needed.
Battery-electric vehicle (BEV) approaches appear feasible for fleets with return-to-base routes of under 200 miles and sufficient access to charging stations.[26] For HDTs, electrification remains a challenge due to the energy density and weight of batteries (vs. truck weight limits). Yet, early adopters are ordering and delivering only small numbers of early commercial BEV HDTs.[27]
Hydrogen (H2) is emerging as an option for zero-emissions vehicles, being used in an internal combustion engine (H2-ICE) or via fuel cells. Cummins has estimated that fuel cell vehicles are most efficient at low loads, whereas the H2-ICE is more efficient at higher loads.[28] This is important, as it influences powertrain optimization (e.g., higher efficiency at low loads suggests that oversizing the fuel cells or using hybridization could be a viable option).[29]
With either the EV or H2 option, the GHG and co-pollutant footprint will be influenced by the emissions associated with making electricity or hydrogen. Emissions related to how electricity (for EVs) or hydrogen (for FCEVs or H2-ICE) is produced drop as the electric grid is decarbonized. Wherever 100 percent zero-carbon electricity is available, the potential exists for EV charging and hydrogen production that is near zero emissions for GHGs and co-pollutants.
Powertrain
The powertrain is the collection of components that deliver mechanical energy from the energy source and engine to the wheels to make the vehicle go. For a vehicle with an ICE, the powertrain has hundreds of moving parts associated with the engine, transmission, and driveshaft, as well as engine cooling and exhaust systems. An EV can have 60 percent fewer powertrain components across the battery, DC-AC (direct current to alternating current) converter, electric motor, control, and thermal management systems.[30] A fuel cell-electric powertrain generates electricity as well, but from a fuel cell stack (assembly of membrane electrodes that use hydrogen and oxygen to produce electricity).[31]
Battery-electric powertrains have prevailed over hydrogen fuel-cell powertrains in LDV and medium-duty vehicle (MDV) segments due to weight, cost, and range considerations. But the winning solution for many HDV classes is still unclear. Factors such as daily use (part of the drive cycle and duty cycle—discussed later), the range required, cost, and truck weight will be the top factors determining which powertrain is more applicable. For example, some types of HDTs such as cement trucks have low average speeds and miles per measurement cycle, which may favor the battery-electric powertrain over the hydrogen fuel cell powertrain, despite their heavy gross weights. For long-haul trucks, hydrogen options may prevail due to the high weight of batteries, which exceed truck weight limits.
A Solutions Portfolio
Multiple factors influence choices for the energy source and powertrain, including driving range before refueling, weight, cost, and availability of refueling options. Hence, a range of solutions is needed across all fleets and MHDT uses.
The few commercially available or near-market-ready electric HDTs have significantly shorter ranges and longer refueling times than their ICE counterparts do (see table 1).[32] The base models of these battery-electric trucks typically have no more than 300 miles of range before recharging is needed. In contrast, an ICE truck tractor has an approximate driving range of 960 to 1,800 miles (assuming six mpg.[33] The range gap is significant for long-haul HDTs wherein a single driver could drive 400 miles in the legal hours of service, but a second- or third-shift driver could bring the total to 800 or 1,200 miles/day. The low range from battery-electric powertrains may make sense for HDTs with local and regional uses but not for HDTs driven cross-country in which the daily VMT driven exceeds the BEV range and where charging times may be over an hour (table 1).
Table 1: Selected battery-electric HDTs commercially available or near market-ready
|
Battery capacity (kWh) |
Charging |
Charging time |
GVWR |
Range (miles) |
|
|
Scania (Trailer Tractor and |
468 |
CCS2 375 kW/500 A DC |
<90 minutes at 375 kW (100 % charge) |
8 |
217 (80,000 lbs); 155 (128,000 lbs) |
|
Tesla Semi |
600 |
N/A |
120 minutes (from 20 % to 80 % charge) |
8 |
300 |
|
Volvo VNR Electric[36] |
565 |
250 kW |
90 minutes in a 6-battery configuration (80 % charge) |
8 |
275 |
|
BYD 8TT[37] |
409 |
CCS1 185 kW |
Regular version: 150 minutes (extended range version: 210 minutes) |
8 |
200 (extended range) |
|
Freightliner eCascadia |
291 |
N/A |
90 minutes to 80 % charged |
8 |
155, 220, or 230 |
For hydrogen-powered HDTs, ranges of 500 miles or more have been claimed.[39] Hydrogen-powered HDTs have an advantage, as they can travel further by adding more fuel—and the fuel addition versus driving range scales linearly (similar to ICTs). Conversely, the energy supply versus range scales exponentially for BEVs, decreasing the potential range faster.[40] BEVs may also need an oversupply of heavy batteries to compensate for battery degradation and susceptibility to lower power at lower temperatures.
DOE intends to expand the SuperTruck III program in its FY 2023 Budget Request; the five projects selected in 2021 will develop MHDTs with a mix of battery-electric and fuel cell powertrains—a promising sign that DOE is not betting on just one technology.[41] Still, a cursory search of the Sustainable Transportation Offices’ past Funding Opportunity Announcements revealed the prevalence of battery-electric-related projects.
Improvements in battery performance and lower costs would benefit BEV vehicles across multiple classes—including HDTs. The Vehicle Technologies Office (VTO) in DOE is the leading organization advancing battery RD&D—from the underlying chemistry to packaging.[42] VTO’s advanced cell chemistries program explores routes to higher energy densities, and there are programs to devise improved anodes, cathodes, and electrolytes. VTO is expanding efforts to eliminate cobalt and nickel in lithium-ion (Li-ion) batteries, and DOE’s Critical Minerals Institute is working to minimize supply chain dependencies and disruptions.[43] In parallel, the United States Battery Consortium is advancing battery storage technologies and their commercialization—including being the driving force for energy storage system goals.[44]
Fundamental Challenges: Energy and Gravimetric Density
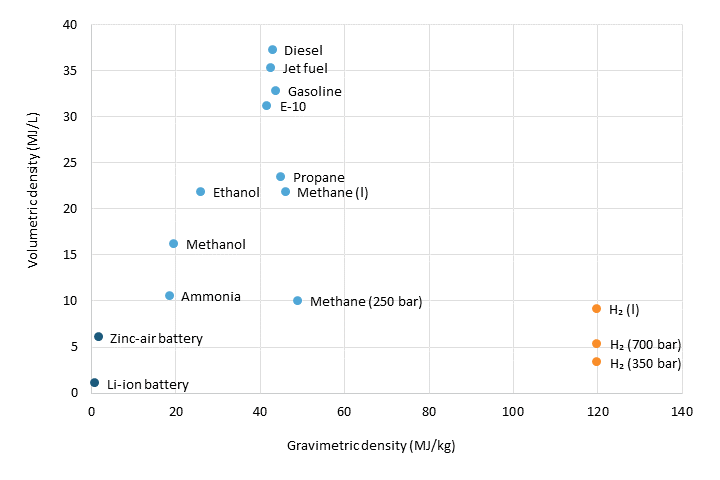
The energy density requirements of long-distance road transport present steep challenges for battery solutions.[45] Weight, as well as space (e.g., volume), is a significant consideration for HDTs, as their primary function is hauling goods—and there are weight limits. The gravimetric energy density helps compare the energy efficiency of fuels. The Li-ion battery has the lowest gravimetric energy density (megajoules/kilogram) compared with many standard fuels, whereas hydrogen has the highest gravimetric energy density (see figure 3).[46] Methane and hydrogen have higher gravimetric densities than does diesel, but as they have to be compressed from gaseous to liquid form to be space efficient, there are storage difficulties (pressurized H2 requires heavy storage tanks, liquid H2 requires extensive insulation to keep it cold, so it remains liquid).
The volumetric energy density is essential for comparing fuel storage space. Although the volumetric energy density of Li-ion battery packs increased by more than eight times from 55 watt-hours/liter (or 0.198 mol/liter) in 2008 to 450 Watt-hours/liter (or 1.62 mol/liter) in 2020, it is still far below the volumetric energy density of hydrogen (both liquid and compressed), ammonia, methanol, and gasoline and diesel (figure 3).[47]
Figure 3: Volumetric and gravimetric energy density of transportation fuels[48]
Although the theoretical gravimetric energy density limit of Li-ion batteries (and advanced batteries such as zinc-air batteries) could reach gravimetric parity with non-battery powertrains, realistically, the attainable energy densities are considerably lower (e.g., 350 Wh/kilogram to 500 Wh/kg for zinc-air batteries).[49] Other factors, such as temperature and battery capacity degradation, lower the range, performance, and durability.
Although battery-powered electric trucks may exceed the weight limit by 2,000 pounds (such that the GVWR becomes 82,000 pounds for a Class 8 vehicle) under Sec. 422 of the Consolidated Appropriations Act of 2019 (23 U.S.C. 127(s)), this weight exemption is insufficient to offset the heavier battery-electric powertrain.[50] This puts a weight constraint on the ability of batteries to supply power for Class 8 HDTs.
Box 1: Gravimetric Density Illustrated
For HDTs, gravimetric density is more important than volumetric density due to the maximum gross weight limit of the vehicle class. Figure 4 illustrates the maximum payloads by battery capacity. Using data from table 1, near market-ready HDTs have an energy consumption of about two kWh per mile, so a battery-electric powered HDT would need a 2,880-kWh battery capacity to have an equivalent driving range of 1,440 miles. An analogous battery-electric powered truck’s battery system—assuming a gravimetric energy density of 250 Wh/kg—would weigh more than 24,000 pounds. This is three times the weight of the diesel version and would reduce the payload by 18,000 pounds. To maintain a similar maximum payload and driving range, the battery would need to attain a gravimetric density of about 1,200 Wh/kg, which is not likely by 2050 at the current pace of battery innovations. Simulations suggest that by 2050 the powertrain of a GVWR Class 8 sleeper cab would be comparable to the fuel cell hydrogen version. In contrast, the weight of the BEV version would still be heavier by 2,000 and 5,000 pounds for the 500- and 750-mile range versions, respectively.[51]
Figure 4: Battery capacity by battery gravimetric density and maximum payload versus a diesel-powered HDT[52]
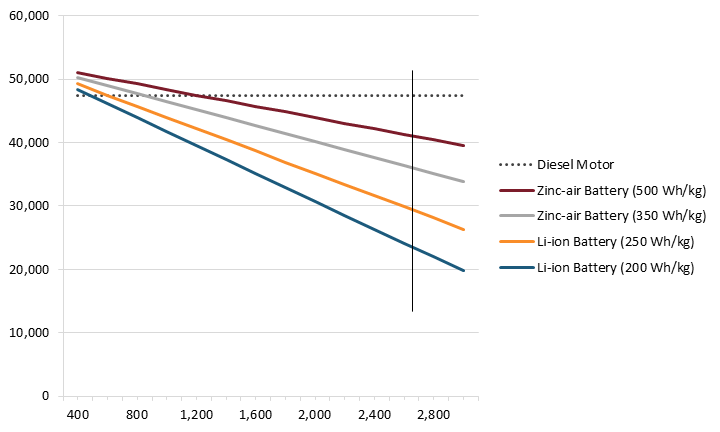
At 6 mpg, a diesel powered HDT with two 120-gallon fuel tanks can drive 1,440 miles. At a consumption rate of 2 kWh/mile, a battery-electric HDT would need a battery capacity of 2,880 kWh to have an equivalent range. But consumption rate actually increases as the battery becomes heavier; recent literature tends to assume higher consumption rates.
Hurdles and Innovation Potential
Costs
Reducing the cost of BEV and FCEV HDTs to be on par with or below that of diesel HDTs remains the biggest challenge to widespread global adoption. The cost of several battery chemistries for BEVs has dropped significantly, but for HDTs, they are not yet at P3, so there’s more RD&D and implementation innovation required.[53]
There are two cost-parity points to consider: 1) the cost to purchase the HDT and 2) the TCO, which includes operating costs such as maintenance and fuel. The initial cost hurdles reflect the cost of batteries or fuel cell components and associated controls, thermal regulation, storage, etc. There are opportunities in the initial cost and TCO for innovations to reduce costs so they’re comparable to the incumbent diesel-fueled trucks.
Purchase Costs of HDTs
Figure 5 shows the purchase cost of a Class 8 day cab (truck tractor) with diesel, BEV, and FCEV powertrains. The vehicle specifications for BEV and FCEV are based on models currently for sale or in demonstration. The glider is the starting frame of the vehicle before the powertrain and engine are added. It can feature refurbished engines and powertrains or serve as a foundation for newer componentry—such as being outfitted with FCEV or EV systems.[54]
Figure 5: Purchase cost of a Class 8 day cab by powertrain[55]
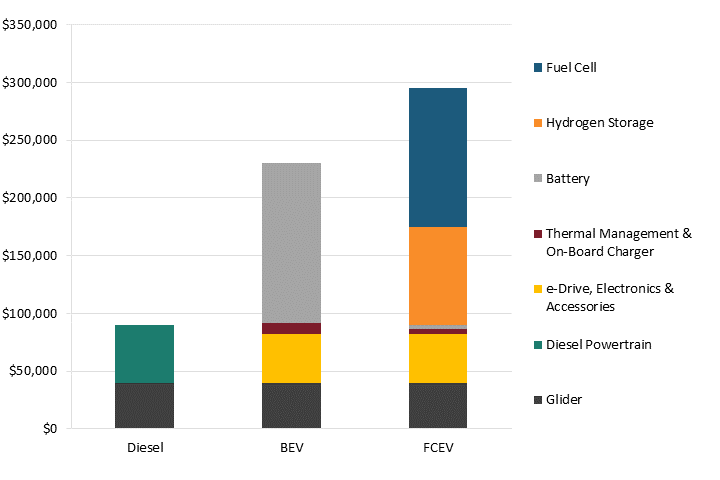
Based on 2020 data for the BEV truck, the battery is the most significant cost component at about three times the cost of the diesel powertrain. For the FCEV truck, the fuel cell stack and hydrogen storage are the largest cost components, with the combined costs being about four times the cost of the diesel powertrain. DOE has cost reduction targets for batteries ($60/kWh by 2030), fuel cells ($30/kW by 2030), and hydrogen storage ($8/kWh to $9/kWh).[56] But these cost targets don't necessarily mean that cost parity has been achieved. For example, the cost target for batteries used to be $100, and then the goalposts were gradually moved lower to $80 and then $60. But evidence of progress toward these goals and P3 is difficult to find. This is also the case for hydrogen storage and fuel cells.
Although these targets reflect more ambitious goals compared with previous cost targets, the BEV and FCEV powertrains would still be more expensive than the diesel equivalent. Using the specifications from figure 5, the cost of the battery for BEV and hydrogen storage plus the fuel cell stack for FCEV would be comparable to the cost of the diesel powertrain. But the other components (e-drive, electronics, accessories, thermal management system, onboard charger) also cost about the same as the diesel powertrain, which does not have any of these added components. DOE does not have targets for these components.
With these targets, will EVs or FCEVs be able to meet cost parity? Scenarios for several EV options (hybrid, plug-in hybrid, full battery) suggest that parity ultimately can be achieved (e.g., beyond the intermediate targets) for long-haul trucks depending on driving distances.[57] The hybrid and plug-in hybrids provide additional options for the challenging use cases of HDTs, and according to one simulation, both show lower operating costs than do BEVs or FCEVs,[58] The interim $80/kW target for fuel cells will not result in parity either, but the ultimate target holds the promise of parity. The cost of a fuel cell powertrain is projected to be below the $25,000 price of a diesel engine, including emissions mitigation once the ultimate target of $60/kW is reached.[59]
Fuel Costs
Fuel is the most significant component of TCO. The fuel cost of battery electricity is comparable to diesel fuel, but the cost of hydrogen is still higher than that of diesel. The cost of electricity is not constant and varies by geography and country, so the cost of electricity to recharge batteries will also vary. The long-term pricing horizon toward net zero is also important. The International Energy Agency (IEA) has projected that, as the share of spending on electricity increases (going from 45 to 80 percent of total energy spending from 2020 to 2050 respectively), electricity prices may double.[60]
Today, clean hydrogen produced from electrolysis typically costs more than $5 per kg (that’s around five times the price of hydrogen from the incumbent steam methane reformers, or SMRs), and is sensitive to energy prices. In 2021, DOE launched the Hydrogen Shot to reduce the cost of clean hydrogen to $1/kg by 2030.[61] To reach a breakeven point, the price of clean hydrogen would need to be $1.50/kg to be at parity with SMRs, but there are multiple factors to consider, such as the incumbent price of diesel, miles driven, and maintenance costs.[62] One kilogram of hydrogen has about the same energy as a gallon of diesel, but as electric drive trains are more efficient than ICEs, the miles-per-gallon equivalent for FCEVs could be up being to three times that of a diesel HDT.[63]
Other Costs
Other costs contributing to TCO include repair and maintenance, payload capacity, dwell or idling time waiting for the truck to be loaded/off-loaded, and time out-of-route mileage spent looking for fuel. (Dwell and idling time are indirect costs. The time spent on refueling or recharging the truck is longer for BEV than for FCEV, and longer for FCEV than for diesel. The time lost would otherwise be used to move goods around and generate more revenue.) With substantially shorter ranges, the BEV and FCEV trucks would have substantially higher time and off-route mileage spent looking for and loading fuel (see table 2). It’s expected, though, that maintenance and costs will be lower for BEV and FCEV, as there are fewer moving parts than in diesel HDTs.
These clean alternative options need to be near parity on not just the acquisition costs of the trucks but also on other costs that make up TCO. Putting these costs together, BEV and FCEV trucks are significantly more expensive than diesel trucks, as shown in figure 6 and figure 7.
Figure 6: Total cost of ownership of a 2020 Class 8 sleeper cab tractor[64]
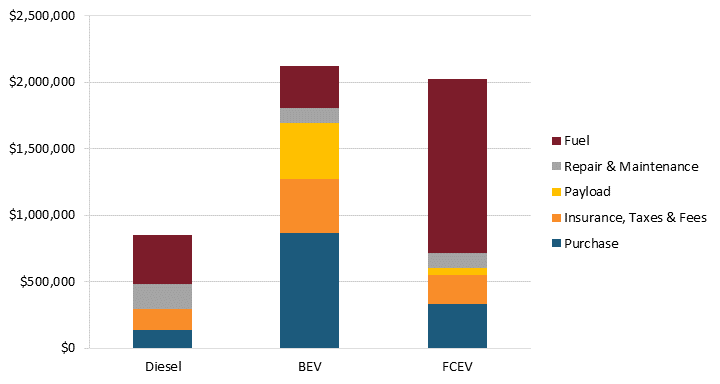
Figure 7: Total cost of ownership of 2025 scenario Class 8 single-shift and multi-shift long haul tractors[65]
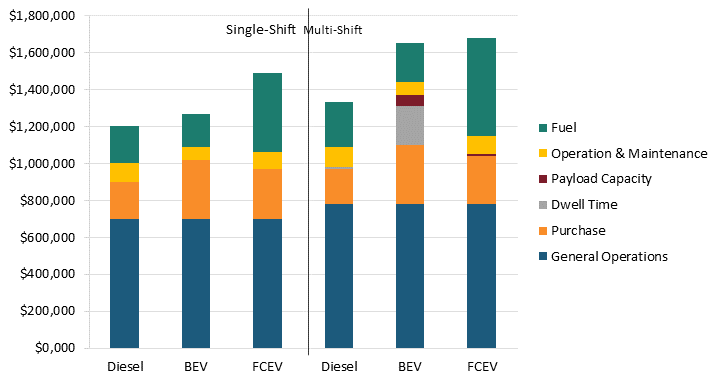
This recent comparison by Argonne National Lab (ANL) shows that both BEVs and hydrogen fuel cell electric vehicles (FCEV) are nowhere near cost parity—adding over $1 million over the vehicle’s lifetime—for Class 8 Sleeper Cabs in 2020 (figure 6). For long-haul tractors, both BEV and FCEV are also not expected to be at cost parity by 2025 (figure 7). But these models rely on assumptions on infrastructure and fuel prices.[66] The cost ranges are wide due to uncertainties in parameters thanks to missing real-world data.
The models also have high uncertainties, as available data on the HDT drive cycle and TCO could be of better statistical quality. Improving the data quality by addressing data gaps and resolving confounding definitions across agencies is a key challenge.
Refueling Stations and Infrastructure
Between FY 2016 to FY 2021, DOE awarded $161 million across 35 projects related to smart charging, fast charging, wireless charging, and other charging-related projects. However, only a few projects related to hydrogen refueling were funded, totaling less than $10 million.
For charging stations, in addition to fast-charging and smart-charging requirements, DOE needs to consider gaps in power requirements, multiple output voltage requirements, and auxiliary energy management systems. HDTs have significantly higher power requirements than LDVs. The power needs for fast charging of long-haul trucks are 67 times that of passenger cars (e.g., 1 MW for trucks vs. 150 KW for vehicles). Facilities that handle cars and truck EVs—such as freeway or turnpike charging stations—may need upwards of 19 MW. That’s enough power for 14,250 homes. In addition, a battery-electric-powered HDT may have several batteries with different voltages (e.g., a 12 V battery for auxiliary needs in addition to the main 48 V battery).
Interoperability is also an important area for innovation. The MHDT market reflects proprietary protocols, the highly diverse uses, and variety of connector plug types. The different incentives for software and communications at charging stations that have evolved can confound truck drivers and be inefficient, which may add to refueling times. Standardization of connector plugs, procedures for sharing chargers (e.g., real-time reservation systems), open standards, and smart charging reflecting the most cost-effective times to refuel (e.g., peak/off-peak electricity charges) would be beneficial. CharIN’s launch of a megawatt fast charging connector for MDTs and HDTs signals progress here. It’s capable of DC charging of up to 3,750 kW in about 30 minutes (giving HDTs a 200-mile additional range).[67]
Having a robust refueling infrastructure is complementary to driving costs down. Yet, until low-carbon solutions get close to P3, the solution that best fits MHDT classes is clear—a measured, experimental, and learning approach is needed on infrastructure.
Only a handful of locations nationwide offer the MW power service required to recharge long-haul BEV HDTs. By comparison, there are 125,500 level-2 and 20,400 level-3 chargers (which can charge a passenger car in about 20 minutes) nationwide, and even that capacity needs to grow eight times by 2030.[68] Long-term planning will be needed for the capacity growth, as siting, permitting, and construction of facilities can have lead times of years.
DOE has supported several projects for BEV HDTs with the connection to charging stations, a selection of which is shown in table 2. Several projects focus on refueling stations along HDT corridors, which focuses the learning wherever there is the highest frequency of use.
Despite these efforts, however, most of the funding shown in table 2 goes to BEV charging infrastructure ($58 million), not FCEV refueling infrastructure ($2 million). Moreover, the current strategy assumes all vehicles from the same vehicle class by GVWR are the same and ignores broader use cases.
Table 2: Selection of DOE programs for HDVs and refueling infrastructure
|
DOE Office |
FOA[69] |
Description |
DOE funding |
FY |
|
VTO |
SuperTruck III |
PACCAR will develop 18 Class 8 battery-electric and fuel cell vehicles with advanced batteries, and a megawatt charging station will also be developed and demonstrated. |
$32,971,041 |
2021 |
|
VTO |
SuperTruck III |
Volvo Group NA will develop a 400-mile-range Class 8 battery-electric tractor trailer with advanced aerodynamics, electric braking, EV-optimized tires, automation, and route planning. A megawatt charging station will be developed and demonstrated. |
$18,070,333 |
2021 |
|
VTO |
Open Topic[70] |
Utah Clean Cities: Supporting Electric Vehicle Infrastructure Deployment Along Rural Corridors in the Intermountain West |
$670,000 |
2019 |
|
HFTO |
Energy Production and Hydrogen Fuelling |
Autonomous Hydrogen Fueling Station |
$1,997,216 |
2018 |
Table 2 shows three major issues with DOE’s current approach. First, most of the funding from this list goes to BEV charging infrastructure ($58 million), while funding for FCEV refueling infrastructure ($2 million) is a comparably paltry amount. Second, the current strategy does not consider broader use cases. DOE’s portfolio is based on vehicle gross weights and does not take actual needs into account. For example, while a battery-electric option may be sufficient for a Class 8 cement truck that operates in a single shift and travels locally within a construction site, the same option is likely insufficient for a Class 8 combination truck that travels long distances daily. Finally, DOE needs more emphasis on HDTs versus MDTs, given the message of solving the more challenging issues that are present in heavy vehicles and cascading the results back to lighter vehicles. Solving these three issues means pushing for price parity and requires significantly more resources.
For hydrogen refueling of MHDTs, the infrastructure is at an earlier stage. There are 107 hydrogen refueling stations nationwide, the vast majority of which are in California, plus one in Hawaii. It takes about 15 kg of hydrogen for an HDT to go 100 miles.[71] Therefore, a driving range of 800 miles requires 120 kg of hydrogen. Approximately 80 percent of the hydrogen refueling stations in place have a capacity of 150–200 kg. For MHDTs to effectively utilize the current or future hydrogen refueling infrastructure, the capacity at the stations and space for the trucks to enter the station and fill up would need to increase. Research is needed on where to locate these refueling stations nationwide with sufficient capacity strategically. California is using a “beachhead” approach for refueling: starting with lighter vehicles and progressing toward heavier vehicles.[72] For EV and hydrogen, it’s essential to support R&D to minimize refueling times and operating costs with interoperability.
The Investment in Infrastructure and Jobs Act (IIJA) provides $5 billion for a national refueling infrastructure of EVs and hydrogen vehicles. DOE recently announced $7.4 million in funding—a drop in the bucket—for the initial buildout of refueling infrastructure for BEVs and FCEVs, including refueling stations for MHDTs along three heavily trafficked corridors. Leveraging the advances from this start will be vital to driving additional cost reductions and expanding adoption.[73] Kampshoff et al. estimated that the nation will need more than $35 billion through 2030 to install a national charging infrastructure, so there’s a long way to go on this implementation journey.[74]
Ultimately, DOE needs more emphasis on HDTs than on MDTs, given the message of solving the harder, heavier issues and cascading the results back to lighter vehicles. Solving these issues means there is a need both to push for price parity and for more funding. Based on the deficiencies in funding level and lack of both use case consideration and focus on the largest vehicles, the report proposes $150 million in additional funding to fill these gaps.
Battery and Fuel Cell Chemistry
The race is on to develop new battery chemistries and materials to meet growing demand while minimizing critical materials.[75] In addition to batteries with standard electrolytes, solid-state batteries are an emerging option. They’ve gained a foothold in applications such as pacemakers and wearables and have the advantages of higher energy density, faster charging, and stability.[76]
Battery-electric HDTs may have different battery chemistries, pack configurations, sizes, and rated voltages. These differences lead to different charging rates and voltages. Although this may not warrant R&D needs, failure to address these issues would likely impede long-term adoption.
The choices for battery chemistry are influenced by the content of “critical minerals” (for EV batteries, this means lithium, cobalt, nickel, manganese, and graphite) as there is an elevated risk of supply chain disruption.[77] Some mining of the first three elements occurs in the United States but not the latter two. Over 70 percent of battery production is in China, where the supply of minerals has back integration. The Biden administration supports increased domestic supply chains for batteries, easing some of the battery chemistry limitations. However, there are also limitations on the domestic availability of battery components (cathodes, anodes, current collectors, and electrolyte salts) as China has up to 80 percent market share for a number of these components.[78]
Like battery chemistry choices, there are multiple fuel cell options, including proton exchange membranes, molten carbonate, and solid oxide fuel cells (SOFC).[79] The state of advancement for fuel cells is less mature than batteries presenting opportunities for substantial innovation. Also, hydrogen storage and leakage are RD&D areas that need to be addressed for large volumes, as is expanded storage (e.g., in salt domes) that will be considered for hydrogen playing an expanded role in the clean energy transition.[80]
Spillover Potential
Innovations that yield increased efficiency, lifetime, and performance (e.g., gravimetric or volumetric density that improves vehicle range) for EVs and hydrogen-equipped vehicles have cascading potential that can be leveraged for other vehicle classes. For example, advances in EV battery chemistry and related technology have extended the range of what’s possible for light and medium-duty trucks. Advances in the performance targeting MHDTs could also benefit the LDV classes. And advances in the numerous systems-engineering challenges associated with MHDTs could spill over to LDVs. A study of alternative-fueled vehicles explored the spillover potential between light-duty and heavy-duty segments in battery packs and fuel cell packs.[81] The simulations showed that technology spillover “reduces the operational cost for PEVs and FCEVs, making both powertrains more competitive in the market.”[82] They also found that spillovers significantly decrease infrastructure costs and could be particularly impactful for the HD segment due to its sensitivity to operational costs.
Funding
RD&D investments for decarbonizing HDTs are disproportionately low relative to their GHG emissions. The SuperTruck III program (2021–present) is currently DOE’s largest initiative for HDTs. Yet, the SuperTruck III funding of $127 million is 32 percent lower than the original SuperTruck program ($187 million; 2010–2016). DOE did not focus on zero-emission trucks until 2021 (previous programs focused on freight efficiency and brake thermal efficiency of diesel-powered trucks.)
Outside the SuperTruck program, electrifying HDTs has not been a DOE priority, as evidenced by the lack of similar programs within its Sustainable Transportation Program offices: Vehicle Transportation Office (VTO), Bioenergy Technologies Office (BETO), and Hydrogen and Fuel Cell Technologies Office (HFTO).
Similar to its approach to refueling infrastructure, DOE’s overall portfolio suffers from the same shortcomings. First, the portfolio tilts heavily toward battery electric, even though current literature suggests that may not be sufficient for use cases that require long haul. Second, the portfolio is based on vehicle gross weights and does not take actual use cases into account. Third, DOE needs more emphasis on HDTs than on MDTs and LDVs given the message of solving the harder, heavier issues and cascading the results back to lighter vehicles. Finally, the portfolio fails to focus on reducing the costs of components (drive, electronics, accessories, thermal management system, onboard charger) that make up a sizable portion of the BEV and FCEV tractor-truck- costs.
This report recommends an additional $150 million be allocated to address these issues.
Recommendations
To be able to attain P3 for HDVs, significant increases in RD&D support are needed with an emphasis on solving challenges across the multiple systems involved in alternative-fuel vehicles. Not only could solving these challenges help decarbonize trucking around the world, but it also has the potential for technology spillovers into other vehicle classes—and even beyond.
Several areas within the DOE and the Department of Transportation’s (DOT’s) transportation portfolios stand out as areas where increases in RD&D support are needed. Key recommendations include the following:
1. The entire HD trucking RD&D program needs significantly increased funding considering the magnitude of the potential reductions (CO2, NOx, particulates), technology gaps, and the potential for technology spillovers. This report recommends an additional $150 million to address these issues.
2. Areas for prime focus of expanded support for RD&D:
a. Battery-electric increased performance is needed to expand the vehicle range while at the same time decreasing the content of critical minerals. Improved durability and controller and thermal management system performance is also needed.
b. Fuel cell and hydrogen options need increased funding, as they’re likely prime solutions for long-haul HDTs. Increased efficiency of fuel cells, overcoming cell degradation, improving durability and lifetime, and studying hydrogen leakage from storage, use, and transportation are all areas for expanded R&D.
c. The scope of the DOEs SuperTruck III program should include more-advanced powertrain systems and use cases.
3. The U.S. government should support continuous inter-agency collaborations, including the development of common vehicle classifications and metrics for evaluating carbon emissions/efficiency.
4. The U.S. government should periodically conduct a comprehensive study to close data gaps on VMT, drive and duty cycle, and TCOs. DOE and DOT should leverage the revived Vehicle Inventory Use Survey (VIUS) to provide accurate, field-level data to address the high uncertainties of multiple variables contributing to TCOs to ensure that product design specifications for low-carbon options hit the right performance and cost targets.
Appendix 1: Tabulations of HDT Subsector’s GHG Emissions
EPA does not report emissions from MDTs and HDTs separately. Instead, tabulation of the HDT subsector’s GHG emissions is based on the following publicly available data source: the coefficient of emissions by fuel data from DOE’s Energy Information Administration (EIA) and VMT and fuel consumption data from the Federal Highway Administration’s (FHA’s) Highway Statistics Series and Oak Ridge National Laboratory’s (ORNL’s) Transportation Energy Data Book (TEDB).
Emissions for on-road transportation are calculated by multiplying the domestic consumption of transportation energy by mode and fuel type by the emissions coefficients by fuel. Table 3 summarizes the tabulation of GHG emissions for on-road transportation by category and compares these emissions against EPA’s for accuracy. However, EPA defines MHDTs as Class 2b—Class 8 vehicles by GVWR—whereas ORNL’s data defines MDTs as Class 3–6 vehicles by GVWR. As a result of this difference, exact comparisons between the EPA’s data and this report’s estimates are challenging.
Table 3: GHG emissions comparison by on-road transportation subsector, MMTCO2e[83]
|
On-Road Transportation Subsector |
Gasoline |
Diesel |
LPG |
Total |
EPA |
Difference |
|
|
LDVs |
1,034.5 |
33.7 |
3.5 |
1,071.7 |
1,090.5 |
-18.8 |
|
|
Buses |
0.7 |
13.8 |
0.0 |
16.0 |
21.7 |
-5.7 |
|
|
MHDTs[84] |
44.3 |
414.9 |
1.3 |
460.6 |
439.5 |
21.1 |
|
|
MDTs |
40.8 |
58.1 |
1.3 |
100.2 |
-- |
-- |
|
|
HDTs |
3.5 |
356.8 |
0.0 |
360.4 |
-- |
-- |
|
In addition, ORNL notes that numerous instances of inadequacies and inaccuracies in the basic data are encountered. Overall, for total transportation GHG emissions (on-road, off-road, and pipeline), the difference between EPA’s data (1,830.9 MMTCO₂e) and the tabulation in this report (1,883.1 MMTCO₂e) is 52.2 MMTCO₂e, or 2.8 percent, which is slightly smaller than the difference between EPA’s data and ORNL TEDB’s estimates using data from EIA’s Monthly Energy Review (4.6 percent).[85] ORNL notes a few plausible reasons for the differences, such as the treatment of international bunker fuel, nonfuel use of fossil fuels, and the agencies’ use of different fuel consumption control totals.
Appendix 2: 2002 VIUS, 1997 VIUS, and 1992 TIUS Comparison (Selected Statistics)
For MHDTs, ORNL TEDB’s estimates of the subsector’s fuel use and fuel type shares (as discussed in appendix 1) are the same from 2002 onwards based on data from the 2002 VIUS.[86] The 2002 VIUS is a probability sample of private and commercial trucks registered (or licensed) in the United States as of July 1, 2002. A sample of about 136,113 trucks was surveyed to measure the characteristics of nearly 89 million trucks registered in the United States. The VIUS excludes vehicles owned by federal, state, or local governments; ambulances; buses; motor homes; farm tractors; unpowered trailer units; and trucks reported to have been disposed of prior to January 1, 2002.[87]
As noted in the Data Gap section of this report, the 2002 VIUS data may be outdated; more up-to-date data is urgently needed to improve the economic analysis of the current landscape. (Also note that VIUS—and formerly Truck Inventory Use Survey, or TIUS—was conducted every five years as part of the economic census, and ORNL TEDB interpolates estimates for interim years.) The purpose of these selected statistics is to illustrate the significant changes in trends from 1992 to 2002 and to signal the potential caveats of extrapolating data based on these trends or assuming 2002 VIUS characteristics for post-2002 data points.
For example, HDTs weighing over 60,000 pounds made up an increasingly higher share of the annual VMT of all HDTs over time, from 65 percent in 1992 TIUS to 77 percent in 2002 VIUS (table 4). On the other hand, the VMT share of HDTs weighing between 40,001 to 60,000 pounds dropped from 22.1 percent in 1992 TIUS to just 14.5 percent in 2002 VIUS. Based on linear extrapolation, one might conclude that the VMT share of HDTs weighing over 60,000 pounds would be nearly 100 percent by 2022—which is very unlikely.
Table 4: Annual VMT (millions) by average vehicle weight (pounds) for HDTs[88]
|
Average Weight (Pounds) |
2002 VIUS |
1997 VIUS |
1992 TIUS |
|||
|
26,001 to 33,000 |
5,845 |
5.4% |
7,093 |
6.0% |
5,694 |
6.9% |
|
33,001 to 40,000 |
3,770 |
3.5% |
6,594 |
5.6% |
5,285 |
6.4% |
|
40,001 to 50,000 |
6,698 |
6.2% |
13,078 |
11.1% |
9,622 |
11.6% |
|
50,001 to 60,000 |
8,950 |
8.3% |
12,653 |
10.7% |
8,699 |
10.5% |
|
60,001 to 80,000 |
77,489 |
72.0% |
74,724 |
63.4% |
51,044 |
61.6% |
|
80,001 or more |
4,850 |
4.5% |
3,790 |
3.2% |
2,489 |
3.0% |
|
Total HDTs |
107,602 |
100.0% |
117,931 |
100.0% |
82,832 |
100.0% |
2002 VIUS has more observations “not reported” compared with 1997 VIUS and 1992 TIUS, while 1997 VIUS has more observations “not reported” compared with 1992 TIUS (table 5) for HDTs in the set of questions pertaining to trucks by vehicle size. That is, no information was obtained for a survey question soliciting a response other than an item response (e.g., VMT) or a unit response (e.g., a respondent did not return the survey questionnaire) where a nonresponse was imputed or reweighted, respectively. For example, a respondent who did not indicate the type of business in which the sampled truck was used would be included in the estimate for the ‘‘not reported’’ category.[89] The share of responses not reported differs by question but were generally higher for 2002 VIUS than 1997 VIUS or 1992 TIUS. The characteristics of the trucks for which information was obtained may differ significantly from trucks for which no information was obtained. This means caution should be exercised when interpreting these estimates.
Table 5: Percentage of responses of HDTs not reporting for selected questions on trucks by vehicle size[90]
|
2002 VIUS |
1997 VIUS |
1992 TIUS |
|
|
Major use |
5.1 % |
<0.05 % |
<0.05 % |
|
Primary range of operations |
16.6 % |
0.9 % |
0.7 % |
|
Fuel economy (mpg) |
18.5 % |
7.8 % |
3.7 % |
|
Hazardous materials carried[91] |
10.5 % |
10.3 % |
0.9 % |
|
Refuelling location |
5.4 % |
5.7 % |
3.7 % |
|
Vehicle acquisition |
8.1 % |
0.9 % |
0.7 % |
|
Total HDTs (thousands) |
2,590.9 |
2,535.7 |
2,016.6 |
The VIUS has been the principal data source on the physical and operational characteristics of trucks. After two decades of hiatus, a new VIUS is being conducted in partnership with the Federal Highway Administration (FHWA), DOE, and US Census Bureau. The new VIUS will serve two important purposes: 1) guide investments in transportation infrastructure and vehicle technologies parts, and 2) evaluate truck safety needs, emission estimates, and conservation practices. DOT plans to release the data for the new VIUS in fall 2023.[92]
Appendix 3: Overview of DOE’s SuperTruck Program
Appropriations from the American Recovery and Reinvestment Act (ARRA 2009) helped kick off the SuperTruck program (SuperTruck I), which ultimately culminated in four projects. ARRA funded two projects (Cummins-Peterbilt and Daimler) while the other two projects (Volvo and Navistar) were funded by regular DOE appropriations.) SuperTruck I was very successful: All four project teams met or exceeded the main objectives and the program resulted in at least 21 successfully commercialized technologies, with more in the pipeline.[93] Building on SuperTruck I’s tremendous success, DOE launched SuperTruck II in 2017 to further efficiency gains and additionally focus on cost effectiveness.
But the focus only shifted to electrification in SuperTruck III, which commenced in 2021. SuperTruck III also expanded to trucks with lower gross weight, whereas SuperTruck I and SuperTruck II were limited to only Class 8 trucks. Table 6 summarizes the main objectives, investment amounts, results (or potential impacts for ongoing projects), and the applicable truck classes of SuperTruck.
Table 6: DOE SuperTruck I-III Program Summary[94]
|
SuperTruck I |
SuperTruck II |
SuperTruck III |
|
|
Main Objectives |
Improve freight efficiency by 50% and achieve 50% brake thermal efficiency (BTE) relative to a 2009 model year Class 8 tractor trailer and show a technical pathway to achieve 55% break thermal efficiency |
Improve freight efficiency by greater than 100% and achieve at least 55% BTE at 65 mph relative to a 2009 model year Class 8 tractor trailer and develop cost-effective efficiency technologies |
Develop battery-electric and fuel cell medium- and heavy-duty trucks and freight system solutions |
|
DOE Investment Amount |
$187 million awarded across nine teams (with 50 % cost sharing) |
$107 million awarded across five teams (with 50 % cost sharing) |
$127 million awarded across five teams (with 50% cost sharing) |
|
Results and Impacts |
As of June 2016, 21 technologies were successfully commercialized, and another 39 additional technologies have had the potential to succeed in the market within the next ten years. |
Cummins demonstrated the 55% BTE goal while other teams are verifying. Also, the teams expect to exceed the 100% fright efficiency improvement goal in their 2022 Annual Merit Review presentations. |
N/A |
|
Applicable GVWR |
Class 8 |
Class 8 |
Class 4–8 |
Appendix 4: Department Of Transportation FHWA’s 13-Class Vehicle Classification System
Whereas GHG emissions data for vehicles is grouped by eight gross vehicle weight rating (GVWR) categories, DOT’s FHWA uses the 13-class system, as described in its Traffic Monitoring Guide.[95] The FHWA 13-class system is grouped by whether a vehicle carries passengers (Classes 1–4) or commodities (Classes 5–13), and a non-passenger vehicle (trucks) is further subdivided by whether it is single-unit (Classes 5–7) or combination (Classes 8–13) and the number of axles in contact with the road (floating axles are only counted when in the down position.) A combination truck is further subdivided by the presence of single (Classes 8 and 10), semi (Class 9), or multiple trailers (Classes 11–13). Table 7 presents the general description and definition of trucks as well as the general mapping to the GVWR class system.
Table 7: FHWA 13-class system for trucks[96]
|
Class |
General Description |
Definition |
|
5 |
Single-unit trucks (GVWR 3–8) |
2-axle, 6-tire, (dual rear tires), single-unit trucks |
|
6 |
3-axle, single-unit trucks |
|
|
7 |
4 or more axle, single-unit trucks |
|
|
8 |
Combination trucks, single-trailer (GVWR 7–8) |
3- or 4-axle, single-trailer trucks |
|
9 |
5-axle, single-trailer trucks |
|
|
10 |
6 or more axle, single-trailer trucks |
|
|
11 |
Combination trucks, multi-trailer (GVWR 7–8) |
5 or less axle, multi-trailer trucks |
|
12 |
6-axle, multi-trailer trucks |
|
|
13 |
7 or more axle, multi-trailer trucks |
FHWA commissioned a study in 2021 that attempts to link the FHWA 13-class system with the GVWR 8-class system (referred to as the National Highway Traffic Safety Administration-8 or NHTSA-8 classification system) with an assortment of variables such as vehicle body type, powertrain configuration, rear axle type, GVW, fuel type, engine size, engine displacement, and wheelbase.[97] (The study also discusses the FHWA 6-class system and the NHTSA-14 system, which are the condensed and expanded versions of the FHWA 13-class system and the NHTSA-8 system, respectively.) Using the 2017–2019 vehicle registration data, the study demonstrates that observations in the vehicle registration data set can be assigned to a vehicle class in the FHWA 13-class system and the GVWR 8-class system, with some limitations. Specifically, the FHWA 13-class system is based on physical characteristics (e.g., number of tires and axles) and usage (e.g., presence of lifted axles or attached trailer) of a vehicle, whereas vehicle classification as registered depends only on its physical characteristics.
Fundamentally, it should not require having an elaborate methodology to determine the crosswalk between these two vehicle classification systems—not only is it time consuming but it leaves room for errors in estimations. Ideally, the new VIUS survey should contain information that allows researchers and data users to easily determine the class of a vehicle based on both classification systems.
Appendix 5: Total Cost of Ownership: Battery-Electric Long-Haul HDT and Fuel Cell Hydrogen Long-Haul HDT
The hardest type of HDTs to decarbonize is likely GVWR Class 8 combination trucks for long-haul purposes. (This means sleeper cabs, as day cabs are designed for short hauls.) In addition, the zero-emission HDT market is nascent, which means publicly available data on TCOs of HDTs of all use cases are scant. Therefore, this subsection draws on existing literature in the discussion of the battery-electric and fuel cell hydrogen powertrains’ TCO for these trucks.
Purchase costs: While leasing could be feasible, previous literature models TCOs assuming the consumer purchases the truck. For a sleeper cab tractor with a driving range of 500 miles, Hunter et al. and Burnham et al. found that the purchasing cost of a fuel cell hydrogen version to be 43 percent and 62 percent lower, respectively, than the battery-electric version under current technologies.[98] The purchase costs of the fuel cell hydrogen version are about the same in both studies ($329,000 and $359,511, respectively) but vary greatly for the battery-electric version ($579,000 versus $949,389, respectively).[99] Technological innovations are expected to significantly drive down the purchase costs, but the costs decline faster for the battery-electric version (6 percent to 15 percent CAGR) than for the fuel cell hydrogen version (4 percent in both studies). However, by 2025, the battery-electric version is still expected to cost more than the fuel cell hydrogen version.
Fuel costs: Contrary to purchase costs, fuel costs are significantly higher for the fuel cell hydrogen version than the battery-electric version under current technologies—up to half of TCO under current technologies. While fuel costs are projected to decline faster for the fuel cell hydrogen version than the battery-electric version, they are still the largest component of TCO (outside driver compensation) for the fuel cell hydrogen version.
Payload capacity costs: The truck weight plus the payload (cargo) make up the truck’s gross weight. Since trucks are bounded by the maximum GVWR, a heavier truck weight means a decreasing allowable payload. This represents a potential loss (indirect cost) to the truck owner or operator and thus a cost component of TCO. The payload capacity costs predominantly impact the battery-electric version, as it is proportional to the battery size (and weight). However, these costs are hard to predict, as a truck does not always travel with the maximum GVWR. A more detailed discussion of payload and powertrain weight is provided in the Data Gaps section of this report.
Dwell time costs: Dwell time refers to the on-duty time a truck is not in transit moving goods. These indirect costs are incurred from charging or refueling. Furthermore, carriers typically charge dwell time costs imposed on them to account for unproductive driver labor hours. Similar to payload capacity costs, they also primarily impact the battery-electric version and are hard to predict. However, the fuel cell hydrogen version may also incur these costs too if the driver spends a significant amount of time searching for a hydrogen refueling station (such costs are called “time and out-of-route mileage costs”) A more detailed discussion of charging and refueling gaps can be found in the Data Gaps section of this report. Unlike payload capacity costs, however, dwell time costs are not expected to decrease significantly over time, perhaps due to the physical limitation of charging times.
Of these five powertrain-related costs, the battery-electric version is expected (in the short and medium terms) to have a higher cost in all components except for fuel costs. Yet, because the cost of hydrogen is expected to remain high (even with technological innovations), the overall TCO is expected to be lower for the battery-electric version by 2025 and 2030 in both studies. TCO for the fuel cell hydrogen is highly susceptible to the changing cost of hydrogen; therefore, it is imperative for DOE to continue to champion the Hydrogen Shot and facilitate RD&D projects that drive down the cost of hydrogen.
Both studies model that, by 2050, both the battery-electric and the fuel cell hydrogen versions will be cost-competitive compared with the diesel version. However, continuous innovations are not given; public policies must push and pull, improving the technologies’ physical characteristics while encouraging process innovation by strengthening demand as well.
The scope of discussion is primarily limited to the purchase costs and fuel costs, given that indirect costs such as payload capacity and dwell time are much more difficult to quantify. Although insurance, repair, and maintenance expenses vary by powertrain, they make up a much smaller share of TCO than purchase costs and fuel costs. Other costs such as tolls, permits, licenses, and truck-driver compensations are assumed to be the same regardless of the vehicle powertrain. Finally, salvage value decreases TCO—but again, there is a lack of data.
Appendix 6: Data Gaps
In addition to the gaps previously mentioned, several data gaps need to be closed. Closing data gaps for the HD duty cycle and TCO are essential to establish baselines, benchmark new propulsion systems versus incumbents, and evaluate progress toward P3. Field-level data across multiple variables that will show how HDTs are used in different vehicle classes is vital to these evaluations. Four essential data gaps that connect with decarbonization for MHDTs illustrate the problems. A number of these gaps are related to TCO (Data Gap #1).
Data Gap #1: Total Cost of Ownership
Reducing TCO of BEV and FCEV HDTs to be on par with or worse than that of diesel HDTs remains the biggest challenge to global adoption. Data on TCOs for MHDTs is sparse, and the quality could be significantly better. A comprehensive study is needed to provide accurate, field-level data to address the high uncertainties regarding multiple variables contributing to TCOs to ensure that product design specifications for low-carbon options hit the right performance and cost targets.
TCO is the acquisition cost of a vehicle plus direct and indirect costs. Direct costs include operating costs of vehicles such as fuel, repair and maintenance, and insurance. For HDTs, there are additional operational costs such as truck driver compensation, truck trailers, permits, licenses, and tolls—but these are similar for all powertrains.[100] Finally, costs from payload capacity losses (which lead to decreased revenue), dwell time costs (incurred when a truck is not moving goods in transit), and out-of-route mileage costs (time spent searching for refueling stations) are indirect costs. Since production volumes are much lower but unique use cases are higher for HDTs than LDVs, TCO will significantly impact original equipment manufacturer (OEM) decisions to place a new vehicle into the development portfolio. Appendix 5 provides an in-depth discussion of the components of TCO.
HDTs typically have high VMT but low fuel economy. Therefore, fuel costs may be a more significant component of TCO in HDTs compared with other vehicle classes. The drive cycle and duty cycle characteristics such as speed, idle time, and the number of stops per trip or day can also affect TCO, as these characteristics impact fuel consumption. VMT and vehicle lifetime are critical factors of cost parity.[101]
When comparing the TCO of a conventional ICE HDT and the zero-emission alternatives (e.g., battery-electric or fuel cell hydrogen), the acquisition costs of the truck (tractor unit for combination truck), fuel, repair and maintenance, and insurance are typically the relevant TCO components. However, for a business that owns a truck fleet and installs charging equipment or hydrogen refueling stations, the amortized cost of these recharging systems may also be included in the TCO.
Calculating TCO for BEVs of FCEVs is a complex task in practice. Although BEV HDs could have lower repair and maintenance costs than do their ICE counterparts (due to having fewer mechanical parts and regenerative braking), similar to LDVs, actual data is nearly nonexistent (simply because there are so few on the road) and insufficient in duration to quantify total savings on a truck’s life cycle. The same also goes for acquisition and fuel costs: The lack of reliable and long-term field data renders TCO calculations imprecise. Additionally, economic and regulatory uncertainties and other unknowns regarding the price of alternative fuels and the maturity of battery and fuel cell technologies further complicate TCO calculations.[102] A recent study notes the uncertainty of fuel-cost evolution, vehicle costs, fuel economy, future freight demand growth, and truck stock turnover as factors influencing adoption decisions.[103] For BEVs and FCEV HDTs, electricity and low-carbon hydrogen (produced from electrolysis) prices are big factors for TCO parity.[104]
Data Gap #2: Lack of Data on HDTs’ Drive Cycle and Duty Cycle
A vehicle’s drive cycle, which measures its speed against time defines how a vehicle is used. Data gaps in the drive and duty cycles limit the ability to optimize powertrains for low-carbon options. Without accurate information on these cycles, it is difficult to know if performance from the low-carbon options is genuinely equivalent. Although simulations may be available, they miss the complexity of the multiple variables that influence the performance of real duty cycles. Comprehensive studies are needed to fill data gaps.
Standard metrics that measure a vehicle’s drive cycle include the average speed, stops per mile, number of stops per day, average distance traveled, hours of operation per day, idle time, engine-off time, acceleration, deceleration, kinetic intensity (ratio of characteristic acceleration to aerodynamic speed), and total engine hours per cycle.[105] Meanwhile, a vehicle’s duty cycle defines how much a vehicle is used. Information on an HDT’s duty cycle typically includes the number of hours and shifts per day, the number of days per week in a measurement cycle, miles per measurement and cycle, and typical, average, and peak-load profile (e.g., the variation in load versus time).
Robust data on both vehicle drive cycles and duty cycles are crucial for understanding and assessing the proper zero-emission powertrain technologies, the appropriate sizing of powertrain components, and further energy efficiency improvements. Similar to VMT data, HDT duty cycle data available today is less rich than for LDVs, partly because detailed data (e.g., hourly data) on truck trips is difficult to measure and obtain, which is compounded by the inherent diverse vocational use cases of HDTs.
The National Renewable Energy Laboratory (NREL) collects and maintains commercial fleet vehicle operating data in its Fleet DNA project, which aims to help users understand the broad operational range of commercial vehicles.[106] The composite data for all vehicles available for public use (4,705 vehicles) is organized by provider, deployment, and vehicle and are grouped by vehicle day.[107] However, the data was last updated in 2014. The absence of more up-to-date and comprehensive fleet operational data remains a significant data gap.
Data Gap #3: Different Vehicle Classification Systems Describe Different Datasets
DOT has different standards by which trucks are distinguished from other vehicle types. In freight transportation and policy planning, the variation in standards represents a significant challenge, as overlapping standards from different classification systems create confusion, inhibit the ability to compare and rely on data, and confound decarbonization efforts.
VMT data and emissions data are not aligned—these datasets come from different federal agencies and are described with different vehicle classification systems. Even within the same classification system by GVWR, EPA, and FHWA have assigned different classes to MDVs. Whereas MDVs encompass Classes 3–6 (10,000 pounds to 26,000 pounds), EPA classifies MDVs as vehicles weighing 8,500 to 26,000 pounds (Class 2b–6), as figure 8 illustrates. These differences make tabulating average VMT, emissions, fuel consumption, and efficiency—and understanding their relationships—difficult and imprecise.
HDT’s emissions and fuel consumption use the GVWR 8-class system (known as the National Highway Traffic Safety Administration-8 (NHTSA-8) vehicle GVWR classification system; see Appendix 4 for details on the classification systems.) However, aggregate VMT data from FHWA’s Highway Statistics Series groups vehicles in six categories: LDVs (short wheelbase), LDVs (long wheelbase), motorcycles, buses, single-unit trucks, and combination trucks. These six broad categories are based on the FHWA 13-class system. Overall, vehicle registration data doesn’t reflect FHWA and NHTSA classes.
Instead of classifying vehicles by gross vehicle weight, FHWA developed the standardized vehicle classification system in the 1980s to meet the needs of traffic data users and for the electronic equipment and sensors available at the time, which were designed to detect axles and determine the distance between consecutive axles based on the speed of each vehicle as it passed over the sensors (vehicle weight is not an input for classification).[108] On the other hand, GHG emissions are reported by EPA, which is based on the GVWR 8-class system, since heavier vehicles are less fuel efficient and emit more GHGs per mile. Figure 8 maps the two different vehicle classification systems.
Figure 8: Mapping vehicle classification systems by GVWR and number of axles[109]
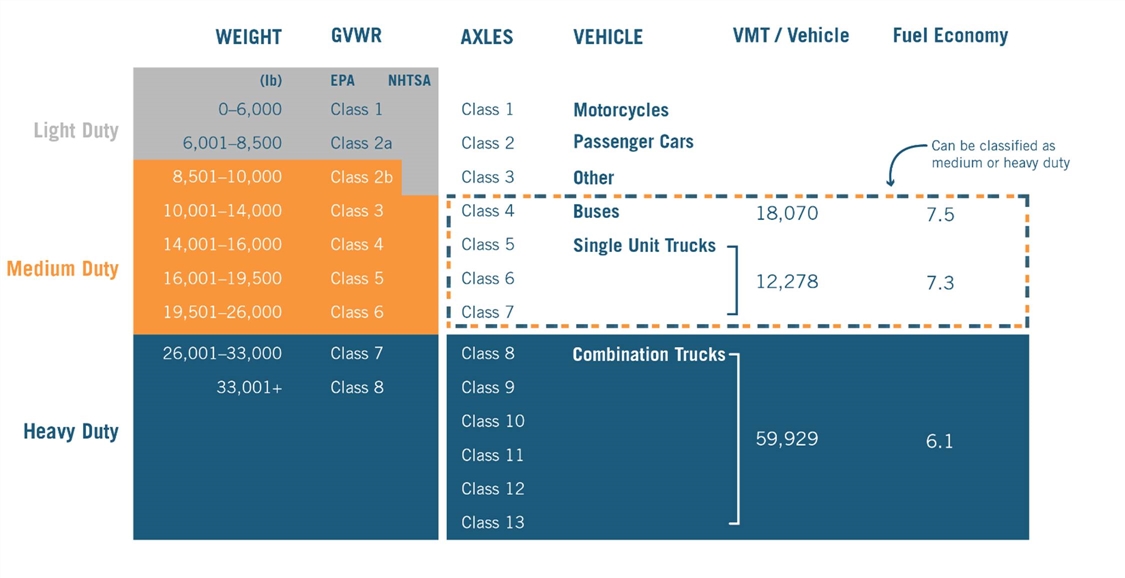
Figure 8 shows that HDTs cover a wide range of categories (Classes 5–13) consisting of both single-unit (Classes 5–7) and combination trucks (Classes 8–13). Discussing vehicle use case characteristics such as VMT in conjunction with emissions is essential; the average VMT per vehicle per year for a combination truck is about five times that of a single-unit truck. A single-unit truck has a non-detachable cargo unit and all axles attached to a single frame, whereas a combination truck is a tractor unit with one or more attached trailers.[110] Commercial truck applications, especially HDTs, cover many use cases. However, fleet customers purchase these vehicles to perform a particular job. For example, a trash removal company acquires dump trucks, and a construction company uses cement trucks. This classification system is based on the number of axles and trailers connected to the truck (single vs. multi-trailer).
Figure 9: HDT Examples by GVWR (8-Class) and by Axles (13-Class)[111]
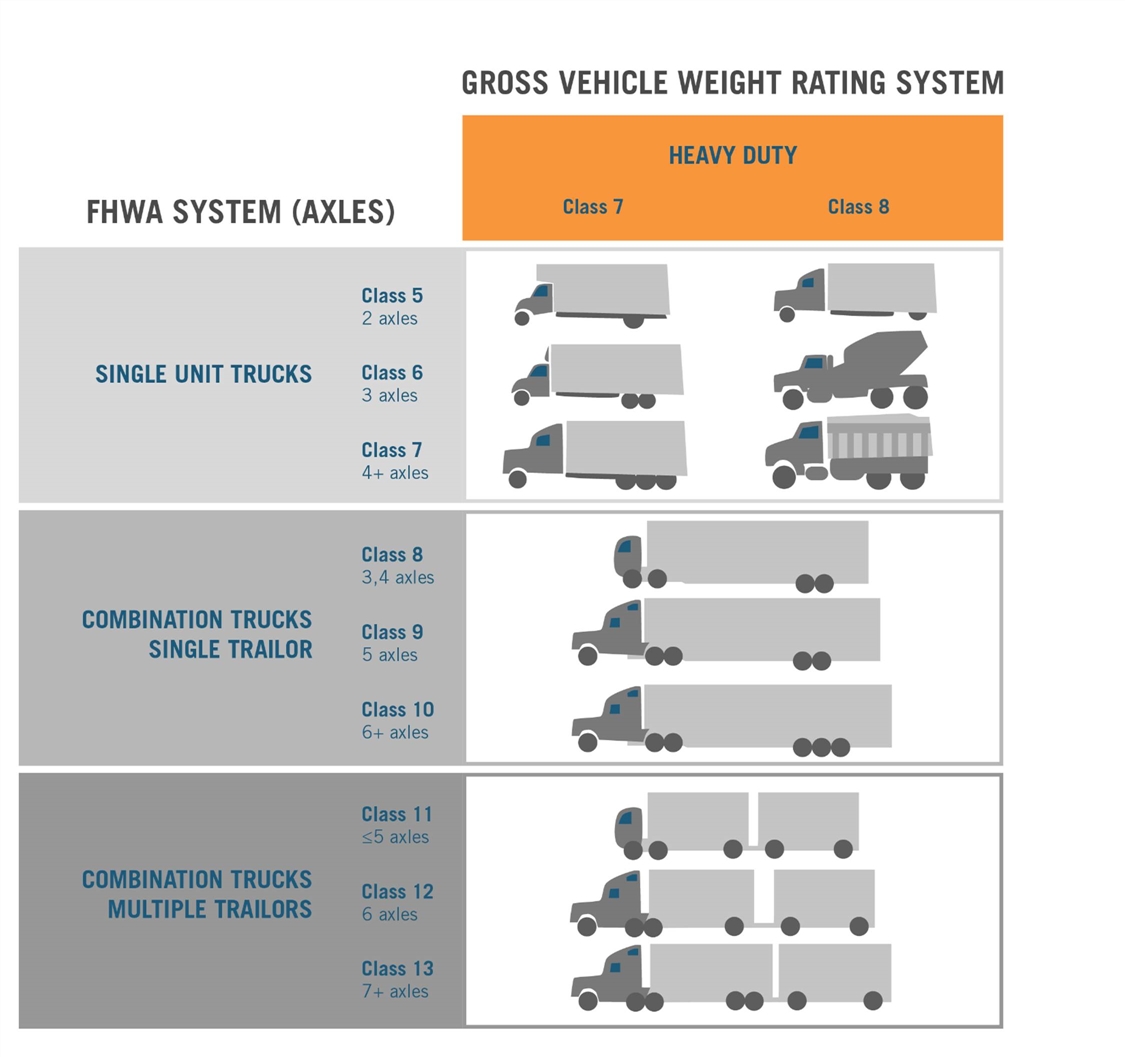
Figure 9 shows the different types of HDTs in both classification systems. Although most HDTs are combination trucks, there are notable exceptions. For example, a dump truck and cement truck are both Class 8 vehicles by GVWR and Classes 6–7 single-unit trucks under FHWA’s 13-class system, as other single-unit trucks, dump trucks, and cement trucks travel locally have low VMT and return to a home base daily. In contrast, an 18-wheeler big rig that travels cross-country has high VMT and does not have a home base to return to daily.
Most combination trucks are equivalent to GVWR Classes 7–8 vehicles (namely HDTs), with less than one percent belonging to GVWR Class 6.[112] On the other hand, single-unit trucks can be of any GVWR Class. A specific challenge lies in classifying FHWA Class 5 single-unit vehicles. Since FHWA Classes 6–7 single-unit trucks have at least three axles (i.e., at least six tires) and GVWR Classes 1–2 vehicles have four tires only, these vehicles cannot be LDVs, but rather only MHDTs.[113] Although FHWA Class 5 single-unit vehicles have two axles and six tires (by definition—see Appendix 4 details on the FHWA 13-class system), which theoretically implies that they cannot be GVWR Classes 1–2 vehicles. A 2021 study commissioned by FHWA estimates that 35 percent of these vehicles in the 2002 Vehicle Inventory and Use Survey (VIUS) were GVWR Classes 1–2 vehicles.[114]
Data Gap #4: Missing VMT Data—Average VMT Is Not a Good-Enough Metric
Newer data on VMT for MHDTs in the field is needed to ensure that RD&D for EVs and FCEVs hits the right performance target. We need to know how MHDTs are being used today across multiple use cases and vehicle classes, not the experience from 20 years ago. An updated VIUS study is needed that includes more important variables that relate to performance. This data would provide critical input for battery or fuel cell system weight, time windows for recharge or refueling, range, and cost.
Average VMT data is currently used to inform HDT use cases. However, average VMT provide no information on characteristics such as the distribution of the daily driving range of an HDT, the driving range by vehicle age, and how the vehicles are used. While data on aggregate VMT and average VMT are available annually, the most recent detailed truck driving characteristics are from 2002.[115] The US Census Bureau VIUS was conducted every five years from 1963 to 2002 before it was discontinued. A new VIUS—a partnership with the FHWA, DOE, and US Census Bureau—was conducted in 2022 with results to be released in Fall 2023.[116]
Technological innovations can only happen with timely, quality, and accurate data. Periodic assessments of vehicle usage characteristics are essential for freight movement analysis, truck size and weight evaluation, investment and performance analysis, energy consumption and demand studies, and system performance analysis—all of which are considerations in determining truck fleet consumers’ needs. Although the two-decade-old VIUS data could still offer valuable insights, it is not timely enough to reflect future trends accurately (see appendix 2 for details on past VIUS surveys).[117]
The 2002 VIUS estimates that the average annual VMT for an HDT for that year was 44,581 miles/year, while FHWA’s federal Highway Statistics’ average annual VMT estimates for single-unit trucks and combination trucks were 13,426 miles/year and 60,939 miles/year, respectively (recall that while most HDTs are combination trucks, some are single-unit trucks.)[118] Using the average VMT of HDT is problematic, as it is significantly lower than the average VMT of combination trucks (by 37 percent). Also, even if the average VMT of HDT is similar to that of combination trucks, it fails to capture the driving range.
Figure 10: Distribution of VMT per year for HDTs less than two years old (thousands of miles), 2002 VIUS[119]
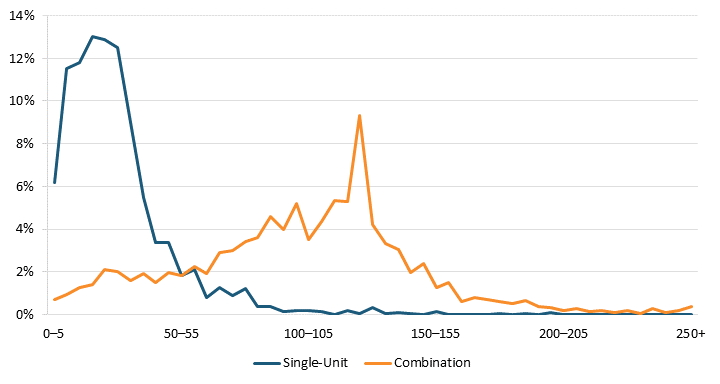
Figure 11: Distribution of VMT per year for all HDTs (thousands of miles), 2002 VIUS
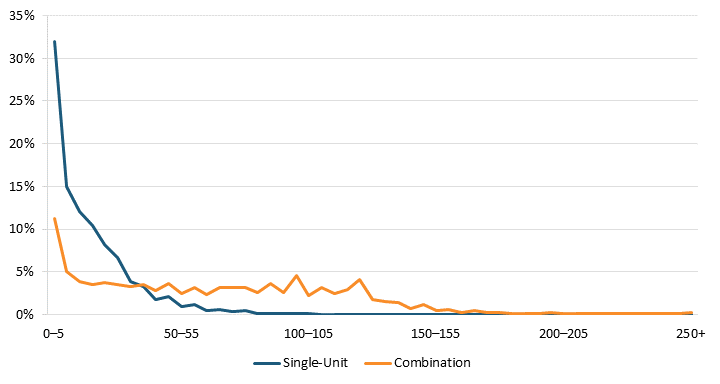
Additionally, new HDTs (less than two years old) have much higher annual VMT than do older trucks (figure 10 and figure 11). About half the combination trucks less than two years old had a yearly VMT exceeding 100,000 miles in 2002, more than twice the average VMT of all HDTs (44,581 miles/year); only one-seventh of these combination trucks had an annual VMT lower than the average VMT for all HDTs. As these trucks age, their annual VMT decrease. Among all combination trucks, only about a quarter exceeded 100,000 miles/year, and almost half had less than 60,000 miles/year. Meanwhile, about 10 percent of HDTs traveled more than 500 miles per day, while over half traveled less than 100 miles per day typically.[120] More recent surveys by North American Council on Freight Efficiency (NACFE) and Advanced Clean Technology (ACT) show that about 70 percent of HDTs for regional haul exceeded 300 miles in daily use, while 73 percent of HDTs for long haul exceeded 400 miles daily—considerably different observations than in VIUS 2002.[121]
Figure 10 and figure 11 also illustrate the extensive range of VMT among HDTs, signaling the diverse set of vocational uses compared with LDVs. This limits the standardization of zero-emission HDTs, adding to the complexity of decarbonization efforts. To better understand truck VMT, the Information Technology and Innovation Foundation (ITIF) has argued for a congressional mandate for a truck VMT system.[122] Such a system has another added long-term benefit: As vehicles become increasingly electrified, gas taxes will become increasingly insufficient to pay for America’s surface transportation system (free ridership from drivers of EVs). A VMT system also ensures that drivers contribute their fair share of the infrastructure costs.[123] In fact, many trucks already come equipped with a GPS system, which means the cost of installing VMT onboard systems will be relatively modest, especially as a share of the total costs of the truck.[124]
Acknowledgments
The authors wish to thank Anusha Chitturi (Eno Center for Transportation) and Alexander Laska (Third Way Climate and Energy Program) for providing peer review to an earlier draft of this report. They would also like to thank David Hart for additional comments. All errors or omissions are the authors’ alone.
About the Authors
Hoyu Chong is a senior policy analyst for clean energy innovation at the Information Technology and Innovation Foundation. Prior to joining ITIF, she worked as a practice area lead for Beacon Economics, focusing on clean energy, sustainability, and development. She holds a master’s degree in economics from the University of Southern California.
Edward Rightor is the director of the Center for Clean Energy Innovation, which seeks to accelerate the transition of the domestic and global energy systems to low-carbon resources. Prior to joining ITIF, he was the director of the Industrial Program for the American Council for an Energy-Efficient Economy. Prior to that, he worked at Dow Chemical for 31 years in R&D, business, environmental, and sustainability roles. He earned a doctorate in chemistry from Michigan State University and a bachelor of science in chemistry from Marietta College.
About ITIF
The Information Technology and Innovation Foundation (ITIF) is an independent 501(c)(3) nonprofit, nonpartisan research and educational institute that has been recognized repeatedly as the world’s leading think tank for science and technology policy. Its mission is to formulate, evaluate, and promote policy solutions that accelerate innovation and boost productivity to spur growth, opportunity, and progress. For more information, visit itif.org/about.
Endnotes
[1]. Jacob Teter et al., “The Future of Trucks: Implications for Energy and the Environment“” (IEA, 2017), https://iea.blob.core.windows.net/assets/a4710daf-9cd2-4bdc-b5cf-5141bf9020d1/TheFutureofTrucksImplicationsforEnergyandtheEnvironment.pdf.
[2]. Center for Climate and Energy Solutions (C2ES), Federal Vehicle Standards, 2022, https://www.c2es.org/content/regulating-transportation-sector-carbon-emissions/.
[3]. Congressional Research Service (CRS), “Heavy-Duty Vehicles, Air Pollution, and Climate Change” (updated February 2023), https://crsreports.congress.gov/product/pdf/IF/IF12043; Nicholas Mailloux et al., “Nationwide and Regional PM2.5-Related Air Quality Health Benefits From the Removal of Energy-Related Emissions in the United States,” GeoHealth 6(5), 2022, https://doi.org/10.1029/2022GH000603.
[4]. An estimate of the potential for cost reductions from Ricardo ranges from 40 percent for hydrogen storage to 70 percent for e-drive.Mark Kuhn, Piyush Buba, and Edward Anculle, “E-Truck Virtual Teardown Study: Final Report” (Ricardo, June 2021), https://theicct.org/wp-content/uploads/2022/01/Final-Report-eTruck-Virtual-Teardown-Public-Version.pdf.
[5]. Mike Roeth and Wendy Lu McGill, “Keep on Truckin’—50 Years of Efficiency Advancements” (Rocky Mountain Institute, April 2020), https://rmi.org/keep-on-truckin-50-years-of-efficiency-advancements/.
[6]. EPA, “Inventory of U.S. Greenhouse Gas Emissions and Sinks: 1990–2020,” https://www.epa.gov/ghgemissions/inventory-us-greenhouse-gas-emissions-and-sinks-1990-2020.
[7]. Ibid.
[8]. IEA, “CO2 emissions from heavy-duty vehicles in the Sustainable Development Scenario, 2000-2030,” October 2022, https://www.iea.org/data-and-statistics/charts/co2-emissions-from-heavy-duty-vehicles-in-the-sustainable-development-scenario-2000-2030.
[9]. Ibid.
[10]. Ibid.
[11]. Single-unit trucks include both MDTs and HDTs.
[12]. Ryan Miller, “4 of the Most Fuel-Efficient Semi Trucks” (Commercial Truck Trader, April 2022), https://www.commercialtrucktrader.com/blog/2022/04/14/4-of-the-most-fuel-efficient-semi-trucks/.
[13]. TransportPolicy.net. Topics: Emissions standards (2017), http://www.transportpolicy.net/topic/emissions-standards/.
[14]. S. L. Winkler et al., “Vehicle criteria pollutant (PM, NOx, CO, HCs) emissions: how low should we go?” (npj Clim Atmos Sci 1, 26, 2018), https://www.nature.com/articles/s41612-018-0037-5.
[15]. MobilityNotes, “Characterizing the in-use heavy-duty vehicle fleet,” https://mobilitynotes.com/characterizing-the-in-use-heavy-duty-vehicle-fleet/.
[16]. Huzeifa Badshah, Francisco Posada, and Rachel Muncrie, “Current State of NOx Emissions from In-Use Heavy-Duty Diesel Vehicles in the United States” (ICCT, November 2019), https://theicct.org/wp-content/uploads/2021/06/NOx_Emissions_In_Use_HDV_US_20191125.pdf.
[17]. EPA, “Exhaust Emission Rates for Heavy-Duty Onroad Vehicles in MOVES3” (November 2020), https://www.epa.gov/sites/default/files/2020-11/documents/420r20018.pdf.
[18]. S. C. Anenberg et al., “The global burden of transportation tailpipe emissions on air pollution-related mortality in 2010 and 2015. Environmental Research Letters,” 14(9), 094012. September 2019. https://doi.org/10.1088/1748-9326/ab35fc
[19]. Hong Chen et al., “Exposure to ambient air pollution and the incidence of dementia: A population-based cohort study,” Environment International 108:271–277, https://doi.org/10.1016/j.envint.2017.08.020; Ikenna C Eze et al., “Associations between ambient air pollution and diabetes mellitus in Europe and North America: systematic review and meta-analysis” (May 2015), 123(5):381–9. doi:10.1289/ehp.1307823.
[20]. EPA, “Final Rule and Related Materials for Control of Air Pollution from New Motor Vehicles: Heavy-Duty Engine and Vehicle Standards,” https://www.epa.gov/regulations-emissions-vehicles-and-engines/final-rule-and-related-materials-control-air-pollution; James Leggate, “EPA Finalizes Stricter Heavy-Duty Engine Emissions Standards,” https://www.enr.com/articles/55629-epa-finalizes-stricter-heavy-duty-engine-emissions-standards.
[21]. Hao Cai et al., “The GREET Model Expansion for Well-to-Wheels Analysis of Heavy-Duty Trucks” (Argonne National Laboratory, October 2015), https://greet.es.anl.gov/files/heavy-duty.
[22]. Department of Energy (DOE) Energy Information Administration (EIA), “Use of energy explained: Energy use for transportation” (updated June 2022), https://www.eia.gov/energyexplained/use-of-energy/transportation.php.
[23]. Dan Gage and Lesley Dalton, “Renewable Natural Gas Motor Fuel Interest Continues Growth” (NGVAmerica, May 2022), https://ngvamerica.org/2022/05/03/renewable-natural-gas-motor-fuel-interest-continues-growth/.
[24]. Jeongwoo Han, Marianne Mintz, and Michael Wang, “Waste-to-Wheel Analysis of Anaerobic-Digestion-Based Renewable Natural Gas Pathways with the GREET Model” (ANL, September 2011), https://publications.anl.gov/anlpubs/2011/12/71742.pdf.
[25]. Tom Cyrs, John Feldman, and Rebecca Gasper, “Renewable Natural Gas as a Climate Strategy: Guidance for State Policymakers” (World Resources Institute, December 2020), https://files.wri.org/d8/s3fs-public/renewable-natural-gas-climate-strategy.pdf.
[26]. Amy Boerger, “Decarbonizing Medium, Heavy-Duty Trucks” (Supply and Demand Chain Executive, October 2022), https://www.sdcexec.com/transportation/fleet-management/article/22512053/cummins-decarbonizing-medium-heavyduty-trucks.
[27]. Gladstein, Neandross & Associates (GNA), “State of Sustainable Fleets 2022 Market Brief” (GNA, May 2022), https://cdn.stateofsustainablefleets.com/2022/state-of-sustainable-fleets-2022-report.pdf.
[28]. Amy Boerger, “Decarbonizing Medium, Heavy-Duty Trucks.”
[29]. Bernd Heid, Christopher Martens, and Anna Orthofer, “How hydrogen combustion engines can contribute to zero emissions” (June 2021), https://www.mckinsey.com/industries/automotive-and-assembly/our-insights/how-hydrogen-combustion-engines-can-contribute-to-zero-emissions.
[30]. EVreporter, “EV Powertrain Components – Basics” (October 2019), https://evreporter.com/ev-powertrain-components/.
[31]. DOE Alternative Fuel Data Center (AFDC), “How Do Fuel Cell Electric Vehicles Work Using Hydrogen?” https://afdc.energy.gov/vehicles/how-do-fuel-cell-electric-cars-work.
[32]. Colin Cunliff, “An Innovation Agenda for Deep Decarbonization: Bridging Gaps in the Federal Energy RD&D Portfolio” (ITIF, November 28, 2018), https://www2.itif.org/2018-innovation-agenda-decarbonization.pdf.
[33]. Based on searches for fuel tank parts at https://www.heavytruckparts.net/search/Any/Any/Fuel-Tank.
[34]. Scania, “Battery Electric Truck,” accessed July 25, 2022, https://www.scania.com/group/en/home/products-and-services/trucks/battery-electric-truck.html.
[35]. Tesla, “Semi | Tesla,” accessed July 25, 2022, https://www.tesla.com/semi.
[36]. Volvo Trucks USA, “Charging Ahead: The Volvo VNR Electric,” accessed July 25, 2022, https://www.volvotrucks.us/trucks/vnr-electric/.
[37]. BYD USA, “Class 8 Day Cab,” accessed July 25, 2022, https://en.byd.com/truck/class-8-day-cab/.
[38]. Freightliner Trucks, “eCascadia,” accessed July 25, 2022, https://freightliner.com/trucks/ecascadia/.
[39]. Tyler Fussner, “The dawn of hydrogen trucks” (FleetOwner, May 2022), https://www.fleetowner.com/emissions-efficiency/article/21241114/the-dawn-of-hydrogen-trucks; Carrie Hampel, “Quantron presents H2 fuel cell truck with 1,500 km-range” (electrive.com, September 2022), https://www.electrive.com/2022/09/19/quantron-presents-h2-fuel-cell-truck-with-1500-km-range/.
[40]. Battery University, “Will the Fuel Cell have a Second Life?” (updated July 2016), https://batteryuniversity.com/article/will-the-fuel-cell-have-a-second-life.
[41]. DOE, “FY 2023 Budget Justification” (March 2022), vol. 4, https://www.energy.gov/sites/default/files/2022-04/doe-fy2023-budget-volume-4-eere-v2.pdf; DOE, “DOE Announces Nearly $200 Million to Reduce Emissions From Cars and Trucks,” November 2021, https://www.energy.gov/articles/doe-announces-nearly-200-million-reduce-emissions-cars-and-trucks.
[42]. DOE, “Exploratory Battery Materials R&D,” https://www.energy.gov/eere/vehicles/exploratory-battery-materials-rd.
[43]. Nikos Tsafos and Lachlan Carey, “The United States’ Industrial Strategy for the Battery Supply Chain” (Center for Strategic & International Studies, December 2021), https://www.csis.org/analysis/united-states-industrial-strategy-battery-supply-chain.
[44]. United States Advanced Battery Consortium LLC (USABC), https://uscar.org/usabc/.
[45]. Colin Cunliff, “An Innovation Agenda for Deep Decarbonization: Bridging Gaps in the Federal Energy RD&D Portfolio.”
[46]. Ibid.
[47]. DOE, “FOTW #1234, April 18, 2022: Volumetric Energy Density of Lithium-ion Batteries Increased by More than Eight Times Between 2008 and 2020,” April 2022, https://www.energy.gov/eere/vehicles/articles/fotw-1234-april-18-2022-volumetric-energy-density-lithium-ion-batteries.
[48]. Ibid.; Hideaki Kobayashi et al., “Science and technology of ammonia combustion” (Proceedings of the Combustion Institute, 2019), vol. 37 issue 1, https://doi.org/10.1016/j.proci.2018.09.029.
[49]. Yanguang Li and Jun Lu, “Metal-Air Batteries: Future Electrochemical Energy Storage of Choice?” (ACS Energy Letters 2, no. 6, May 2017), https://www.osti.gov/pages/servlets/purl/1373737.
[50]. DOT FHWA, “The Consolidated Appropriations Act, 2019, Truck Size and Weight Provisions,” December 2019, https://ops.fhwa.dot.gov/freight/pol_plng_finance/policy/fastact/tswprovisions2019/index.htm.
[51]. Chad Hunter et al., “Spatial and Temporal Analysis of the Total Cost of Ownership for Class 8 Tractors and Class 4 Parcel Delivery Trucks” (NREL, September 2021), https://www.nrel.gov/docs/fy21osti/71796.pdf.
[52]. Author’s tabulations based on previous literature and data presented in this section. Note: Calculations assume 80,000 pounds maximum GVW for diesel-powered HDTs and 82,000 pounds maximum GVW for battery-electric HDTs and an energy consumption rate of 2 kWh per mile for battery-electric HDTs. However, recent studies use 2.9 kWh/mile energy consumption rates for their 500-mile and 750-mile range models. Selected gravimetric densities for battery-electric HDTs are based on practical attainable ranges from previous literature.
[53] Vishnu Nair et al., “Roush Industries, EDF,” February, 2002. https://blogs.edf.org/climate411/files/2022/02/EDF-MDHD-Electrification-v1.6_20220209.pdf.
[54]. Fitzgerald Glider Kits, What is a Glider Kit, https://www.fitzgeraldgliderkits.com/what-is-a-glider-kit/.
[55]. Claire Buysse, “How Much does an Electric Semi Really Cost?” (ICCT, February 2022), https://theicct.org/cost-electric-semi-feb22/; Mark Kuhn et al., “E-Truck Virtual Teardown Study” (Ricardo Strategic Consulting, June 2021), https://theicct.org/wp-content/uploads/2022/01/Final-Report-eTruck-Virtual-Teardown-Public-Version.pdf. Note: The BEV powertrain is based on a model with a 600 kWh battery. The FCEV powertrain is based on a model with a 180 kW fuel cell stack and a 70 kg (2,352 kWh) hydrogen tank.
[56]. DOE, “FY 2023 Budget Justification” (March 2022), vol. 4, https://www.energy.gov/sites/default/files/2022-04/doe-fy2023-budget-volume-4-eere-v2.pdf; Sunita Satyapal, “U.S. Department of Energy Hydrogen and Fuel Cell Technology Perspectives” (DOE, 2019), https://www.osti.gov/servlets/purl/1511435; DOE HFTO, “DOE Technical Targets for Onboard Hydrogen Storage for Light-Duty Vehicles,” https://www.energy.gov/eere/fuelcells/doe-technical-targets-onboard-hydrogen-storage-light-duty-vehicles.
[57]. Chad Hunter et al., “Spatial and Temporal Analysis of the Total Cost of Ownership for Class 8 Tractors and Class 4 Parcel Delivery Trucks” (NREL, September 2021).
[58]. Ibid.
[59]. Jesse Adams et al., “DOE H₂ Heavy Duty Truck Targets” (DOE, January 2020), https://www.energy.gov/sites/prod/files/2020/02/f71/fcto-compressed-gas-storage-workshop-2020-adams.pdf.
[60]. IEA, “Net Zero by 2050: A Roadmap for the Global Energy Sector” May 2021, https://iea.blob.core.windows.net/assets/deebef5d-0c34-4539-9d0c-10b13d840027/NetZeroby2050-ARoadmapfortheGlobalEnergySector_CORR.pdf.
[61]. DOE, Hydrogen Shot, https://www.energy.gov/eere/fuelcells/hydrogen-shot.
[62]. Claire Buysse, “How Much does an Electric Semi Really Cost?”
[63]. Patrick Molloy, “Run on Less with Hydrogen Fuel Cells” (RMI, October 2019), https://rmi.org/run-on-less-with-hydrogen-fuel-cells/.
[64]. Chad Hunter et al., “Spatial and Temporal Analysis of the Total Cost of Ownership for Class 8 Tractors and Class 4 Parcel Delivery Trucks”; Andrew Burnham et al., “Comprehensive Total Cost of Ownership Quantification for Vehicles with Different Size Classes and Powertrains” (Argonne National Laboratory, April 2021), https://publications.anl.gov/anlpubs/2021/05/167399.pdf. Note: Figures exclude the cost of labor, which is assumed to be the same across powertrains.
[65]. Chad Hunter et al., “Spatial and Temporal Analysis of the Total Cost of Ownership for Class 8 Tractors and Class 4 Parcel Delivery Trucks”; Andrew Burnham et al., “Comprehensive Total Cost of Ownership Quantification for Vehicles with Different Size Classes and Powertrains” (Argonne National Laboratory, April 2021), https://publications.anl.gov/anlpubs/2021/05/167399.pdf. Note: Figures exclude the cost of labor, which is assumed to be the same across powertrains.
[66]. Catherine Ledna et al., “Decarbonizing Medium- & Heavy-Duty On-Road Vehicles: Zero-Emission Vehicles Cost Analysis” (National Renewable Energy Laboratory, March 2022), https://www.nrel.gov/docs/fy22osti/82081.pdf.
[67]. Driivz, “Six Technology Innovations in Electric Vehicle Charging” (August 2022), https://driivz.com/blog/ev-charging-technology-innovations/.
[68]. Alexa St. John, “The US needs 8 times more charging stations by 2030 to handle the coming wave of electric cars,” Business Insider, January 2023, https://www.businessinsider.com/electric-vehicles-charging-stations-where-to-plug-in-2030-2023-1.
[69]. FOA stands for funding opportunity announcement.
[70]. Clean Cities Coalition Network, Department of Energy, https://cleancities.energy.gov/partnerships/search?page=3&project_search=Electric+Vehicle+Community.
[71]. MobilityNotes, “Hydrogen Fuel Cell Trucks” (February 2023), https://mobilitynotes.com/hydrogen-fuel-cell-trucks/.
[72]. Andrew Howell and Gabriel Malek, “Into the Fast Lane: Investing in the Future of Zero Emission Trucking” (Environmental Defense Fund, February 2022), https://business.edf.org/files/Into-the-Fast-Lane-Investing-in-the-future-of-zero-emission-trucking-1.pdf.
[73]. Noël Fletcher, “DOE Funds Plans for EV Charging, Hydrogen Fueling on Freight Corridors” (Transport Topics, February 2023), https://www.ttnews.com/articles/doe-funds-plans-ev-charging-hydrogen-fueling-freight-corridors.
[74]. Philipp Kampshoff et al., “Building the electric-vehicle charging infrastructure America needs” (McKinsey & Company, April 2022), https://www.mckinsey.com/industries/public-and-social-sector/our-insights/building-the-electric-vehicle-charging-infrastructure-america-needs.
[75]. Judith Lewis Mernit, “For U.S. Companies, the Race for the New EV Battery Is On” (YaleEnvironment360, December 2022), https://e360.yale.edu/features/alternate-ev-battery-technology.
[76]. Adam Kimmel, “EV Battery Chemistry and Its Impact on the Electronics Industry” (ElectronicDesign, May 2022), https://www.electronicdesign.com/markets/automotive/article/21241459/mouser-electronics-ev-battery-chemistry-and-its-impact-on-the-electronics-industry.
[77]. Brandon S. Tracy, “Critical Minerals in Electric Vehicle Batteries” (Congressional Research Service (CRS), August 2022), https://crsreports.congress.gov/product/pdf/R/R47227.
[78]. Simon Flowers, “Transforming the US EV battery supply chain” (WoodMackenzie, January 2023), https://www.woodmac.com/news/the-edge/transforming-the-us-ev-battery-supply-chain/.
[79]. Battery University, “Will the Fuel Cell have a Second Life?”
[80]. Zhiyuan Fan and Hadia Sheerazi, “Hydrogen Leakage: A Potential Risk for the Hydrogen Economy” (Center on Global Energy Policy, Columbia University, July 2022), https://www.energypolicy.columbia.edu/publications/hydrogen-leakage-potential-risk-hydrogen-economy/.
[81]. Camron Proctor and Steven Wiryadinata, “Disaggregation of Vehicle Choice Modeling: Capturing Potential Spillover Effects in the LDV and HDV Markets” (Sandia National Laboratories, July 2020), https://www.osti.gov/servlets/purl/1812173.
[82]. Ibid.
[83]. Environmental Protection Agency (EPA), “Inventory of U.S. Greenhouse Gas Emissions and Sinks: 1990–2020,” https://www.epa.gov/ghgemissions/inventory-us-greenhouse-gas-emissions-and-sinks-1990-2020; U.S. Department of Transportation (DOT) Federal Highway Administration (FHWA), “Highway Statistics Series,” https://www.fhwa.dot.gov/policyinformation/statistics.cfm; Oak Ridge National Laboratory (ORNL), TEDB, Table 2.7, https://tedb.ornl.gov/data/; Energy Information Administration (EIA), “Carbon Dioxide Emissions Coefficients,” November 18, 2021, https://www.eia.gov/environment/emissions/co2_vol_mass.php.
[84]. MHDTs typically consist of GVWR Class 3–8 vehicles (10,001 pounds or more), but the EPA defines MHDTs to be vehicles of GVWR Class 2b-8 (8,501 pounds or more).
[85]. ORNL, TEDB, Table 12.6.
[86]. ORNL, TEDB, Table A.6.
[87]. 2002 VIUS, U.S. Census Bureau, https://www.census.gov/library/publications/2002/econ/census/vehicle-inventory-and-use-survey.html.
[88]. United States: 2002 Geographic Area Series, 2002 VIUS, U.S. Census Bureau, https://www2.census.gov/library/publications/economic-census/2002/vehicle-inventory-and-use-survey/ec02tv-us.pdf; United States: 1997 Geographic Area Series, 1997 VIUS, U.S. Census Bureau, https://www2.census.gov/library/publications/economic-census/1997/vehicle-inventory-and-use-survey/97tv-us.pdf; United States: 1992 Census of Transportation, 1992 TIUS, U.S. Census Bureau, https://www2.census.gov/library/publications/economic-census/1992/vehicle-inventory-and-use-survey/tc92-t-52.pdf.
[89]. United States: 2002 Geographic Area Series, 2002 VIUS.
[90]. United States: 2002 Geographic Area Series, 2002 VIUS; United States: 1997 Geographic Area Series, 1997 VIUS; United States: 1992 Census of Transportation, 1992 TIUS.
[91]. Although the percentage not reported is significantly smaller for 1992 TIUS, its reported relative standard error of total (7.1 percent)—light, medium, light-heavy, and heavy-heavy—was much greater than that of 1997 VIUS (1.3 percent) and 2002 VIUS (1.5 percent).
[92]. DOT BTS, Vehicle Inventory and Use Survey (VIUS), accessed October 3, 2022, https://www.bts.gov/vius.
[93]. DOE, SuperTruck Success: Progress on Fuel Efficiency and Market Adoption, accessed August 28, 2022, https://www.energy.gov/sites/prod/files/2016/06/f33/EERE_SuperTruck_FS_R121%20FINAL.pdf.
[94]. DOE, “Video: SuperTruck Barreling Down the Road of Sustainability,” May 14, 2015, https://www.energy.gov/articles/video-supertruck-barreling-down-road-sustainability.
[95]. DOT FHWA, “Traffic Monitoring Guide Appendix C. Vehicle Types,” November 2014, https://www.fhwa.dot.gov/policyinformation/tmguide/tmg_2013/vehicle-types.cfm.
[96]. Ibid.
[97]. Christopher Lindsey et al., “Linking FHWA and NHTSA Vehicle Types and Deciphering Various Truck Weight Data” (Cambridge Systematics, Inc., June 2021), report no. FHWA-PL-021-029, https://www.fhwa.dot.gov/policyinformation/pubs/pl021029.pdf.
[98]. Chad Hunter et al., “Spatial and Temporal Analysis of the Total Cost of Ownership for Class 8 Tractors and Class 4 Parcel Delivery Trucks” (NREL, September 2021), https://www.nrel.gov/docs/fy21osti/71796.pdf; Andrew Burnham et al., “Comprehensive Total Cost of Ownership Quantification for Vehicles with Different Size Classes and Powertrains” (Argonne National Laboratory, April 2021), https://publications.anl.gov/anlpubs/2021/05/167399.pdf.
[99]. Ibid.
[100]. Samuel Barradas, “The Real Cost of Trucking – Per Mile Operating Cost of a Commercial Truck,”” TruckersReport, accessed September 12, 2022, https://www.thetruckersreport.com/infographics/cost-of-trucking/; Nathan Williams and Dan Murray, “An Analysis of the Operational Costs of Trucking: 2020 Update” (American Transportation Research Institute, November 2020), https://truckingresearch.org/wp-content/uploads/2020/11/ATRI-Operational-Costs-of-Trucking-2020.pdf.
[101]. David Smith et al., “Medium- and Heavy-Duty Vehicle Electrification: An Assessment of Technology and Knowledge Gaps” (ORNL and NREL, December 2019), https://info.ornl.gov/sites/publications/Files/Pub136575.pdf.
[102]. Rick Mihelic et al., “GUIDANCE REPORT: Electric Trucks Where They Make Sense,” NACFE.
[103]. Catherine Ledna et al., “Decarbonizing Medium- & Heavy-Duty On-Road Vehicles: Zero-Emission Vehicles Cost Analysis,” NREL.
[104]. David Smith et al., “Medium- and Heavy-Duty Vehicle Electrification: An Assessment of Technology and Knowledge Gaps,” ORNL and NREL; Hussein Basma, Yuanrong Zhou, and Felipe Rodriguez, “Fuel-Cell Hydrogen Long-Haul Trucks in Europe: a Total Cost of Ownership Analysis” (The International Council on Clean Transportation, September 2022), https://theicct.org/wp-content/uploads/2022/09/eu-hvs-fuels-evs-fuel-cell-hdvs-europe-sep22.pdf.
[105]. David A. Kolman, “Do you understand the differences between drive cycle and duty cycle?” (FleetMaintenance, October 2014), https://www.fleetmaintenance.com/shop-operations/shop-management/article/12003317/do-you-understand-the-differences-between-drive-cycle-and-duty-cycle; Kenneth Kelly et al., “Medium- and Heavy-Duty Vehicle Duty Cycles for Electric Powertrains” (NREL, March 2016), https://www.nrel.gov/docs/fy16osti/66228.pdf.
[106]. NREL, “Fleet DNA: Commercial Fleet Vehicle Operating Data,” accessed September 12, 2022, https://www.nrel.gov/transportation/fleettest-fleet-dna.html.
[107]. A. Duran et al., “Fleet DNA Project – Data Dictionary for Public Download Files” (NREL, September 2014), https://www.nrel.gov/docs/fy14osti/62572.pdf.
[108]. DOT Federal Highway Administration (FHWA), “Verification, Refinement, and Applicability of Long-Term Pavement Performance Vehicle Classification Rules Chapter 2: Introduction To Vehicle Classification” (Office of Research, Development, and Technology, Office of Infrastructure, RDT, November 2014), https://www.fhwa.dot.gov/publications/research/infrastructure/pavements/ltpp/13091/002.cfm.
[109]. DOE Alternative Fuel Data Center (AFDC), “Vehicle Weight Classes & Categories,” accessed September 2, 2022, https://afdc.energy.gov/data/10380; EPA, “Vehicle Weight Classifications for the Emission Standards Reference Guide,” accessed September 2, 2022, https://www.epa.gov/emission-standards-reference-guide/vehicle-weight-classifications-emission-standards-reference; FHWA, “Verification, Refinement, and Applicability of Long-Term Pavement Performance Vehicle Classification Rules Chapter 2: Introduction To Vehicle Classification.” Note: EPA has a separate system of emissions classifications for trucks, which considers GVWR Class 2b to be medium-duty, whereas FHWA classifies Class 2b as light-duty. The Obama administration’s emissions and fuel consumption standards for MDHVs follow EPA’s system.
[110]. DOT FHWA, “Traffic Monitoring Guide Appendix C. Vehicle Types,” November 2014, https://www.fhwa.dot.gov/policyinformation/tmguide/tmg_2013/vehicle-types.cfm.
[111]. Images are under creative common licenses.
[112]. DOT FHWA Office of Operations, “Figure 21. Law Enforcement Vehicle Identification Guide,” accessed September 5, 2022, https://ops.fhwa.dot.gov/publications/fhwahop10014/long_f21.htm.
[113]. Ibid.
[114]. Christopher Lindsey et al., “Linking FHWA and NHTSA Vehicle Types and Deciphering Various Truck Weight Data.”
[115]. U.S. Census Bureau, “About the Vehicle Inventory and Use Survey,” accessed September 5, 2022, https://www.census.gov/programs-surveys/vius/about.html.
[116]. DOT Bureau of Transportation Statistics (BTS), Vehicle Inventory and Use Survey (VIUS), https://www.bts.gov/vius.
[117]. DOT BTS, VIUS 2002 (supporting datasets), December 1, 2004, https://doi.org/10.21949/1506070.
[118]. ORNL, TEDB, Table 5.5; FHWA, “Annual Vehicle Distance Traveled in Miles and Related Data – 2002, by Highway Category and Vehicle Type,” Highway Statistics Series, accessed September 5, 2022, https://www.fhwa.dot.gov/policy/ohim/hs02/pdf/vm1.pdf.
[119]. Note: Reproduced from ORNL TEDB Figure 5.2.
[120]. ORNL, TEDB, Table 5.7.
[121]. Rick Mihelic et al., “GUIDANCE REPORT: Electric Trucks Where They Make Sense” (North American Council on Freight Efficiency (NACFE), May 2018), https://nacfe.org/wp-content/uploads/edd/2018/04/NACFE_CBEV_FULL_050118.pdf.
[122]. Robert Atkinson, “Time to Modernize How We Pay for Infrastructure” (RealClearPolicy, March 2018), https://itif.org/publications/2018/03/01/time-modernize-how-we-pay-infrastructure/; Robert Atkinson, “A Policymaker’s Guide to Road User Charges” (ITIF, April 2019), https://itif.org/publications/2019/04/22/policymakers-guide-road-user-charges/; Robert Atkinson et al., “Letter to House and Senate Transportation Committee Leaders Regarding a Vehicle Miles Traveled (VMT) Tax” (March 2021), https://itif.org/publications/2021/03/03/letter-house-and-senate-transportation-committee-leaders-regarding-vehicle/.
[123]. Robert Atkinson, “A Policymaker’s Guide to Road User Charges.”
[124]. Robert Atkinson et al., “Letter to House and Senate Transportation Committee Leaders Regarding a Vehicle Miles Traveled (VMT) Tax.”
Editors’ Recommendations
November 28, 2018
An Innovation Agenda for Deep Decarbonization: Bridging Gaps in the Federal Energy RD&D Portfolio
March 1, 2018
Time to Modernize How We Pay for Infrastructure
April 22, 2019
