
The Bayh-Dole Act’s Role in Stimulating University-Led Regional Economic Growth
Universities play a pivotal role in America’s technology economy, serving as a crucial source of research, inventions, patents, start-up technology companies, and regional economic and employment growth. The Bayh-Dole Act has played an instrumental role in spurring academic technology transfer activities that serve as vital drivers of American innovation.
KEY TAKEAWAYS
Key Takeaways
Contents
The Bayh-Dole Act’s Foundational Role in America’s Tech Economy 3
Universities’ Roles in Regional and National Life Sciences Leadership. 7
U.S. State Competitiveness in Pharmaceuticals and Biotechnology Manufacturing 8
Best University Practices Stimulating Technology Commercialization. 34
Introduction
Universities play a pivotal role in America’s technology economy, serving as a crucial source of research, inventions, patents, start-up technology companies, and regional economic and employment growth. In fact, the impact of academic technology transfer from U.S. universities has been so extensive that, from 1996 to 2020, it resulted in 554,000 inventions disclosed, 141,000 U.S. patents granted, and 18,000 start-ups formed.[1] Moreover, academic technology transfer has bolstered U.S. gross domestic product (GDP) by up to $1 trillion, contributed to $1.9 trillion in gross U.S. industrial output, and supported 6.5 million jobs over that time.[2]
But it wasn’t always that way. That American universities have been transformed into engines of innovation and powerful catalysts of regional economic growth has been in no small part the result of seminal bipartisan legislation introduced in 1980 called the Patent and Trademark Law Amendments Act, better known as the “Bayh-Dole Act.” The legislation both created a uniform patent policy among the many federal agencies funding research and allowed universities to retain ownership of the intellectual property (IP) and inventions made as a result of federally funded research.[3]
In the years that followed, the Bayh-Dole Act would spawn robust academic technology transfer and commercialization capabilities and activities at hundreds of universities across the United States. That in turn would lead to the formation of thousands of advanced-technology start-up companies, especially in the life sciences sector, that would give rise to university-anchored, technology-based clusters and catalyze regions’ and states’ economic growth.
This report begins by recounting the history of the Bayh-Dole Act and documenting its role in transforming American universities into globally envied engines of innovation. It then examines how university tech transfer has given rise to regional technology clusters, especially in life sciences industries. It next examines U.S. states’ overall competitiveness in the pharmaceutical and biotechnology sectors before exploring how, in six states—Colorado, Delaware, Georgia, Indiana, Kansas, and North Carolina—universities have played a transformative role in driving forward regions’ and states’ technology-based economies.
The report concludes with proposals for university leaders to better stimulate innovation and also policy recommendations for federal and state policymakers to maximize the potential of America’s innovation economy, particularly regarding the roles played by universities. Here, it emphasizes that the federal government has already been underinvesting in university R&D funding both relative to peer nations and in America’s own historical terms—and that’s even well before recently announced Trump administration cuts to scientific research that threaten to considerably hamstring America’s research-driven innovation economy going forward.
The Bayh-Dole Act’s Foundational Role in America’s Tech Economy
The United States has made tremendous contributions to the global innovation economy over the past 45 years, notably spearheading both the information technology (IT) and biotechnology revolutions. In fact, in recent decades, U.S. companies have accounted for nearly half the global new drug pipeline.[4] But it wasn’t always that way; indeed, for many decades after World War II, the United States was a global also-ran in drug innovation.[5] In the latter half of the 1970s, European-headquartered enterprises introduced more than twice as many new drugs to the world as did those in the United States.[6] In fact, as recently as 1990, the global research-based pharmaceutical industry invested 50 percent more in Europe than in the United States.[7] That the United States has come to lead the world in biopharmaceutical innovation has been the result of many public and private factors—patent rights, world-leading R&D investment, tax policy that incentivizes innovation, a drug pricing system historically allowing companies to earn sufficient revenues to sustain R&D investment, etc.—but the Bayh-Dole Act’s role in turning federally funded research into meaningfully impactful life sciences (and other technological) innovations for society has been as important as any of these.[8]
Before the passage of Bayh-Dole, only a handful of U.S. universities even had technology transfer or patent offices.
Before Bayh-Dole (i.e., pre-1980), the federal government had a very weak track record in commercializing the IP it owned as a result of publicly funded research conducted at universities (or federal laboratories). As late as 1978, the federal government had licensed less than 5 percent of the as many as 30,000 patents it owned.[9] Likewise, throughout the 1960s and 1970s, many American universities shied away from direct involvement in the commercialization of research.[10] Indeed, before the passage of Bayh-Dole, only a handful of U.S. universities even had technology transfer or patent offices.[11]
Aware as early as the mid-1960s that the billions of dollars the federal government was investing in R&D were not paying the expected dividends, President Johnson in 1968 asked Elmer Staats, then America’s comptroller general, to analyze how many drugs had been developed from National Institutes of Health (NIH)-funded research. Johnson was stunned when Staats’s investigation revealed that “not a single drug had been developed when patents were taken from universities [by the federal government].”[12] As his report to Congress elaborated:
At that time we reported that HEW [the Department of Health, Education, and Welfare, predecessor of the Department of Health and Human Services] was taking title for the Government to inventions resulting from research in medicinal chemistry. This was blocking development of these inventions and impeding cooperative efforts between universities and the commercial sector. We found that hundreds of new compounds developed at university laboratories had not been tested and screened by [the] pharmaceutical industry because the manufacturers were unwilling to undertake the expense without some possibility of obtaining exclusive rights to further development of a promising product.[13]
Policymakers were also aware that the commercialization of discoveries stemming from federally funded research was languishing. As Joseph P. Allen wrote, “Congress was rightly concerned that potential benefits from billions of dollars of federally funded research were lying dormant on the shelves of government.”[14] Congressmembers were also cognizant that rules about ownership of IP stemming from federal research funding needed to be aligned and streamlined across federal agencies. The stagflation, economic malaise, and heightened foreign competition America confronted in the 1970s amplified pressure on policymakers to generate solutions to revitalize America’s faltering economy.[15]
Senators Birch Bayh (D-IN) and Bob Dole (R-KS) responded by collaborating to introduce legislation that would allow universities, small businesses, and nonprofit institutions to take ownership of IP rights stemming from discoveries made from federally funded research. As John Rabitschek and Norman Latker noted as the legislation was being debated in Congress, “A broad political consensus ultimately developed around the notion that market forces would do a better job of commercializing government-funded technology than federal agencies could.”[16] By enacting Bayh-Dole, Congress decentralized patent management from the federal bureaucracy into the hands of the inventing organizations. As the first words of the Bayh-Dole Act explicitly noted, “It is the policy and objective of the Congress to use the patent system to promote the utilization of inventions arising from federally supported research and development.”[17]
In the first two decades after the enactment of Bayh-Dole, American universities experienced a tenfold increase in their patents and created more than 2,200 companies to exploit their technology.
The impact was immediate and lasting. The Bayh-Dole Act has been widely praised as a significant factor contributing to the United States’ “competitive revival” in the 1990s.[18] In 2002, The Economist called Bayh-Dole:
Possibly the most inspired piece of legislation to be enacted in America over the past half-century. Together with amendments in 1984 and augmentation in 1986, this unlocked all the inventions and discoveries that had been made in laboratories throughout the United States with the help of taxpayers’ money. More than anything, this single policy measure helped to reverse America’s precipitous slide into industrial irrelevance.[19]
Moreover, allowing U.S. institutions to earn royalties through the licensing of their research provided a powerful incentive for universities and other institutions to pursue commercialization opportunities.[20] The Bayh-Dole Act almost immediately led to a considerable increase in academic patenting activity. For instance, whereas only 55 U.S. universities had been granted a patent in 1976, 240 universities had been issued at least one patent by 2006.[21] Similarly, while only 390 patents were awarded to universities in 1980, by 2009, that number had increased to 3,088—and by 2015, to 6,680. Another analysis finds that in the first two decades after the enactment of Bayh-Dole (i.e., 1980 to 2002), American universities experienced a tenfold increase in their patents and created more than 2,200 companies to exploit their technology.[22]
In total, from 1996 to 2020, academic technology transfer resulted in 554,000 inventions disclosed, 141,000 U.S. patents granted, and 18,000 start-ups formed.[23] In fact, on average, three new start-up companies and two new products are launched in the United States every day as a result of university inventions brought to market, in part thanks to the Bayh-Dole Act.[24] This activity has bolstered U.S. GDP by up to $1 trillion and contributed to $1.9 trillion in gross U.S. industrial output. Further, more than 200 drugs and vaccines have been developed through public-private partnerships since the Bayh-Dole Act entered force in 1980.[25] Seventy-three percent of university IP licenses go to start-ups or small companies. Notably, start-ups spun out of research universities have higher success rates and file more patent applications than do other firms.[26]
As Harvard University’s Naomi Hausman has definitively written, “The sort of large-scale technology transfer from universities that exists today would have been very difficult and likely impossible to achieve without the strengthened property rights, standardized across granting agencies, that were set into law in 1980.”[27] Hausman has also analyzed Bay-Dole’s impact in shaping university relations with local economies and found that the increase in university connectedness to industry under the IP regime has created by Bayh-Dole produced important local economic benefits. In particular, Hausman has found that long-run employment, payroll, payroll per worker, and average establishment size has grown differentially more after the 1980 Bayh-Dole Act in industries more closely related to innovations produced by a local university or hospital.[28] There is also evidence that the Bayh-Dole Act has contributed to university faculty responding to royalty incentives by producing higher-quality innovations.[29] Evidence further suggests that patenting has increased most after Bayh-Dole in lines of business that most value technology transfer via patenting and licensing.[30]
Related research by Tatari and Stern finds that the quality of local entrepreneurship and start-ups increases in the presence of a university or a federally funded research institution, such as a national laboratory.[31] They examined the percentage change in the quality-adjusted number of start-ups associated with the presence of a research university or a national laboratory, and found that changes in federal research commitments to universities are uniquely linked to positively correlated changes in the quality-adjusted quantity of entrepreneurship. (See figure 1.)
Figure 1: Percentage change in the quality-adjusted number of start-ups associated with the presence of a research university or a national laboratory[32]

Essentially, what the authors concluded is that “research funding to universities seems to play a unique role in promoting the acceleration of local entrepreneurial ecosystems.”[33] As they elaborated, “[W]e find that a positive shock in the allocation of Federal resources (both research and non-research, to universities or national laboratories) is associated with a meaningful increase in the quantity of entrepreneurship. This is in line with the idea that, as large local economic institutions, universities induce local demand for entrepreneurship of all types.”[34] Moreover, they continued, “[W]hen we turn to an analysis of the Federal resources on the quality-adjusted quantity of entrepreneurship (i.e., accounting for the potential for growth and spillovers from these start-ups), we find a very sizeable positive impact of Federal research expenditures towards universities.”[35]
Universities’ Roles in Regional and National Life Sciences Leadership
U.S. universities have played a key role in underpinning America’s life sciences leadership. Indeed, as Maryann Feldman wrote in a foundational 2000 paper, “Where Science Comes to Life: University Bioscience, Commercial Spin-offs, and Regional Economic Development,” “Increasingly, it is recognized that the engines of national economic performance are subnational technology districts that are characterized by strong ties between regional actors.”[36] As she continued, “The pattern of commercialization in bioscience favors the spin-off of new firms from university departments.”[37] Feldman also observed that “the importance of new scientific information”—often emerging from U.S. universities—“to the development of a technologically intensive industry leads to geographic clustering in that industry.”[38]
In a comprehensive February 2020 article in Nature Biotechnology, “The biotech living and the walking dead,” Godfrey, Allen, and Benson made an assessment of U.S. universities’ licensing of life sciences IP to start-up companies over the preceding decades. Especially notable, the authors documented a tenfold increase in university licenses to entrepreneurial life sciences firms between 1990 and 2005.[39] The researchers found that the top 50 patent-producing U.S. universities (between 1969 and 2008) accounted for 69.7 percent of all university patents over those four decades; by comparison, the next 50 universities generated only one-quarter as many patents (18 percent), and the remaining 472 schools produced the final 12 percent.[40]
The researchers also found a significant skew in the distribution of life sciences firms founded at the top 50 universities. Specifically, they found that the top five universities produced one-third of new life sciences start-ups, the top ten universities accounted for half (49 percent) of the start-ups, and the bottom seven universities produced only 3 percent of the start-ups.[41]
Of 498 university-licensed start-up life-science companies studied from 1990 to 2011, 68 percent stayed located within 60 miles of the founding university.
The authors then accrued locational data for 498 university-licensed life sciences start-ups for the years 1990 to 2011. They found that 68 percent of those companies remained located within 60 miles of the founding university (while the rest migrated away). The authors found that 23 percent of the companies were founded in the “well-established biotech clusters” around Boston/Cambridge, the San Francisco Bay Area, and San Diego. As they noted, “The advantages of locating in an economic cluster come, in large measure, from the close physical proximity of firms and others in the ecosystem to each other. This proximity facilitates deep and rich human interactions that help solve technical problems and strengthen commercial activities.”[42] In explaining the life sciences start-ups’ locational decisions, the authors found them best explained by a process of “assortive matching” or the idea that firms succeed because they locate in communities that provide an optimal “resource match” (whether with regard to talent, infrastructure, access to risk capital, etc.).
The authors’ research reconfirms previous findings that indeed life sciences companies often stay in the vicinity of the university that helped found them. For instance, in 1993 research, Delaney found that biotech start-ups “tend to be formed in the same geographical region as the parent firm or incubator” and that they used local information sources (within a 50-mile radius of the firm).”[43] Feldman also emphasized this tendency of bioscience companies to stay local. As she writes:
In interviews, we ask scientists where they would like to set up shop if they could locate anywhere in the world. The response is that even though they are part of global networks, have international opportunities, and easily could locate anywhere and still stay connected with new telecommunications technologies, they typically want to stay where they are.[44]
Godfrey, Allen, and Benson noted that one lesson for policymakers and university administrators from their research is that, “[c]ommunities should not focus on being good in the ‘life sciences’; they should create and develop resources around some narrow slice of the sector and become best-in-class in that area.”[45] As they wrote, “Universities should focus less on building strong colleges (for example, life science or medicine), and specialize more on outstanding departments (for example, genetics or ophthalmology).”[46] They pointed, for instance, to Orange County becoming a hotbed for ophthalmology innovation, though certainly there are other examples of this, such as Minneapolis being a hotbed of bioelectronics, Maine specializing in clinical human diagnostics, or Maryland and Virginia having specialties in immunological products.[47]
U.S. State Competitiveness in Pharmaceuticals and Biotechnology Manufacturing
Economists use an analytical statistic known as a location quotient (LQ) to measure a region’s level of industrial specialization relative to that of a larger geographic unit (such as a state or a nation). So, for instance, if a state has an LQ of 1 for the pharmaceutical industry, this would mean that the industry contributes exactly as much to that state’s economy as it contributes to the U.S. economy. Thus, states can be analyzed by whether they are more or less relatively concentrated (or “specialized”) in the industry compared to peer states. The Information Technology and Innovation Foundation (ITIF) has run this analysis for the pharmaceutical and medicine manufacturing and biotechnology R&D sectors.
Pharmaceutical and Medicine Manufacturing
The pharmaceutical and medicine manufacturing industry includes the research, development, and production of drugs, medications, and other medical products. Maine leads the nation with an LQ of 5.01, indicating a concentration of pharmaceutical manufacturing five times greater than the national average. (See figure 2.) Delaware (3.68) and Utah (3.52) are relatively large pharmaceutical hubs, in large part thanks to their business-friendly environments and established research infrastructure. North Carolina (2.79), Kansas (2.14), and Indiana (2.04) round out the top six states, with a strong pharmaceutical manufacturing presence supported by research universities and specialized industrial hubs. California, while over-performing, has a lower LQ of 1.22.
Figure 2: Pharmaceutical and medicine manufacturing LQ, 2022[48]
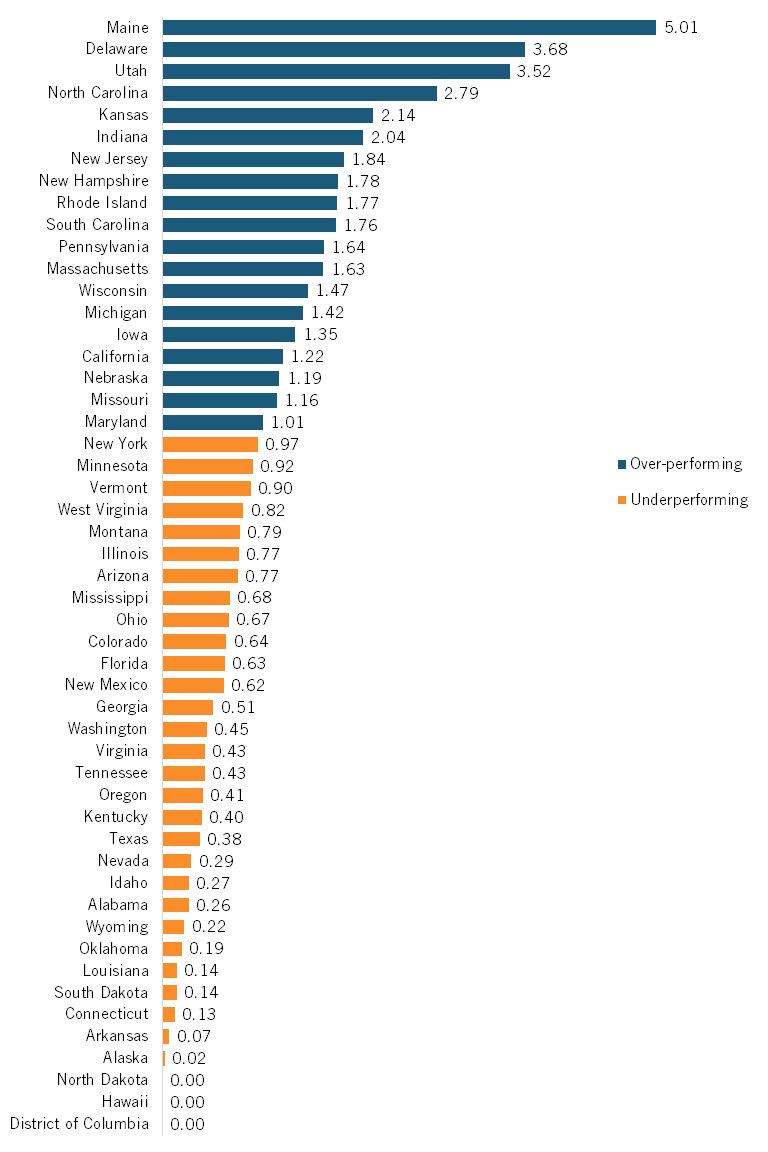
Most U.S. states underperform in pharmaceutical and medicine manufacturing, with 29 states posting LQs below 1. Surprisingly, some states with large populations and significant research institutions show relatively low concentrations, such as Florida (0.63), Washington (0.45), and Texas (0.38). The lowest-performing states include Arkansas (0.07), Alaska (0.02), and several states with no significant pharmaceutical manufacturing presence (0.00), such as the District of Columbia, Hawaii, and North Dakota.
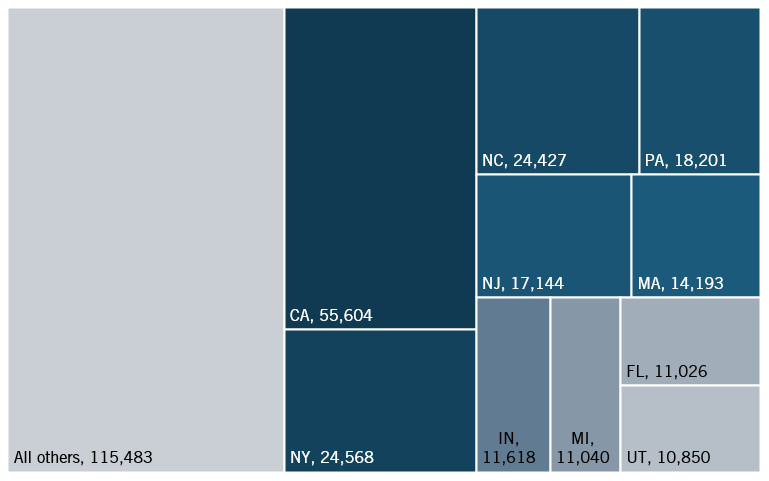
California leads the pharmaceutical and medicine manufacturing industry with 55,604 employees, making it the top state in this sector in absolute employment despite its modest LQ. New York and North Carolina follow with 24,568 and 24,427 employees, respectively. (See figure 3.) Pennsylvania, New Jersey, and Massachusetts, with large metropolitan areas and developed health-care infrastructure, are also leaders in this industry with over 14,000 employees each. Utah has 10,850 employees, while Delaware employs just 1 percent of the nationwide workforce (3,986).
Figure 3: Number of employees in pharmaceutical and medicine manufacturing (top 10 states, and all others)[49]
Biotechnology R&D
The biotechnology R&D industry focuses on harnessing biological processes for medical, agricultural, industrial, and environmental applications. Firms in this industry range from small start-ups developing novel therapies to large multinational corporations with expansive research pipelines. The industry is critical for technological advancement, medical breakthroughs, and maintaining the United States’ global innovation and scientific discovery leadership.
Massachusetts dominates the biotech R&D landscape with an impressive LQ of 6.49, reflecting its dense concentration of research universities, biotechnology firms, and research hospitals. (See figure 4.) Delaware follows with an LQ of 4.15, while Maine (2.86), California (2.58), and Maryland (2.48) round out the top five performers. These states benefit from robust academic-industry partnerships, substantial research funding, and established innovation ecosystems attracting top scientific talent and investment.
Figure 4: Biotechnology R&D LQ, 2022[50]
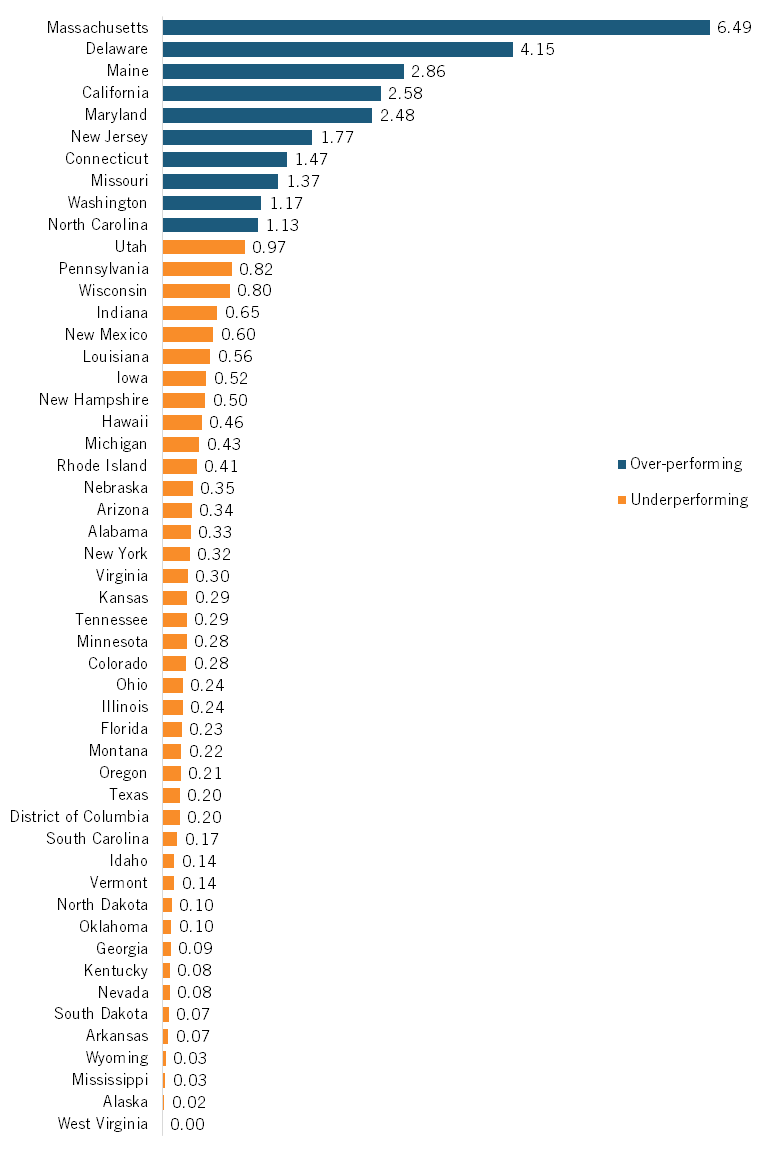
Most states show a relatively low concentration in biotechnology R&D, with 39 states having LQs below 1.00. Notably, several states with large economies underperform significantly, including New York (0.32), Florida (0.23), and Texas (0.20). The lowest-performing states include Wyoming (0.03), Mississippi (0.03), and Alaska (0.02), with West Virginia showing no significant biotechnology R&D activity (0.00). This distribution highlights the industry’s tendency to cluster around major research institutions and established innovation hubs, leaving many regions with limited biotechnology R&D activity despite their economic size.
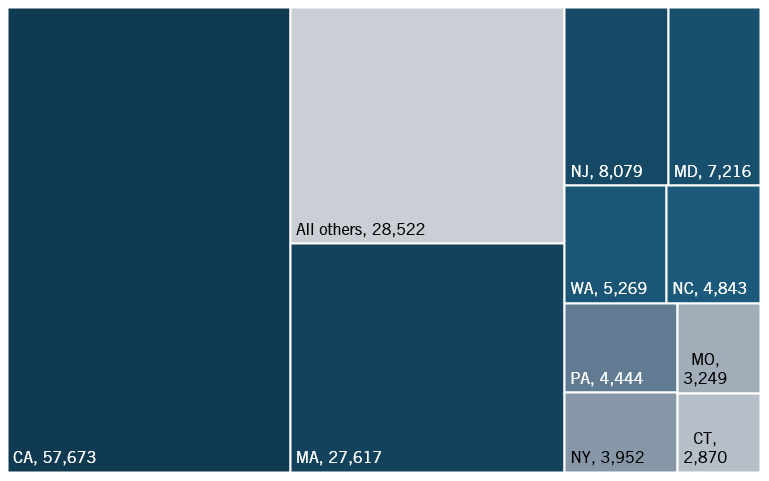
California leads the biotechnology industry with 57,673 employees, far outpacing other states. (See figure 5.) Massachusetts follows with 27,617 employees. Both states are significant biotechnology hubs, with areas such as Cambridge, Massachusetts, and San Diego, California, acting as magnets for high-caliber biotechnology companies such as Thermo Fisher Scientific and Bristol Meyers Squibb. New Jersey, Maryland, and Washington also play key roles, employing over 5,000 individuals each. The remaining states outside the top 10 collectively account for 28,522 employees. Among these states are Delaware and Maine, which employ 2,199 and 1,457 employees, respectively—modest amounts considering their large LQs in the industry.
Figure 5: Number of employees in biotechnology R&D (top 10 states, and all others)[51]
State-Level Analysis
This section provides a state-level analysis of the university-driven technology economies of six states: Colorado, Delaware, Georgia, Indiana, Kansas, and North Carolina. Of course, the stories of the university-driven regional innovation economies of states such as California and Massachusetts have been well documented.[52] These six states were chosen both because they have key research universities contributing to the innovation economies of their state and because they provide a diversity of geographical and industrial perspectives. (Note: data for the following states pertaining to their universities’ attraction of federal and private sector R&D investment, invention disclosures (IDs), patenting, IP licensing, and start-up activity is derived from the Association of University Technology Manager’s (AUTM’s) STATT database, which AUTM kindly provided ITIF access to for this research.)[53]
Colorado
Colorado’s Tech Economy
As of 2023, Colorado’s technology industry encompassed over 32,700 establishments and employed more than 302,000 individuals. The sector accounts for 10 percent of the state’s employment and contributes over $106 billion to Colorado’s gross state product (GSP), representing 20 percent of the state’s total economic output—a 2 percent increase from 2021. Notably, Colorado ranks third nationally in tech industry concentration, trailing only Massachusetts and New Mexico.[54]
Colorado’s fast-growing tech sector added 47,440 net new jobs between 2018 and 2023, the highest among major industries in the state. Coloradoans’ average earnings per worker in the tech sector stand at $165,500, positioning Colorado sixth nationally for tech wages. Further, the industry exhibits a significant multiplier effect; for every new tech job created, an additional 2.67 jobs emerge in other sectors.[55]
Colorado’s life sciences ecosystem is equally robust, comprising over 720 companies and organizations spanning biotechnology, medical devices, diagnostics, digital health, and pharmaceuticals. This sector directly employs more than 38,000 individuals, marking an 11 percent increase since 2018.[56]
Colorado has become a budding location for venture capital (VC) investment over the last several decades. From 1997 to 2023, Colorado received over $61 billion in VC investment, equivalent to 0.8 percent of Colorado’s GSP. Colorado ranks fifth nationally in relative VC investment, behind only Massachusetts, California, Washington, D.C., and New York. In 2023, VC in Colorado totaled $3.8 billion, or 0.7 percent of GSP.[57] In 2024, Colorado’s life sciences sector raised a record $2.15 billion in VC, a 46 percent increase compared with 2023.[58]
Jobs in science, technology, engineering, and mathematics (STEM) fields account for 19 percent of Colorado’s workforce, with 750,000 individuals working in these fields. These jobs are highly concentrated in urban areas, with more than half of Colorado’s STEM employees working in the Denver metro area (395,200), while Boulder and Colorado Springs employ 95,000 and 92,700 STEM workers, respectively. On a more granular level, Colorado employs 251,900 workers in science and engineering positions.[59]
Universities Anchoring Colorado’s Tech Economy
Colorado’s universities anchor the state’s technology economy and make significant contributions to the broader state economy. The University of Colorado system alone has estimated that it contributes nearly $20 billion to the state economy annually.[60] The University of Denver has estimated that it makes a $2.3 billion annual impact on Colorado’s economy.[61]
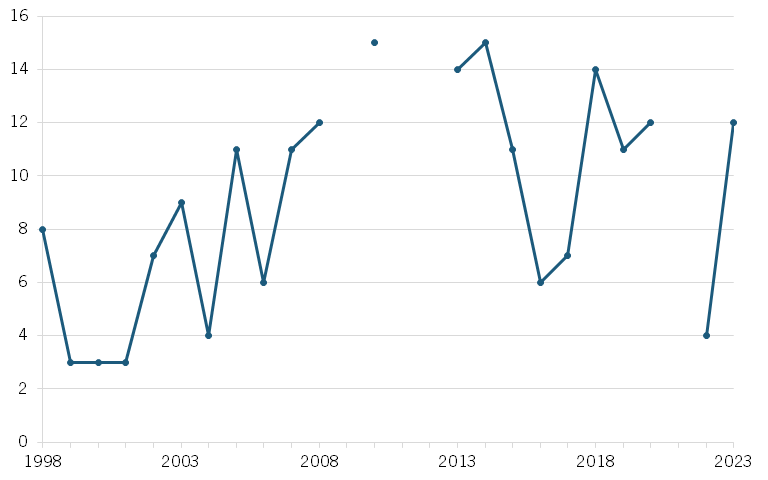
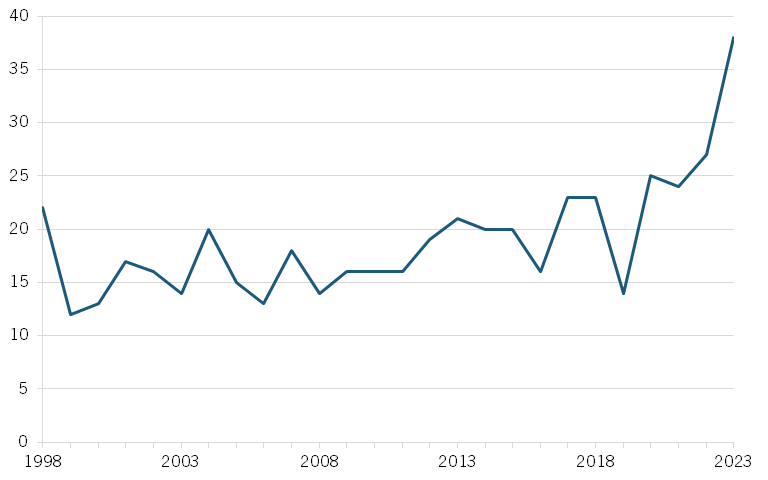
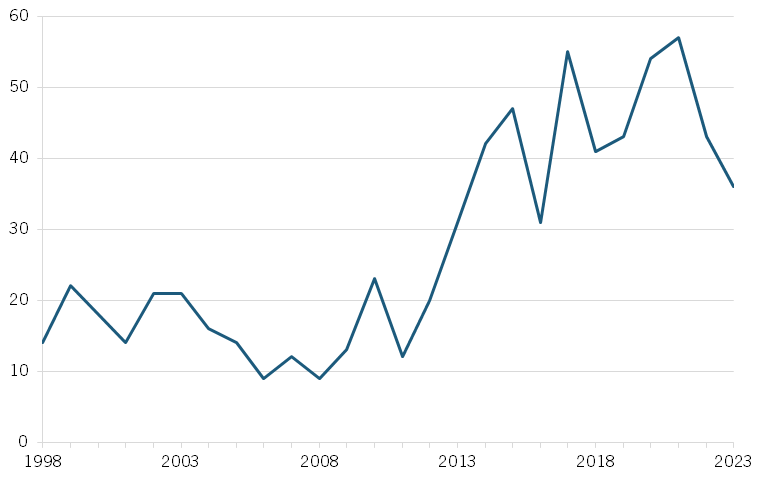
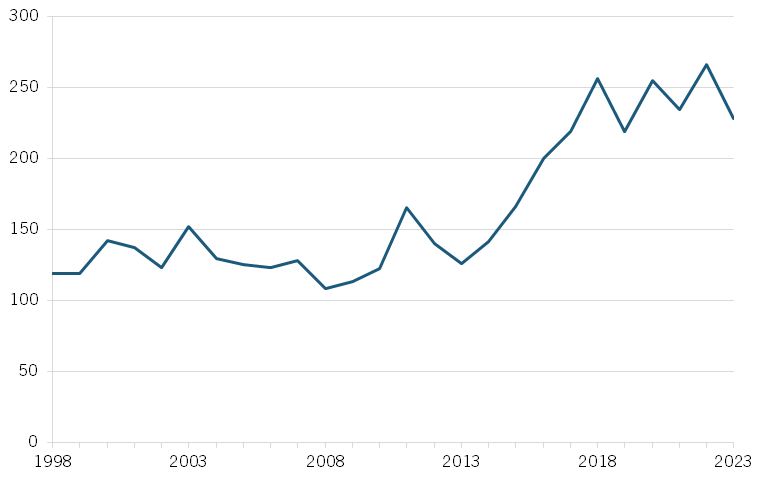
In the 25 years from 1998 to 2023, Colorado universities received $20.3 billion in federal R&D funding, led by $12 billion to the Boulder-based University of Colorado (CU) and $5.6 billion to Fort Collins-based Colorado State University (CSU). Research funding at Colorado’s universities grew tenfold over that period, with most of the investment supported by the federal government. Over those years, Colorado universities received $2.8 billion of business R&D investment, again led by CU ($1.9 billion) and CSU ($351.3 million). Colorado universities issued 8,295 IDs over those years, marked by a ninefold annual increase in IDs over that timeframe. (See figure 6.) Innovators have generated 1,626 patents from the U.S. Patent and Trademark Office (USPTO) based on research initially conducted at Colorado universities. (See figure 7.) Additionally, Colorado universities issued 1,687 IP licenses over that time period. In 2024 alone, the CSU system had 99 invention disclosures and 144 patent applications.[62]
Figure 6: IDs from Colorado universities,1998–2023[63]
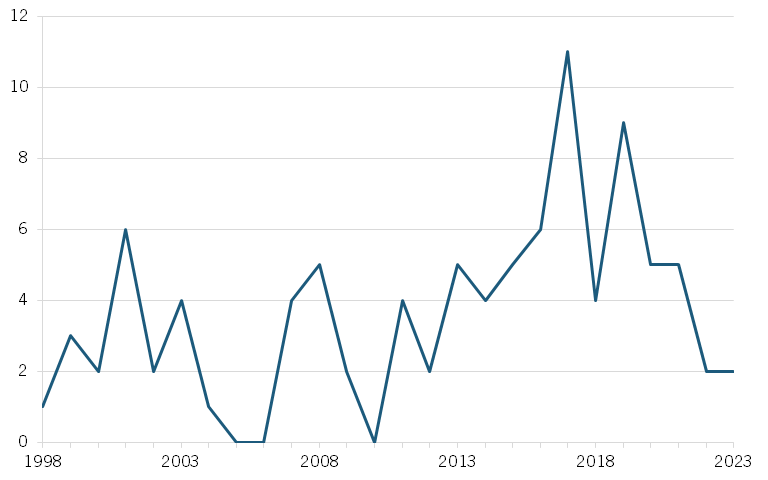
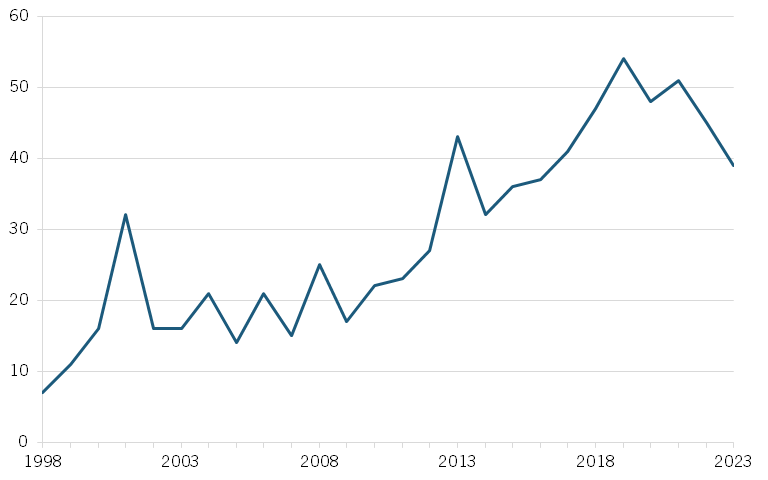
Colorado universities contributed to the launch of 401 start-up companies from 1998 to 2023; however, that number has significantly increased since 2019, as over one-third of Colorado university start-ups have been launched in that time.
Figure 7: Issued USPTO patents from Colorado universities, 1998–2023[64]
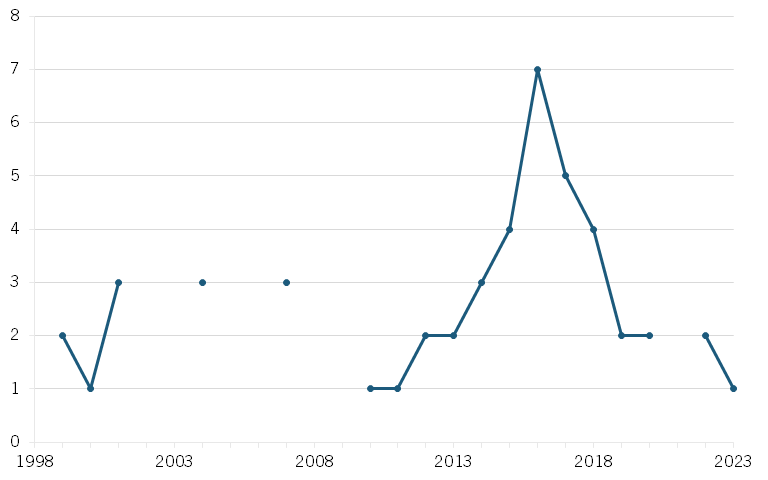
Colorado universities contributed to the launch of 401 start-up companies from 1998 to 2023 (see figure 8); however, that number has significantly increased since 2019, as over one-third of Colorado university start-ups have been launched in that time. CU leads the state with 237 new start-ups since 1998, followed by CSU with 101 and the Colorado School of Mines with 29.
Figure 8: Start-ups launched out of Colorado universities, 1998–2023[65]
According to USPTO data on patenting by U.S. regions, from 2000 to 2015 (the most recent available data), Colorado produced 34,121 technology patents. The Denver-Aurora-Broomfield metropolitan statistical region led with 11,439 patents, followed by Boulder with 9,140, Fort Collins-Loveland with 5,867, Colorado Springs with 3,750, and Greeley with 3,125. Over that timeframe, patenting activity in the Denver metro area increased by 92 percent, in Boulder by 81 percent, and in the Fort Collins area by 30 percent.[66]
Showing the strength of universities in anchoring Colorado’s bioeconomy, Boulder and the Fort Collins region stand behind only Denver in leading the state in patents for drug treatments and immunological testing technologies. As a whole, Colorado filers were issued 874 patents for drug treatments and 113 for immunological test technologies between 2000 and 2015.[67]
Innovation Vignette: CSU Enables Groundbreaking Genomic Variation Research
CSU has been home to groundbreaking research into genomic analysis.[68] The NASA Twins Study, featuring astronaut Scott Kelly’s year-long mission aboard the International Space Station and his identical twin Mark Kelly on Earth, marked a milestone in space medicine. The twin brothers provided a perfect test case to compare the effects of space on the body’s genome. Among its many findings, the study identifies changes in gene expression and genomic structural variations due to space radiation. A breakthrough tool in the study was Directional Genomic Hybridization (dGH)™—a technology invented in 2007 by CSU researchers and the University of Texas Medical Branch. DGH revealed persistent genomic changes, such as increased inversions, even after astronauts returned to Earth, which signaled possible long-term health risks such as cancer.
This progress was made possible through strong public sector support, highlighting the critical role of government-funded research in innovation. NASA’s backing enabled the implementation of dGH in astronaut health monitoring, while the National Human Genome Research Institute and CSU Ventures—the university’s tech transfer office (TTO)—provided key funding and commercialization support. With CSU Ventures’ assistance, the dGH technology evolved from a university invention into KromaTiD, a start-up now offering cutting-edge genomic analysis tools, particularly in gene therapy safety.
Innovation Vignette: CSU Advancing Personalized Cancer Treatment
PhotonPharma, a biotechnology company based in Fort Collins, Colorado, developed InnoCell. This personalized cancer vaccine uses a photochemical process involving riboflavin and ultraviolet (UV) light to inactivate a patient’s tumor cells. These inactivated cells are then reinfused to stimulate the immune system to recognize and attack cancer, providing an individualized approach to immunotherapy. The treatment has shown promise in preclinical models for breast and ovarian cancer.
A major catalyst in the development of InnoCell was the support provided by CSU. PhotonPharma was incubated within CSU’s Research Innovation Center (RIC), a facility that provides access to critical lab space, research infrastructure, and a collaborative scientific environment. CSU’s partnership not only helped lower the barriers to early-stage development but also accelerated the company’s ability to achieve regulatory milestones. This university-industry collaboration was instrumental in guiding PhotonPharma from concept to clinical readiness.
Delaware
Delaware’s Tech Economy
Technology-based industries represent a core driver of Delaware’s economy. The state’s life sciences sector employs 11,000 individuals and directly contributes $2 billion to Delaware’s GSP annually. The sector represents about 2.5 percent of both total state employment and GSP. The industry encompasses a range of sub-sectors, including R&D, medical laboratories, pharmaceuticals, and agricultural biosciences.[69]
The state’s IT sector generates approximately $1.13 billion annually and encompasses various industries, including advanced manufacturing, architectural and engineering services, IT and software publishing, scientific R&D, and telecommunications. As of 2023, Delaware employed 22,687 individuals in high-tech jobs, with projections estimating 25,511 by 2028.[70]
Delaware ranks seventh nationally for life sciences VC funding per capita, highlighting its competitive position in attracting investment. Because of Delaware’s growth as a biotechnology and pharmaceutical hub, VC investment is growing in the state. In 2000, VC amounted to just 0.06 percent of GSP. In 2021, it reached a high of 3.04 percent. Delaware ranks sixth in the country in overall VC investment as a share of GSP, and in absolute terms, the state has received $10.7 billion since 1997.[71]
STEM employees account for 18 percent of the working population in Delaware, with 110,200 people employed in these fields. As it is the largest metropolitan area in the state, Wilmington employs the most individuals in STEM fields (68,400), followed by the Salisbury metro area (23,800), and Dover (18,000). Less than one-fourth of all STEM employees in Delaware work in science and engineering fields (26,900), suggesting that the majority are employed in tech industries.[72]
Universities Anchoring Delaware’s Tech Economy
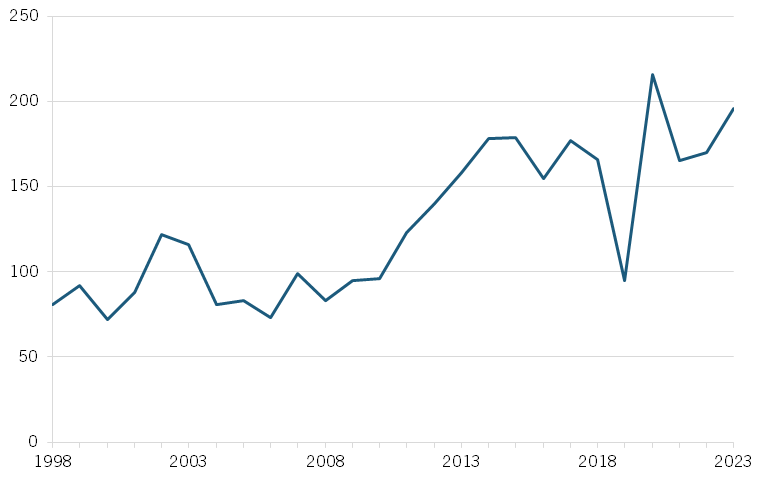
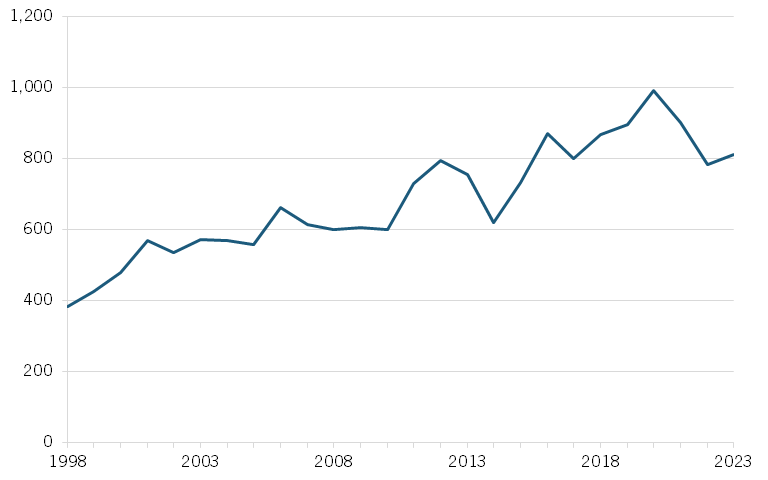
Delaware universities received $3.2 billion in R&D funding between 1998 and 2023, driven principally by the state’s flagship university: the University of Delaware. Over those 25 years, research investment at the university more than tripled. The majority of this investment came from the federal government ($2.1 billion), while just $179 million came from private businesses. During this 25-year period, the University of Delaware disclosed 1,000 inventions. (See figure 9). Patent applicants leveraging research conducted at Delaware universities received 198 patents from USPTO over that timeframe. (See figure 10). (Note: years without data reported are left blank in the following charts.) Delaware universities also issued 99 IP licenses over that timeframe.
Figure 9: IDs from Delaware universities,1998–2023[73]
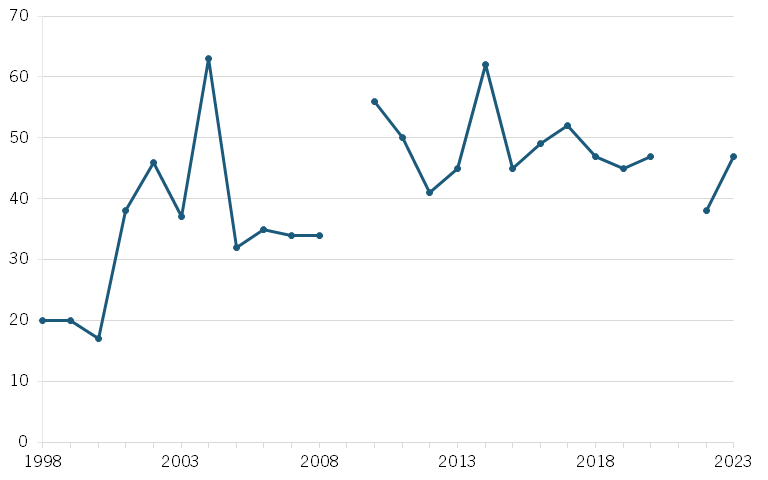
Figure 10: Issued USPTO patents from Delaware universities,1998–2023[74]
The University of Delaware is responsible for having launched 48 start-ups between 1998 and 2023, although the number of annual start-ups launched declined since reaching a high in 2017. (See figure 11). That year alone, seven start-ups were launched from the university, while in 2023, just one start-up was reported.
From 2000 to 2015, Delaware as a whole produced an estimated 3,544 technology patents.[75] Notably, 512 of the patents filed in Delaware were for drug treatments, meaning approximately one out of every seven Delaware patents were issued for drug-related discoveries.[76]
Figure 11: Start-ups launched out of Delaware universities,1998–2023[77]
Innovation Vignette: University of Delaware Expanding Access to Safe Drinking Water
Two billion people globally lack access to safe drinking water, and twice as many suffer from poor sanitation, leading to 3.4 million annual deaths—primarily among children—from waterborne diseases. In response to this urgent challenge, researchers Pei Chiu and Yan Jin at the University of Delaware developed a groundbreaking, nonchlorine-based water purification technology that removes 99.999 percent of bacteria and viruses. Unlike traditional methods, this approach uses elemental iron to chemically inactivate or bind viruses and pathogens that are typically resistant to chlorination and filtration. The method is also cost effective, leveraging iron byproducts from steel production, making it viable for both industrial and low-resource settings.
Crucially, the innovation was supported by government-funded research, including a National Science Foundation (NSF) Small Business Innovation Research (SBIR) grant. Public investment enabled the initial discovery and refinement of the technology, and the zero-valent iron process has since been licensed for humanitarian use by the Center for Affordable Water and Sanitation Technology. Beyond drinking water, the researchers envision its use in agricultural settings, such as to produce wash systems to prevent foodborne illness outbreaks such as the 2006 E. coli outbreak event in the United States.
Innovation Vignette: University of Delaware Pioneers Reusable Carbon Fuel
Founded in 2018 by Dr. Basudeb Saha, RiKarbon is a start-up dedicated to transforming waste biomass and plant-based oils into renewable, high-performance products.[78] The company focuses on creating sustainable alternatives to petroleum-based ingredients used in cosmetics, lubricants, and other specialty chemicals. By utilizing nonconventional and typically unused carbon feedstocks, RiKarbon aims to reduce environmental impact and promote a circular economy. RiKarbon’s innovations include bio-based oils for emollients in personal care products and bio-poly-alpha-olefin base oils for performance lubricants.
RiKarbon’s origins are deeply rooted in research conducted at the University of Delaware. The company’s technology was developed in collaboration with the university’s Center for Catalytic Science and Technology, highlighting the institution’s role in fostering innovation. The 1980 Bayh-Dole Act has played a pivotal role in this process by allowing universities to retain ownership of inventions developed through federally funded research, thereby facilitating the commercialization of academic innovations. The legislative framework has enabled RiKarbon to license its technology and attract investment, exemplifying how supportive policies and university partnerships can drive the growth of sustainable enterprises.
Georgia
Georgia’s Tech Economy
Georgia’s life sciences industry represents a dynamic and rapidly growing sector. According to a 2021 economic impact study, life sciences companies in Georgia generate $27.2 billion in direct economic impact and employ over 78,000 individuals. The state’s biosciences ecosystem comprises more than 4,000 organizations, with significant hubs in cities including Atlanta, Athens, and Augusta. These organizations span various subsectors, including biotechnology, pharmaceuticals, medical devices, ag biotech, and research institutions.[79]
The Georgia life sciences industry’s growth is further evidenced by a 14.7 percent increase in employment over the past decade. When accounting for multiplier effects, the life sciences sector supports approximately 194,000 jobs and contributes $21.8 billion to Georgia’s GSP. This expansive impact underscores the sector’s significance to the state’s overall economic health and its potential for future growth.[80]
Georgia’s IT industry exerts a substantial economic footprint as well, with an estimated impact of $113.1 billion. The state is recognized as a national leader in health IT, housing 8 of the top 100 health IT firms, which collectively generate $5 billion in revenue. Major companies such as McKesson Technologies, MedAssets, and Greenway Health have established operations in Georgia, reinforcing its status as a hub for technological innovation. Furthermore, Georgia ranks fifth nationally in IT employment concentration, underscoring the sector’s importance to the state’s workforce and economy.[81]
Since 2020, 114 start-ups have been launched out of Georgia’s universities.
Georgia’s workforce consists of 1.1 million employees in STEM positions, or 17 percent of all employees. The largest number of STEM employees are found in the Atlanta metro area (756,000), followed by the Augusta metro area (71,600), the city of Savannah (47,300), and Albany (36,400).[82]
Despite its strong start-up and innovation ecosystem, VC investment in Georgia has been lackluster. From 1997 to 2023, VC investment in the state equaled just 0.25 percent of GDP, placing it 30th in the nation compared with other states. VC investment growth has also been relatively anemic, as investment grew just 20 percent over the past decade, from 0.17 percent of GSP in 2013 to 0.21 percent in 2023.[83]
Universities Driving Georgia’s Tech Economy
The Athens-based University of Georgia (UGA) contributed $8.4 billion to the state’s economy in fiscal year 2024.[84] In 2023, Georgia Tech contributed $5.3 billion to the state’s economy, a year in which Georgia’s public universities in total contributed $21.9 billion to the state’s economy.[85]
Georgia universities received $22.7 billion in federal research funding between 1998 and 2023. Georgia Tech was allocated nearly half of this total ($10.1 billion), while Emory University ($8.2 billion) and the UGA ($3.2 billion) also received considerable investment. Since 1998, total investment in research at Georgia universities has grown by 7 percent annually, reaching over $3.2 billion by 2023. Investment in research from private businesses in Georgia amounted to $2.8 billion in that same period, with half again going to Georgia Tech ($1.5 billion). Emory University and the UGA received $839 million and $301 million, respectively. From 1998 to 2023, Georgia’s universities issued nearly 16,000 IDs. (See figure 12.) In addition, 3,299 patents were issued on technologies stemming from research conducted at Georgia’s universities over that timeframe. (See figure 13.) Additionally, Georgia’s universities issued 3,378 IP licenses.
Figure 12: IDs from Georgia universities,1998–2023[86]
Figure 13: Issued USPTO patents from Georgia universities,1998–2023[87]
Universities in Georgia contributed to the launch of 492 start-up companies from 1998 to 2023, although that number has shot up in recent years. (See figure 14.) Since 2020, 114 start-ups have been launched out of Georgia’s universities. Georgia Tech leads universities in the state with 236 start-ups since 1998, followed by Emory University (122) and UGA (116).
Figure 14: Start-ups launched from Georgia universities,1998–2023[88]
From 2000 to 2015, Georgia produced 26,641 technology patents, led overwhelmingly by the Atlanta region (home to Georgia Tech and Emory universities) with 22,970 patents, followed by Augusta with 617 patents and Athens with 616. Over that timeframe, Atlanta’s annual output of patents more than doubled, with 1,023 grants in 2000 and 2,143 in 2015, an increase of 109 percent.[89] Georgia also produced 931 patents for drug treatments, again with the majority coming from the Atlanta metro area.[90]
Innovation Vignette: Emory University Pioneers Innovative Cancer Treatment
In the 1990s, government-funded research at Emory University, supported in part by corporate backing from Nihon Mediphysics, led to the development of fluciclovine F-18, an imaging compound designed to detect cancer recurrence, particularly in lymph nodes and bones. The Office of Technology Transfer at Emory licensed the patents to Nihon Mediphysics in 2003, and in 2008 GE Healthcare acquired rights to the compound. However, GE deprioritized it in favor of other research, leaving Emory researchers and some GE employees, including David Gauden, frustrated by the lack of progress on a product they believed filled a critical unmet medical need.
Recognizing its potential, Gauden and colleagues left GE to found Blue Earth Diagnostics in 2014, with funding from Syncona (backed by the Wellcome Trust and Cancer Research UK). They licensed fluciclovine F-18 from GE, and with continued support from Emory’s TTO, strengthened the compound’s patent portfolio and brought it to market under the name Axumin. It received U.S. Food and Drug Administration (FDA) approval in 2016 and European approval the following year. Today, Axumin is used globally to guide prostate cancer treatment, benefiting thousands of patients. The journey of this innovation, spanning three continents and multiple institutions, underscores the crucial role of federally and institutionally funded research, TTOs, and collaborative public-private partnerships in translating scientific discoveries into lifesaving tools.
Innovation Vignette: University of Georgia Researcher Treats Dry Eyes
Restasis® is a groundbreaking prescription eye drop developed to treat chronic dry eye disease by addressing its underlying cause—inflammation—rather than merely alleviating symptoms. The drug’s origins trace back to 1994, when Dr. Renee Kaswan, a professor at UGA, formulated a topical cyclosporine treatment for dry eye in dogs, later marketed as Optimmune. Recognizing its potential for human application, Dr. Kaswan’s research, supported by federal funding, led to the development of Restasis, which received FDA approval in 2002. This approval marked Restasis as the first FDA-approved prescription treatment for chronic dry eye disease, a condition that affects millions worldwide.[91]
The impact of Restasis has been significant in the field of ophthalmology. By reducing ocular inflammation, Restasis enhances the eye’s natural ability to produce tears, providing relief for patients suffering from dry eye symptoms such as burning, itching, and blurred vision. Clinical studies have demonstrated its effectiveness, with most participants reporting improvement in symptoms. The development of Restasis has not only offered a novel therapeutic option for patients but also highlighted the importance of academic research and federal support in bringing innovative treatments to market.[92]
Innovation Vignette: University of Georgia Revolutionizes Protein Expression to Treat Rare Diseases
Synageva BioPharma Corp., originally founded as Avigenics in 1996 by UGA professor Dr. Robert Ivarie, began as a biotechnology company focused on producing therapeutic proteins using a transgenic chicken egg white expression system. In 2008, under the leadership of CEO Sanj K. Patel, the company rebranded as Synageva BioPharma and shifted its focus to developing treatments for rare diseases. Synageva’s lead product, Kanuma® (sebelipase alfa), is an enzyme replacement therapy for lysosomal acid lipase deficiency (LAL-D), a rare and life-threatening genetic disorder. Kanuma received orphan drug designation and fast-track status from the FDA.[93]
Recognizing the potential of Synageva’s pipeline and proprietary manufacturing platform, Alexion Pharmaceuticals announced in May 2015 its acquisition of Synageva for approximately $8.4 billion, one of the largest premiums paid in the biotech sector at that time. This acquisition not only expanded Alexion’s portfolio in rare disease therapeutics but also highlighted the significant impact of university-originated research on the biotechnology industry.[94]
Innovation Vignette: Georgia Tech’s Innovative Solar Cell Manufacturer
Suniva, a manufacturer of high-efficiency crystalline silicon solar cells and modules, was founded in 2007 as a spinout from the Georgia Institute of Technology’s University Center of Excellence for Photovoltaics (UCEP).[95] The company originated from the pioneering research of Dr. Ajeet Rohatgi, a renowned photovoltaic scientist and professor of electrical engineering at Georgia Tech. Suniva’s core technology focuses on advanced silicon solar cell architectures, including the development of high-efficiency monocrystalline cells using proprietary screen-printed metallization and optimized passivated emitter rear contact (PERC) designs.[96] These innovations significantly reduce recombination losses and improve light absorption, resulting in commercially competitive solar cells with conversion efficiencies exceeding 20 percent. With Georgia Tech’s support in technology transfer and prototyping, Suniva was able to bring cutting-edge lab-scale photovoltaic innovations to scalable industrial manufacturing.
The legislative framework embodied in the Bayh-Dole Act empowered Georgia Tech to license its photovoltaic technologies directly to Suniva, facilitating the company’s commercialization efforts. Moreover, Suniva benefited from sustained public investment in solar energy R&D through agencies such as the U.S. Department of Energy (DOE) and the National Renewable Energy Laboratory (NREL). The combination of advanced scientific research in crystalline silicon photovoltaics, strategic university support, and favorable federal innovation policy enabled Suniva to emerge as a domestic leader in solar manufacturing. Today, the company continues to drive forward the U.S. solar industry by producing high-performance solar technologies that support grid-scale renewable energy adoption and promote national energy independence.
Indiana
Indiana’s Tech Economy
Indiana’s IT sector represents a significant economic driver, contributing $51 billion to Indiana’s GSP. The sector encompasses various industries, including software development, IT services, and advanced manufacturing. The state’s commitment to fostering a robust tech ecosystem is evident through initiatives such as the designation of three federal tech hubs in microelectronics, hydrogen energy, and biotechnology, positioning Indiana for substantial federal investment and job creation.[97]
Indiana’s life sciences industry represents a cornerstone of its economy, contributing $95 billion to Indiana’s GSP in 2023. A strong manufacturing base underpins the sector, with pharmaceutical and medical device production being particularly prominent. The state’s life sciences sector also leads in exports, with Indiana becoming the top state exporter of life sciences products in the United States in 2024, tallying $27 billion. This achievement reflects the global competitiveness of Indiana’s life sciences industry and its capacity to meet international demand.[98]
Indiana has rapidly expanded its presence in the life sciences by leveraging its strong pharmaceutical and medical device industries, advanced manufacturing capabilities, and academic research institutions. At the center of Indiana’s strategy lies BioCrossroads, a public-private partnership that coordinates strategy across the sector. The state’s life sciences cluster includes major companies such as Eli Lilly, Cook Medical, and Roche Diagnostics, while research powerhouses such as Purdue and Indiana University contribute cutting-edge innovations. Indiana places strong emphasis on workforce development, with STEM education initiatives, industry-aligned training, and internship programs that help build a robust talent pipeline. The state also supports life sciences entrepreneurship through funding mechanisms such as the Indiana Seed Fund and partnerships that help start-ups navigate commercialization. In recent years, Indiana has focused on becoming a leader in medical diagnostics and health data analytics, bolstering its capabilities in digital health and precision medicine.
Indiana received nearly $9 billion in VC funding from 1997 to 2023, equivalent to 0.11 percent of its GSP over that period. Interestingly, compared with the rest of the country, Indiana ranks in the bottom one-fifth of states for VC. In 2023, the state received $514 million in VC, significantly down from its annual peak of $1.9 billion in 2021.[99]
One-fifth of Indiana’s workforce, or 811,500 individuals, work in STEM positions in the state, demonstrating the strength of Indiana’s STEM economy. The largest number of these workers are concentrated in the Indianapolis metro area (266,300), followed by the Indiana “Chicago” region (87,800), and Fort Wayne (62,500). About 4 percent of Indiana’s workforce specifically works in science and engineering.[100]
Universities Driving Indiana’s Tech Economy
Indiana University generates about $10 billion in economic impact to the state annually, while Purdue University generates over $2 billion.[101],
Out of the $27 billion Indiana universities received in research funding from 1998 to 2023, $12.1 billion came from the federal government. West Lafayette, Indiana-based Purdue University and the Bloomington-based Indiana University were the two largest beneficiaries of federal funding, receiving $5.4 billion and $5.2 billion, respectively, followed by Notre Dame University in South Bend with $1.4 billion. Private businesses also contributed $2.1 billion to university research, with Purdue University receiving the bulk of this investment ($1.2 billion). In fiscal year 2024, Purdue received $647 million in research awards from federal and industry sources, a 6 percent increase from the year prior and more than double the figure from 2013.[102] Research investment has led to a significant number of discoveries made in the state, with Indiana universities producing 11,886 IDs from 1998 to 2023. (See figure 15). Indiana universities have been the source of research leading to 3,006 patents issued by USPTO over that 25-year timeframe. In 1990, Indiana universities contributed to the generation of 50 patents, but by 2023, that count was just under 300, indicating a nearly sixfold increase in Indiana university patenting over that time. (See figure 16.) Indiana universities issued 2,362 IP licenses over that period.
Figure 15: IDs from Indiana universities,1998–2023[103]
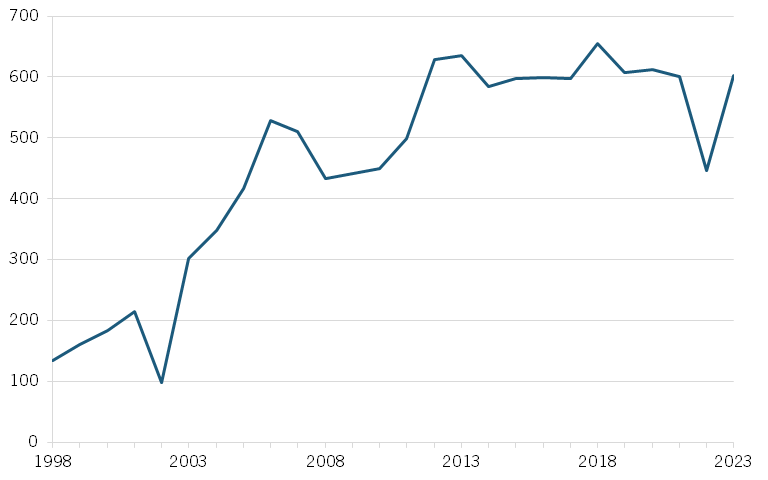
Figure 16: Issued USPTO patents from Indiana universities,1998–2023[104]
In 1990, Indiana universities contributed to the generation of 50 patents, but by 2023, that count was just under 300, indicating a nearly sixfold increase in Indiana university patenting over that time.
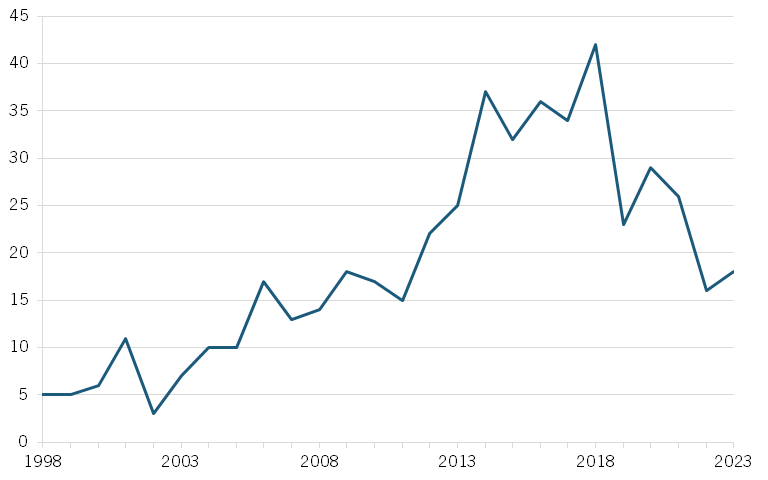
In addition to patents and IDs, research performed at Indiana universities has led to a considerable number of start-ups. Between 1998 and 2023, 491 start-ups were launched out of Indiana universities. (See figure 17.) However, the number of start-ups launched annually from Indiana universities has been declining for several years. In 2018, 42 were launched, up from 5 in 1998. But since then, Indiana’s commercialization pipeline out of its universities appears to have faltered somewhat. Since 2018, the number of start-ups formed has fallen by 57 percent, with just 18 new start-ups launched in 2023.
Figure 17: Start-ups launched from Indiana universities,1998–2023[105]
From 2000 to 2015, Indiana produced 25,755 patents, led by the Indianapolis metro area with 8,161 patents, followed by the (Indiana parts of the) Chicago-Joliet-Naperville metro area. This region produced 46,991 patents; however, just 8 percent of the population of the region resides in Indiana, so just 3,947 were attributed to the state. Indianapolis’s annual rate of patenting increased by 35 percent from 544 patents in 2000 to 735 in 2015.[106] Regarding biotech, the state produced 1,525 patents in drug treatments specifically, with Indianapolis leading the state (1,013), followed by Lafayette (193), showing Purdue’s strength in this area.[107] Nationwide, Purdue ranks fourth in the country for the number of issued patents coming from a university.[108]
Innovation Vignette: Indiana University Research Leads to Rare Disease Cancer Breakthrough
A treatment for two rare pediatric bone diseases—X-linked hypophosphatemia (XLH) and tumor-induced osteomalacia—reached the market in 2018 thanks to decades of research led by Indiana University faculty and the efforts of its Innovation and Commercialization Office (ICO). The therapy, Crysvita (burosumab), is a monoclonal antibody that targets Fibroblast Growth Factor-23 (FGF23), a hormone that causes severe bone malformation. Researchers Michael Econs and Kenneth E. White at the Indiana University School of Medicine discovered the role of FGF23 in XLH, laying the scientific foundation for this transformative drug. Indiana University’s ICO managed the FGF23 IP and successfully licensed the technology to Kyowa Kirin Co., Ltd., which developed the drug in collaboration with Ultragenyx Pharmaceutical.
The development of Crysvita represents a testament to the power of federally funded basic research, particularly through grants from NIH. Beginning with early investigations in the 1980s, public investment has enabled the sustained research needed to understand the genetic and molecular mechanisms behind XLH. Without this long-term funding commitment, such rare disease therapies, termed “orphan diseases,” would likely never reach patients. The FDA’s approval of Crysvita for XLH in 2018, followed by a 2020 approval for tumor-induced osteomalacia, demonstrates how government-backed science can lead to life-changing clinical innovations for underserved populations.
Innovation Vignette: Purdue Revitalizes America’s Rare Earth Capabilities
ReElement Technologies is a pioneering company in the field of rare earth elements (REEs) and critical mineral refining, with its origins rooted in research conducted at Purdue University. Founded in 2016 as American Rare Earth, the company rebranded to ReElement Technologies and, in 2021, acquired exclusive rights to a suite of patented ligand-assisted displacement (LAD) chromatography technologies developed by Dr. Nien-Hwa “Linda” Wang, a professor in Purdue’s Davidson School of Chemical Engineering. Dr. Wang’s research, spanning over four decades, initially focused on medical applications but evolved to address the separation and purification of REEs and battery elements from various sources, including coal byproducts, recycled magnets, and lithium-ion batteries. This innovative technology offers a more environmentally friendly and efficient alternative to traditional refining methods, which are often associated with high energy consumption and pollution.[109]
Leveraging Purdue’s technology, ReElement has established itself as a key player in the domestic production of high-purity REEs and battery materials. The company operates a commercial qualification facility in Noblesville, Indiana, and is developing a larger production site in Marion, Indiana, aiming to produce over 1,000 tons per year of ultra-pure rare earth oxides. ReElement’s modular and scalable refining platform is capable of processing diverse feedstocks, including recycled materials and virgin ores, making it the only U.S.-based solution of its kind. This advancement is significant in reducing the nation’s reliance on foreign sources (particularly China) of critical minerals essential to technologies such as semiconductors, electric vehicles, and renewable energy systems.[110]
Kansas
Kansas’s Tech Economy
Kansas increasingly fields a tech-driven economy, with Kansas’s life sciences industry a significant contributor to the state’s economy. The state’s biopharmaceutical sector contributes $11.3 billion in annual economic impact and supports over 34,700 jobs (7,989 directly and the rest indirectly).[111] It is also home to the largest concentration of animal health companies globally, anchored by the Kansas City Animal Health Corridor.[112]
From 1998 to 2023, Kansas universities contributed to nearly 3,000 IDs, 700 USPTO patent awards, 708 IP licenses, and 94 new start-up companies.
In 2021, bioscience-related VC investment in Kansas companies increased significantly, reaching nearly $56 million. The state’s bioscience ecosystem includes more than 1,600 establishments, with a strong presence in research, testing, and medical laboratories, as well as bioscience-related distribution.[113] Kansas’s commitment to the life sciences is further demonstrated by its investment in facilities such as the National Bio and Agro-Defense Facility, which enhances the state’s capabilities in animal health research and biodefense.[114]
Kansas’s IT industry contributes over $8 billion to the state’s GSP and accounts for approximately 9 percent of the state’s workforce. The sector encompasses various industries, including software development, IT services, and advanced manufacturing. Notably, the Kansas City, MO-KS metro area ranks 14th nationally in the highest number of tech jobs per capita among large metropolitan areas.[115] Kansas also ranks second in the nation for the share of power produced by renewable energy technology, highlighting the state’s commitment to sustainable technological advancements.[116]
VC financing in Kansas is low relative to its GSP, with total VC investment from 1997 to 2023 amounting to 0.13 percent of GSP. Compared with other states, Kansas ranks 41st. In 2023, the state received $250 million in VC funding, a steep drop from years prior, with VC investment peaking in 2021 when the state received $836 million.[117]
Kansas’s workforce consists of 352,100 STEM employees, or 18 percent of all workers. The largest number of STEM employees is located in the Kansas side of the Kansas City metro area, with 131,700 employees, followed by Wichita with 87,500 employees, and Topeka with 22,500. Manhattan and Lawrence, home to the two largest universities in the state, Kansas State and the University of Kansas, employ about 16,000 and 13,000 STEM workers, respectively.[118]
Universities Driving Kansas’s Tech Economy
The University of Kansas contributed $1.34 billion to the Kansas (and broader U.S.) economy between 2011 and 2023.[119] The University of Kansas’s Innovation Park, which includes 71 companies, contributes to the state’s economy with 680 private sector jobs and $45.1 million in annual payroll.
Kansas universities received $6.2 billion in federal funding for R&D between 1998 and 2023, with most going to the two state university systems: the University of Kansas ($4 billion) and Kansas State University ($1.9 billion). Private industry also invested $565 million in university R&D, with the University of Kansas receiving the most ($337 million), followed by Kansas State University ($136 million) and Wichita State University ($74.3 million). Kansas universities produced nearly 3,000 IDs between 1998 and 2023. (See figure 18.) Research conducted at Kansas universities contributed to over 700 USPTO patent awards over that timeframe. (See figure 19). Additionally, Kansas universities issued 708 IP licenses.
Figure 18: IDs from Kansas universities,1998–2023[120]
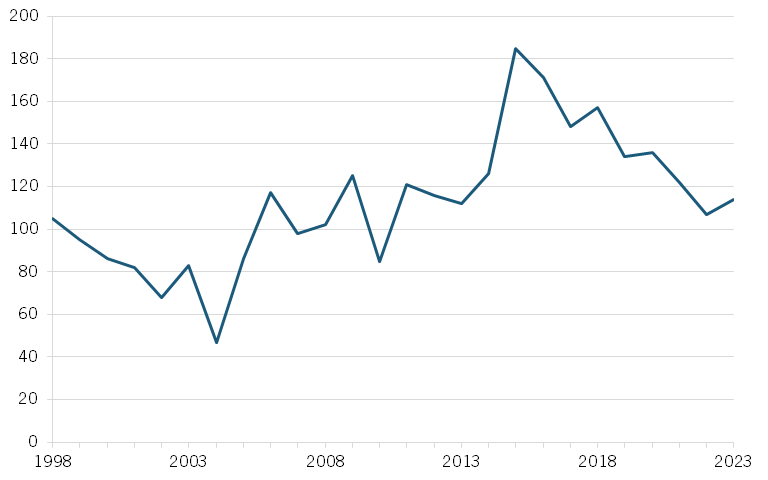
Figure 19: Issued USPTO patents to Kansas universities,1998–2023[121]
From 1998 to 2023, 94 start-ups were launched from Kansas universities, with at most 11 start-ups being launched per year. (See figure 20.) The University of Kansas was responsible for most of these companies, with 63 started from the school since 1998. Kansas State University follows with 28 start-ups, then Wichita State University with 3.
Figure 20: Start-ups launched from Kansas universities,1998–2023[122]
From 2000 to 2015, Kansas residents produced 6,566 patents, led by the Kansas City metro area, which produced 7,952 patents. (As about 45 percent of the Kansas City population lives on the Kansas City side of the river, about 3,600 of these patents were counted for Kansas). The Kansas City area experienced a noticeable 273 percent increase in patenting activity between 2000 and 2015, from 219 to 816 patents. After Kansas City, Wichita reported 1,648 patents, Lawrence reported 424, and Manhattan 305.[123] In terms of patents for drug-specific technologies, Lawrence led the state, producing 83 patents, followed by Kansas City (68) and Manhattan (33), again showing the strength of these university-led life sciences tech ecosystems.[124]
Innovation Vignette: University of Kansas Leading Research Into Drug Metabolism
Andrew Parkinson, founder of XenoTech, LLC, in Lenexa, Kansas, has seen his company grow into a global leader in drug metabolism research. Originally a professor at the University of Kansas Medical Center (KUMC), Parkinson identified a growing need for research services focused on enzymes and drug interaction testing. He was encouraged by consistent requests from pharmaceutical companies and supported by KUMC’s incubator space, so he transitioned his research into a commercial enterprise. Over time, XenoTech expanded to more than 80 employees and developed specialized departments offering FDA-recommended in vitro research services, including drug metabolism, enzyme inhibition, and species comparison studies. XenoTech’s products and services are now used by global pharmaceutical companies, regulators, and academic institutions.
The company’s success highlights the vital role of government-supported academic research and tech transfer infrastructure in creating real-world impact. XenoTech was launched with resources provided through a university-affiliated biotech center and benefited from early research funded at a public institution. The company provides a prime example of how federally supported research and university innovation ecosystems—empowered by policies such as the Bayh-Dole Act—can be translated into private-sector ventures that advance public health, generate jobs, and strengthen the economy. As Richard Huston of KUMC has noted, XenoTech’s evolution serves as inspiration for other researchers, demonstrating how academic discoveries can be successfully transferred into the public domain for broad societal benefit.
North Carolina
North Carolina’s Tech Economy
North Carolina exhibits a heavily technology-based economy. In 2023, North Carolina’s technology industry contributed over $92 billion to the state’s GDP, accounting for more than 12 percent of North Carolina’s GSP. The sector employed approximately 323,000 individuals, representing nearly 7 percent of the state’s workforce. Between 2018 and 2023, tech employment in North Carolina grew by nearly 19 percent, placing the state eighth nationally in tech job growth during that period.[125] North Carolina’s modern tech-driven economy has come a long way from the tobacco, textile, and furniture industries that initially made the state prosperous, and indeed this transformation has been “one of the economic success stories in the country.”[126] As the following shows, North Carolina’s universities have played a pivotal role in transforming the state into a tech-driven economy.
From 1998 to 2023, 756 start-ups were launched from North Carolina universities. In 2023, 39 were launched, over four times more than in 1998.
North Carolina’s life sciences industry represents a significant economic driver, generating $51.6 billion in direct corporate revenues. When accounting for multiplier effects, the industry’s total revenue impact reaches $82.1 billion, with a contribution of $41 billion to the state’s GDP. The sector supports over 213,000 jobs, with an employment multiplier of 2.84, meaning each life sciences job supports an additional 1.84 jobs in the state economy.[127]
The North Carolina Biotechnology Center (NCBiotech) plays a central role in nurturing this ecosystem, providing grants, loans, and support for workforce development. In 2023, the state attracted significant investments from life sciences companies, including a $450 million expansion by Eli Lilly and a $485 million investment by ProKidney, collectively creating hundreds of high-paying jobs.[128]
North Carolina has established itself as a national leader in the life sciences through a long-standing, coordinated strategy centered around NCBiotech, the first state-sponsored life sciences initiative in the United States. Founded in 1984, NCBiotech plays a central role in aligning government, academia, and private industry in support of innovation and economic growth. The state’s Research Triangle Park (RTP) acts as a cornerstone of North Carolina’s biotech ecosystem, offering world-class research facilities and proximity to leading universities such as Duke, UNC-Chapel Hill, NC State, and Wake Forest, among others. North Carolina has become a hub for biomanufacturing, attracting pharmaceutical giants such as Eli Lilly and Pfizer with its highly trained workforce and business-friendly environment. Workforce development represents a top priority, with programs such as NCBioImpact uniting universities and community colleges to provide specialized bioscience training. In addition to infrastructure and talent development, NCBiotech supports early-stage companies through grants, loans, and commercialization assistance, helping to translate research into real-world products.
As North Carolina has gained acclaim for its success as a biotech and pharmaceutical hub, VC investment to the state has increased substantially. Since 1997, the state has received over $37 billion in VC investment, equivalent to 0.3 percent of GSP. This places North Carolina 18th in the country in terms of VC investment relative to GSP. Over that same period, annual investment has grown by a factor of nine, from 0.03 percent of GDP to 0.25 percent.[129]
Nearly 1.2 million individuals work in STEM-related positions in North Carolina, representing 19 percent of the state’s workforce. The highest percentage of these employees are located in the Charlotte metro area, with 284,100 employees, followed by Raleigh (222,400), the Durham-Chapel-Hill area (101,200), and the Greensboro-High Point region (89,300).[130]
Universities Driving North Carolina’s Tech Economy
Universities have played a catalytic role in the growth of North Carolina’s tech economy. The University of North Carolina (UNC) reports spawning 786 university-affiliated start-ups since 1958 and notes that there are 443 UNC-spawned start-ups currently headquartered in North Carolina. These UNC-spawned start-ups contribute $14.4 billion in annual revenues to the state and employ over 13,500 North Carolinians.[131]
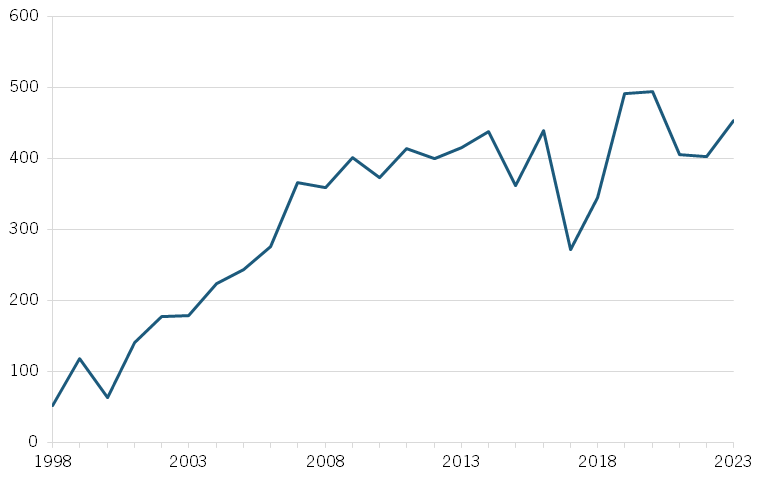
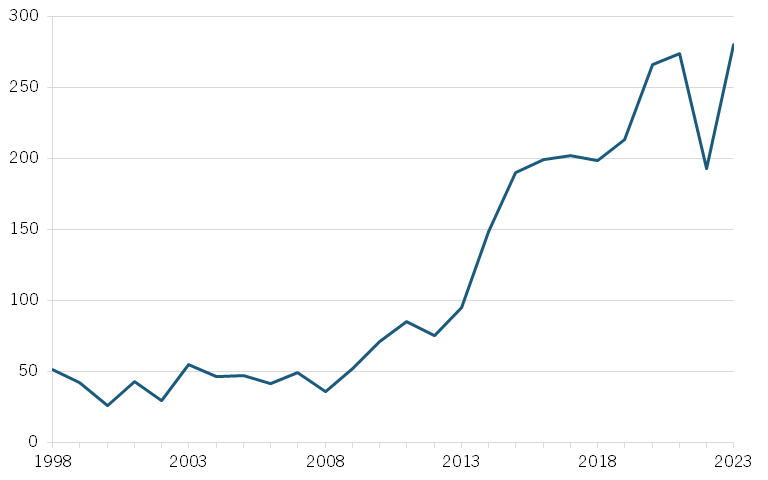
Over $33 billion has been invested in research conducted at North Carolina universities by the federal government since 1998. UNC Chapel Hill leads the state in federal funding, receiving $13.2 billion, followed by Duke University ($12.8 billion), and North Carolina State University ($4.3 billion). Universities in North Carolina have also received $7.8 billion in research funding from private businesses. Duke University has been the greatest recipient of private funding, receiving $4.7 billion, followed by North Carolina State ($1.3 billion), and UNC Chapel Hill ($732 million). North Carolina universities generated 17,699 IDs from 1998 to 2023. (See figure 21).
Figure 21: IDs from North Carolina universities,1998–2023[132]
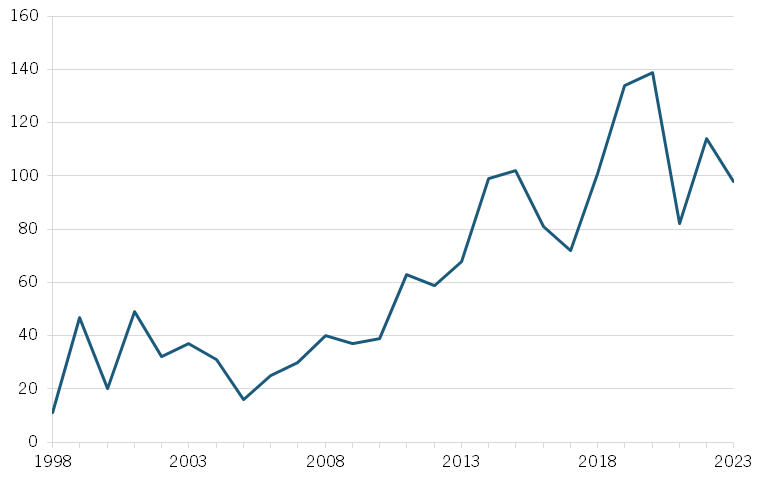
Research conducted at North Carolina universities contributed to 4,255 U.S. patents over that timeframe. (See figure 22.) Additionally, North Carolina universities issued 4,802 IP licenses. UNC Charlotte saw 21 new company introductions for patent licenses in the most recent 12 months, compared to 11 in the prior year, a 90 percent increase. The university also recorded 53 new inventions in FY25, a jump from 36 in the previous year, while its patens filed increased to 71 from 56 in the previous year.
Figure 22: Issued USPTO patents to North Carolina universities,1998–2023[133]
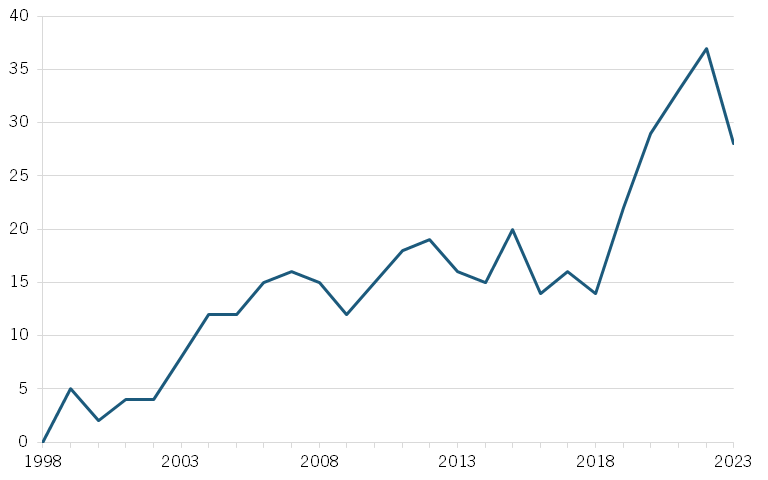
From 1998 to 2023, 756 start-ups were established from North Carolina universities. In 2023, 39 were launched, over four times more than in 1998. (See figure 23.) Over that timeframe, North Carolina State University was responsible for the most start-up launches (243), followed by Duke University (196), and UNC Chapel Hill (153).
Figure 23: Start-ups launched by North Carolina universities,1998–2023[134]
From 2000 to 2015, North Carolina filers produced over 35,000 patents, led by the Raleigh-Cary metro area with 15,950, followed by Durham-Chapel Hill with 6,861 and the Charlotte-Gastonia-Rock Hill region with 3,425. (Considering that about 75 percent of the population of this region resides in North Carolina, only 75 percent of the region’s 4,527 patents were attributed to the state.) North Carolina’s patent production more than doubled over this period, growing from 672 in 2000 to 1,535 in 2015.[135]
Innovation Vignette: North Carolina University Develops Innovative Wound Therapies
Severe blood loss is a major cause of death in trauma cases, particularly in military settings where wounds are difficult to treat with conventional gauze. Recognizing this unmet need, researchers from the University of North Carolina at Chapel Hill and East Carolina University developed a novel hemostatic textile made from a blend of natural and synthetic fibers such as glass, silk, bamboo, and zeolite. The fabric can also incorporate clotting agents such as thrombin and fibrin, enhancing the body’s ability to stop bleeding. This material—soft, absorbent, and easy to use in a variety of conditions—offers a significant improvement over traditional gauze dressings by accelerating clot formation and reducing overall blood loss.
With support from government-funded academic research and the technology transfer infrastructure enabled by the Bayh-Dole Act, this innovation was licensed to the University of North Carolina start-up Entegrion, as in 2007, the company received FDA approval for the textile under the brand name Stasilon™, and it launched AlphaBandage™ for battlefield use. The U.S. military played a key role in early pilot testing and distribution, underscoring the importance of public investment in lifesaving technologies.
Innovation Vignette: UNC Charlotte Research Enhances Access to Safe Drinking Water
Safe drinking water is still not accessible across much of the world. Addressing this global crisis, AquiSense Technologies has pioneered a compact, chemical-free method for water disinfection using ultraviolet (UV) light-emitting diode (LED) technology. Founded in 2015 as a spinout from the University of North Carolina at Charlotte (UNCC), AquiSense was among the first companies to commercialize UV-C LEDs for water purification. The company’s flagship product, the PearlAqua, delivers mercury-free disinfection by emitting germicidal light that neutralizes bacteria, viruses, and protozoa at the DNA level, offering a solution for applications ranging from household drinking systems to medical equipment sterilization.[136]
This breakthrough was made possible through the strong foundation of academic research and public support. Research at UNCC laid the groundwork for the development of advanced photonics and optical systems. At the same time, the Bayh-Dole Act enabled the university to retain and license its IP to AquiSense, thereby accelerating commercialization. Federal innovation programs such as the SBIR program provided early-stage funding to validate and expand the technology’s reach.
Best University Practices Stimulating Technology Commercialization
Based on conversations with representatives from several universities referenced in this report, the following themes emerged regarding best university practices to stimulate technology commercialization.
Build a supportive ecosystem. A successful tech transfer process requires more than just IP licensing; it must include incubation, start-up services, mentoring, and access to funding. UGA’s Innovation Gateway and Purdue’s Purdue Innovates are prime examples. Both offices provide structured start-up support and facilitate industry engagement, investor connections, and mentoring. Purdue’s launch of its Discovery Park in West Lafayette—a 400-acre innovation district—demonstrates how infrastructure can support start-ups and attract public-private partnerships.
Focus on talent and team building. Across interviews and institutional reports, the shortage of experienced entrepreneurial management talent has consistently been cited as a major hurdle for university-based start-ups, especially in nonmetropolitan regions. UGA, for example, addresses this by creatively sourcing management and leveraging programs to bring experienced entrepreneurs to campus. Duke and UNC run bootcamps and mentorship initiatives to develop entrepreneurial skills among students and faculty. These programs help founders build well-rounded teams capable of raising capital and supporting start-up companies’ growth.
Cultivate a culture of innovation. Purdue attributes much of its tech transfer success to a deliberate “pro-innovation culture shift” across the university, led from the top down and supported by data-driven storytelling. Its consistent growth in IDs and patent filings reflects a strong internal buy-in to innovation as a core university mission. Similarly, Duke’s transformation from minimal support to a comprehensive start-up ecosystem shows how sustained investment in infrastructure and outreach can make a difference. In 2023, 64 percent of new Duke start-ups were headquartered in North Carolina.[137] Mirroring a similar strategy, the University of Delaware has integrated innovation and entrepreneurship (I&E) as core pillars of the university, and this top-down approach has allowed for a culture shift toward innovation.
Regional collaboration matters. UGA and Georgia Tech participate in regular meetings with other TTOs across the state, sharing best practices and aligning efforts. Regional investment summits such as the Southeast Venture Summit and Duke’s “Venture Day” help address the geographic disadvantage of being outside traditional VC hubs by drawing investors directly to local start-ups. The University of Michigan’s MTRAC program, modeled after the Coulter Foundation, also exemplifies how structured collaboration and translational funding can bridge the gap between lab and market. The Coulter Foundation supports university-based translational research grant programs that establish a business-like process to accelerate academic innovations to the marketplace.[138]
Incorporate technology transfer into a university’s core strategic plans. This ensures alignment with broader institutional goals and elevates the importance of research commercialization within university culture. For instance, the University of Kentucky has explicitly integrated tech transfer into its long-term strategy, signaling commitment from top leadership. A simple audit, such as using a keyword search in strategic documents, can help institutions identify whether this integration currently exists.
Shift the focus of TTOs from income generation alone to broader societal and economic impact. While some inventions may generate substantial licensing revenue, they are the exception, not the rule. More commonly, tech transfer delivers value through job creation, start-up formation, industry partnerships, and improvements to public health or safety. Measuring these forms of impact can help institutions stay true to their missions.
Policy Recommendations
This report offers policy recommendations for both federal and state policymakers to better foster university-driven technological innovation.
Federal Policy Recommendations
Increase Federal Investments in University Research
The United States has underinvested in university research for some time. Unfortunately, the trend appears to be worsening, both in terms of relative investments made by peer nations and by America’s historical standards.[139]
The United States has seen its investment in university research decline steadily over the past decade and a half, falling by 18 percent from 2011 to 2021 alone.
ITIF has been writing about countries’ federal governments’ investments in research since 2013, when the United States ranked 24th out of 39 Organization for Economic Cooperation and Development (OECD) nations on this measure. The latest data shows that the United States has slipped to 27th among OECD nations, investing just 0.2 percent of GDP in university research. (See figure 24.)
Ten nations in OECD, including Switzerland, Germany, and Portugal, invest twice as much as the United States does in university research as a share of GDP. To reach the median of OECD, the United States would need to invest $70 billion annually—$23 billion more than it currently does. To lead OECD, it would take $121 billion more.
Figure 24: Federal investment in university R&D as a share of GDP (2021)
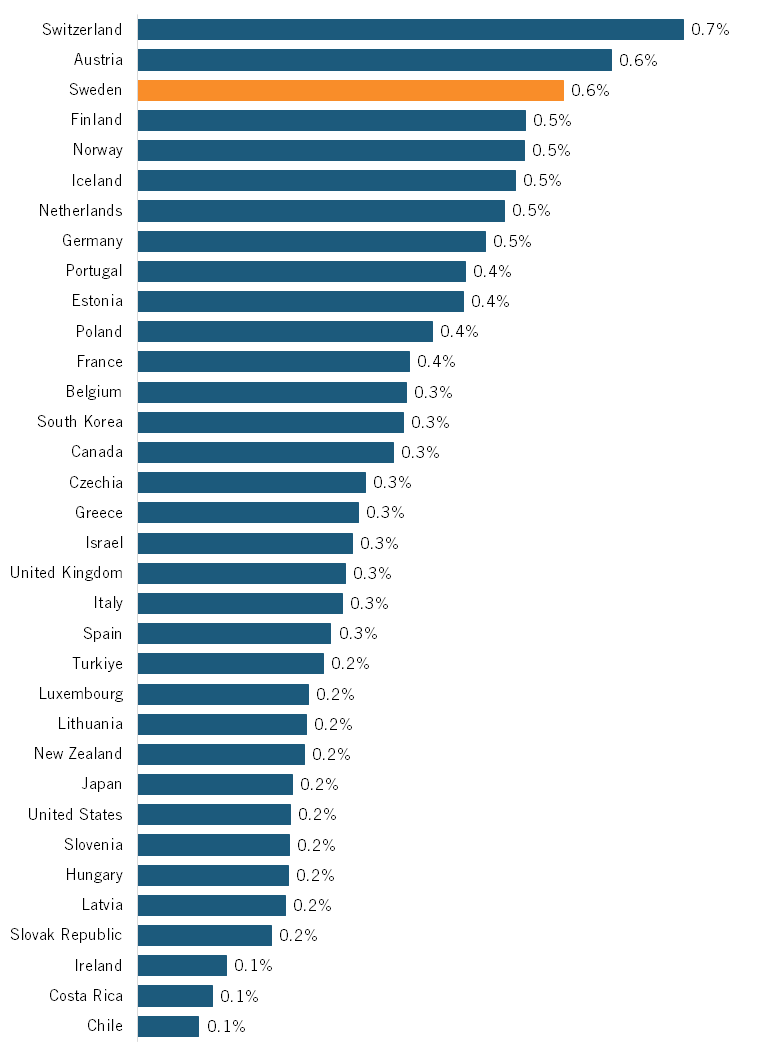
Overall, the United States has seen its investment in university research decline steadily over the past decade and a half, falling by 18 percent from 2011 to 2021 alone. Only Ireland and Lithuania saw investment fall at greater rates. (See figure 25.) Meanwhile, Poland, Latvia, and Luxembourg experienced the greatest growth in investmentover that timeframe.
Figure 25: Percent change in federal investment as a share of GDP (2011–2021)
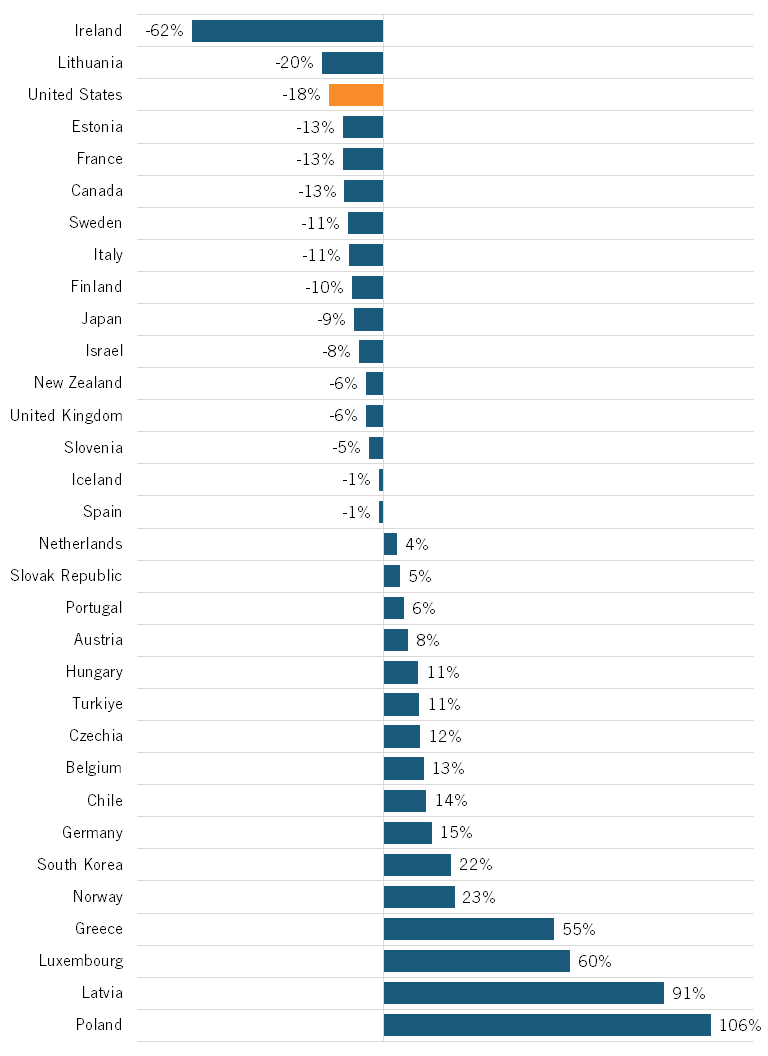
Overall, U.S. federal investment in university research as a share of GDP fell from 0.24 percent in 2011 to 0.20 percent in 2023. (See figure 26.)
Figure 26: U.S. federal investment in university research as a share of GDP
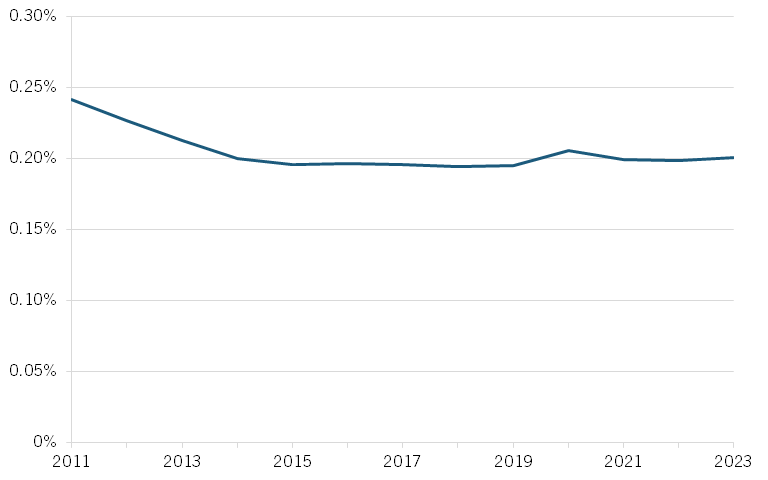
Unfortunately, that trend looks likely to worsen. Despite the many signs pointing to the need for greater investment, the Trump administration—and more specifically, its “Department of Government Efficiency”—has cut billions in research funding and continues to threaten even deeper cuts.[140] That is a mistake the United States cannot afford. A theoretical 1 percent cut to federal investment in university research would put the United States in 31st place within OECD, dropping investment to 0.15 percent of GDP by 2033. (See figure 27.) A 5 percent cut would push the United States to 32nd, above only Costa Rica and Chile.
Figure 27: Forecasted U.S. federal investment in university research as a share of GDP
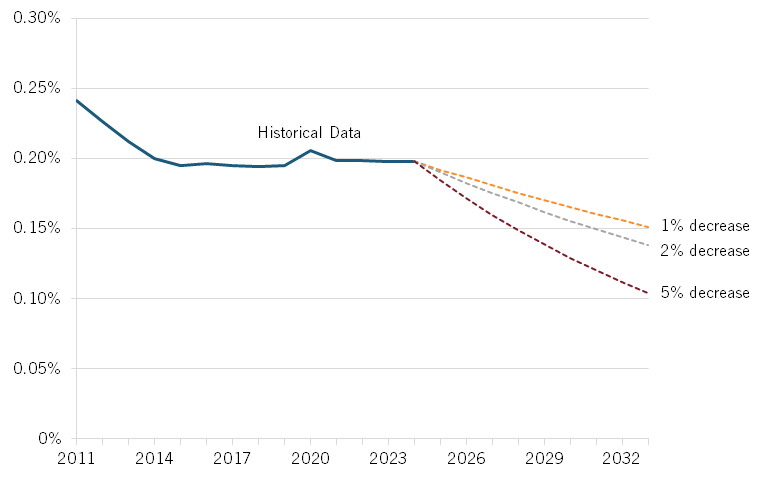
Unfortunately, as The Economist reports, “Since Mr. Trump’s return to the White House, somewhere in the region of $8bn [billion] has been cancelled or withdrawn from scientists or their institutions, equivalent to nearly 16 percent of the yearly federal grant budget for higher education.”[141] Elsewhere, NIH has released about $2.9 billion less funding since the start of this year, relative to 2023 and 2024.[142] Overall, the Trump administration has proposed 55 percent budget cuts to NSF and 38 percent (almost $18 billion) for NIH. The Economist estimates that if these cuts are maintained through 2026, then the United States will fall behind both China and the European Union-27 nations in total research spending at government institutions and universities.[143] Hopefully Congress will restore much of this funding through annual appropriations. However, it’s concerning, for instance, that in the CHIPS and Science Act Congress authorized $20 billion for the NSF Technology, Innovation and Partnerships (TIP) program over five years, but has only appropriated $2 billon (10 percent) of that amount, even though three of the five years of Congressional authorizations for the program have already elapsed. Policymakers in both the legislative and executive branch must redouble their focus on supporting the R&D investments that foundationally underpin American science, technology, and economic leadership.
Many advocates for cutting federal support for universities claim that private industry can fill the gap.[144] Yet even with the robust corporate-university partnerships seen across the country, in 2021, private industry invested less than one-tenth of what the federal government contributed to academic research.[145]
Policymakers in both the legislative and executive branch must redouble their focus on supporting the R&D investments that foundationally underpin American science, technology, and economic leadership.
State governments, too, are unlikely to make up the deficit. They have also reduced expenditures over the past two decades, and if the federal government forces more fiscal responsibility on states, including in programs such as Medicaid, states will have too much on their fiscal plates to match prior federal investment levels. In short, the U.S. federal government should commit to higher—not lower—levels of university R&D funding.
Recognize the Direct Link Between Federal R&D Funding and Innovation
One reason why federal investment in R&D matters is that there is a direct link between federal R&D funding and innovation. In fact, historically, roughly every $4.2 million in research funding produces one ID, a trend that has held very constant since the early 1990s (before the relationship got slightly distorted during the COVID era). (See figure 28.) Put simply, research funding leads to inventions in a very linear fashion, and every reduced $1 dollar in federal R&D funding will ultimately lead to fewer IDs produced in the United States.
Figure 28: Relationship between federal R&D funding and IDs[146]
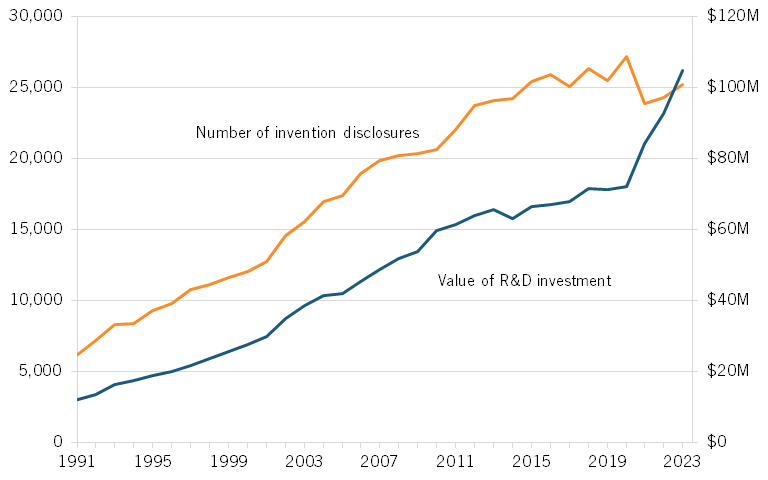
Unfortunately, it’s not just federal R&D funding to universities that has languished; overall, as of 2023, federal funding of research (also going to research institutes, companies, etc.) remained at a near 70-year low. (See figure 29.)
Figure 29: Federal R&D investment as a share of U.S. GDP[147]
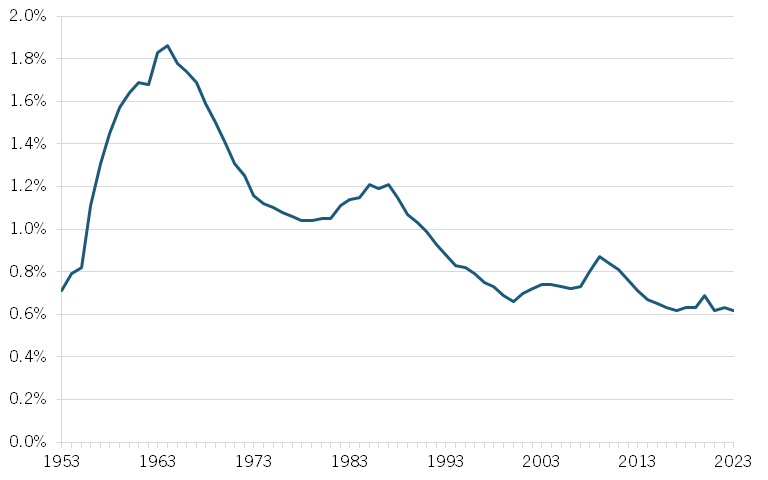
Make Up for Indirect Cost Cuts With Increased NIH Funding
Despite the importance of federal support for U.S. biopharmaceutical innovation, the Trump administration’s efforts to reduce the size of the federal government have already resulted in decreased funding. One significant cut involves capping indirect costs for NIH grants at 15 percent, down from an average of 27–28 percent.[148] Indirect costs are vital to “keeping the lights on,” because they cover expenses associated with lab facility maintenance, equipment, insurance, utilities, and administrative personnel.[149] Even beyond funding new scientific knowledge and technological tools, public funding also cultivates a highly skilled scientific workforce, crucial to continuing biopharmaceutical progress.
The United States has fallen to 27th out of 39 OECD nations in terms of federal government funding of university research as a share of GDP.
While some private foundations offer lower indirect rates than federal agencies do, their grants are complementary to federal funding, and universities are able to accept such lower rates precisely because federal grants provide the baseline foundational research support that serves future project-specific funding.[150] Moreover, private foundations tend to prefer supporting specific research projects that align with their funding priorities, which is another reason why broader federal support is so important for scientific progress. Reducing federal funding will discourage research projects that require large-scale investments due to a simple lack of funding, harming U.S. biopharmaceutical innovation. If the Trump administration maintains the stringent caps on indirect R&D costs, it should balance this by increasing NIH funding for biomedical research.
Protect the Bayh-Dole Act
As noted, the Bayh-Dole Act has been profoundly successful legislation that has played a catalytic role in enabling academic technology transfer and fostering the growth of vibrant regional tech ecosystems across the United States. Unfortunately, certain policymakers have proposed the use of Bayh-Dole provisions in ways that would undermine the intent and effectiveness of the framework.
At issue are so-called march-in rights, a provision within the Bayh-Dole Act that permits the government, in specified circumstances, to require patent holders to grant a “nonexclusive, partially exclusive, or exclusive license” to a “responsible applicant or applicants.”[151] As the following section explains, the architects of the Bayh-Dole Act principally intended for march-in rights to be used to ensure that patent owners commercialized their inventions.[152] As Senator Birch Bayh explained, “When Congress was debating our approach fear was expressed that some companies might want to license university technologies to suppress them because they could threaten existing products. Largely to address this fear, we included the march-in provisions.”[153]
The Bayh-Dole Act specifies four specific instances in which the government is permitted to exercise march-in rights:
1. If the contractor or assignee has not taken, or is not expected to take within a reasonable time, effective steps to achieve practical application of the subject invention
2. If action is necessary to alleviate health or safety needs not reasonably satisfied by the patent holder or its licensees
3. If action is necessary to meet requirements for public use specified by federal regulations and such requirements are not reasonably satisfied by the contractor, assignee, or licensees
4. If action is necessary, in exigent cases, because the patented product cannot be manufactured substantially in the United States[154]
In other words, lower prices are not one of the rationales laid out in the act. In fact, as senators Bayh and Dole have themselves noted, the Bayh-Dole Act’s march-in rights were never intended to control or ensure “reasonable prices.”[155] As the senators wrote in a 2002 Washington Post op-ed titled, “Our Law Helps Patients Get New Drugs Sooner,” the Bayh-Dole Act:
Did not intend that government set prices on resulting products. The law makes no reference to a reasonable price that should be dictated by the government. This omission was intentional; the primary purpose of the act was to entice the private sector to seek public-private research collaboration rather than focusing on its own proprietary research.[156]
The op-ed reiterated that the price of a product or service was not a legitimate basis for the government to use march-in rights, noting:
The ability of the government to revoke a license granted under the act is not contingent on the pricing of a resulting product or tied to the profitability of a company that has commercialized a product that results in part from government-funded research. The law instructs the government to revoke such licenses only when the private industry collaborator has not successfully commercialized the invention as a product.[157]
Rather, Bayh-Dole’s march-in provision was designed as a fail-safe for limited instances in which a licensee might not be making good-faith efforts to bring an invention to market, or when national emergencies require that more product is needed than a licensee is capable of producing.[158] Controlling the prices of resulting products was never the intent of Bayh-Dole march-in rights.
Roughly every $4.2 million in research funding produces one ID out of America’s universities.
Unfortunately, some policymakers have proposed otherwise. Senator Angus King (I-ME) has proposed legislation that would require the Department of Defense to issue compulsory licenses under Bayh-Dole “whenever the price of a drug, vaccine, or other medical technology is higher in the U.S. than the median price charged in the seven largest economies that have a per capita income at least half the per capita income of the U.S.”[159] Even the Biden administration took the bait, as, in 2023, it sought to issue guidelines via the “Draft Interagency Guidance Framework” that would permit governmental use of march-in rights on the basis of the resulting price of a product, such as a drug or an electric vehicle battery.[160] Fortunately, these draft rules were not implemented before the Biden administration concluded.
But here the Trump administration should return to an initiative undertaken in its first iteration, when it had directed the National Institute of Standards and Technology (NIST) to undertake a review of federal policies that could bolster the return of federal investments in R&D. The final report NIST produced, the “Return on Investment Initiative: Draft Green Paper,” concludes, “The use of march-in is typically regarded as a last resort, and has never been exercised since the passage of the Bayh-Dole Act in 1980.”[161] The report further notes, “NIH determined that that use of march-in to control drug prices was not within the scope and intent of the authority.”[162] The Trump administration should build upon the findings of the 2018 NIST Green Paper and affirmatively declare that price is not a legitimate basis for the exercise of Bayh-Dole march-in rights.
Refrain From Introducing Drug Price Controls
In May 2025, the Trump administration issued an executive order that seeks to cut drug prices by directing the secretary of Health and Human Services (HHS) to establish a mechanism through which American patients can buy their drugs directly from manufacturers that sell to Americans at a “Most-Favored-Nation” (MFN) price, or to otherwise have HHS “propose rules that impose most-favored-nation pricing.”[163]
Drug price controls harm innovation because they preclude companies from generating revenues from one generation of innovation to finance investment in the next. That much was made patently clear by the price controls the Biden administration introduced through the Inflation Reduction Act (IRA) on Medicare Part B and Medicare Part D prescription drugs.[164] The legislation allowed the Centers for Medicare & Medicaid Services to “negotiate” prices—although this really meant to set prices—on chemically synthesized small-molecule drugs after they were on the market for 9 years and on large-molecule (or biologic) drugs after being on the market for 13 years.[165]
The Trump administration should build upon the findings of the 2018 NIST Green Paper and affirmatively declare that price is not a legitimate basis for the exercise of Bayh-Dole march-in rights.
The IRA’s deleterious effect on biopharmaceutical innovation began almost immediately. In fact, small-molecule drug funding by VCs has dropped 70 percent since the legislation that would become the IRA’s drug pricing provisions was first drafted in September 2021.[166] A survey PhRMA conducted among its member companies finds that 78 percent expect to cancel early-stage small-molecule pipeline projects as a result of the legislation.[167] Sixty-three percent of respondents reported they expect to shift R&D investment focus away from small-molecule medicines. Another study finds that the number of therapies in Phase I and Phase II of development declined 35 percent from 2021 to 2023 among small and midsize biotech companies, predicting that this will lead to a “considerable reduction in the number of FDA approvals in roughly 5 to 6 years.”[168]
A recent study from a closely related industry produced further evidence of the deleterious effects of price controls on innovation, in this case in the medical device industry. The research finds that following price reductions, there was a 25 percent decline in new medical device product introductions and a 75 percent decrease in patent filings, as firms had less incentive and revenue to invest in R&D.[169] Calculations in the study suggest that the value of lost innovation in the medical device industry may have fully offset the direct cost savings from the price cuts.
In short, drug price controls represent flawed policy and the Trump administration’s MFN policy may turn out to be even more damaging than the drug-price controls the Biden administration implemented in the IRA because price controls have already led to significant declines in U.S. biopharmaceutical innovation—and whereas the IRA only applies to a select list of drugs, Trump’s MFN proposal would apply to virtually all medicines.[170]
Reauthorize and Revitalize the SBIR Program
The SBIR and Small Business Technology Transfer Research (STTR) programs (enacted in 1982 and 1992, respectively) have grown to become the federal government’s most impactful programs and largest sources of early-stage capital for technology commercialization, allowing U.S.-owned and operated small businesses to engage in R&D activity that has a strong potential for commercialization.[171] SBIR sets aside 3.25 percent of R&D funding from 11 federal agencies (all those with R&D budgets greater than $100 million annually), providing about $2.5 billion annually to support small businesses engaging in R&D with commercialization potential.
SBIR accounts for only 3 percent of federal extramural research funding, yet numerous studies have documented the program’s tremendous contributions to the U.S. innovation economy. Since the program’s inception, it has distributed over $40 billion in funding, which has contributed to the generation of over 70,000 patents and 700 public companies.[172] On average, SBIR-supported companies receive 10 patents each day—testament to the innovative prowess of the more than 450,000 engineers and scientists working in companies that have been SBIR-supported.[173] Companies launched in part with SBIR support feature a “who’s who” of some of America’s most successful innovators, including 23andMe, Amgen, Apple, Biogen, Jarvik Heart, LIFT Labs, Millennium Pharma, Qualcomm, Symantec, iRobot, and countless others.[174]
Congressional policymakers need to reauthorize the program by September 30, 2025, and should do so alacritously. One thing SBIR reauthorizing legislation should do is address so-called SBIR mills, or companies that have become dependent on SBIR awards as a primary business model. For instance, Congress could cap the number of proposals any single small business may submit in response to any single Phase I or Phase II solicitation to no more than three proposals across the firm or limit business to no more than 25 proposals per year across all SBIR and STTR solicitations.
Implement a Collaborative R&D Tax Credit
A number of countries throughout the world have introduced collaborative R&D tax credits that provide a more generous tax credit when companies invest in R&D activities at universities. Countries such as Belgium, Denmark, France, Japan, Norway, Spain, and the United Kingdom have introduced such a credit.[175] The United States should do the same. Congress could do so by adding a provision in the Research and Experimentation Tax Credit that provides a 40 percent credit for company funding of university research.[176]
Another way to better foster industry-university R&D collaboration would be to have the Department of Justice provide an exemption from antitrust scrutiny for the formation of research funding alliances in which individual companies contribute to a common industry-based pool—likely administered by industry associations—and university principal investigators and research centers can apply for that money. This could likely be implemented under the 1984 Collaborative Research and Development Act.[177]
Increase R&D Tax Credit Generosity and Restore First-Year Expensing
The R&D tax credit not only spurs more R&D investment in the U.S. economy; it makes R&D-intensive companies in the United States more globally competitive.[178] The Trump administration should work with Congress to double the R&D tax credit rate from 20 to 40 percent for the regular credit and from 14 to 28 percent for the Alternative Simplified Credit. The budget should also restore Section 174 of the tax code, which permits full first-year expensing of R&D expenditures for tax purposes, and expand the refundable R&D credit for preprofit start-ups.[179]
Commit to Regional Technology Hub Investments
There is an increasing inequality of innovation opportunity in the United States. A 2019 ITIF report explored where jobs in “innovation industries” are found in the U.S. economy—these are jobs in industries that attain a certain high degree of R&D intensity and have a high share of STEM workers.[180] It found that one-third of jobs in innovation-based industries in the United States are concentrated in just 14 counties, and about half of such jobs are located in just 40 counties.
This was a key insight toward inclusion of a $10 billion regional tech hubs program in the CHIPS and Science Act. This would ultimately become the Tech Hubs Program administered by the Economic Development Administration (EDA), which in October 2023 designated 31 Tech Hubs and announced recipients of 29 Tech Hubs Strategy Development Grants.[181] The program brings together public, private, and academic partners into collaborative consortia focused on driving regional growth. By July 2024, Congress had appropriated only $541 million, or just over 5 percent, of the $10 billion authorized for the program.[182] Worse, the Trump administration has initially suggested that it wished to terminate the EDA program, although Department of Commerce (DOC) secretary Howard Lutnick subsequently called for reforms to the EDA program.[183] EDA programs such as the Regional Technology Hubs play a vital role in advancing the global competitiveness of technology-centered regional economies across the United States, and policymakers should push to retain these important programs. Congress should fund the EDA Hubs program and ensure that the Department of Defense, NSF, DOC, and Small Business Administration coordinate and align their various regional innovation hub programs.
Advance Promotion and Tenure—Innovation and Entrepreneurship Initiatives
A global movement called “Promotion & Tenure—Innovation & Entrepreneurship” (PTIE) has emerged to support the inclusive recognition of I&E impact by university faculty in promotion, tenure, and advancement guidelines and practices.[184] The movement notes, “Academic promotion and tenure (P&T) processes that typically prioritize faculty grants and publications can fail to fully access and value entrepreneurial, innovative endeavors that can produce the kind of societal impacts that universities are increasingly being called upon to provide and that many faculty and students increasingly prioritize.”[185] It calls for “a more inclusive assessment of scholarship and creative activity to better recognize and reward innovation and entrepreneurship.”[186] It supports developing an expanded set of I&E metrics (faculty could be assessed against), including (a) IP, (b) sponsored research, (c) use and licensing, (d) entity creation, (e) I&E career preparation, and (f) I&E engagement.[187] Certainly, considering professors’ and researchers’ roles in developing patents or other IP or launching start-up companies should become a larger factor in making tenure decisions at American universities.
State Policy Recommendations
U.S. states can enact targeted policies to boost the vibrancy of their innovation ecosystems and further technology-based economic development.
Provide Matching SBIR Funding
States should provide matching funding to businesses that successfully attract federal SBIR awards. For instance, the Commonwealth of Kentucky matches, on a competitive basis, Phase I and Phase II federal awards received by Kentucky high-tech small businesses, with the initiative attracting almost $50 million in federal grants and leveraging $1.84 in federal awards for every $1 awarded in state matching funds.[188] Similarly, Massachusetts offers SBIR Targeted Technologies (START) grants that help Massachusetts-based start-ups convert research developed under SBIR and STTR contracts into businesses and jobs in Massachusetts.[189]
Introduce Collaborative R&D Tax Credits
U.S. states can also introduce collaborative R&D tax credits. For instance, Virginia offers an R&D tax credit of 20 percent to businesses conducting research in conjunction with a Virginia college or university.[190] These credits facilitate greater levels of industry-university collaboration and thereby help build research networks. Elsewhere, Louisiana also offers an R&D credit to firms conducting research in the state, with a maximum credit of 30 percent of qualified expenditures.[191]
Introduce Innovation Vouchers
Several U.S. states now offer innovation vouchers to assist small businesses in purchasing research or technology development services from universities and research institutions. Connecticut, Indiana, New Mexico, New York, Rhode Island, and Tennessee, as well as DOE’s Office of Energy Efficiency and Renewable Energy, have adopted these vouchers to help small and medium-sized enterprises purchase R&D assistance from qualified firms, with each voucher affording grants between $25,000 and $50,000, depending on the size and type of project.[192] Considering that they are successful in promoting the execution of R&D in the short and medium term, more states and federal agencies should develop innovation voucher programs.[193]
Leverage “Fund of Funds” Approaches
States can strengthen their innovation ecosystems by adopting a “fund of funds” strategy, which involves channeling public investment into a portfolio of private venture capital funds that then invest in start-ups and early-stage companies. This model not only spreads risk but also incentivizes national and international venture firms to co-invest and establish a physical presence in the state, often as a condition of receiving funding. Wisconsin’s initiative—the Wisconsin Innovation Fund—demonstrates how an initial $50 million federal investment through the State Small Business Credit Initiative can be used to leverage significant amounts of private capital.[194] With further expansion, such a fund can attract larger firms above the national median fund size ($57 million), boost in-state deal flow, and help cultivate clusters in sectors such as advanced manufacturing, life sciences, and IT.[195] Over time, this approach not only generates strong economic returns but also builds a more resilient, diverse, and competitive start-up ecosystem.
Conclusion
America’s universities have become engines of innovation that anchor their state and regional economies and generate new products and technologies that immensely enhance the lives of Americans and global citizens alike. The Bayh-Dole Act has played an instrumental role in that transformation, enabling universities to own the IP rights stemming from federally funded R&D and giving rise to the academic technology transfer ecosystem. Yet, America’s leadership in university-driven innovation is under threat from a number of dimensions, including reduced federal funding for university research and calls for the improper use of Bayh-Dole march-in rights. Policymakers need to resist efforts to weaken American universities’ role as centers of R&D and innovation and as drivers of regional economic and employment growth and instead redouble commitment to policies that enhance universities’ roles in driving America’s tech economy.
Acknowledgments
The authors would like to thank Robert Atkinson for his feedback on this report. They would also like to thank AUTM for kindly sharing access to its STATT database.
ITIF would like to thank We Work for Health for providing financial support to help make this research possible. ITIF maintains complete editorial independence in all its research.
Any errors or omissions are their own.
About the Authors
Stephen Ezell is vice president for global innovation policy at ITIF and director of ITIF’s Center for Life Sciences Innovation. He also leads the Global Trade and Innovation Policy Alliance. His areas of expertise include science and technology policy, international competitiveness, trade, and manufacturing.
Meghan Ostertag is a research assistant for economic policy at ITIF. She holds a bachelor’s degree in economics from American University.
Leah Kann is a fellow at ITIF’s Center for Life Science Innovation. She is a recent graduate of the University of North Carolina at Chapel Hill, where she earned her Bachelor of Science in Biology and a Bachelor of Arts in Public Policy, with a minor in Spanish for Business.
About ITIF
The Information Technology and Innovation Foundation (ITIF) is an independent 501(c)(3) nonprofit, nonpartisan research and educational institute that has been recognized repeatedly as the world’s leading think tank for science and technology policy. Its mission is to formulate, evaluate, and promote policy solutions that accelerate innovation and boost productivity to spur growth, opportunity, and progress. For more information, visit itif.org/about.
Endnotes
[1]. AUTM, “Driving the Innovation Economy: Academic Technology Transfer in Numbers,” (AUTM, 2023), https://autm.net/AUTM/media/Surveys-Tools/Documents/AUTM-Infographic-2021_1.pdf.
[2]. Ibid.
[3]. Syracuse University Office of Technology Transfer, “The Bayh-Dole Act,” https://techtransfer.syr.edu/about/bayh-dole/.
[4]. “Emerging Biopharma’s Contribution to Innovation” (IQVIA, June 13, 2022), https://www.iqvia.com/insights/the-iqvia-institute/reports-and-publications/reports/emerging-biopharma-contribution-to-innovation.
[5]. Stephen Ezell, “The Bayh-Dole Act’s Vital Importance to the U.S. Life-Sciences Innovation System” (IITF, March 2019), https://itif.org/publications/2019/03/04/bayh-dole-acts-vital-importance-us-life-sciences-innovation-system/.
[6]. David Michels and Aimison Jonnard, “Review of Global Competitiveness in the Pharmaceutical Industry” (U.S. International Trade Commission, 1999), 2–3, https://wwwusitc.gov/publications/332/pub3172.pdf.
[7]. “The Research Based Pharmaceutical Industry: A Key Actor for a Healthy Europe” (European Federation of Pharmaceutical Industries and Associations, 2006).
[8]. Ezell, “The Bayh-Dole Act’s Vital Importance to the U.S. Life-Sciences Innovation System.”
[9]. B. Graham, “Patent Bill Seeks Shift to Bolster Innovation,” The Washington Post, April 8, 1978; Ashley J. Stevens et al., “The Role of Public-Sector Research in the Discovery of Drugs and Vaccines” The New England Journal of Medicine Vol. 364, Issue 6 (February 2011): 1, https://www.nejm.org/doi/full/10.1056/NEJMsa1008268.
[10]. Naomi Hausman, “University Innovation, Local Economic Growth, and Entrepreneurship” (U.S. Census Bureau Center for Economic Studies Paper No. CES-WP- 12–10, July 2012): 5, https://papers.ssrn.com/sol3/papers.cfm?abstract_id=2097842.
[11]. Louis G. Tornatzky and Elaine C. Rideout, “Innovation U 2.0: Reinventing University Roles in a Knowledge Economy” (State Science and Technology Institute, 2014), 165, https://ssti.org/report-archive/innovationu20.pdf.
[12]. Joseph P. Allen, “When Government Tried March In Rights to Control Health Care Costs,” IPWatchdog, May 2, 2016, http://www.ipwatchdog.com/2016/05/02/march-in-rights-health-care-costs/id=68816/.
[13]. Statement of Elmer B. Staats, comptroller general of the United States, before the Committee on the Judiciary United States Senate, “S. 414-The University and Small Business Patent Procedures Act,” May 16, 1979, https://www.gao.gov/assets/100/99067.pdf.
[14]. Joseph P. Allen, “A Reply to the New England Journal of Medicine,” IPWatchdog, September 10, 2013, https://www.ipwatchdog.com/2013/09/10/a-reply-to-the-new-england-journal-of-medicine/id=45085/.
[15]. Hausman, “University Innovation, Local Economic Growth, and Entrepreneurship,” 6.
[16]. John H. Rabitschek and Norman J. Latker, “Reasonable Pricing—A New Twist for March-in Rights Under the Bayh-Dole Act,” Santa Clara High Technology Law Journal Vol. 22, Issue 1 (2005): 150, https://digitalcommons.law.scu.edu/cgi/viewcontent.cgi?article=1399&context=chtlj.
[17]. Joseph P. Allen, “Want a Greater ROI for Taxpayers? Restore the Patent System, Protect Bayh-Dole and Cut the Red Tape Strangling Federal Labs,” IPWatchdog, July 9, 2018, http://www.ipwatchdog.com/2018/07/09/roi-taxpayers-restore-the-patent-system/id=99136/.
[18]. David Mowery, “University-Industry Collaboration and Technology Transfer in Hong Kong and Knowledge-based Economic Growth” (working paper, University of California, Berkeley, 2009), http://www.savantas.org/cmsimg/files/Research/HKIP/Report/1_mowery.pdf.
[19]. “Innovation’s Golden Goose,” The Economist, December 12, 2002, http://www.economist.com/node/1476653.
[20]. Wendy H. Schacht, “Patent Ownership and Federal Research and Development (R&D): A Discussion of the Bayh-Dole Act and the Stevenson-Wydler Act” (Congressional Research Service, 2000), http://ncseonline.org/nle/crsreports/science/st-66.cfm.
[21]. Hausman, “University Innovation, Local Economic Growth, and Entrepreneurship,” 7 (calculation based on NBER patent data).
[22]. Rabitschek and Latker, “Reasonable Pricing,” 150; The Economist, “Innovation’s Golden Goose.”
[23]. AUTM, “Driving the Innovation Economy: Academic Technology Transfer in Numbers.”
[24]. Phone interview with Joe Allen, July 24, 2018.
[25]. AUTM, “Driving the Innovation Economy: Academic Technology Transfer in Numbers.”
[26]. “Sparking Economic Growth” (The Science Coalition, April 2010), https://www.sciencecoalition.org/downloads/1392649827sparkingeconomicgrowthfullreportfinal4-5-10.pdf; Andreas Stephan, “Are Public Research Spin-Outs More Innovative?” (Ratio Working Paper No. 222, October 2, 2013), https://cms.ratio.se/app/uploads/2014/11/as_ratio222.pdf.
[27]. Hausman, “University Innovation, Local Economic Growth, and Entrepreneurship,” 8.
[28]. Ibid.
[29]. Saul Lach and Mark Schankerman, “Incentives and Invention in Universities” RAND Journal of Economics Vol 39, No. 2 (2008): 403–433, https://onlinelibrary.wiley.com/doi/pdf/10.1111/j.0741-6261.2008.00020.x.
[30]. Scott Shane, “Encouraging University Entrepreneurship? The Effect of the Bayh-Dole Act on University Patenting in the United States” Journal of Business Venturing 19 (2004): 127–151, https://papers.ssrn.com/sol3/papers.cfm?abstract_id=1495504.
[31]. Valentina Tartari and Scott Stern, “More than an Ivory Tower: The Impact of Research Institutions on the Quantity and Quality of Entrepreneurship” (NBER Working Paper 28846, May 2021), https://www.nber.org/papers/w28846.
[32]. Ibid.
[33]. Ibid., 1.
[34]. Ibid., 6.
[35]. Ibid.
[36]. Maryann P. Feldman, “Where Science Comes to Life: University Bioscience, Commercial Spin-offs, and Regional Economic Development” Journal of Comparative Analysis: Research and Practice Vol. 2 (2000): 345–361, https://link.springer.com/article/10.1023/A:1011489124123.
[37]. Ibid., 346.
[38] Ibid., 347.
[39]. Paul C. Godfrey, Gove N. Allen, and David Benson, “The biotech living and the walking dead” Nature Biotechnology Vol. 38 (February 2020): 132–141, https://www.nature.com/articles/s41587-019-0399-1.
[40]. Ibid.
[41]. “What Happens to University-Based Biotech Startups - And Why,” Science, February 13, 2020, https://www.science.org/content/blog-post/happens-university-based-biotech-startups---and-why.
[42]. Godfrey, Allen, and Benson, “The biotech living and the walking dead,” 137.
[43]. E. J., Delaney, “Technology search and firm bounds in biotechnology: new firms as agents of change” Growth and Change Vol. 24 (Spring 1993): 206–228.
[44]. Feldman, “Where Science Comes to Life,” 353.
[45]. Godfrey, Allen, and Benson, 140.
[46]. Ibid.
[47]. Feldman, “Where science comes to life.”
[48]. Meghan Ostertag, “The State Hamilton Index: Most States Underperform in Advanced Industries” (ITIF, May 2025), https://itif.org/publications/2025/05/05/the-state-hamilton-index-most-states-underperform-in-advanced-industries/.
[49]. Ibid.
[50]. Ibid.
[51]. Ibid.
[52]. AnnaLee Saxenian, The New Argonauts: Regional Advantage in a Global Economy (Boston, Massachusetts: Harvard University Press, 2007).
[53]. AUTM, “STATT: Statistics Access for Technology Transfer Database,” https://autm.net/surveys-and-tools/databases/statt.
[54]. “2024 Colorado Tech Industry Report” (Colorado Technology Association, 2025), https://coloradotechnology.org/wp-content/uploads/2025/02/CTA-25-TechReport-FINAL.pdf.
[55]. Ibid.
[56]. Colorado BioScience Association, “Industry Impact,” https://cobioscience.com/choose-colorado/industry-impact/.
[57]. National Center for Science and Engineering Statistics (Science & Engineering State Indicators, Venture Capital Disbursed per $1 Million of Gross Domestic Product), accessed May 14, 2025, https://ncses.nsf.gov/indicators/states/indicator/venture-capital-per-1-million-state-gdp.
[58]. Colorado BioScience Association, “Colorado’s life sciences ecosystem raised $2.15 billion in 2024,” news release, December 18, 2024, https://cobioscience.com/colorados-life-sciences-ecosystem-raised-2-15-billion-in-2024/.
[59]. National Center for Science and Engineering Statistics (The STEM Labor Force: Scientists, Engineers, and Skilled Technical Workers, Supplemental Table 22), accessed August 13, 2024, https://ncses.nsf.gov/pubs/nsb20245/data#table-block.
[60]. “Economic Contribution on the State and Counties of Operations, FY2023–24” (UC, October 2024), https://www.cu.edu/doc/fy2024-cu-impact-study-report-finalpdf; CSU STRATA, “Celebrating Innovation, 2024 Annual Report,” https://online.fliphtml5.com/nvgae/pvmg/#p=1.
[61]. Jay Hamilton, “New Report Shows DU Contributes $2.3 Billion to Colorado’s Economy,” University of Denver, December 10, 2024, https://www.du.edu/news/new-report-shows-du-contributes-23-billion-colorados-economy.
[62]. CSU STRATA, “Celebrating Innovation: 2024 Annual Report,” https://online.fliphtml5.com/nvgae/pvmg/#p=1.
[63]. Authors’ analysis of Statistics Access for Technology Transfer (STATT) Database.
[64]. Ibid.
[65]. Ibid.
[66]. USPTO (Patenting in Technology Classes, Breakout by Origin, U.S. Metropolitan and Micropolitan Areas 200-2015), accessed August 7, 2024, https://www.uspto.gov/web/offices/ac/ido/oeip/taf/cls_cbsa/allcbsa_gd.htm.
[67]. USPTO (Patenting in Technology Classes: Drug, Bio-Affecting and Body Treating Compositions, Breakout by Origin, U.S. Metropolitan and Micropolitan Areas 200-2015), accessed August 7, 2024, https://www.uspto.gov/web/offices/ac/ido/oeip/taf/cls_cbsa/424cbsa_gd.htm; USPTO (Patenting in Technology Classes: Chemistry: Analytical and Immunological Testing, Breakout by Origin, U.S. Metropolitan and Micropolitan Areas 200-2015), accessed August 7, 2024, https://www.uspto.gov/web/offices/ac/ido/oeip/taf/cls_cbsa/436cbsa_gd.htm.
[68]. AUTM Better World Project, “Colorado State University: CSU dGH Technology Helps Detect Genomic Structural Variation, Health Risks” (AUTM, 2021), https://autm.net/about-tech-transfer/better-world-project/bwp-stories/directional-genomic-hybridization-platform.
[69]. Delaware BioScience Association, “Life Sciences in Delaware: Momentum and Opportunity,” https://www.delawarebio.org/page/Life-Sciences-Delaware-Momentum-Opportunity.
[70]. “Delaware Technology Sector Impact. Bridge for Innovation” (ITIC, 2010), https://bridgeforinnovation.org/wp-content/uploads/2021/10/Delaware-Technology-Sector-Impact.pdf.
[71]. National Center for Science and Engineering Statistics (Science & Engineering State Indicators, Venture Capital Disbursed per $1 Million of Gross Domestic Product), accessed May 14, 2025.
[72]. National Center for Science and Engineering Statistics (The STEM Labor Force: Scientists, Engineers, and Skilled Technical Workers, Supplemental Table 22) accessed August 13, 2024.
[73]. Authors’ analysis of Statistics Access for Technology Transfer (STATT) Database.
[74]. Ibid.
[75]. USPTO (Patenting in Technology Classes, Breakout by Origin, U.S. Metropolitan and Micropolitan Areas 200-2015; accessed August 7, 2024). (Note: The data reports 32,416 for the Philadelphia-Camden-Wilmington (PCW) metropolitan statistical region over this time. As Delaware accounts for about one-tenth of the regional population, 3,242 patents were calculated. Dover and Seaford pitched in an additional 144 and 158, respectively.)
[76]. USPTO (Patenting in Technology Classes: Drug, Bio-Affecting and Body Treating Compositions, Breakout by Origin, U.S. Metropolitan and Micropolitan Areas 200-2015(, accessed August 7, 2024.
[77]. Ibid.
[78]. Karen B. Roberts, “From Lotion to Ocean Liner” (November 01, 2018), https://www.udel.edu/udaily/2018/november/rikarbon-startup-renewable-oil-lubricant/.
[79]. Georgia Department of Economic Development, “Georgia’s Life Sciences Make an Impact” (June 22, 2021), https://georgia.org/blog/georgias-life-sciences-make-impact.
[80]. “Georgia’s Life Science Industry Shows 14.7% Employment Growth over Past Decade,” Business Wire, April 17, 2019, https://www.businesswire.com/news/home/20190417005207/en/Georgia%E2%80%99s-Life-Science-Industry-Shows-14.7-Employment-Growth-over-Past-Decade.
[81]. Georgia Department of Economic Development, “Information Technology,” https://georgia.org/center-of-innovation/information-technology.
[82]. National Center for Science and Engineering Statistics (The STEM Labor Force: Scientists, Engineers, and Skilled Technical Workers, Supplemental Table 22), accessed August 13, 2024.
[83]. National Center for Science and Engineering Statistics (Science & Engineering State Indicators, Venture Capital Disbursed per $1 Million of Gross Domestic Product), accessed May 14, 2025.
[84]. Mike Wooten, “UGA boosts Georgia’s economy by $8.4 billion,” Columns, February 6, 2025, https://news.uga.edu/uga-boosts-georgias-economy-by-8-4-billion/.
[85]. Georgia Tech, “Georgia Tech’s Economic Impact Reaches Record $5.3 Billion for Fiscal Year 2023,” news release, August 15, 2024, https://www.gatech.edu/news/2024/08/15/georgia-techs-economic-impact-reaches-record-53-billion-fiscal-year-2023.
[86]. Authors’ analysis of Statistics Access for Technology Transfer (STATT) Database.
[87]. Ibid.
[88]. Ibid.
[89]. USPTO (Patenting in Technology Classes, Breakout by Origin, U.S. Metropolitan and Micropolitan Areas 200-2015), accessed August 7, 2024.
[90]. USPTO (Patenting in Technology Classes: Drug, Bio-Affecting and Body Treating Compositions, Breakout by Origin, U.S. Metropolitan and Micropolitan Areas 200-2015), accessed August 7, 2024; USPTO (Patenting in Technology Classes: Chemistry: Analytical and Immunological Testing, Breakout by Origin, U.S. Metropolitan and Micropolitan Areas 200-2015), accessed August 7, 2024.
[91]. Frederic Lallemand et al., “Cyclosporine A delivery to the eye: A comprehensive review of academic and industrial efforts” European Journal of Pharmaceutics and Biopharmaceutics Vol. 117 (2017): 14–28. https://doi.org/10.1016/j.ejpb.2017.03.003.
[92]. Philip Games and Anat Galor, “Cyclosporine ophthalmic emulsions for the treatment of dry eye: a review of the clinical evidence” Clinical Investigations Vol. 5, Issue 3 (2015): 267–285, https://pmc.ncbi.nlm.nih.gov/articles/PMC4420022/pdf/nihms683230.pdf.
[93]. Lee Shearer, “Company that began at UGA sells for $8.4 billion on promise of orphan drug,” Online Athens, December 8, 2015, https://www.onlineathens.com/story/news/local/2015/12/08/company-began-uga-sells-84-billion-promise-orphan-drug/15473792007/.
[94]. ���Alexion to Acquire Synageva for $8.4 billion,” Genetic Engineering & Biotechnology News, May 6, 2015, https://www.genengnews.com/news/alexion-to-acquire-synageva-for-8-4-billion/.
[95]. Suniva, “About Us,” https://suniva.com/#about.
[96]. Ibid.
[97]. “2023 TechPoint Tech Workforce Report” (TechPoint, 2023), https://techpoint.org/wp-content/uploads/2023/01/2023-TechPoint-Tech-Workforce-Report.pdf.
[98]. Building Indiana, “Indiana Sets New National Benchmark as #1 in Life Sciences Exports” (2025), https://buildingindiana.com/stories/indiana-sets-new-national-benchmark-as-1-in-life-sciences-exports%2C32485/.
[99]. National Center for Science and Engineering Statistics (Science & Engineering State Indicators, Venture Capital Disbursed per $1 Million of Gross Domestic Product), accessed May 14, 2025.
[100]. National Center for Science and Engineering Statistics (The STEM Labor Force: Scientists, Engineers, and Skilled Technical Workers, Supplemental Table 22), accessed August 13, 2024.
[101]. Indiana University, “The Economic Value of Indiana University” (Indiana University, August 2020), https://impact.iu.edu/reports/iu-execsummary.pdf; Purdue University, “Purdue’s economic impact in Indiana totals more than $2.1 billion,” news release, January 12, 2018, https://it.purdue.edu/newsroom/2018/180112-OIRAE-briefing-December.php; The Perryman Group, “The Economic Benefits of Purdue University Fort Wayne” (March 2019), https://www.pfw.edu/sites/default/files/documents-2023/04/purdue-fort-wayne-economic-impact.pdf.
[102]. Phillip Fiorini, “Purdue ranks among top 50 global research universities powering innovation” Purdue University, May 14, 2025, https://www.purdue.edu/newsroom/2025/Q2/purdue-ranks-among-top-50-global-research-universities-powering-innovation/.
[103]. Authors’ analysis of Statistics Access for Technology Transfer (STATT) Database.
[104]. Ibid.
[105]. Ibid.
[106]. USPTO (Patenting in Technology Classes, Breakout by Origin, U.S. Metropolitan and Micropolitan Areas 200-2015), accessed August 7, 2024.
[107]. USPTO (Patenting in Technology Classes: Drug, Bio-Affecting and Body Treating Compositions, Breakout by Origin, U.S. Metropolitan and Micropolitan Areas 200-2015), accessed August 7, 2024.
[108]. Academy of Inventors (2023), U.S. Universities Granted U.S. Utility Patents, https://academyofinventors.org/wp-content/uploads/2024/05/2023-Top-100-US-Universities.pdf.
[109]. Purdue University, “ReElement Technologies uses Purdue tech in rare earth elements production critical to semiconductor manufacturing, other new-age technologies” news release, January 23, 2024, https://www.purdue.edu/newsroom/2024/Q1/reelement-technologies-uses-purdue-tech-in-rare-earth-elements-production-critical-to-semiconductor-manufacturing-other-new-age-technologies/.
[110]. Purdue University, “Returning rare earth element production to the United States,” news release, April 18, 2024, https://www.purdue.edu/newsroom/2024/Q2/returning-rare-earth-element-production-to-the-united-states/.
[111]. PhRMA, “Biopharmaceutical Sector Impact on Kansas’ Economy,” https://cdn.aglty.io/phrma/fact-sheets/economic-impact/Kansas_Eco%20Impact%20One%20Pager%202022_2.pdf.
[112]. Kansas Department of Commerce, “Bioscience,” https://www.kansascommerce.gov/industry/bioscience/.
[113]. Biotechnology Innovation Organization BIO), “Kansas State Profile,” https://www.bio.org/sites/default/files/2022-10/KS-BIO2022%20-%20state%20profile.pdf.
[114]. Bridge for Innovation, “Technology’s Impact in Kansas,” https://bridgeforinnovation.org/impact-map/technologys-impact-in-kansas/.
[115]. Ibid.
[116]. Ibid.
[117]. National Center for Science and Engineering Statistics (Science & Engineering State Indicators, Venture Capital Disbursed per $1 Million of Gross Domestic Product), accessed May 14, 2025.
[118]. National Center for Science and Engineering Statistics (The STEM Labor Force: Scientists, Engineers, and Skilled Technical Workers, Supplemental Table 22(, accessed August 13, 2024.
[119]. Kansas University, Office of Research, “Record-high research at KU benefits Kansans, fuels state economy,” news release, February 28, 2025, https://research.ku.edu/news/article/record-high-research-at-ku-benefits-kansans-fuels-state-economy.
[120]. Authors’ analysis of Statistics Access for Technology Transfer (STATT) Database.
[121]. Ibid.
[122]. Ibid.
[123]. USPTO (Patenting in Technology Classes, Breakout by Origin, U.S. Metropolitan and Micropolitan Areas 200-2015), accessed August 7, 2024.
[124]. USPTO (Patenting in Technology Classes: Drug, Bio-Affecting and Body Treating Compositions, Breakout by Origin, U.S. Metropolitan and Micropolitan Areas 200-2015), accessed August 7, 2024.
[125]. “North Carolina State of Technology 2025 Industry Report” (North Carolina Technology Association, 2025), https://www.nctech.org/_files/_pdf/talent/NC%20Tech%20State%20of%20the%20Technology%20Industry%20Report%202025.pdf.
[126]. Eric Medlin, “Economic Change: From Traditional Industries to the 21st Century Economy” (ANCHOR, A North Carolina Online History Resource, 2020), https://www.ncpedia.org/anchor/economic-change-and-traditional-industries.
[127]. “TEConomy report: NC life sciences growth outpaces nation, passes 100,000-job milestone” (North Carolina Biotechnology Center, 2025), https://www.ncbiotech.org/news/teconomy-report-nc-life-sciences-growth-outpaces-nation-passes-100000-job-milestone.
[128]. “North Carolina Life Sciences Ecosystem Continued to Thrive in 2023” (North Carolina Biotechnology Center, 2023), https://www.ncbiotech.org/news/north-carolina-life-sciences-ecosystem-continued-thrive-2023.
[129]. National Center for Science and Engineering Statistics (Science & Engineering State Indicators, Venture Capital Disbursed per $1 Million of Gross Domestic Product), accessed May 14, 2025.
[130]. National Center for Science and Engineering Statistics (The STEM Labor Force: Scientists, Engineers, and Skilled Technical Workers, Supplemental Table 22), accessed August 13, 2024.
[131]. The University of North Carolina at Chapel Hill, “Driving Our State’s Economy,” https://www.unc.edu/story/economic-impact/.
[132]. Authors’ analysis of Statistics Access for Technology Transfer (STATT) Database.
[133]. Ibid.
[134]. Ibid.
[135]. USPTO (Patenting in Technology Classes, Breakout by Origin, U.S. Metropolitan and Micropolitan Areas 200-2015), accessed August 7, 2024.
[136]. Bayh-Dole Coalition, “2025 Faces of American Innovation” (Bayh-Dole Coalition, June 2025), 6-7, https://bayhdolecoalition.org/wp-content/uploads/2025/05/2025-Faces-of-American-Innovation-Report.pdf.
[137]. State Relations Duke, “Annual Report on Impact and Engagement,” April 2023, Duke University, https://staterelations.duke.edu/wp-content/uploads/sites/53/2023/04/Duke-in-North-Carolina-Annual-Report-on-Impact-and-Engagement-2023.pdf.
[138]. The Wallace H. Coulter Foundation, “About the Foundation,” https://whcf.org/the-wallace-h-coulter-foundation/.
[139]. Meghan Ostertag, “America Is Falling Behind on University Research,” Innovation Files, May 16, 2025, https://itif.org/publications/2025/05/16/america-is-falling-behind-on-university-research/.
[140]. Dan Garisto, Jeff Tollefson, and Alexandra Witze, “How Trump’s attack on universities is putting research in peril” Nature, April 24, 2025, https://www.nature.com/articles/d41586-025-01289-4.
[141]. “Trump’s attack on science is growing fiercer and more indiscriminate,” The Economist, May 21, 2025, https://www.economist.com/science-and-technology/2025/05/21/trumps-attack-on-science-is-growing-fiercer-and-more-indiscriminate.
[142]. Ibid.
[143]. “America is in danger of experiencing an academic brain drain” The Economist, May 21, 2025, https://www.economist.com/science-and-technology/2025/05/21/america-is-in-danger-of-experiencing-an-academic-brain-drain.
[144]. Robert D. Atkinson and David Moschella, Technology Fears and Scapegoats: 40 Myths About Privacy, Jobs, AI, and Today’s Innovation Economy (London: Palgrave Macmillan, 2024).
[145]. OECD, “Gross domestic expenditure on R&D by sector of performance and source of funds,” https://data-explorer.oecd.org/.
[146]. Data and chart courtesy of the Association of University Technology Managers (AUTM). AUTM Licensing Activity Survey: FY2023. Chart: “Relationship Between Federal R&D Funding and Invention Disclosures.”
[147]. National Center for Science and Engineering Statistics, National Patterns of R&D Resources (U.S. gross domestic product, R&D, and ratio of R&D to gross domestic product (and components): 1953–2023), accessed May 22, 2024, https://ncses.nsf.gov/data-collections/national-patterns/2022-2023#data.
[148]. National Institute of Health, “Supplemental Guidance to the 2024 NIH Grants Policy Statement: Indirect Cost Rates,” Notice Number: NOT-OD-25-068, February 7, 2025, https://grants.nih.gov/grants/guide/notice-files/NOT-OD-25-068.html#_ftnref2.
[149]. Heidi Ledford, “Indirect costs: Keeping the lights on,” Nature, December 23, 2014, https://www.nature.com/news/indirect-costs-keeping-the-lights-on-1.16376.
[150]. National Institute of Health, “Supplemental Guidance to the 2024 NIH Grants Policy Statement: Indirect Cost Rates”; Alexandra Graddy-Reed et al., “The Distribution of Indirect Cost Recovery in Academic Research” Science and Public Policy Volume 48, Issue 3 (June 2021): 364–386, https://doi.org/10.1093/scipol/scab004.
[151]. John R. Thomas, “March-In Rights Under the Bayh-Dole Act” (Congressional Research Service, August 2016), 7, https://fas.org/sgp/crs/misc/R44597.pdf.
[152]. David S. Bloch, “Alternatives to March-In Rights” Vanderbilt Journal of Entertainment and Technology Law Vol. 18:2:247 (2016): 253, http://www.jetlaw.org/wp-content/uploads/2016/03/Bloch_SPE_6-FINAL.pdf.
[153]. Statement of Senator Birch Bayh to the National Institutes of Health (May 24, 2004), https://www.ott.nih.gov/sites/default/files/documents/2004NorvirMtg/2004NorvirMtg.pdf.
[154]. Thomas, “March-In Rights Under the Bayh-Dole Act,” 10.
[155]. Birch Bayh, “Statement of Birch Bayh to the National Institutes of Health,” May 25, 2014, http://www.essentialinventions.org/drug/nih05252004/birchbayh.pdf.
[156]. Birch Bayh and Bob Dole, “Our Law Helps Patients Get New Drugs Sooner,” The Washington Post, April 11, 2002, https://www.washingtonpost.com/archive/opinions/2002/04/11/our-law-helps-patients-get-new-drugs-sooner/d814d22a-6e63-4f06-8da3-d9698552fa24/.
[157]. Ibid.
[158]. Ezell, “The Bayh-Dole Act’s Vital Importance to the U.S. Life-Sciences Innovation System.”
[159]. Joseph Allen, “Proposal from Senator King Won’t Reduce Drug Prices, Just Innovation,” IPWatchdog, July 17, 2017, https://www.ipwatchdog.com/2017/07/17/senator-king-reduce-drug-prices-innovation/id=85702/.
[160]. Stephen Ezell, “Comments to the National Institutes of Health on ‘Maximizing NIH’s Levers to Catalyze Technology Transfer’” (ITIF, August 2023), https://itif.org/publications/2023/08/18/maximizing-nih-levers-to-catalyze-technology-transfer/.
[161]. “Return on Investment Initiative: Draft Green Paper” (National Institute of Standards and Technology, December 2018), 30, https://nvlpubs.nist.gov/nistpubs/SpecialPublications/NIST.SP.1234.pdf.
[162]. Ibid., 30.
[163]. The Trump White House, “Delivering Most-Favored Nation Prescription Drug Pricing to American Patients” (Executive Order, May 12, 2025), https://www.whitehouse.gov/presidential-actions/2025/05/delivering-most-favored-nation-prescription-drug-pricing-to-american-patients/.
[164]. Stephen Ezell, “Foreign Reference Pricing: A Fast Track to Losing America’s Biopharmaceutical Edge to China,” Innovation Files, May 13, 2025, https://itif.org/publications/2025/05/13/foreign-reference-pricing-a-fast-track-to-losing-americas-biopharma-edge-to-china/.
[165]. Stephen Ezell, Leah Kann, and Sandra Barbosu, “The Inflation Reduction Act Is Negotiating the United States Out of Drug Innovation” (ITIF, February 2025), https://itif.org/publications/2025/02/25/the-inflation-reduction-act-is-negotiating-the-united-states-out-of-drug-innovation/.
[166]. Duane G. Schulthess et al., “The Inflation Reduction Act’s Impact upon Early-stage Venture Capital Investments” medRxiv, January 7, 2025, https://www.medrxiv.org/content/10.1101/2025.01.07.25320113v1.full-text.
[167]. PhRMA, “Inflation Reduction Act Already Impacting R&D,” https://cdn.aglty.io/phrma/global/resources/import/pdfs/Infographic%20%20Inflation%20Reduction%20Act%20Already%20Impacting%20RD%20%20010923%20FINAL.pdf.
[168]. Duane G. Schulthess et al., “Inflation Reduction Act – Two Years On Investor Behavior, R&D Impacts, & Proposed Solutions” (Vital Transformations, April 2025), https://vitaltransformation.com/2025/04/inflation-reduction-act-two-years-on-investor-behavior-rd-impacts-proposed-solutions/.
[169]. Yunan Ji and Parker Rogers, “The Long-Run Impacts of Regulated Price Cuts: Evidence from Medicare” (National Bureau of Economic Research, Working Paper 33083, October 2024), https://www.nber.org/papers/w33083.
[170]. Ezell, “Foreign Reference Pricing: A Fast Track to Losing America’s Biopharmaceutical Edge to China.”
[171]. Stephen Ezell, “Testimony Before the Senate Small Business and Entrepreneurship Committee on Reauthorizing SBA’s Innovation Programs” (ITIF, May 2019), https://itif.org/publications/2019/05/15/testimony-senate-small-business-and-entrepreneurship-committee-reauthorizing/.
[172]. U.S. Small Business Administration, “Birth & History of the SBIR Program,” https://www.sbir.gov/birth-and-history-of-the-sbir-program.
[173]. U.S. House of Representatives, 110th Congress, “H. Rept. 110-595 - SBIR/STTR REAUTHORIZATION ACT,” April 18, 2008, 4, https://www.congress.gov/congressional-report/110th-congress/house-report/595/1?s=1&r=62.
[174]. Ezell, “Testimony Before the Senate Small Business and Entrepreneurship Committee on Reauthorizing SBA’s Innovation Programs”
[175]. Matthew Stepp and Robert D. Atkinson, “Creating a Collaborative R&D Tax Credit” (ITIF, June 2011), https://www2.itif.org/2011-creating-r&d-credit.pdf.
[176]. Robert D. Atkinson, “The Trump Administration Should Get Industry More Involved in University Research Funding” Innovation Files, April 22, 2025, https://itif.org/publications/2025/04/22/trump-administration-get-industry-more-involved-in-university-research-funding/.
[177]. Ibid.
[178]. Joe Kennedy and Robert Atkinson, “Why Expanding the R&D Tax Credit Is Key to Successful Corporate Tax Reform” (ITIF, July 2017), https://www2.itif.org/2017-rd-tax-credit.pdf.
[179]. Ian Clay, “Why Congress Should Restore Full Expensing for Investments in Equipment and Research and Development” (ITIF, November 2022), https://itif.org/publications/2022/11/28/why-congress-should-restore-full-expensing/.
[180]. Robert D. Atkinson, Mark Muro, and Jacob Whiton, “The Case for Growth Centers: How to Spread Tech Innovation Across America” (ITIF, December 2019), https://itif.org/publications/2019/12/09/case-growth-centers-how-spread-tech-innovation-across-america/.
[181]. U.S. Economic Development Administration, “Regional Technology and Innovation Hubs (Tech Hubs),” https://www.eda.gov/funding/programs/regional-technology-and-innovation-hubs.
[182]. U.S. Economic Development Administration, “Tech Hubs FAQs for Phase 2 Announcement,” https://www.eda.gov/funding/programs/regional-technology-and-innovation-hubs/phase-2-announcement-faq.
[183]. Initiative for a Competitive Inner City (ICIC), “Trump’s Proposed Budget Would be Devastating for Inner City Economic Development,” https://icic.org/blog/trumps-proposed-budget-devastating-inner-city-economic-development/.
[184]. “Valuing Societal Impact in Higher Education” (Promotion & Tenure—Innovation & Entrepreneurship), https://ptie.org/.
[185]. Rich G. Carter et al., “Innovation, entrepreneurship, promotion, and tenure” Science Vol. 373, Issue 6561 (September 17, 2021), 1312–1314, https://www.science.org/doi/10.1126/science.abj2098.
[186]. Ibid.
[187]. PTIE, “Valuing Societal Impact in Higher Education.”
[188]. Team Kentucky, “High-Tech Startup Funding and Investment,” https://www.kyinnovation.com/programs-and-incentives/.
[189]. MassVentures, “SBIR Targeted Technologies ‘START’ Grants,” https://www.mass-ventures.com/start-program-info.
[190]. Strike Tax Advisory, “Virginia R&D Tax Credits,” 2024, https://www.striketax.com/usa-tax-credit/virginia-r-d-tax-credits.
[191]. Strike Tax Advisory, “Louisiana R&D Tax Credits,” 2024, https://www.striketax.com/usa-tax-credit/louisiana-r-d-tax-credits.
[192]. Department of Energy (DOE), Office of Energy Efficiency and Renewable Energy, “Small Business Voucher Pilot Program,” https://www.energy.gov/eere/solar/small-business-voucher-pilot-program.
[193]. Marco Kleine et al., “Subsidized R&D Collaboration: The Causal Effect of Innovation Vouchers on Innovation Performance” Max Planck Institute for Innovation & Competition Research Paper No. 20-11 (July 15, 2020), https://papers.ssrn.com/sol3/papers.cfm?abstract_id=3648126.
[194]. Wisconsin Tech Council, “The Tech Council’s 2025 White Papers” (Wisconsin Tech Council, 2025), https://wisconsintechnologycouncil.com/wp-content/uploads/2025/02/2025-White-Papers-Final-Web.pdf.
[195]. Ibid.
Editors’ Recommendations
May 16, 2025
America Is Falling Behind on University Research
June 9, 2011
