
The Trade Imbalance Index: Where the Trump Administration Should Take Action to Address Trade Distortions
As the Trump administration seeks to rebalance America’s trade relationships, it should focus the most attention on countries where U.S. industries face the worst trade distortions and imbalances, and where the greatest gains can be achieved for the U.S. economy. China, India, and the European Union top that list.
KEY TAKEAWAYS
Key Takeaways
Contents
Mercantilist Country Analysis 5
Appendix 2: Detailed Indicator Values and Scores for All Countries 28
Introduction
The second Trump administration has taken office looking to put U.S. trade relations on a more equitable footing with the rest of the world. President Trump has railed that other nations “are taking advantage of us” and vowed to ensure that U.S. companies are treated fairly in international markets. As Secretary of State Marco Rubio recently told U.S. allies, “I know you’ve gotten used to a foreign policy in which you act in the national interest of your country, and we sort of act in the interest of the globe or global order. But we are led by a different person now.”[1]
To enact the president’s vision, the White House has instructed the Office of the United States Trade Representative (USTR), in coordination with the departments of Commerce and Treasury, to identify “any unfair trade practices by other countries and recommend appropriate actions to remedy such practices” by April 1, 2025.[2]
Meanwhile, the president has already trained his fire at several nations in the opening weeks of his administration—notably Canada, China, Colombia, and Mexico—but the to-do list is long, as an increasing number of countries around the world have adopted mercantilist trade practices in recent decades.[3] Against that backdrop, the administration should focus on countries where systematically unfair, mercantilist trade policies are inflicting the most significant damage on the U.S. economy and U.S. corporations (large and small alike), and where the United States stands to gain the most by restoring balanced trade. Accordingly, the Information Technology and Innovation Foundation (ITIF) has developed the “Trade Imbalance Index” described in this report. It evaluates 48 countries (15 of which are included in the “European Union” bloc) on 11 measures to ascertain which are the biggest trade mercantilists or scofflaws and where the Trump administration should concentrate its attention as it seeks to advance a trade policy that more effectively defends U.S. interests and ensures more balanced trade relations.
This report evaluates the largest 48 countries by gross domestic product (GDP) on 11 indicators covering 4 categories.[4] (See Appendix 1 for the full methodology.) In brief, the categories and indicators are as follows:
▪ Trade balance in goods and information services: This category considers U.S. trade balances in goods and information services. ITIF used the raw values of the trade balances rather than the relative values (e.g., trade balance as a share of GDP) to better measure the overall harm a nation has on the United States when it runs a surplus. In other words, a nation with which the United States has a high deficit would cause more harm to the United States even if the deficit were small when compared to its GDP.[5]
▪ Trade restrictions: These involve a simple mean tariff rate across all product categories, the prevalence of non-tariff trade barriers (NTBs), and the nation’s Services Trade Restrictiveness Index score.[6]
▪ Taxes and regulations: These cover the extent of a country’s Digital Markets Act (DMA) regulations, extent of digital services taxes (DSTs), extent of pharmaceutical price controls, the presence of antitrust fines, and the presence of noncompetition fines on the digital economy. [7]
▪ Intellectual property (IP): This category includes the 2024 USTR Section 301 Watch List and the nation’s score on the U.S. Chamber of Commerce International IP Index.[8]
Because we believe that America’s bilateral trade balance with a given country is not the most important factor in determining whether the Trump administration should prioritize that nation for a trade response, the trade-balance indicator accounts for only one-quarter of the total weighted score in our index. Ultimately more important than bilateral trade balances are the underlying factors affecting U.S. trade with a given country. So even if a country runs a trade deficit with the United States, there may be reason for the Trump administration to confront it if the country employs a significant number or degree of unfair trading practices.
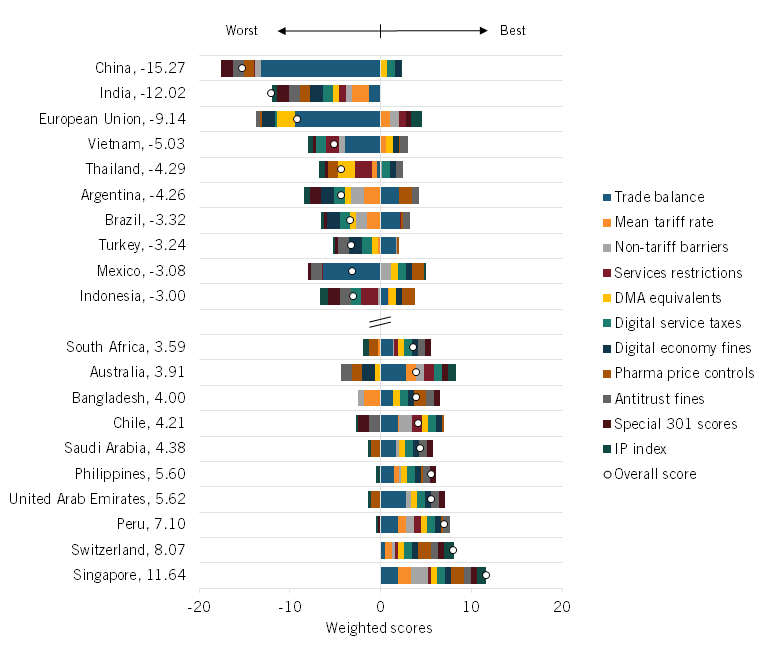
Weighing these considerations, China, India, the European Union, Vietnam, and Argentina rank as the five worst offenders in ITIF’s index. (In this study, “European Union” refers to the 15 largest EU members, except in the trade-balance indicator where it refers to the whole bloc.)[9]
Figure 1 shows the worst- and best-performing countries’ weighted overall scores in ITIF’s index. (See Appendix 2 for complete scores.) The more negative the score, the more the Trump administration should prioritize that nation for a trade response. The 10 worst-performing nations with negative scores (from worst to best) are China, India, the European Union, Vietnam, Argentina, Thailand, Brazil, Turkey, Mexico, and Indonesia. In contrast, the nations that should be least likely to face retaliatory measures from the Trump administration include Singapore, Switzerland, Peru, the United Arab Emirates, and the Philippines.
Figure 1: Overall scores of the worst- and best-performing nations in ITIF’s Trade Imbalance Index
This report begins by offering an in-depth analysis of the problematic trade and economic policies of the top three most problematic nations (or regions in the European Union case). It then analyzes how countries fared on each of the individual indicators in the report. Finally, it offers trade policy recommendations for the Trump administration and Congress to responsibly address the mercantilist practices of foreign countries.
Mercantilist Country Analysis
As noted, China, India, and the European Union score lowest in ITIF’s index and stand out as the nations where the Trump administration should focus the greatest attention on rebalancing trade and economic relations.
China
China’s ranking first in the study is no surprise. The country has persistently failed to adhere to the commitments it made to the United States, and other international trade partners, when it joined the World Trade Organization (WTO), as ITIF has documented across numerous reports.[10] Over the past decade, the country has recorded a nearly $3.5 trillion trade surplus in manufactured goods with the United States.[11] In 2023, China’s goods trade surplus with the United States reached $279 billion, with this amount growing to $295 billion in 2024. And that figure represented about one-third of China’s nearly $1 trillion trade surplus with the world last year as its exports swamped the globe.[12] China’s 2022 simple mean tariff rate stood at 6.5 percent.
USTR identified China as a Priority Watch List country in 2024 for its continued infringements on U.S. IP rights. The report notes that “long-standing issues [remain] including technology transfer, trade secrets, counterfeiting, online piracy, copyright law, and patent and related policies.”[13] The Commission on the Theft of American Intellectual Property has estimated that China’s IP theft may cost the U.S. economy as much as $600 billion annually.[14] A 2019 CNBC Global CFO Council report found that one in five North American corporations had their IP stolen in China in 2018.[15] In ITIF’s series of “How Innovative Is China in High-Tech Industries” reports, ITIF documented numerous cases of IP theft in sectors ranging from electric vehicles and nuclear technology to semiconductors and electronic displays.[16] China also continues to be the world’s leading source of counterfeit and pirated goods.[17] The country further imposes more barriers to cross-border data flows than any other nation in the world.[18]
China’s rampant IP theft may cost the U.S. economy as much as $600 billion annually, with high-tech sectors most at risk.
China has opened specious antitrust investigations into U.S. tech companies including Google and NVIDIA and in the past imposed unjustified antitrust fines on U.S. tech companies, such as the $1 billion fine it imposed on Qualcomm in 2015.[19] With regard to pharmaceuticals, China imposes steep drug price controls and favors Chinese firms in national drug selection.[20]
Forced transfer of technology or IP as a condition of Chinese market access—or requirements to manufacture locally as a condition of access to Chinese markets—remains a perennial challenge. Indeed, China calls this strategy “trading technology for market.” However, now that China has sufficiently competitive high-tech firms in a variety of sectors, it is increasingly moving from a strategy of “compulsion” to one of “expulsion.”
For instance, on April 12, 2024, The Wall Street Journal reported that “China’s push to replace foreign technology is now focused on cutting American [chipmakers] out of the country’s telecommunications systems.”[21] The move would impact a variety of U.S. semiconductor companies, including AMD and Intel. The article notes that “[Chinese] officials earlier this year directed the nation’s largest telecom carriers to phase out foreign processors that are core to their networks by 2027.”[22] The effort is similar to one articulated in Document 79, which requires state-owned enterprises in finance, energy, and other sectors to replace foreign software in their information technology (IT) systems by 2027.[23]
Elsewhere, the Chinese government has asked electric vehicle makers from BYD to Geely to sharply increase their purchases from local auto chipmakers, part of a campaign to reduce reliance on Western imports and boost China’s domestic semiconductor industry.[24] China’s Ministry of Industry and Information Technology has directly instructed Chinese automakers to avoid foreign semiconductors if at all possible.[25] Such measures leave no doubt that import substitution and achieving self-sufficiency represent an essential goal of China’s competitive strategy in a range of high-tech industries from autos to semiconductors. Such a strategy is directly antithetical to and contravenes the commitments China made to global trade partners in joining the WTO. China is indeed the world’s number one mercantilist.
India
India ranks second in this index. In 2024, India recorded a $45.7 billion trade surplus with the United States. That was atop a $43.3 billion trade surplus the year before.[26] India’s simple mean tariff rate is 14.3 percent, while on a trade-weighted basis, India’s rate is about 12 percent compared with America’s rate of 2.2 percent.[27] Of the countries assessed in this report, India scores fourth worst with regard to its services trade restrictiveness. India continues to maintain high customs duties on IP-intensive goods such as IT products, solar energy equipment, medical devices, pharmaceuticals, and capital goods.[28]
In 2016, India implemented an equalization levy (EL) of 6 percent on nonresidents engaged in online advertisement and related activities with Indian customers. India’s Finance Act of 2020 expanded the EL to introduce a levy on e-commerce supply or services equal to 2 percent of gross income facilitated by a nonresident e-commerce operator.[29] On March 12, 2024, the Indian Ministry of Corporate Affairs released a draft report of the Committee on Digital Competition Law along with a draft bill on the Digital Competition Act that “bears a striking resemblance” to the EU’s problematic Digital Markets Act.[30] The legislation embraces an ex ante regulatory model and follows the path of overbearing competition policy taken by the EU.[31]
U.S. companies have also been the target of significant antitrust fines levied by Indian authorities. India’s Competition Commission fined Meta $24.5 million for its data sharing practices, contending that the company abused its dominance and “coerced” WhatsApp users into accepting a 2021 privacy policy that allegedly expanded user data collection and sharing, giving it an unfair advantage over rivals.[32] The commission also fined Google $154 million for practices related to its Android operating system.[33] Overall, India is heavily scrutinizing American tech companies and following a European approach.
India remains on USTR’s Special 301 Priority Watch List, as “there continues to be a lack of progress on many long-standing IP concerns raised in prior Special 301 Reports. India remains one of the world’s most challenging major economies with respect to protection and enforcement of IP.”[34] India continues to place elevated restrictions on patent subject matter eligibility that exceeds the required novelty, inventive step, and industrial applicability requirements. Under Section 3(d) of the Indian Patent Act, there exists an additional “fourth hurdle” regarding the inventive step and enhanced efficacy that limits patentability for certain types of pharmaceutical inventions and chemical compounds.[35] India ranks 42nd out of 55 countries on the Global Innovation Policy Center’s International IP Index. Elsewhere, India’s pirating of film and audiovisual content through illicit video recording remains a major challenge.
On February 13, 2025, Indian Prime Minister Narendra Modi visited president Trump in Washington, D.C. He appeared to come prepared to offer certain tariff concessions on some products, including automobiles and electronics, to the United States.[36] Coming out of those meetings, Indian and U.S. officials agreed to start developing “broad contours of [a] proposed trade agreement” between the two countries, which obviously has significant potential to address some of these trade irritants and significantly improve the India-U.S. trade relationship.[37]
The European Union
The EU ranks third in this index, as it’s among the leading practitioners of discriminatory trade policies targeting U.S. enterprises, particularly those in digital industries, thanks especially to its DMA and Digital Services Act (DSA). In fact, there are over 100 digital regulations in force across the EU, enforced by at least 270 agencies.[38] European policymakers ostensibly designed the DMA to create a fairer digital market by preventing large online platforms, which the EU calls “gatekeepers,” from abusing their market power and ensuring more competition for smaller companies and consumers in digital industries. Its sister legislation, the 2022 DSA, addresses illegal content, transparent advertising, and disinformation.
But as ITIF has written, the legislation should really have been called the “U.S. Tech Firms Act,” as the legislation intentionally singles out U.S. tech companies.[39] For instance, the European Parliament rapporteur for the DMA, Andreas Schwab, suggested that the DMA should unquestionably target only the five biggest U.S. digital firms (Google, Amazon, Apple, Facebook, and Microsoft).[40] Basically, the DMA and DSA have been designed to cover, almost exclusively, U.S. firms and not their European or Chinese competitors that offer similar services.[41] A leaked draft of the proposed EU DSA was quite clear on this intent: “Asymmetric rules will ensure that smaller emerging competitors are boosted, helping competitiveness, innovation, and investment in digital services.”[42] Indeed, the European Commission has opened non-compliance investigations against Alphabet, Apple and Meta under its DMA.[43]
The DMA should really have been called the “U.S. Tech Firms Act,” as the legislation has almost exclusively singled out U.S. tech companies.
Certain European countries have used their legislation to impose punitive antitrust fines on U.S. companies. For instance, Apple faced a £1.5 billion ($1.9 billion) class action lawsuit in the United Kingdom for allegedly overcharging software developers through the App Store.[44] The case claims that Apple abused its market dominance by imposing a 30 percent commission on app purchases. Further, the United Kingdom’s Competition and Markets Authority (CMA) has indicated possible investigations into Amazon’s and Microsoft’s dominance in cloud computing, following alleged concerns about anticompetitive behavior in the sector.[45]
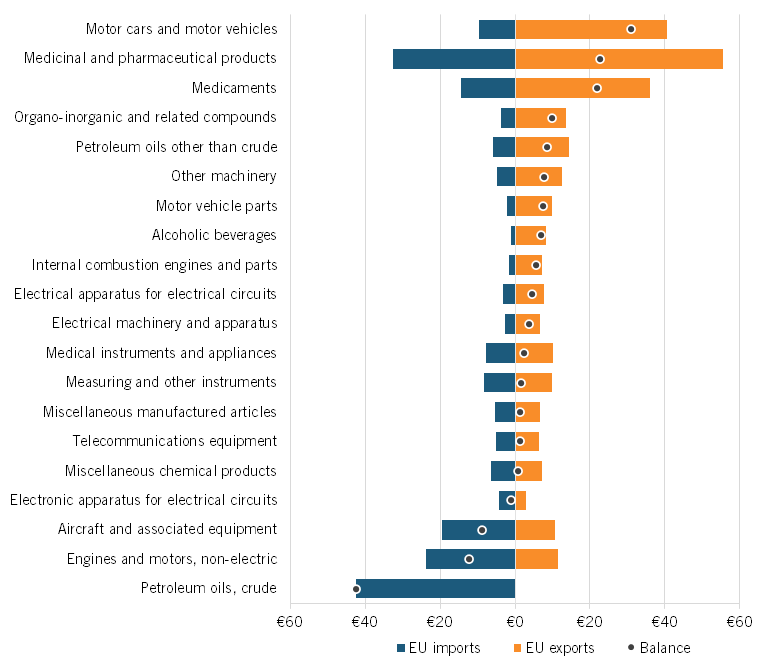
In 2023, the EU ran a trade surplus of $208.7 billion with the United States. (See figure 2.) The EU runs significant trade surpluses with the United States across a number of advanced-technology industries, including pharmaceuticals and medical devices, motor vehicles and parts, electrical goods, telecommunication goods, chemicals, and instruments. (See figure 3.) Europe’s large trade surplus with the United States in pharmaceuticals stems largely from the extensive drug price controls implemented by most countries on the continent and their failure to pay adequate prices for innovative medicines.[46] Of the 27 EU nations, all but 7 (Malta, Luxemburg, Croatia, Lithuania, Belgium, Spain, and the Netherlands) run trade surpluses in goods with the United States. And the country whose officials complain the loudest of U.S. “digital dominance”—Germany—runs the largest trade surplus.[47]
Figure 2: U.S. trade deficit with the EU (billions)[48]
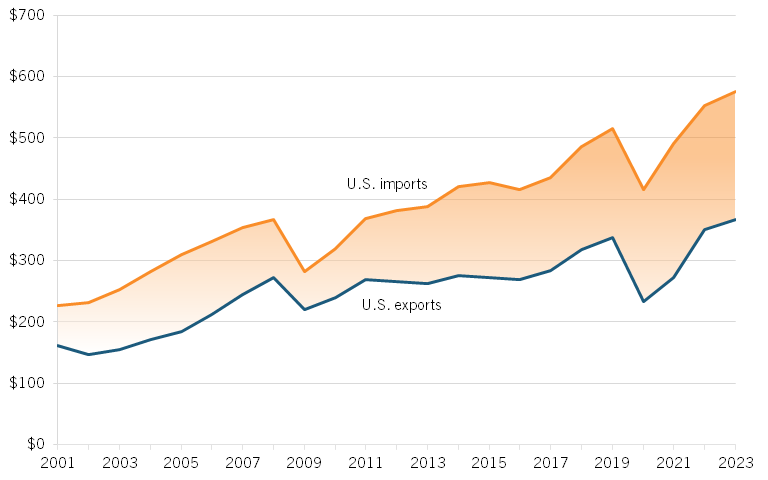
Figure 3: EU trade balance with the United States in goods industries, 2023 (billions)[49]
While the European Union applies a relatively low simple mean tariff rate, this obscures a variety of value-added taxes and other fees that make U.S. products more expensive in Europe. For example, the EU levies a 10 percent tariff on U.S. car imports, while the United States imposes a 2.5 percent duty.[50] And as president Trump has observed, when Europe’s value-added taxes (VAT) are added in, U.S. car exports to Europe can be tariffed and taxed as high as 30 percent.[51]
Indicator Analysis
Trade Balance in Goods and Information Services
The Trade Balance in Goods and Information Services indicator provides a standardized score for each nation based on its trade surplus or deficit in goods and information services with the United States in 2023, as measured by the U.S. Census Bureau’s “USA Trade” and the Organization of Economic Cooperation and Development (OECD).[52] Countries with large trade surpluses against the United States receive a low standardized score, those with moderate surpluses receive a mid-range score, and those with trade deficits or balanced trade receive a high score.
This indicator is included in the index because significant trade imbalances are often perceived as evidence of unfair trade practices, currency manipulation, or insufficient market access for U.S. goods. ITIF uses the trade balance in goods and information services measure here (as opposed to trade balance in goods as a share of GDP measure), recognizing that the Trump administration places a significant focus on the overall harm a large trade deficit has on the United States. In other words, the administration is more concerned with a nation with a large deficit than one with a large deficit relative to its GDP. As such, under the Trump administration, countries with low scores should be more likely to face retaliatory measures such as tariffs, stricter trade policies, or efforts to renegotiate trade agreements.
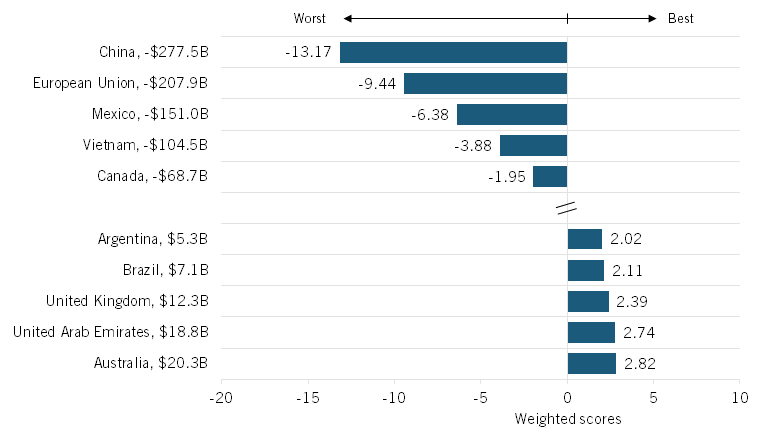
Figure 4 highlights the nations with the largest goods and information services trade surpluses and deficits with the United States. (See the full list of countries in the appendix, figure 16.) China, the European Union, Mexico, and Vietnam all could become prime targets for trade restrictions or renegotiations based on their substantial surpluses. For example, China has the highest surplus at $277.5 billion. The European Union runs a surplus of $208 billion, while Mexico runs a surplus of $151 billion and Vietnam enjoys a $104 billion surplus. Meanwhile, Australia, the United Arab Emirates, and the United Kingdom maintain a more balanced trade relationship with the United States, all running a deficit that exceeds $10 billion, making them less likely to face economic pushback from the administration on account of trade balances.
Figure 4: Trade balance of goods and IT services (2023) and weighted standardized scores (weight = 3.5)[53]
Trade Restrictions
Simple Mean Tariff Rate for All Products
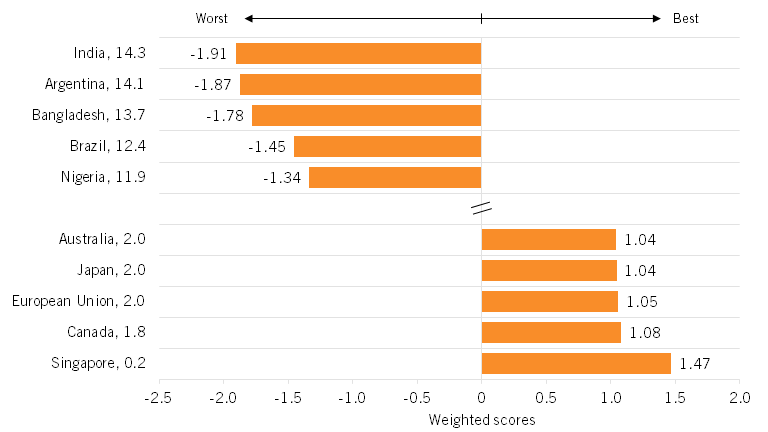
The Simple Mean Tariff Rate for All Products indicator provides a standardized score for each nation based on its unweighted average of simple mean tariff rates across all traded products for 2022, as measured by the World Bank’s World Development Indicators.[54] Countries with high simple mean tariff rates receive a low standardized score, those with moderate tariffs receive a mid-range score, and those with low or near-zero tariffs receive a high score.
This indicator is included in the index because high tariff rates create significant barriers for U.S. exports, raising costs for American businesses and reducing market access. Protectionist tariff policies can stifle competition, inflate consumer prices, and disrupt global supply chains, making it harder for U.S. firms to compete internationally. Lower-scoring countries should legitimately face more trade scrutiny from the Trump administration.
Figure 5 highlights the worst offenders: India, Argentina, Bangladesh, Brazil, and Nigeria, all of which maintain steep tariffs that inhibit U.S. exports. These nations all have simple mean tariff rates that exceed 10 percent—India has a rate of 14.3, Argentina has a 14.1 rate, and Bangladesh has a 13.7 rate—and could find themselves in the crosshairs of the Trump administration’s trade agenda. Meanwhile, Singapore and Canada exhibit some of the lowest tariff rates in the world. (See the full list of countries in the appendix, figure 17.)
Figure 5: Simple mean tariff rates for all products (raw values and weighted standardized scores; weight = 1)[55]
Non-Tariff Trade Barriers
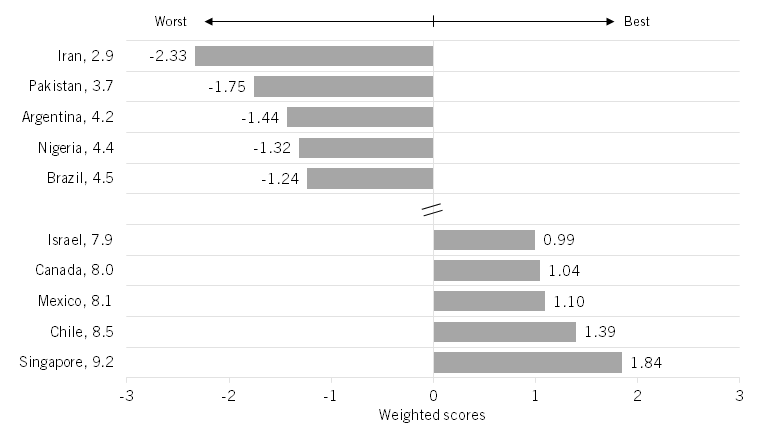
The Non-Tariff Trade Barrier indicator provides a standardized score for each nation based on the prevalence of NTBs, as measured by the Fraser Institute’s Economic Freedom of the World 2024 index.[56] Countries with extensive NTBs receive a low standardized score, those with moderate restrictions receive a mid-range score, and those with minimal barriers receive a high score.
This indicator is included in the index because NTBs limit market access for U.S. firms, increase compliance costs, and reduce U.S. firms’ competitiveness in the global market.[57] As such, under the Trump administration, countries with low scores are more likely to face countermeasures, such as tariffs, trade restrictions, or heightened regulatory scrutiny.
Figure 6 shows that Iran, Pakistan, Argentina, Nigeria, and Brazil are most likely to face trade scrutiny from the Trump administration due to their low score on this measure, which indicates that they have high trade barriers likely to harm U.S. companies. For example, Argentina requires importers to request nonautomatic import licenses on about 1,500 products and has reduced the validity of licenses from 180 days to 90 days.[58] Nigeria also employs NTBs that are detrimental to importers. For instance, it requires food, drugs, and cosmetics to be inspected but does not have the capacity to perform these inspections in a timely manner.[59] Meanwhile, Singapore and Chile employ the fewest NTBs of nations in this study and are less likely to face sanctions for this particular reason. (See the full list of countries in the appendix, figure 18.)
Figure 6: NTBs (raw values and weighted standardized scores; weight = 1)[60]
Services Trade Restrictiveness Index
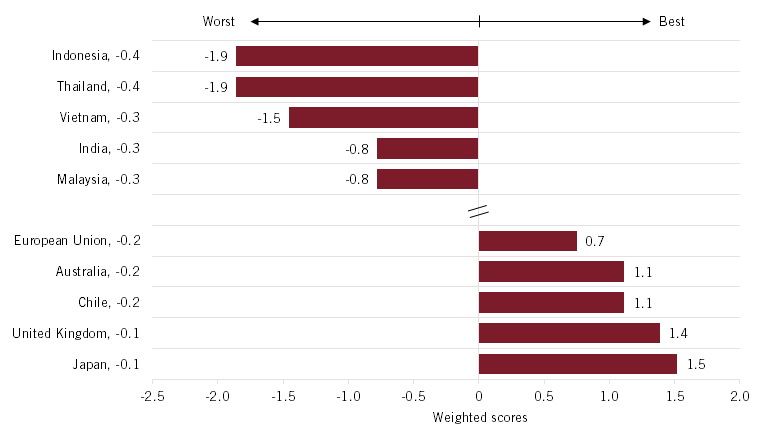
The Services Trade Restrictiveness Index indicator provides a standardized score for each nation based on the level of restrictions in its services trade sector, as measured by OECD’s Services Trade Restrictiveness Index in 2023.[61] Countries with highly restrictive services trade policies receive a low standardized score, those with moderate restrictions receive a mid-range score, and those with mostly open services trade policies receive a high score.
This indicator is included in the index because restrictive services trade policies can hinder U.S. companies operating in sectors such as finance, telecommunications, and digital services. High restrictions increase costs, limit market access, and reduce competitiveness for American firms. Moreover, they also reduce supply and increase the cost of services for U.S. consumers.
Figure 7 shows that Indonesia, Thailand, and Vietnam are most likely to face retaliatory trade actions under the Trump administration due to their low score, which indicates high restrictions on services trade that harm U.S. companies. For example, Indonesia is particularly restrictive partly due to its restrictions in legal services, accounting services, and telecommunications.[62] Meanwhile, Thailand is quite restrictive in services trade because reforms that liberalize services trade have slowed in recent years.[63] In contrast, Japan, the United Kingdom, Chile, and Australia have the most open services trade policies and are less likely to face pushback from the administration for this reason. Japan notably has a stable regulatory environment for services and has moderately liberalized its logistics and insurance sectors.[64] (See the full list of countries in the appendix, figure 19.)
Figure 7: Services Trade Restrictiveness Index (raw values and weighted standardized scores; weight = 1)[65]
Taxes and Regulations
Digital Markets Act
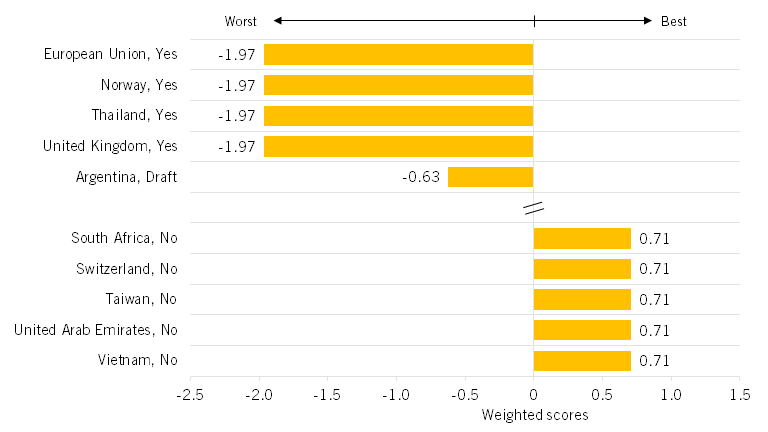
The Digital Markets Act indicator provides a standardized score for each nation based on the presence or absence of a DMA or a similar regulatory framework in a nation.[66] Countries that have implemented a DMA or comparable legislation receive a low standardized score, those now developing such regulations receive a mid-range score, and those without such laws receive a high score.
This indicator is included in the index because digital market regulations, such as the DMA, impose restrictions on large technology firms, many of which are U.S.-based. These regulations can limit firms’ revenues, restrict business practices, and increase compliance costs, potentially reducing profitability and innovation. The Trump administration should scrutinize countries that field anticompetitive DMA laws.
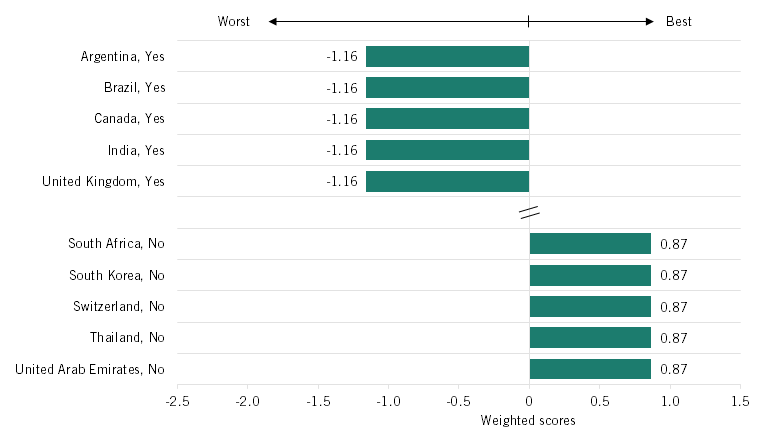
Figure 8 shows that the European Union, Norway, Thailand, and the United Kingdom are among the most likely to face retaliation from the Trump administration if targeted based on the presence of a DMA or related law. This is because these nations either have a DMA or similar law themselves or are subject to one as part of a regional entity (e.g., their EU membership.) For instance, Thailand has adopted the Platform Economy Act, legislation that represents a combination of the DMA and the DSA. Similarly, the United Kingdom has the Digital Markets, Competition, and Consumer Act of 2024, a DMA-like legislation that imposes restrictions on digital firms. Twenty nations with a standardized score of 0.7 are the least likely to face retaliation based on this measure, as they have not adopted a DMA-like law. These nations include, among others, Singapore, South Africa, Taiwan, the United Arab Emirates, and Vietnam. (See the full list of countries in the appendix, figure 20.)
Figure 8: DMA or similar law (status and weighted standardized scores; weight = 1)[67]
Digital Services Tax
The Digital Services Tax indicator provides a standardized score to each nation based on whether it imposes a DST on firms’ revenues using data from the Digital Services Taxes DST—Global Tracker and Digital Policy Alert’s Digital Services Taxes Tracker.[68] Countries that have fully implemented a DST receive a low standardized score, while those without such a tax receive a high score. This indicator is included in the index because DSTs can increase operational costs, reduce profitability, and harm U.S. technology companies’ competitiveness.
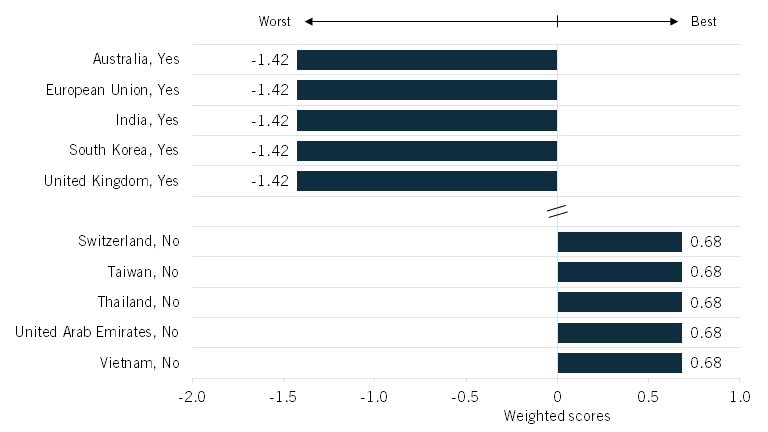
Figure 9 shows that Argentina, Brazil, Canada, India, and the United Kingdom are among the 14 countries that may face penalties by the Trump administration due to their low score, which indicates the presence of DSTs on firms. The United Kingdom is likely to face repercussions due to its 2 percent tax on marketplaces, social media platforms, and search engines that exceed an annual global sale of £500 million ($635 million) and an in-country sales threshold of £25 million ($31.8 million).[69] Canada imposes a 3 percent tax on digital service companies with more than CA$20 million of revenue from Canadian sources.[70] Similarly, India imposes a 6 percent tax on advertising and a 2 percent tax on goods and digital services.[71] Finally, 18 nations are unlikely to face penalties by the Trump administration for this reason, as they do not impose DSTs. These nations include Australia, Japan, Mexico, South Korea, and Switzerland. (See the full list of countries in the appendix, figure 21.)
Figure 9: DST (status and weighted standardized scores; weight = 1)[72]
Presence of Digital Economy Fines on U.S. Companies
The Presence of Digital Economy Fines on U.S. Companies indicator provides a standardized score that reflects whether U.S. firms have been subjected to digital economy-related fines by foreign governments, as tracked by the Digital Policy Alert’s Activity Tracker.[73] Countries that have imposed a fine on U.S. companies receive the lowest scores, while those with no such penalties receive higher scores. ITIF includes this indicator because it highlights regulatory environments that may disproportionately target U.S. firms, harming their competitiveness in the global economy.
Figure 10 lists 5 of the 10 nations that are most susceptible to Trump retaliatory measures due to the presence of digital economy fines on U.S.-based companies. These nations include Australia, several European Union nations, India, South Korea, and the United Kingdom. For instance, Argentina’s Agency for Access to Public Information fined Google 180,000 Argentine pesos for refusing to give an individual access to her personal data.[74] Meanwhile, the Reserve Bank of India fined Amazon Pay 30.6 million Indian rupees for failing to comply with “Master Directions on Prepaid Payment Instruments” and the “Master Direction – Know Your Customer Direction” provisions.[75] In contrast, 23 nations, including Canada, Japan, Mexico, Switzerland, Taiwan, Thailand, and Vietnam are unlikely to face retaliatory measures. (See the full list of countries in the appendix, figure 22.)
Figure 10: Presence of digital economy fines on U.S.-based companies (status and weighted standardized scores; weight = 1)[76]
Extent of Pharmaceutical Price Controls
The Extent of Pharmaceutical Price Controls indicator provides a standardized score for each nation based on its ranking in ITIF’s report “Contributors and Detractors: Ranking Countries’ Impact on Global Innovation” and other outside sources.[77] Nations with a low standardized score exhibit a high degree of pharmaceutical price controls, those with a mid-range score have a moderate level of controls, and those with a high score impose minimal price controls.
This indicator is included in the index because stringent pharmaceutical price controls reduce revenue for U.S. pharmaceutical companies, limiting their ability to invest in research and development (R&D). This, in turn, can hinder the development of next-generation drugs, potentially impacting public health in the United States. Indeed, as ITIF explained, “Pharmaceutical firms view current drug price regulations as likely to continue, reducing their potential profits while disincentivizing their investment in R&D.”[78] As a result, countries with low scores may be more likely to face retaliatory measures under the Trump administration.
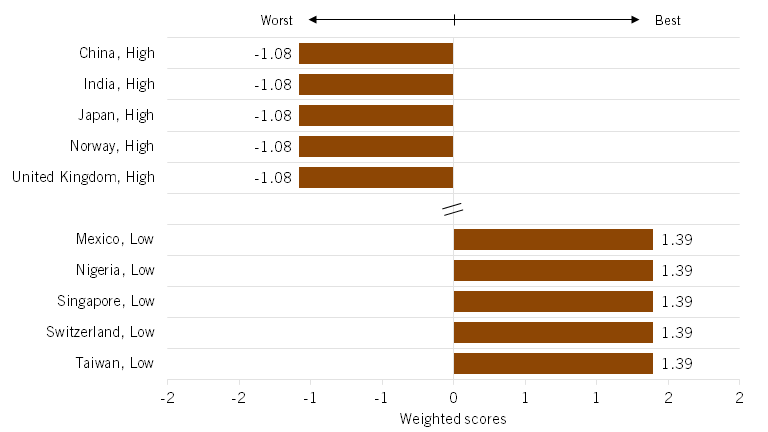
Figure 11 shows that China, India, Japan, Norway, and the United Kingdom are among the 13 nations most likely to face retaliatory measures from the Trump administration if it bases them on the extent of a country’s pharmaceutical price controls. Just like in Europe, Japan’s extensive drug price controls have decimated the country’s biopharmaceutical industry, as Japan’s share of global value added in the pharmaceutical industry declined by 70 percent, from 18.5 to 5.5 percent, from 1995 to 2018.[79] Moreover, an ITIF report finds that, after adjusting for GDP per capita, prescription drug prices in the United Kingdom are 53 percent of those in the United States. In other words, for every $100 spent on prescription drugs in the United States, the United Kingdom spent only $53.[80] Meanwhile, Taiwan, Switzerland, Singapore, and six other nations are least likely to face trade scrutiny for this reason, as their pharmaceutical price controls are relatively minimal. (See the full list of countries in the appendix, figure 23.)
Figure 11: Extent of pharmaceutical price controls (status and weighted standardized scores; weight = 1)[81]
Antitrust Fines
The Antitrust Fines indicator provides a standardized score for each nation based on the presence of antitrust fines imposed on corporations. Countries with no antitrust fines receive a high standardized score while those that have imposed fines receive a low one.
This indicator is included in the index because aggressive antitrust enforcement can create regulatory uncertainty, increase compliance costs, and disproportionately impact large U.S.-based firms, impeding U.S. firms’ competitiveness. High antitrust fines can be viewed as a tool of protectionism, targeting successful foreign companies while shielding domestic competitors.
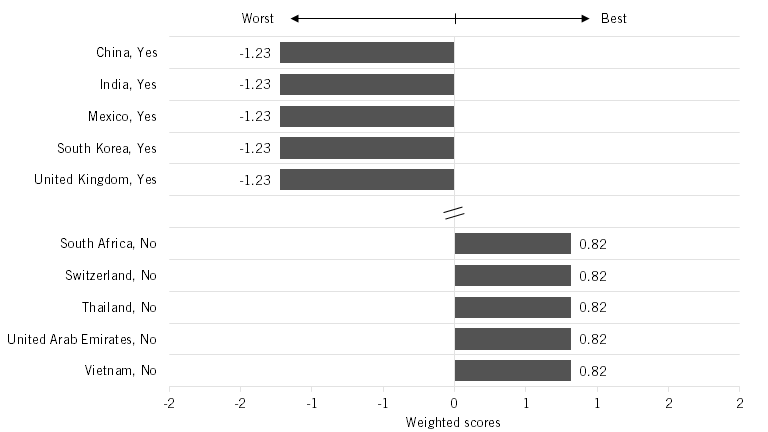
Figure 12 shows that China, India, Mexico, South Korea, and the United Kingdom are among the 12 worst offenders, scoring poorly at -1.2 due to the presence of antitrust fines. China stands out as one of the worst offenders on this indicator, marred by its unfounded fining of Qualcomm for $975 million in 2015 and its subsequent baseless announcements of antitrust investigations against Google and NVIDIA.[82] Elsewhere, Australia has fined Google over what it deems misrepresentation of consumer data collection.[83] The maximum fine per violation is now the greater of $50 million or 30 percent of a company’s Australian turnover during the infringement period. In January 2025, Apple faced a £1.5 billion ($1.9 billion) class action lawsuit in the United Kingdom for allegedly overcharging software developers through the App Store.[84] Meanwhile, the Mexican competition authority has fined the Mexican unit of Walmart, Walmex, for alleged anticompetitive practices.[85] It has also fined HP in the past for not obtaining appropriate consent for a merger with Plantronics.[86]
Meanwhile, 20 nations score well at 0.8, signaling a more business-friendly approach. These nations include Canada, Brazil, and Japan in addition to the countries listed below. The EU, known for its stringent competition policies and major fines on U.S. tech giants, stands in the middle range with a score of -0.4. (See the full list of countries in the appendix, figure 24.)
Figure 12: Presence of antitrust fines (status and weighted standardized scores; weight = 1)[87]
Intellectual Property
USTR Special 301 Watch List
The 2024 USTR Special 301 Watch List indicator provides a standardized score for each nation based on its inclusion in USTR’s Special 301 Report, which catalogs the nations that most extensively infringe on the interests of U.S. IP rightsholders.[88] Countries on USTR’s Priority Watch List (i.e., the most intensive IP-infringing countries) receive the lowest score, those on the Watch List receive a mid-range score, and those not listed in the Special 301 report received the highest score. ITIF includes this indicator because the Special 301 Report assesses the adequacy and effectiveness of U.S. trading partners’ protection and enforcement of IP rights. Nations with lower scores generally exhibit weaker IP protections and are therefore more susceptible to facing retaliatory measures from the Trump administration, as inadequate IP policies or enforcement increases the risk of U.S. IP theft.
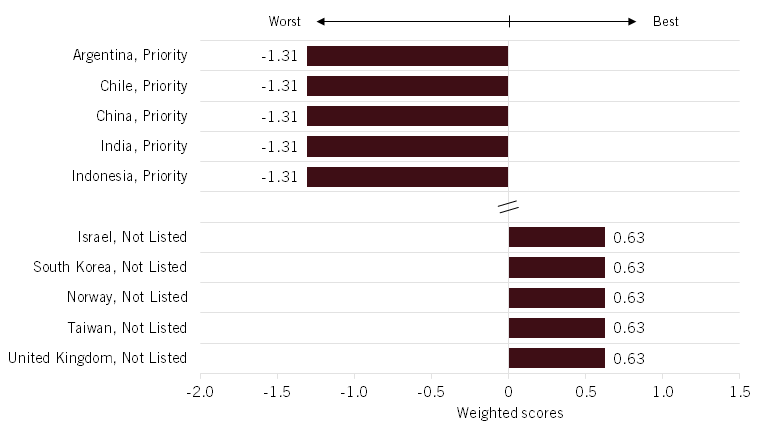
Figure 13 enumerates nations’ scores from lowest to highest. Argentina, Chile, China, India, and Indonesia would be most likely to face retaliatory measures from the Trump administration if their actions are based on infringement of U.S. IP rights. China represents a particularly likely target, as it is the world’s most significant perpetrator of IP theft. Moreover, the nation has not addressed U.S. concerns over forced technology transfers despite committing to the removal of those policies.[89] Meanwhile, India would also be a prime target for Trump administration scrutiny because of its presence on the priority watch list. The nations with a score of 0.6, including Norway, Israel, Taiwan, and the United Kingdom, would be least likely to face retaliatory measures for this reason, as they were not listed on the 2024 Special 301 watch list. (See the full list of countries in the appendix, figure 25.)
Figure 13: 2024 USTR special 301 watch list (status and weighted standardized scores; weight = 0.75)[90]
International IP Index
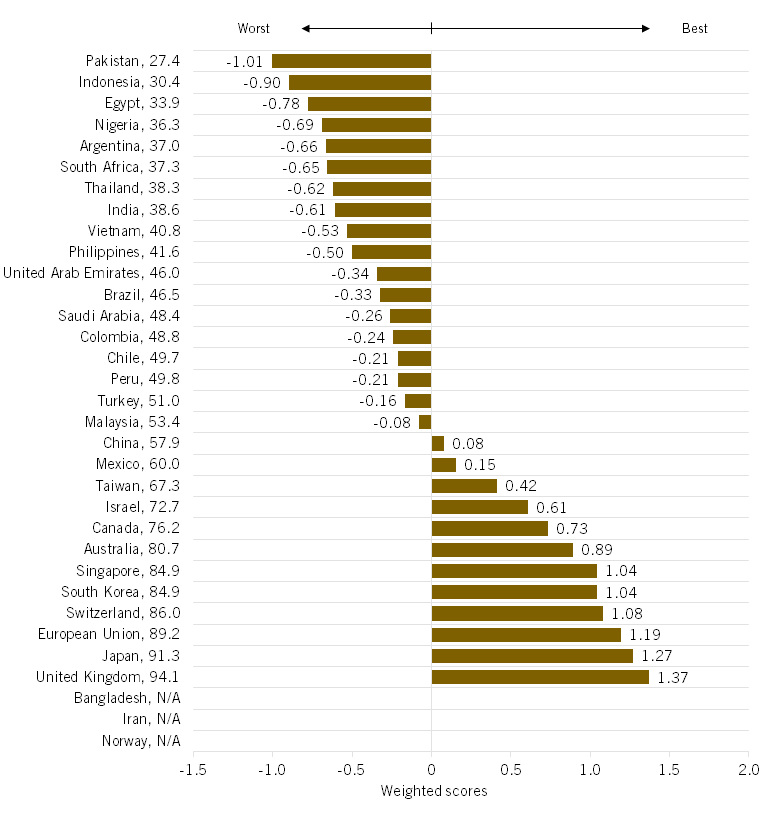
The International IP Index indicator provides a standardized score for each nation based on the strength of its IP rights framework, as measured by the U.S. Chamber of Commerce Global Innovation Policy Center’s International IP Index 2024, Twelfth Edition.[91] Countries with strong IP protections received a high standardized score, those with moderate protections received a mid-range score, and those with weak or inadequate protections received a low score.
This indicator is included in the index because robust IP protections benefit U.S. companies—particularly in pharmaceuticals, technology, and entertainment—by safeguarding patents, copyrights, trademarks, trade secrets, and other forms of IP. Weak IP protections can increase counterfeiting, piracy, and unfair competition, harming U.S. businesses. Under the Trump administration, countries with low scores may be more likely to face countermeasures such as trade sanctions, tariffs, or pressure to strengthen their IP environments.
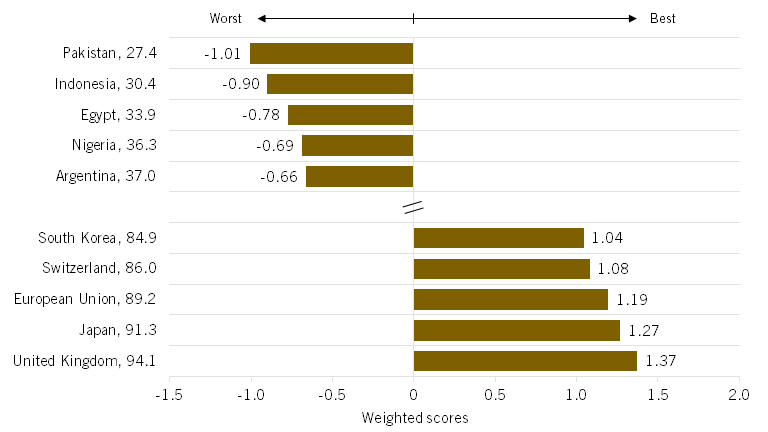
Table 13 shows that Pakistan, Indonesia, and Egypt are most likely to face retaliatory trade sanctions by the Trump administration due to their low scores, which indicate weak IP protections that likely harm U.S. companies. Indeed, according to the International IP Index, Pakistan ranks as the fifth-worst nation in terms of patent rights and second worst for copyright protections.[92] Meanwhile, Egypt was the sixth-worst nation for copyright-related rights and trademark-related rights.[93] In contrast, the United Kingdom, Japan, and the European Union have the strongest IP protections and are unlikely to face pushback from the administration for this reason. Indeed, the United Kingdom ranked in the top 10 nations with the best patent rights, copyright-related rights, and trademark-related rights.[94] (See the full list of countries in the appendix, figure 26.)
Figure 14: U.S. Chamber of Commerce’s International IP Index (raw values and weighted standardized scores; weight = 0.75)[95]
Policy Recommendations
President Trump is certainly correct that, for too long, too many nations have been taking advantage of unbalanced trade relationships with the United States. In too many cases, the United States has extended lower tariffs, imposed fewer NTBs, or offered a more protective environment for IP rights than has a partner trade nation. The United States has also tolerated wildly unbalanced trade flows with nations such as China for far too long. Reciprocal and equitable trade relationships with partner nations are certainly a compelling vision, and the Trump administration is certainly justified in exploring policy measures to make that a reality.
That said, tariffs are not the unalloyed good the Trump administration appears to believe they are. The Trump administration should certainly not be implementing a universal tariff on all nations. Likewise, blanket, global sectoral- or technology-based tariffs—such as the tariffs “in the neighborhood of 25 percent” on imported vehicles, pharmaceuticals, and semiconductors that president Trump proposed on February 18, 2025—are unjustified and would inflict tremendous harm on the U.S. (and global) economy.[96] Tariffs on intermediate products, such as the 25 percent tariffs president Trump has proposed on steel and aluminum products, are also certain to be counterproductive and deleterious to the U.S. economy.[97]
In the opening days of his administration, Trump threatened 25 percent tariffs on Canada and Mexico (and 10 percent on China) to create negotiating leverage to draw stronger action from those nations to dramatically reduce the flow of illegal immigration and fentanyl into the United States. On March 4, 2025, president Trump proceeded with implementation of those 25 percent tariffs on Canada and Mexico (at the 10 percent level for Canadian energy imports) and 20 percent for China.[98] The president has similarly threatened tariffs on EU nations to win concessions from them regarding several of the unfair trade practices documented in this report. It’s one thing for the Trump administration to threaten tariffs as a negotiating tool, but when partner nations respond by meeting the Trump administration’s demands—as, for instance, Canada and Mexico clearly have with their steps to enhance border enforcement and interdict drugs—then the Trump administration should take tariffs, or the threat thereof, off the table. This is certainly the case with Canada and Mexico, where the Trump administration’s proposed tariffs would also place the United States in clear contravention of its U.S.-Canada-Mexico (USMCA) free-trade agreement (FTA) commitments.
Reciprocal tariff relations among nations make the most sense when those tariffs are at zero.
China stands in a different category from virtually all the other countries assessed in this report. That’s true first because China pursues fundamentally mercantilist trade and economic practices—what ITIF has identified as “power trade”—in a manner distinct from most of the other largely market-based, if occasionally protectionist, countries in this report.[99] Second, for this reason, China is unlikely to modify its fundamentally mercantilist approach in response to Trump administration pressure, whereas other countries may respond by dropping or modifying some of their unfair trade practices in response to such pressure. And while tariffs on China may well be justified due to its litany of unfair trade practices ranging from currency manipulation to massive industrial subsidization to rampant IP theft, tariffs alone will be insufficient to address the China challenge.[100] Rather, as ITIF has written, America must pursue a holistic strategy to turbocharge its own innovation-based economic growth while marshalling an allied coalition that pressures China to stop rigging markets and start competing on fair terms.[101] Effectively dealing with the China challenge will require a much more sophisticated set of tools than tariffs alone.
President Trump’s preoccupation with tariffs would be a fine thing if it were focused on eliminating them as broadly as possible, not on introducing new ones on trade partners across the world. Yet, his instinct for reciprocal trade relations is correct. For that reason, the Trump administration should make it a major initiative to expand the Information Technology Agreement (ITA), a plurilateral WTO agreement that commits member nations to eliminate tariffs on trade across hundreds of information and communications technology products. Similarly, the 1994 Agreement on Trade in Pharmaceutical Products—more commonly referred to as the “zero-for-zero initiative”—commits Canada, the European Union and its 28 member states, Japan, Norway, Switzerland, the United States, and Macao (China) to reciprocal tariff elimination for pharmaceutical products and for chemical intermediates used in the production of pharmaceuticals.[102] As noted, if the Trump administration had real ambition here, it would roll up the ITA, the Pharmaceutical Goods Agreement, and the proposed Environmental Goods Agreement into an Innovation Technology Agreement that pursued zero tariffs on goods and their component inputs across all high-tech industries for participating nations. Indeed, reciprocal tariff relations among nations make the most sense when those tariffs are at zero.
The Trump administration should also ensure that other nations pay their fair share for innovative medicines.[103] As H.E. Frech et al. have suggested, for example, “US officials could raise these issues at international negotiations and advocate for higher prices than presently set in high-income ROW countries. A multi-country agreement in this direction would represent a serious effort to support improved world health.”[104] In the absence of that, the United States should file a WTO case based on the complaint that price controls on the pharmaceutical sector violate IP rights because they enable international arbitrage through parallel trading.
The U.S. Constitution empowers Congress to set import tariffs, although Congress has largely delegated that power to the executive branch.[105] Still, Congress retains an essential voice in guiding U.S. tariff and trade policy. The Trump administration is invoking the International Emergency Economic Powers Act (IEEPA) as the basis for many of the tariffs it has proposed, including those on Canada and Mexico. But Congress intended IEEPA, originally enacted in 1977, to be used only in times of genuine national emergency—such as an actual war with the Soviet Union—and certainly not as a basis for tariffs on FTA partners or as a catchall justification for blanket tariffs of the type the Trump administration has proposed.
As such, Congress should pass the Stopping Tariffs on Allies and Bolstering Legislative Exercise of Trade Policy Act (STABLE), proposed by Tim Kaine (D-VA) and Senators Chris Coons (D-DE), which would institute a requirement of congressional approval before a president could impose new tariffs on U.S. allies and FTA partners.[106]
Congress could undertake some additional productive legislation. Congress should charge USTR with working with willing allied partners to develop a full “China Bill of Particulars” report. As this report documents, China is the world’s most significant trade scofflaw. Accordingly, the United States needs to spearhead development of a collaborative report with allies that comprehensively documents the extent of Chinese mercantilist unfair trade and domestic economic and technology policies. Many of these have been noted, albeit in a piecemeal manner. Although it should also be noted that all foreign-nation exporters into the EU would pay a similar VAT.
Congress should amend, and the administration should use, Section 301 of the Trade Act of 1974 to target digital trade issues. Congress should amend a key U.S. trade defense tool—the Trade Act of 1974—to respond to the digital barriers central to modern trade. The law should detail the responsible agency and process (i.e., the actions, such as licensing, certification, or legal judgment) whereby the administration can impose specific retaliatory measures on a foreign service provider. The administration also should use Section 301 of the Trade Act to initiate an investigation of Europe’s DMA, which has been used to target and penalize U.S. tech firms. Section 301 can be used to enact tariffs, taxes, or restrictions on EU digital service companies doing business in the United States.[107]
Congress should amend the Internal Revenue Code to allow authorities to impose mirror taxes on countries imposing Digital Service Taxes on U.S. firms. Section 891 of the Internal Revenue Code allows the president to retaliate against foreign discriminatory or extraterritorial taxes by taxing foreign citizens and firms. Congress could adapt this code by mandating a tax on the global revenues of large firms based in countries imposing DSTs, such as Italy and France, as a retaliatory measure against the discriminatory taxes placed on American tech firms. These mirror taxes could be legislated to expire upon either of two events: agreed international rules that subject tech giants to taxation in countries reached by their platforms or, in the case of an individual country, repeal of its own DST tax.[108]
Congress should require U.S. aid to be contingent on countries not engaging in digital protectionism. Since the end of WWII, U.S. foreign aid programs have ignored foreign mercantilist practices that harm U.S. techno-economic interests, and that is no longer acceptable. Congress, with its oversight of various federal aid programs, should investigate and require that these agencies limit funding to countries engaging in digital mercantilism or IP theft. Specifically, development aid through the InterAmerican Development Bank or the World Bank should be contingent on nations limiting digital protectionism wherever possible.[109]
Conclusion
The Trump administration has made it clear to global trade partners that sustained unfair trade practices deleteriously impacting U.S. enterprises and industries will no longer be tolerated. The increasing global proliferation of mercantilist practices certainly provides the Trump administration with a “target-rich” environment of trade scofflaws. But the administration should focus the most attention on countries where U.S. industries face the worst trade distortions and imbalances, and where action can most significantly advance U.S. economic interests. As such, this report shines a light on the countries—China, India, and the European Union—that the Trump administration should first prioritize in rebalancing U.S. trade and economic interests.
Appendix 1: Methodology
The country index scores were calculated by taking the raw score of each of the 11 indicators for the top 48 nations with the highest GDP. The raw scores originated from various sources, including the Chamber of Commerce, the U.S. Census Bureau, and the World Bank. (See each indicator for specific details.) The mean and standard deviations were then calculated using each indicator’s raw score before the raw scores of each nation were standardized to find a z-score. The z-scores indicate the number of standard deviations an indicator’s raw score is compared with its mean value. The z-scores for each indicator were then weighted. Finally, the weighted z-scores were summed together to obtain an overall score for each nation.
The 15 European Union nations in the top 48 nations with the highest GDP were combined into a collective country variable of European Union. The European Union variable was calculated by taking the share of GDP each nation contributed to the overall European Union’s GDP and then weighing the indicator score for each nation by those weights. Finally, the weighted indicator scores for these nations were summed together. As noted, Russia was excluded from the report on the amount of trivial two-way trade (just $3.5 billion in 2024) occurring between Russia and the United States in the wake of the Russia-Ukraine war.
ITIF weighed each indicator’s standardized scores to reflect their importance. The USTR 301 Watch List and International IP Index indicators had a weight of 0.75. The extent of pharmaceutical price controls, DMA law, DST, NTBs, Services Trade Restrictiveness Index, simple mean tariff rates for all products, antitrust fines, and digital economy fines on U.S.-based companies (noncompetition) indicators had a weight of 1. The 2023 trade balance of goods and information services had a weight of 3.5. (See table 1.)
Table 1: Indicator weights in ITIF’s Trade Imbalance Index
|
Indicator |
Year |
Weight |
|
USTR 301 Watch List |
2024 |
0.75 |
|
International IP Index |
2024 |
0.75 |
|
Extent of Pharmaceutical Price Controls |
2016 |
1.00 |
|
DMA Law |
2025 |
1.00 |
|
Digital Services Tax |
2024 |
1.00 |
|
Non-Tariff Trade Barriers |
2022 |
1.00 |
|
Services Trade Restrictiveness Index, Avg. Across Sectors |
2023 |
1.00 |
|
Simple Mean, Tariff Rate, All Products |
2022 |
1.00 |
|
Antitrust Fines |
2025 |
1.00 |
|
Digital economy fines on US-based companies (noncompetition) |
2019–2025 |
1.00 |
|
Trade Balance in Goods and Information Services |
2023 |
3.50 |
Appendix 2: Detailed Indicator Values and Scores for All Countries
Figure 15: Overall scores in ITIF’s Trade Imbalance Index
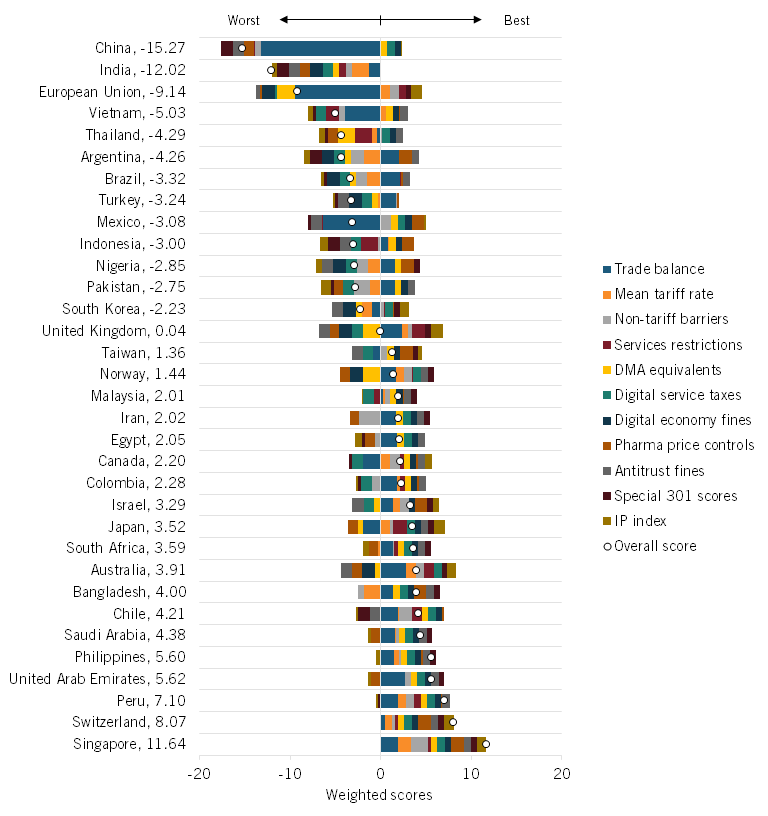
Figure 16: Trade balance of goods and IT services (2023) and weighted standardized scores (weight = 3.5)
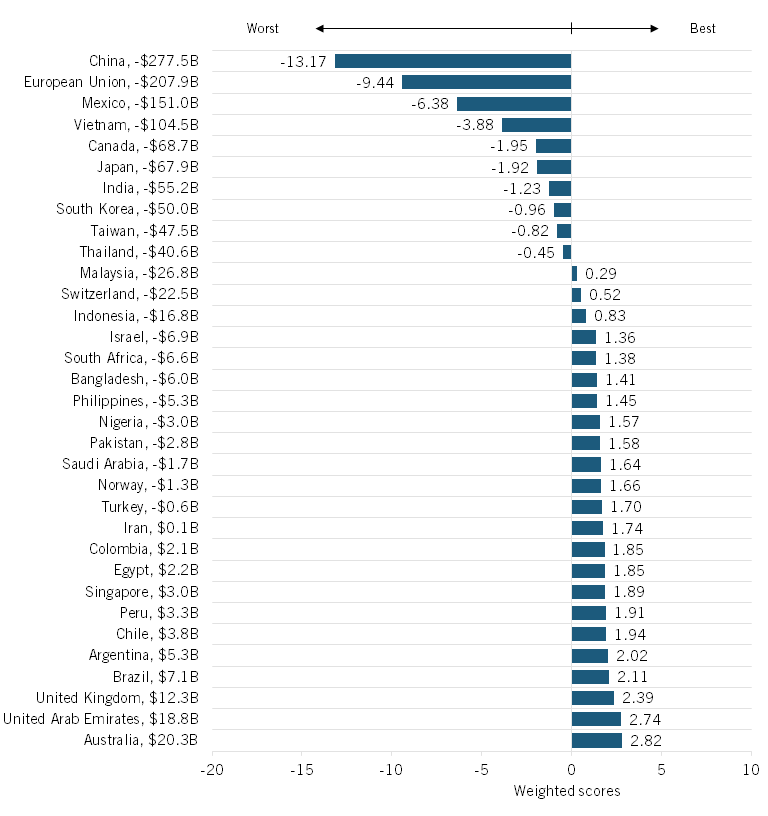
Figure 17: Simple mean tariff rates for all products (raw values and weighted standardized scores; weight = 1)
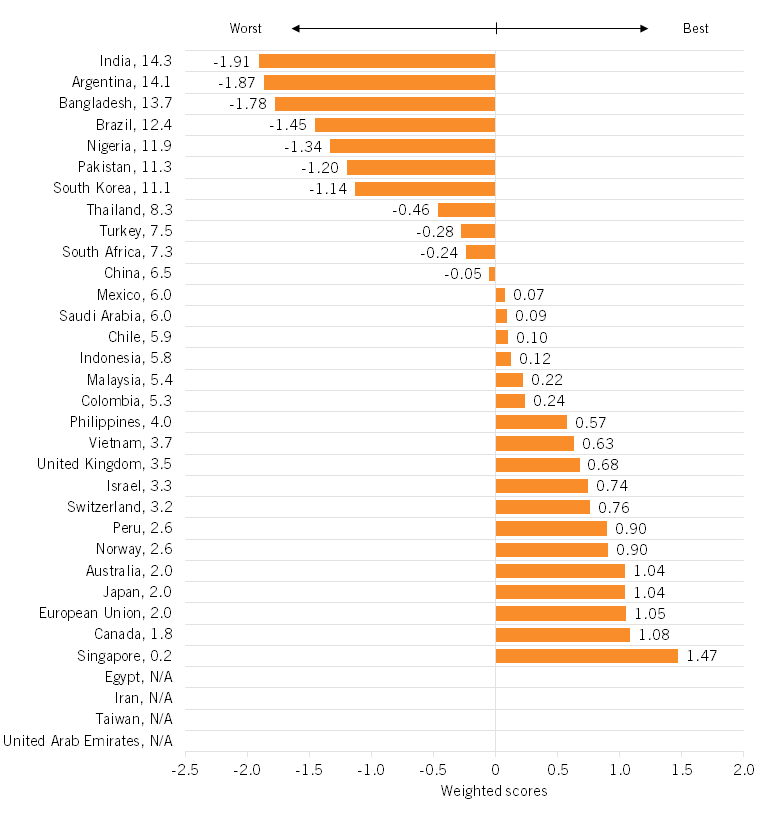
Figure 18: NTBs (raw values and weighted standardized scores; weight = 1)
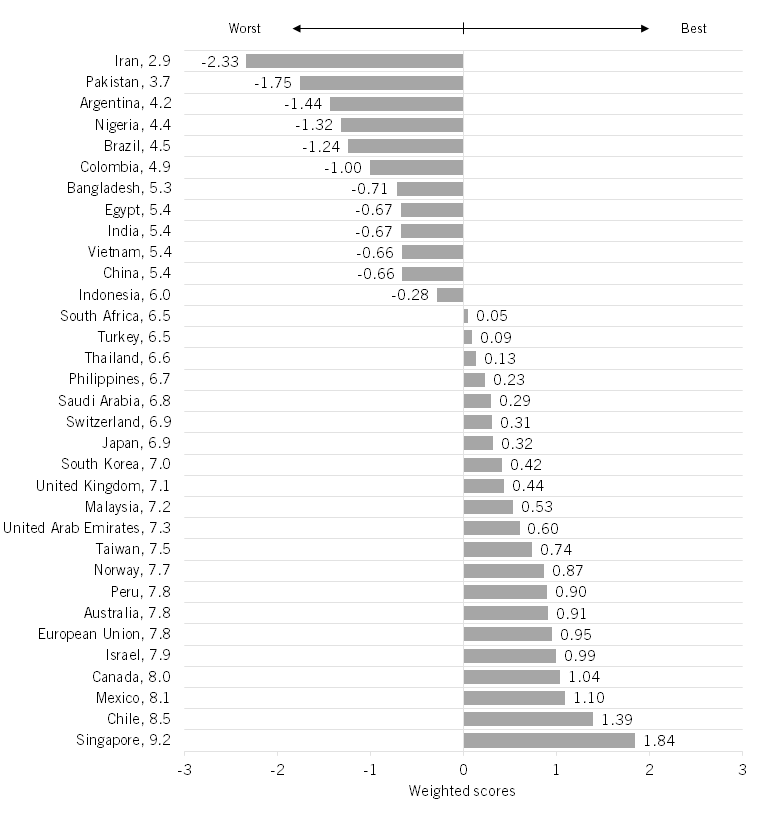
Figure 19: Services Trade Restrictiveness Index (raw values and weighted standardized scores; weight = 1)
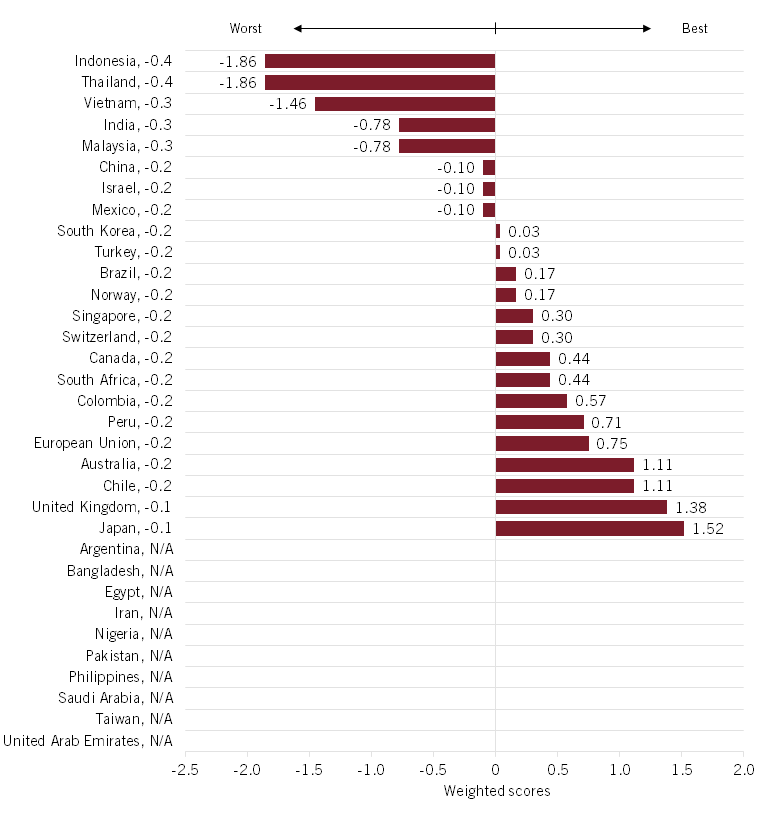
Figure 20: DMA or similar law (status and weighted standardized scores; weight = 1)
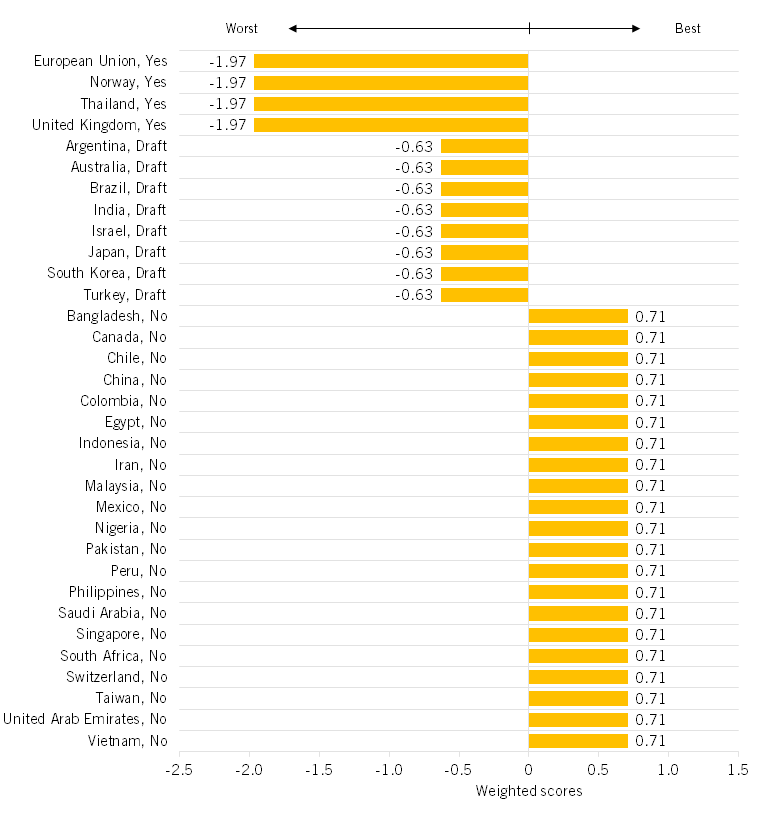
Figure 21: DST (status and weighted standardized scores; weight = 1)
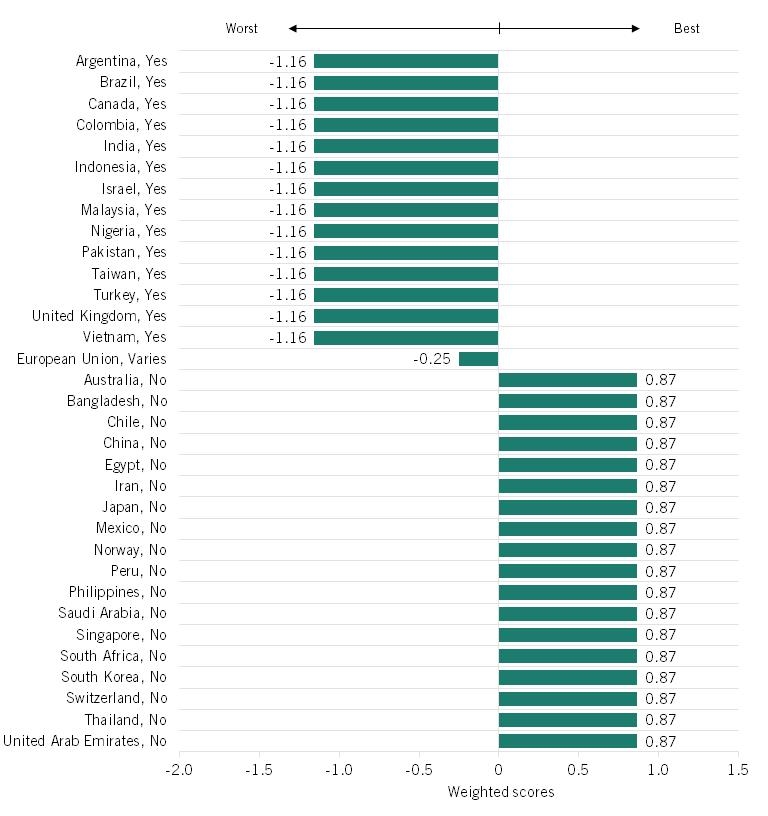
Figure 22: Presence of digital economy fines on U.S.-based companies (status and weighted standardized scores; weight = 1)
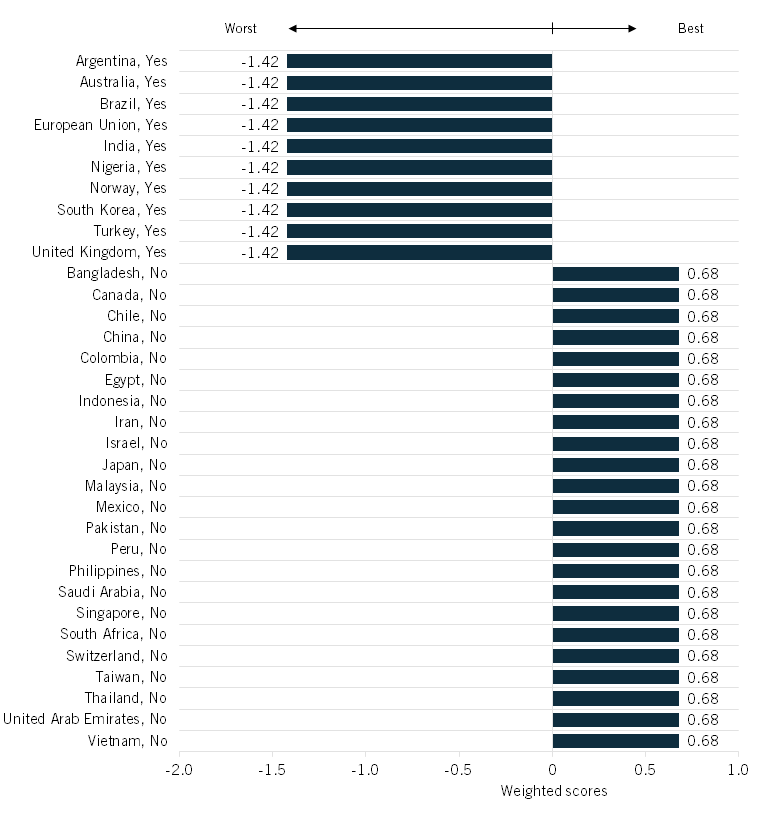
Figure 23: Extent of pharmaceutical price controls (status and weighted standardized scores; weight = 1)
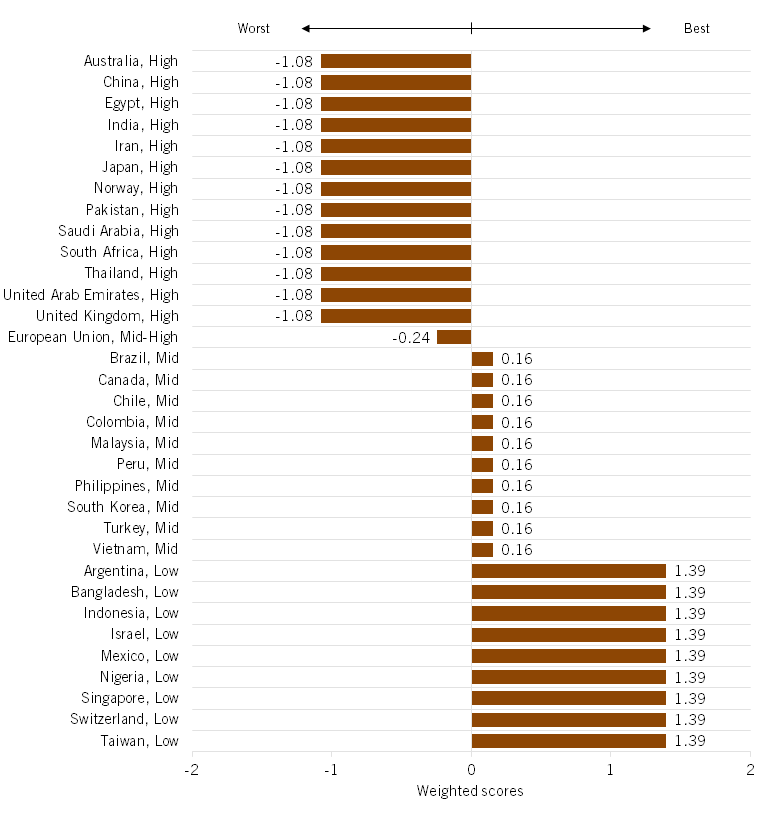
Figure 24: Presence of antitrust fines (status and weighted standardized scores; weight = 1)
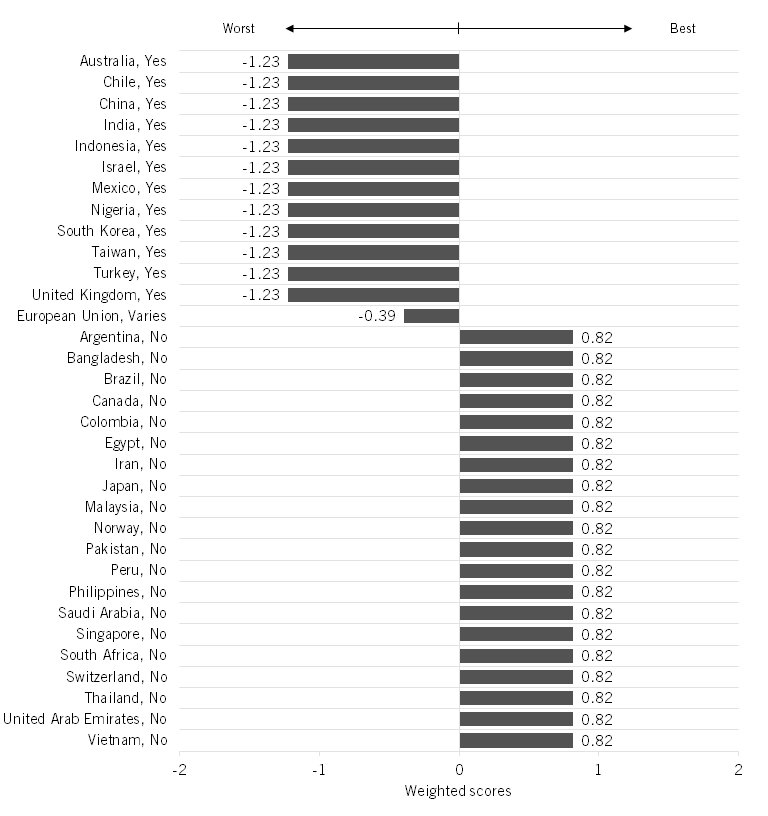
Figure 25: 2024 USTR special 301 watch list (status and weighted standardized scores; weight = 0.75)
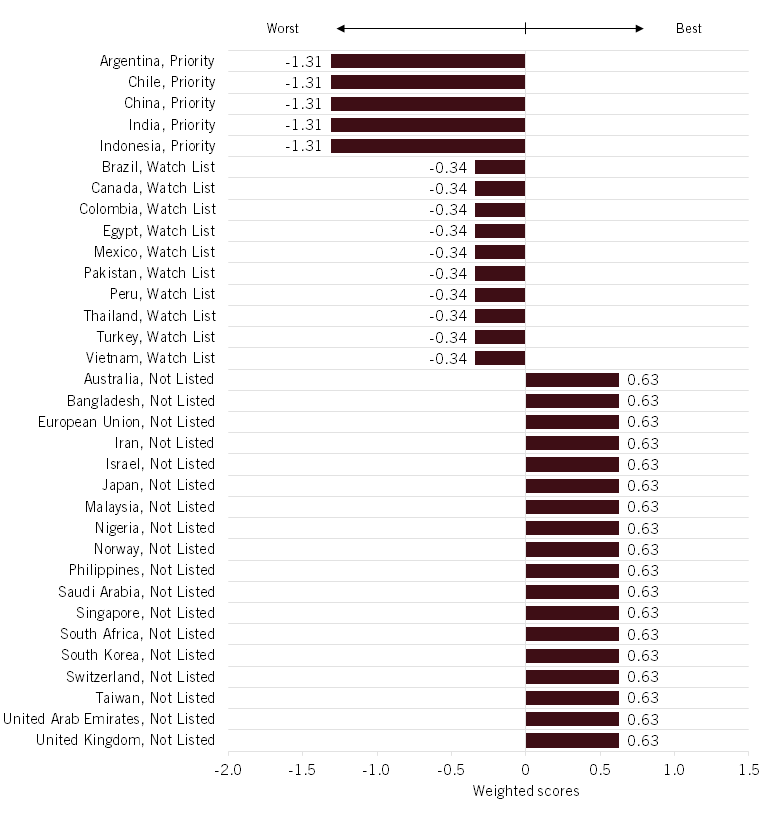
Figure 26: U.S. Chamber of Commerce’s International IP Index (raw values and weighted standardized scores; weight = 0.75)
Acknowledgments
The authors would like to thank Giorgio Castiglia and Lilla Nóra Kiss for their feedback and input on this report. Any errors or omissions are the authors’ own.
About the Authors
Stephen Ezell is vice president for global innovation policy at the Information Technology and Innovation Foundation (ITIF) and director of ITIF’s Center for Life Sciences Innovation. He also leads the Global Trade and Innovation Policy Alliance. His areas of expertise include science and technology policy, international competitiveness, trade, and manufacturing.
Trelysa Long is a policy analyst at ITIF. She was previously an economic policy intern with the U.S. Chamber of Commerce. She earned her bachelor’s degree in economics and political science from the University of California, Irvine.
Dr. Robert D. Atkinson (@RobAtkinsonITIF) is the founder and president of ITIF. His books include Technology Fears and Scapegoats: 40 Myths About Privacy, Jobs, AI and Today’s Innovation Economy (Palgrave McMillian, 2024), Big Is Beautiful: Debunking the Myth of Small Business (MIT, 2018), Innovation Economics: The Race for Global Advantage (Yale, 2012), Supply-Side Follies: Why Conservative Economics Fails, Liberal Economics Falters, and Innovation Economics Is the Answer (Rowman Littlefield, 2007), and The Past and Future of America’s Economy: Long Waves of Innovation That Power Cycles of Growth (Edward Elgar, 2005). He holds a Ph.D. in city and regional planning from the University of North Carolina, Chapel Hill.
About ITIF
The Information Technology and Innovation Foundation (ITIF) is an independent 501(c)(3) nonprofit, nonpartisan research and educational institute that has been recognized repeatedly as the world’s leading think tank for science and technology policy. Its mission is to formulate, evaluate, and promote policy solutions that accelerate innovation and boost productivity to spur growth, opportunity, and progress. For more information, visit itif.org/about.
Endnotes
[1]. “Appeasing Trump, for now,” The Economist, February 8, 2025, https://www.economist.com/international/2025/02/04/allies-will-not-appease-donald-trump-for-ever.
[2]. The White House, “America First Trade Policy,” January 20, 2025, https://www.whitehouse.gov/presidential-actions/2025/01/america-first-trade-policy/.
[3]. Caleb Foote and Stephen Ezell, “The 2019 Global Mercantilist Index: Ranking Nations’ Distortive Trade Policies” (ITIF, November 2019), https://itif.org/publications/2019/11/18/2019-global-mercantilist-index-ranking-nations-distortive-trade-policies/.
[4]. Note that Russia was excluded from this analysis because trade between the United States and Russia has greatly diminished in the aftermath of the Russia-Ukraine war. In fact, in 2024, U.S. total goods trade with Russia was estimated at just $3.5 billion. United States Trade Representative’s Office (USTR), “Russia,” https://ustr.gov/countries-regions/europe-middle-east/russia-and-eurasia/russia.
[5]. United States Census Bureau, “USA Trade” (imports and exports in 2023, accessed January 2025), https://usatrade.census.gov/.
[6]. World Bank, “World Development Indicators” (Simple Mean, Tariff Rate, All Products, accessed January 2025), https://databank.worldbank.org/source/world-development-indicators; USTR, “2024 National Trade Estimate Report on Foreign Trade Barriers” (USTR, 2024), https://ustr.gov/sites/default/files/2024%20NTE%20Report_1.pdf; Organization for Economic Co-operation and Development (OECD), “Service Trade Restrictiveness Index,” https://www.oecd.org/en/topics/sub-issues/services-trade-restrictiveness-index.html.
[7]. Stephen Ezell, Adams Nager, and Robert Atkinson, “Contributors and Detractors: Ranking Countries’ Impact on Globalization” (ITIF, January 2016), https://www2.itif.org/2016-contributors-and-detractors.pdf; Jacinta Caragher, “Digital Services Taxes DST – global tracker,” VAT Calc, November 14, 2024, https://www.vatcalc.com/global/digital-services-taxes-dst-global-tracker/; Digital Policy Alert, “Digital Services Tax,” https://digitalpolicyalert.org/threads/Digital-Services-Taxes; James Gwartney et al., “Canadians have less economic freedom today than they did in late-1970s due partly to growth of government” (Fraser Institute, October 16, 2024), https://www.fraserinstitute.org/studies/economic-freedom-of-the-world-2024-annual-report.
[8]. USTR, “2024 Special 301 Report” (USTR, 2014), https://ustr.gov/sites/default/files/2024%20Special%20301%20Report.pdf; U.S. Chamber of Commerce Global Innovation Policy Center (GIPC), “International IP Index 2024 Twelfth Edition” (GIPC, 2024), https://www.uschamber.com/assets/documents/GIPC_IPIndex2024_Full-Report_v4.pdf.
[9]. These 15 nations include Germany, France, Italy, Spain, the Netherlands, Poland, Belgium, Sweden, Ireland, Austria, Denmark, Romania, Czech Republic, Finland, and Portugal.
[10]. Stephen Ezell, “False Promises II: The Continuing Gap Between China’s WTO Commitments and Its Practices” (ITIF, July 2021), https://itif.org/publications/2021/07/26/false-promises-ii-continuing-gap-between-chinas-wto-commitments-and-its/.
[11]. United States Census Bureau, “Trade in Goods with China,” accessed February 10, 2025, https://www.census.gov/foreign-trade/balance/c5700.html.
[12]. Keith Bradsher, “China’s Trade Surplus Reaches a Record of Nearly $1 Trillion,” The New York Times, January 12, 2025, https://www.nytimes.com/2025/01/12/business/china-trade-surplus.html.
[13]. USTR, “2024 Special 301 Report,” 44.
[14]. The Commission on the Theft of American Intellectual Property, “Update to the IP Commission Report: The Theft of American Intellectual Property: Reassessments of the Challenge and United States Policy” (National Bureau of Asian Research, 2017), https://www.nbr.org/wp-content/uploads/pdfs/publications/IP_Commission_Report_Update.pdf.
[15]. Eric Rosenbaum, “1 in 5 corporations say China has stolen their IP within the last year: CNBC CFO Survey,” CNBC, March 1, 2019, https://www.cnbc.com/2019/02/28/1-in-5-companies-say-china-stole-their-ip-within-the-last-year-cnbc.html.
[16]. Robert Atkinson, “China Is Rapidly Becoming a Leading Innovator in Advanced Industries” (ITIF, September 2024), https://itif.org/publications/2024/09/16/china-is-rapidly-becoming-a-leading-innovator-in-advanced-industries/.
[17]. USTR, “2024 Special 301 Report,” 46.
[18]. Nigel Cory, “Cross-Border Data Flows: Where Are the Barriers, and What Do They Cost?” (ITIF, May 2017), https://itif.org/publications/2017/05/01/cross-border-data-flows-where-are-barriers-and-what-do-they-cost.
[19]. Liza Lin and Raffaele Huang, “China’s Strategy in Trade War: Threaten U.S. Tech Companies,” The Wall Street Journal, February 10, 2025, https://www.wsj.com/tech/china-trade-war-us-tech-03578671?mod=hp_lead_pos4; Matthew Miller and Michael Martina, “Exclusive: Qualcomm nears $1 billion deal resolving China antitrust dispute,” Reuters, February 9, 2015, https://www.reuters.com/article/business/exclusive-qualcomm-nears-1-billion-deal-resolving-china-antitrust-dispute-idUSKBN0LD0WS/.
[20]. Sandra Barbosu, “How Innovative Is China in Biotechnology?” (ITIF, July 2024), https://itif.org/publications/2024/07/30/how-innovative-is-china-in-biotechnology/.
[21]. Liza Lin, “China Tells Telecom Carriers to Phase Out Foreign Chips in Blow to Intel, AMD,” The Wall Street Journal, April 12, 2024, https://www.wsj.com/tech/china-telecom-intel-amd-chips-99ae99a9.
[22]. Ibid.
[23]. Liza Lin, “China Intensifies Push to “Delete America” From Its Technology,” The Wall Street Journal, March 7, 2024, https://www.wsj.com/world/china/china-technology-software-delete-america-2b8ea89f.
[24]. Mackenzie Hawkins et al., “China Urges EV Makers to Buy Local Chips as US Clash Deepens,” Bloomberg, March 15, 2024, https://www.bloomberg.com/news/articles/2024-03-15/china-urges-byd-ev-makers-to-buy-chinese-chips-as-tensions-with-us-escalate.
[25]. Ibid.
[26]. USTR, “India,” https://ustr.gov/countries-regions/south-central-asia/india.
[27]. Andrea Shalal, “India’s high tariffs are a barrier to imports, White House’s Hassett says,” Reuters, February 10, 2025, https://www.reuters.com/world/india/india-has-enormously-high-tariffs-white-house-economic-adviser-hassett-says-2025-02-10/.
[28]. Ibid.
[29]. RSM, “India has significantly expanded its equalization levy,” January 23, 2023, https://rsmus.com/insights/services/business-tax/india-has-significantly-expanded-its-equalization-levy.html.
[30]. Lokesh Bulchandani, “Overview of India’s Digital Competition Bill, 2024,” GW Competition and Innovation Lab, August 8, 2024, https://competitionlab.gwu.edu/overview-indias-digital-competition-bill-2024.
[31]. Joseph V. Coniglio and Lilla Nóra Kiss, “Comments to the Indian Ministry of Corporate Affairs Regarding Digital Competition Law” (ITIF, May 15, 2024), https://itif.org/publications/2024/05/15/comments-to-the-indian-ministry-of-corporate-affairs-regarding-digital-competition-law/.
[32]. Arpan Chaturvedi and Aditya Kalra, “Exclusive: Meta warns India antitrust ruling could force roll back of features, hurt business,” Reuters, January 15, 2025, https://www.reuters.com/technology/meta-warns-india-antitrust-ruling-could-force-roll-back-features-hurt-business-2025-01-15/.
[33]. Competition Policy International, “India Moves to Challenge Big Tech Power in Digital Markets,” September 9, 2024, https://www.pymnts.com/cpi-posts/india-moves-to-challenge-big-tech-power-in-digital-markets/.
[34]. USTR, “2024 Special 301 Report,” 54.
[35]. Global Innovation Policy Center, “International IP Index 2024, Twelfth Edition,”189.
[36]. Brett Fortnam, “Trump promises a raft of new tariffs as Finance gets ready to vote on Greer,” Inside U.S. Trade, February 10, 2025, https://insidetrade.com/week-trade/trump-promises-raft-new-tariffs-finance-gets-ready-vote-greer.
[37]. “US to finalise broad contours of proposed trade agreement,” The Economic Times, February 17, 2025, https://economictimes.indiatimes.com/news/economy/foreign-trade/india-us-to-finalise-broad-contours-of-proposed-trade-agreement/articleshow/118330833.cms.
[38]. European Commission, “The Draghi report on EU competitiveness” (European Commission, September 2024), https://commission.europa.eu/topics/eu-competitiveness/draghi-report_en.
[39]. Robert D. Atkinson, “Go to the Mattresses: It’s Time to Reset U.S.-EU Tech and Trade Relations” (ITIF, October 2024), https://itif.org/publications/2024/10/21/its-time-to-reset-us-eu-tech-and-trade-relations/.
[40]. Foo Yun Chee, “EU tech rules should only target dominant companies, EU lawmaker says,” Reuters, June 2021, https://www.reuters.com/technology/eu-tech-rules-should-only-target-dominant-companies-eu-lawmaker-says-2021-06-01/.
[41]. Copenhagen Economics, “The Implications Of The DMA For External Trade And Eu Firms” (June 2021), 21–35, https://www.copenhageneconomics.com/dyn/resources/Publication/publicationPDF/8/568/1623318729/copenhagen-economics-study-of-dma-implications-on-eu-external-trade.pdf.
[42]. “Brussels looks to impose two-tier Big Tech regulation,” Financial Times, December 2020, https://www.ft.com/content/bb681171-3673-46e5-a243-9c18d97e22d5.
[43]. European Commission, “Commission opens non-compliance investigations against Alphabet, Apple and Meta under the Digital Markets Act,” news release, March 25, 2024, https://digital-markets-act.ec.europa.eu/commission-opens-non-compliance-investigations-against-alphabet-apple-and-meta-under-digital-markets-2024-03-25_en. Open cases are searchable through this link: European Commission, Digital Markets Act (DMA), https://digital-markets-act-cases.ec.europa.eu/search?caseInstrument=InstrumentDMA&caseLegalBasisDMA=~Compliance&sortField=caseLastDecisionDate&sortOrder=DESC.
[44]. “Apple Faces £1.5bn Class Action in UK Over App Store Commissions,” Lawyer Monthly, January 13, 2025, https://www.lawyer-monthly.com/2025/01/apple-faces-1-5bn-class-action-in-uk-over-app-store-commissions/.
[45]. Georgia Butler, “UK’s CMA finds elements of cloud computing market has ‘adverse effect on competition’,” Data Center Dynamics, January 28, 2025, https://www.datacenterdynamics.com/en/news/uks-cma-finds-elements-of-cloud-computing-market-has-adverse-effect-on-competition/.
[46]. Trelysa Long and Stephen Ezell, “The Hidden Toll of Drug Price Controls: Fewer New Treatments and Higher Medical Costs for the World” (ITIF, July 2023), https://itif.org/publications/2023/07/17/hidden-toll-of-drug-price-controls-fewer-new-treatments-higher-medical-costs-for-world/.
[47]. Eurostat, “USA-EU – International Trade in Goods Statistics,” accessed October 2024, https://ec.europa.eu/eurostat/statistics-explained/index.php?title=USA-EU_-_international_trade_in_goods_statistics#Trade_with_the_United_States_by_EU_Member_State.
[48]. U.S. Census Bureau, “U.S. Trade in Goods by Country,” accessed September 2024, https://www.census.gov/foreign-trade/balance/index.html.
[49]. Eurostat, “International trade in goods – detailed data: EU trade since 1999 by SITC,” accessed September 2024, https://ec.europa.eu/eurostat/databrowser/view/ds-018995__custom_13050014/settings_1/table?lang=en.
[50]. Carlton Reid, “Trump’s Plan to Make European Cars More Expensive Has a Fatal Flaw,” Wired, February 4, 2025, https://www.wired.com/story/trumps-plan-to-make-european-cars-more-expensive-has-a-fatal-flaw/.
[51]. Fortnam, “Trump promises a raft of new tariffs as Finance gets ready to vote on Greer.”
[52]. United States Census Bureau, “USA Trade” (imports and exports in 2023, accessed January 2025), https://usatrade.census.gov/.
[53]. Ibid.
[54]. World Bank, World Development Indicators (Simple Mean, Tariff Rate, All Products, accessed January 2025), https://databank.worldbank.org/source/world-development-indicators.
[55]. Ibid.
[56]. Gwartney et al., “Canadians have less economic freedom today than they did in late-1970s due partly to growth of government.”
[57]. Stephen J. Ezell, Robert D. Atkinson, and Michelle A. Wein, “Localization Barriers to Trade: Threat to the Global Innovation Economy” (ITIF, September 2013), https://www2.itif.org/2013-localization-barriers-to-trade.pdf.
[58]. “Argentina – Country Commercial Guide,” International Trade Administration, https://www.trade.gov/country-commercial-guides/argentina-trade-barriers
[59]. “Nigeria – Country Commercial Guide,” International Trade Representative, https://www.trade.gov/country-commercial-guides/nigeria-trade-barriers.
[60]. Gwartney et al., “Canadians have less economic freedom today than they did in late-1970s due partly to growth of government.”
[61]. OECD, “Service Trade Restrictiveness Index.”
[62]. OECD, “Services Trade Restrictiveness Index: Indonesia” (OECD, 2024), https://www.oecd.org/content/dam/oecd/en/topics/policy-sub-issues/services-trade-restrictiveness-index/oecd-stri-country-note-idn.pdf.
[63]. OECD, “Services Trade Restrictiveness Index: Thailand” (OECD, 2024), https://www.oecd.org/content/dam/oecd/en/topics/policy-sub-issues/services-trade-restrictiveness-index/oecd-stri-country-note-tha.pdf.
[64]. OECD, “Services Trade Restrictiveness Index: Japan” (OECD, 2024), https://www.oecd.org/content/dam/oecd/en/topics/policy-sub-issues/services-trade-restrictiveness-index/oecd-stri-country-note-jpn.pdf.
[65]. OECD, “Service Trade Restrictiveness Index.”
[66]. Compiled by authors from various government documents and news articles.
[67]. Ibid.
[68]. Jacinta Caragher, “Digital Services Taxes DST – global tracker,” VAT Calc, November 14, 2024, https://www.vatcalc.com/global/digital-services-taxes-dst-global-tracker/; “Digital Services Tax,” Digital Policy Alert, https://digitalpolicyalert.org/threads/Digital-Services-Taxes.
[69]. Caragher, “Digital Services Taxes DST – global tracker.”
[70]. Josh Rubin and Tonda MacCharles, “Trump takes aim at Canada’s digital services tax, NATO contributions,” Toronto Star, February 14, 2025, https://www.thestar.com/business/trump-takes-aim-at-canadas-digital-services-tax-nato-contributions/article_6bd4f568-ea1c-11ef-bfa8-b34f11d3c6dc.html.
[71]. Caragher, “Digital Services Taxes DST – global tracker.”
[72]. Ibid.; Digital Policy Alert, “Digital Services Tax.”
[73]. Digital Policy Alert, Digital Policy Tracker (policy changes in the digital economy, accessed February 26, 2025), https://digitalpolicyalert.org/activity-tracker?offset=0&limit=10&period=2020-01-01,2025-02-26&q=fine.
[74]. Ibid.
[75]. Ibid.
[76]. Ibid.
[77]. Ezell, Nager, and Atkinson, “Contributors and Detractors: Ranking Countries’ Impact on Globalization.”
[78]. Long and Ezell, “The Hidden Toll of Drug Price Controls: Fewer New Treatments and Higher Medical Costs for the World.”
[79]. Stephen Ezell, “How Japan Squandered Its Biopharmaceutical Competitiveness: A Cautionary Tale” (ITIF, June 2022), https://itif.org/publications/2022/07/25/how-japan-squandered-its-biopharmaceutical-competitiveness-a-cautionary-tale/.
[80]. Long and Ezell, “The Hidden Toll of Drug Price Controls: Fewer New Treatments and Higher Medical Costs for the World.” U.S. Health and Human Services, “International Prescription Drug Price Comparisons (Appendix C: Table C.1. Calculated US Versus Other-Country Price Indices, 2018),” https://aspe.hhs.gov/sites/default/files/documents/ca08ebf0d93dbc0faf270f35bbecf28b/international-prescription-drug-price-comparisons.pdf.
[81]. Ezell, Nager, and Atkinson, “Contributors and Detractors: Ranking Countries’ Impact on Globalization.”
[82]. Matthew Miller and Michael Martina, “Exclusive: Qualcomm nears $1 billion deal resolving China antitrust dispute,” Reuters, February 9, 2015, https://www.reuters.com/article/business/exclusive-qualcomm-nears-1-billion-deal-resolving-china-antitrust-dispute-idUSKBN0LD0WS/.
[83]. Australian Competition & Consumer Division, “Google LLC to pay $60 million for misleading representations,” news release, Augst 12, 2022, https://www.accc.gov.au/media-release/google-llc-to-pay-60-million-for-misleading-representations.
[84]. Lawyer Monthly, “Apple Faces £1.5bn Class Action in UK Over App Store Commissions.”
[85]. Competition Policy International, “Walmart Mexico Faces $5 Million Fine Amid Antitrust Allegations,” December 16, 2024, https://www.pymnts.com/cpi-posts/walmart-mexico-faces-5-million-fine-amid-antitrust-allegations/.
[86]. Fernando Carreño et al., “Mexico: New COFECE leadership and IFT restructure exemplify antitrust regime,” Global Competition Review, August 12, 2024, https://globalcompetitionreview.com/review/the-antitrust-review-of-the-americas/2025/article/mexico-new-cofece-leadership-and-ift-restructure-exemplify-antitrust-regime.
[87]. Compiled by authors from various government documents and news articles.
[88]. USTR, “2024 Specia 301 Report.”
[89]. Ibid.
[90]. Ibid.
[91]. GIPC, “International IP Index 2024 Twelfth Edition.”
[92]. Ibid.
[93]. Ibid.
[94]. Ibid.
[95]. Ibid.
[96]. David LaRoss, “Trump eyes car, drug, semiconductor duties in ‘neighborhood of 25 percent’,” Inside U.S. Trade, February 18, 2025, https://insidetrade.com/daily-news/trump-eyes-car-drug-semiconductor-duties-neighborhood-25-percent.
[97]. Meghan Ostertag, “Intermediate Goods: The Hidden Cost of Blanket Tariffs,” Innovation Files, February 21, 2025, https://itif.org/publications/2025/02/21/intermediate-goods-the-hidden-cost-of-blanket-tariffs/.
[98]. Josh Boak, Paul Wiseman, and Rob Gillies, “Trump’s trade war draws swift retaliation as Mexico, Canada and China impose tariffs on the US,” Reuters, March 4, 2025, https://apnews.com/article/trump-tariffs-canada-mexico-china-643086a6dc7ff716d876b3c83e3255b0.
[99]. Robert D. Atkinson, “A Remarkable Resemblance: Germany From 1900 to 1945 and China Today. Time for a NATO for Trade?” (ITIF, January 2021), https://itif.org/publications/2021/01/20/remarkable-resemblance-germany-1900-1945-and-china-today-time-nato-trade/.
[100]. Ezell, “False Promises II: The Continuing Gap Between China’s WTO Commitments and Its Practices.”
[101]. Robert D. Atkinson, Nigel Cory, and Stephen Ezell, “Stopping China’s Mercantilism: A Doctrine of Constructive, Alliance-Backed Confrontation” (ITIF, March 2017), https://itif.org/publications/2017/03/16/stopping-chinas-mercantilism-doctrine-constructive-alliance-backed/.
[102]. USTR, “Pharmaceuticals,” https://ustr.gov/issue-areas/industry-manufacturing/industry-initiatives/pharmaceuticals.
[103]. Long and Ezell, “The Hidden Toll of Drug Price Controls: Fewer New Treatments and Higher Medical Costs for the World.”
[104]. H. E. Frech, III et al., “Pharmaceutical Pricing and R&D as a Global Public Good” (NBER working paper, May 2023), https://www.nber.org/papers/w31272.
[105]. Congressional Research Service (CRS), “U.S. Tariff Policy: Overview” (CRS, January 31, 2025), https://crsreports.congress.gov/product/pdf/IF/IF11030.
[106]. U.S. Senator Tim Kaine, “Kaine & Coons Introduce Legislation to Require Congressional Approval of New Tariffs on U.S. Allies Ahead of Expected Trump Tariffs,” news release, January 31, 2025, https://www.kaine.senate.gov/press-releases/kaine-and-coons-introduce-legislation-to-require-congressional-approval-of-new-tariffs-on-us-allies-ahead-of-expected-trump-tariffs.
[107]. Robert D. Atkinson, “Testimony to the US House Ways and Means Trade Subcommittee: Protecting American Innovation by Establishing and Enforcing Strong Digital Trade Rules” (ITIF, September 2024), https://itif.org/publications/2024/09/20/testimony-house-ways-and-means-trade-subcommittee-strong-digital-trade-rules/.
[108]. Ibid.
[109]. Ibid.
Related
March 20, 2025
