
Why Wind and Solar Need Natural Gas: A Realistic Approach to Variability

Wind and solar power will replace consistently dispatchable electricity from fossil fuels with variable and more unpredictable clean energy. Seasonal shifts and annual variations cannot be handled with batteries or other proposed storage solutions like hydrogen. Natural gas will have to bridge the gap for many decades.
KEY TAKEAWAYS
Key Takeaways
Contents
The Challenge of Variable Renewable Energy 4
Scale and Duration: The Size of the Variability Challenge. 9
Mitigating the Variability Problem. 12
Gas and Phase II of the Energy Transition. 14
Beyond Phase II: Long-Duration Storage Technologies 18
Compressed Air Energy Storage. 24
DOE and Electricity Storage. 29
Introduction
The share of U.S. electricity produced by wind and solar (“variable renewable energy” sources, or VRE) is growing very rapidly now. While it’s possible that firm clean power sources (e.g., nuclear, geothermal, or fusion) will expand dramatically, that seems unlikely barring important technological breakthroughs. VRE is expanding quickly, and will likely become dominant in coming decades.
As a result, variability in electricity supply is becoming a formidable challenge. Some variability is short term—the sun doesn’t shine at night. Some is seasonal—solar generates much less power in winter. And some is unpredictable across a longer timescale: Some weeks, months, or years are just much less windy, for example. These problems are not yet acute, but they will quickly become so, depending on the level and speed of VRE adoption.[1]
The current focus of both industry and government is on short-duration storage, which helps shift energy within the day and also helps solve a number of technical challenges to the grid. But short-duration storage technologies alone won’t work for much longer duration needs.
For VRE grids to be viable, they have to keep the lights on 24/7 at a reasonable cost, and if they are to spread to low-income nations, at a cost no greater than fossil-fuel-generated electricity. As they come to dominate the grid, large VRE energy deficits will emerge, and must be addressed.
These coming deficits and their solutions can be clustered into three phases. We don’t yet know where the boundaries between phases will fall exactly, and those boundaries will likely fall in different places in different regions. Still, this is an essential framework for thinking about VRE and variability:
▪ Phase I. The grid is still not VRE-dominated (less than approximately 40 percent VRE), so the impact of seasonal and annual deficits is limited, and can be handled by existing dispatchable resources (e.g., peaker plants using natural gas).
▪ Phase II. VRE is coming to dominate the grid (approximately 40–80 percent VRE). Gas gradually transitions from a baseload power (on all the time) to a contingency role, used when VRE cannot handle the load. Better transmission could also help by moving electricity from places of surplus supply to those in deficit).
▪ Phase III. The last 20 percent of decarbonizing the grid (approximately 80–100 percent VRE) requires either the continued use of gas-powered generation plus carbon capture or the deployment of very long-duration energy storage (VLDES) able to handle annual and annual VRE deficits (or both). No current technologies are suited to meet this challenge at an affordable cost. Of course, if fusion, nuclear, geothermal, or other zero-emission technologies improve sufficiently to dominate the grid, the variability problem is eliminated. But that seems unlikely, and this paper is not about those scenarios.
The boundaries between these phases lie well into the future, and they should therefore be understood as useful concepts. They mark points of gradual transition, not hard tipping points. They will also occur at different times for different geographies. Nonetheless, they help us to understand the basic framework within which government policy should operate.
▪ During Phase I, policy should focus on integrating VRE into what is still a fossil-dominated grid. That means adding the short-duration storage needed to manage the daily peaks and valleys of VRE production effectively, gradually transitioning away from gas for that purpose. Wherever possible (e.g., the United States), gas will replace coal generation, as it is both less expensive and cleaner. Implementing VLDES with hydrogen or compressed air energy storage (CAES) would be an expensive mistake during this period, as these technologies are a long way from competitive with existing gas generators as a dispatchable resource. However, providing additional resources for basic and applied research on long-duration storage is appropriate.
▪ During Phase II, government will have to help manage the tricky transition from a fossil-dominated grid to a VRE-dominated grid in which fossil fuels continue to play a critical role as dispatchable energy to meet both predictable and unpredictable VRE deficits. That transition will take a long time (likely decades), starting when gas is still a dominant baseload resource and ending when we start to replace gas with other solutions to meet variability. During this phase, government should ramp up research on technology-driven solutions to variability, which could include both VLDES and carbon capture. And as these technologies become competitive, governments can help accelerate their deployment and scale-up.
▪ During Phase III, the final transition away from fossil fuels will require the introduction of technically advanced long-duration storage or carbon capture, assuming these technologies move along the pathway from demonstration projects through scale-up at a reasonably affordable cost.
It is perhaps ironic that the fastest and most efficient transition to VRE (and associated reductions in emission) will probably require the increased use of gas at scale far into the future. Its function will change from mid-scale and peaking dispatchable power to insurance and backup of VRE supply. Gas is ideally suited to the increased volatility introduced by VRE since it can be started and ramped up from zero to full capacity in a matter of minutes, and turned off again equally quickly. That’s why even very high decarbonization scenarios from the National Renewable Energy Laboratory (NREL) still require significant gas capacity for power production.
Box 1: Price/Performance Parity: “P3”
Climate change is global, so solutions must be global. In particular, they must meet the needs of low-income countries where demand for energy is rising fastest, and where ability and willingness to pay a green premium is low to nonexistent.
There is no evidence that forcing change with regulation, subsidies, or exhortation will work. Low-income countries will not adopt clean energy at the expense of growth. Neither will richer countries.
The market is the only lever powerful enough to drive the transition at the scale needed—and it will only work when clean energy technologies can outcompete dirty ones without subsidies or regulation. They must reach price/performance parity (P3).[2]
Renewable energy is inherently variable. To succeed, especially in lower-income countries, VRE must deliver with reliability and costs that are broadly similar to fossil-generated energy. The United Kingdom recently announced that it is the first Organization for Economic Cooperation and Development (OECD) country to halve its emissions by effectively replacing coal-fired power generation with wind and solar. Nuclear and gas have remained largely constant over the past decade, but gas has now become the backup to VRE.
Bottom line: The long path to complete decarbonization requires that we rethink the timeline for VLDES, and in the process focus on developing better technologies as well as economic models that can use different timelines to generate much lower cost profiles. For example, hydrogen for long-duration storage is not the same economic beast as hydrogen for green steel where hydrogen use occurs essentially at the time of hydrogen production. We should take full advantage of these kinds of differences.
The Challenge of Variable Renewable Energy
Matching supply and demand has always been a core function of the grid. Too much supply, and energy is wasted (which is costly). Too little, and customers are left in the dark. Before VRE became a significant component in the energy mix, reliability was relatively easy to manage. Electricity generators used fossil fuels (formerly coal, now mostly gas) along with some nuclear and hydropower (more in some countries and regions than others). Energy generated from these fuels was highly predictable and quite flexible, and the system could respond quite quickly to changing demand or supply issues, using fossil fuel reserves. Additional capacity was quickly available from single-cycle gas combustion generators (known in this context as gas peaker plants, or “peakers”), which were expensive to operate but could be brought online very quickly and were used for just a few minutes or hours at a time.
This predictable supply met mostly predictable demand, as there are peaks and valleys both daily and seasonally, but those are quite predictable. Daily demand peaks in the evening, and is lowest at night, for example.[3]
Figure 1: The duck curve of daily energy demand—net load in megawatts on March 31, 2012–2020[4]
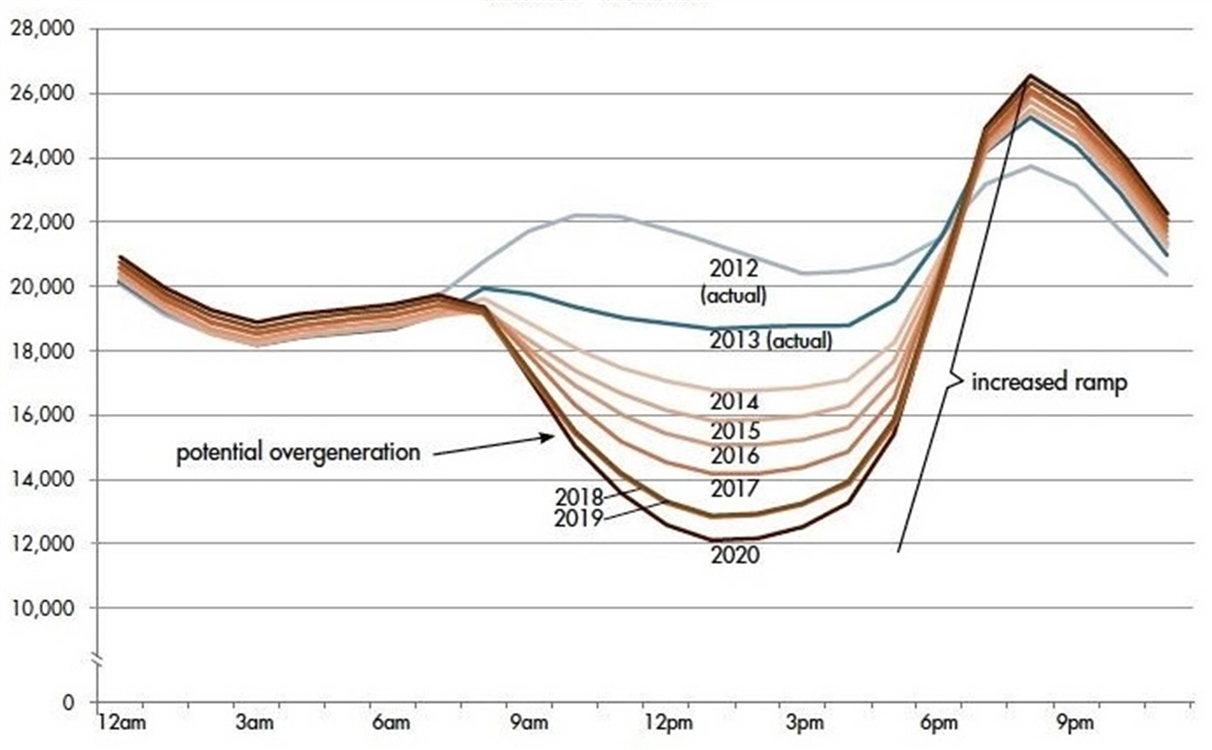
The rapid expansion of VRE is transforming this solid and predictable system. Notably, the supply of energy is becoming variable. Based on current energy projections by the U.S. Energy Information Administration (EIA), VRE will grow dramatically, and the share of fossil fuels will decline. More aggressive decarbonization pathways would further accelerate this shift, with the grid eventually becoming heavily dependent on VRE if it is 95 percent or 100 percent decarbonized. But even the current pathway, based on existing policy, projects major changes (see figure 2), with VRE exceeding 40 percent of electricity generation in 2030, compared with less than 20 percent today. Simply put, the more VRE, the more variability on the grid.
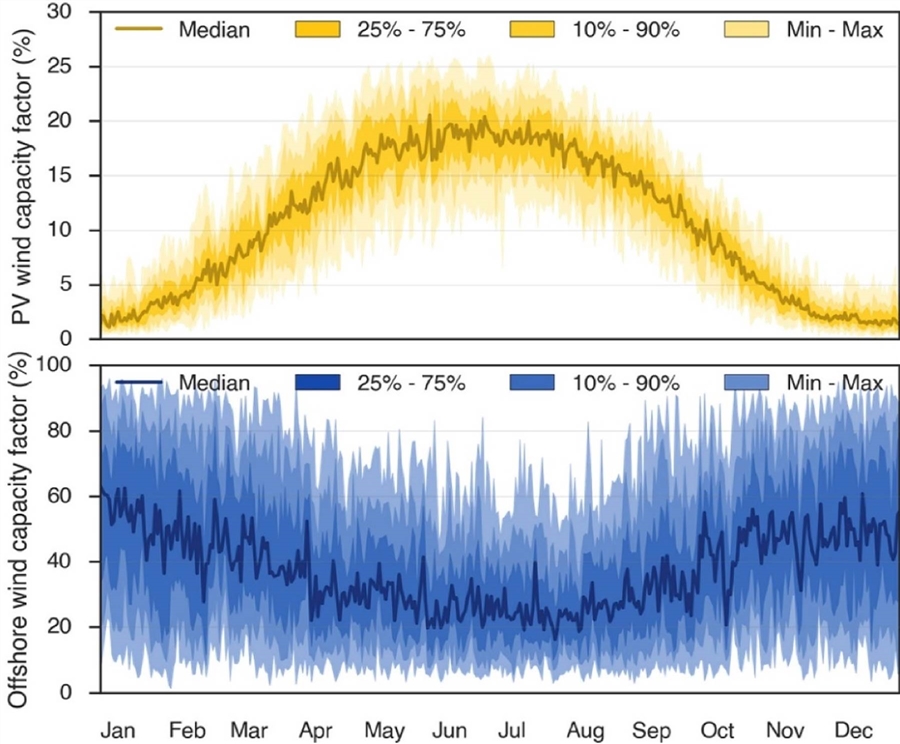
Some VRE variability is entirely predictable—for example, solar produces no power at night. Similarly, there are well known seasonal variations. Figure 3 shows both anticipated seasonal variation—median solar PV capacity factors in the United Kingdom vary from ~2 percent to ~20 percent—and also the variation across years: the sunniest year had solar PV capacity at ~26 percent in June, while the cloudiest had only ~10 percent.
Figure 2: EIA projections for electricity generation by fuel group in the United States[5]
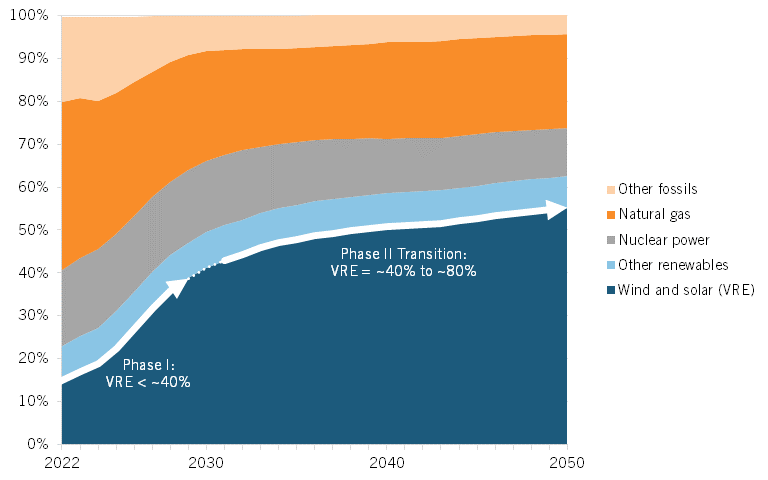
Figure 3: Seasonal variability of wind and solar[6]
These predictable variations across days and seasons will become larger and more challenging as VRE grows; this is just simple math: The more VRE, the more important regular dips in production become—and the more significant over-production becomes as well, leading to more “curtailed” energy from VRE (times when the grid cannot accept all the VRE being produced).
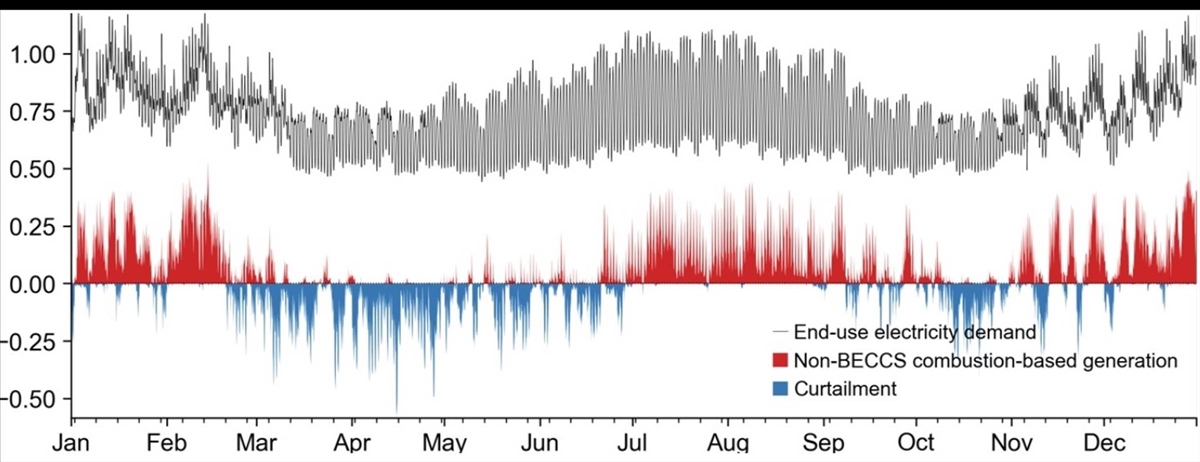
This seasonal mismatch is explored in NREL’s study analyzing a 100 percent decarbonized grid. Figure 4 shows the hourly projected mismatch between supply and demand for one central scenario. Simulations project long periods of deficit (marked in red) and also long periods of curtailment (marked in blue). While some of the mismatch is generated by shifts in demand, which is higher in winter and summer than in spring and fall, it is mostly driven by seasonal variability of energy supply.
Figure 4: Supply and demand of grid energy in a 100 percent decarbonized scenario (TW, national total)[7]
All VRE is not the same: Solar and wind have different seasonal patterns, with solar production falling sharply in winter and wind declining (less so) in the summer. Solar generation during the winter can drop to only 10 percent of summer production. A heavily solar-dominated grid must therefore prepare for low VRE production during the winter. One partial solution would be to balance solar with sufficient wind, which may not be cost effective in the summer but may be critically important in the winter. Denmark and the United Kingdom face the inverse problem: a wind-heavy grid that needs additional solar to balance lower wind energy production in the summer. Much of this predictable variation can be accommodated.
But some VRE variation is not predictable. Some years, solar simply generates less energy—there are more clouds, or dust storms fog photovoltaics. Wind is even more unpredictable across long periods. A Royal Society (RS) study finds that there are significant wind droughts in the United Kingdom where production is down 50 percent or more over the course of a quarter.[8] Across 37 years of meteorological data, the RS found two years with a projected deficit of more than 40 terawatt hours (TWh).
Figure 5: Projected annual U.K. energy surplus and deficits over 37 years (TWh, based on 100 percent VRE)[9]
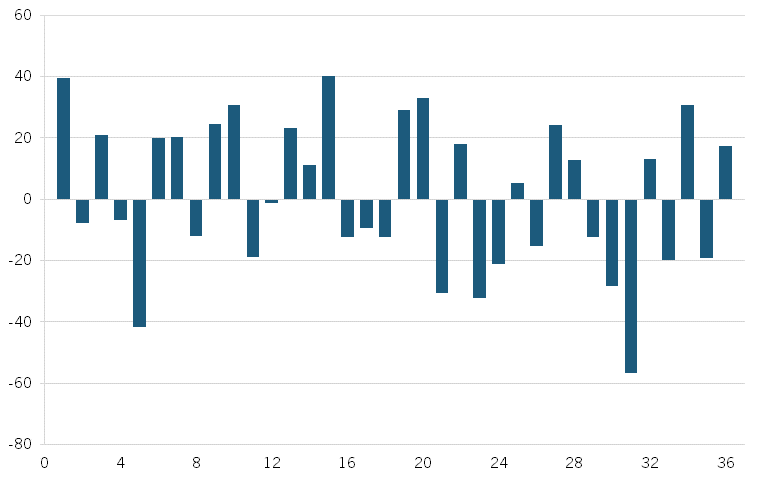
Similarly, an analysis of wind and solar in Texas finds that annual wind speed varies only about 3 percent across the state, but some areas have variations of 10 percent or more, and some seasons have even more variation—the winds in spring of one year may differ markedly from those in another, even if averages over the years are relatively similar.[10] The grid must provide enough energy in every year and every location, not just on average.
This unpredictable variation is scary: What if, after we go all in on VRE, we have a significant energy deficit for weeks or even months due to unfavorable weather patterns? If we have retired the generators that use fossil fuels, what’s left to power the grid?
Variability can also generate an electricity surplus. That doesn’t immediately risk the lights turning off, but when VRE is “curtailed” (refused by the grid at any price), that reduces the incentive for investors to build more VRE. Like airline seats, solar energy loses 100 percent of its value if it is not sold (or stored) at the time of production.
One obvious solution to the problem of variable supply is to store energy so it can be used when energy is scarce—in effect, creating insurance against low supply. Utilities are already adding substantial amounts of short-duration storage to shift energy from afternoons when it is plentiful to evenings when it is not and when demand peaks. That is perhaps why the Department of Energy (DOE) has defined long-duration energy storage (LDES) as electricity storage for 10+ hours, a step beyond existing markets for 4-hour batteries and beyond likely markets for the 8-hour batteries soon to come. Lithium-ion (li-ion) batteries or their technological successors will solve the 4- or 8-hour problems, but they don’t address long-duration concerns.
Box 2: Impact of a Solar-Dominated Grid in the United States
A recent study by NREL staff focuses on a decarbonized world in which solar accounts for 55 percent of U.S. electricity generation.[11] It finds four core conclusions:
1. The demand plus operating reserves required in the United States can be met with up to 55 percent solar plus storage.
2. The power system must be able to transition rapidly between storage and immediately-generated power.
3. There will be significant curtailment, with many hours wherein >40 percent of solar energy is refused by the grid.
4. Up to 36 percent of hours will experience very low energy prices (where there a surplus).
This paper is not about LDES as defined by DOE; it is about seasonal and annual variation that requires solutions for low supply periods that can last months or more. That’s far beyond DOE’s 10 hour+ storage, beyond even EPRI’s definition of LDES as >500 hours of storage (equivalent to about 20 days). Seasonal storage may require energy that can be stored for much longer, so a reasonable definition would be VLDES at >2,000 hours—a bit less than three months’ worth of storage.
VRE-driven deficits sound mostly theoretical today; we are still a long way from a renewable-dominated grid and, if anything, the current VRE problem is curtailment, not deficits. But that grid will be very different (see box 2), so if we don’t start thinking and moving on long-duration storage in the relatively near term, we may be decades behind when we really need it. We need to understand now how much VRE will create significant electricity deficits, and how to solve that problem.[12]
Scale and Duration: The Size of the Variability Challenge
Today, the grid is still dominated by the consistent production of energy from fossil fuels. Most energy storage has historically been in the form of coal or natural gas, plus a small amount of pumped hydro storage (PHS), which accounts for 96 percent of all storage on the U.S. grid today. The grid is now rapidly adding short-duration batteries for many purposes, especially the need to manage intra-day mismatches between supply and demand. But as the grid evolves and becomes more VRE-dominated, that changes.
We can divide the evolution of the grid into three phases:
1. Phase I is where we are today and lasts until the grid becomes sufficiently VRE dominated to require a shift in the role of fossil fuels. That seems likely to start around 35 percent VRE, but numerous factors are at play, so this figure is barely even approximate; it’s a useful starting point and a helpful conceptual distinction (note that this tipping point will differ substantially by region).
2. During Phase II, VRE comes to dominate the grid, but the grid is still not decarbonized. It seems useful to see this as a phase wherein VRE accounts for ~35–80 percent of grid energy, while fossil fuels shift from being the primary source of firm baseload energy to being a complementary dispatchable source, in particular helping to solve the variability problem previously described. Gas is a good dispatchable source of energy, as it can ramp up quickly and can be delivered at massive scale through infrastructure that already exists.
3. Phase III covers the last 20 percent of decarbonizing the grid and will require either the elimination of fossil fuels or the development of effective and efficient carbon capture and storage. This is the “last 20 percent problem.” Not only do we have to eliminate carbon, but we also have to replace gas with other ways of solving the variability problem (unless we can use carbon capture, which should be seen as one candidate option among many).
The speed at which these transitions arrive will depend on many factors, including the willingness of politicians and populations to pay (perhaps substantially) for decarbonization, which after all provides almost no immediate personal benefit. The evidence so far suggests that this willingness will be limited, which will slow elements of the transition that require expensive subsidies or regulations.
In fact, current U.S. government estimates suggest that the transition will not be completed by 2050. DOE’s EIA provides the central forecast for the U.S. government, and it currently estimates that by 2050, VRE will account for 54 percent of all electricity generated in the United States, up from 30 percent today, in a grid that will be generating almost twice as much electricity as it does today. The EIA central scenario still anticipates that a third of electricity will come from fossil fuels (almost all from natural gas).
More aggressive decarbonization scenarios would dramatically accelerate and expand these shifts. One NREL study looks at a 100 percent decarbonized grid by 2035, offering multiple scenarios based on different conditions, technology developments, and policies. The All Options scenario still includes 680 gigawatts (GW) of fossil fuel capacity, even in the context of 100 percent decarbonization.
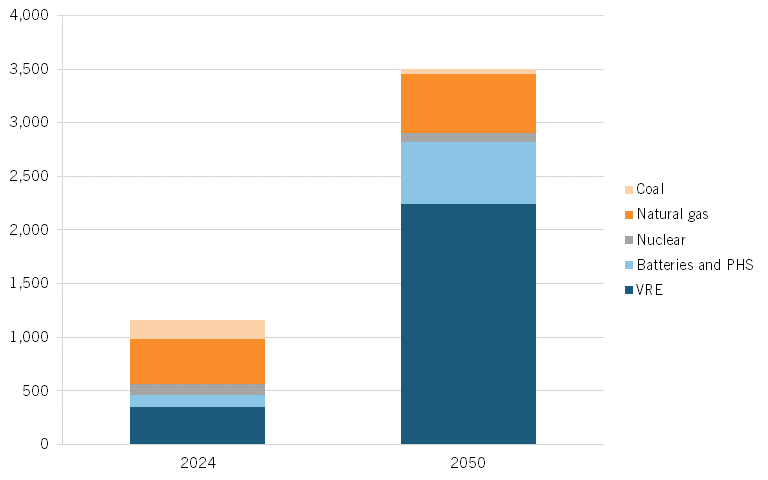
NREL’s Standard Scenarios offer another way to look in more detail at a U.S. grid that is 95 percent decarbonized by 2050. Rather than offering predictions, they explore what the grid would look like if it did reach certain decarbonization levels. At 95 percent decarbonization, wind and solar account for 63 percent of generating capacity, while gas declines from 35 percent to 16 percent, with combined cycle gas turbine (CCGT) capacity essentially flat, and peaker capacity up sharply. Variability is handled primarily by gas, batteries, and better transmission; hydrogen and other possible VLDES technologies are not expected to play a major role (see figure 6).
Figure 6: Projected U.S. electricity generation by source (TWh, in 95 percent decarbonization scenario)[13]
Outside the United States, the United Kingdom’s RS has developed a series of reports covering projected VRE-driven deficits as the United Kingdom becomes heavily wind dependent. The RS assessment focuses on the needs of a system that is 100 percent renewable—80 percent wind and 20 percent solar—designed to meet electricity demand of 570 TWh annually (the United Kingdom’s projected electricity need in 2050). The study takes these assumptions and maps them against a 37-year meteorological record (see figure 5).
The headline findings from the RS are the following:
▪ The United Kingdom should prepare for significant periods when the VRE grid cannot handle demand. The maximum annual deficit will be approximately 45 percent of total anticipated energy demand.
▪ Deficit projection models must be based on the longest possible meteorological record. The report notes that in the U.K. case, choosing the “wrong” two-decade period could miss major shortfalls.
▪ While predictable seasonal variation is a substantial problem, unexpected extreme shortfalls are potentially devastating and will be more difficult to handle.
▪ Overbuilding (building more solar and wind than is strictly needed) is one partial solution. The RS report recommends 23 percent overbuilding for the United Kingdom. Overbuilding both reduces the size of the projected deficit and creates a surplus of electricity production that is close to zero cost, which can be used to power storage. Overbuilding may also be cheaper than other solutions.
▪ Despite overbuilding, additional insurance is still needed. Based on meteorological analysis, the RS projects that the United Kingdom will need 123 TWh of stored energy to protect against the maximum deficit plus a reasonable contingency allowance, even after 30 percent overbuilding. This is equivalent to 22 percent of projected total annual electricity demand.
The variability problem in the United States is not yet acute. However, we should be preparing to make the transition to Phase II within the next decade and, depending on the speed of VRE penetration, be looking to build capabilities that can solve the “last 20 percent” problem two to three decades after that. It is of course possible that political winds will change, and climate action will become so pressing that governments are prepared to spend vast amounts to accelerate VRE deployment, which would speed up the timeline. Our own assessment is that green technology will be adopted when it reaches—broadly speaking—P3 with fossil-based technologies. That is happening, and it will happen faster with a deeper focus on energy innovation. But whatever the pathway, it seems fairly clear that VRE is likely to grow fast, perhaps substantially beyond the relatively cautious central forecasts from DOE, as new generating capacity coming onto the grid is dominated by VRE and reliable but dirty plants that use fossil fuels (especially coal) are retired. And as the grid turns to VRE, insurance will be needed both to address predictable seasonal variations in electricity supply and to protect against unpredictable deficits.
Mitigating the Variability Problem
Storing energy is one possible long-term solution, but VLDES is not the only way to solve the problem of variable supply:
Better demand management can have a substantial impact. Demand-management programs encourage users to moderate demand during peak periods, often using smart meters to monitor and manage usage. According to the International Energy Agency (IEA), demand response programs generated 29 GW of peak demand savings in the United States in 2021, especially from commercial customers. Over 10 million residential, commercial, and industrial customers were enrolled, saving a total of 1,154GWh.[14] However, that is only 0.03 percent of total generation, and while demand response can quite effectively shift demand by hours (from the early evening peak to late night for example) and thus dampen the demand for short-duration storage, demand management doesn’t work for longer time periods; we cannot incentivize demand response that would solve low solar production during winter months, for example, or address a months-long wind drought.
Better grid integration would also help (where regions tap generation from outside the region, for example, connecting to a source with a different supply profile). While long distance electricity transmission does have an energy cost, access to a much wider network could help considerably with variability. Low-wind conditions in the Midwest might be mitigated by higher wind on the coasts or more solar energy from the Southwest, for example. They also help a little with costs: NREL estimated that better interconnection could reduce total production costs by 4 percent, while aggressive decarbonization scenarios rely on massively expanded inter-regional transmission.[15] However, the problems with massive transmission builds are well known, and relying on tens of thousands of miles of new high-speed transmission seems ill advised. Even short transmission lines generate significant opposition, especially from landowners and governments that face disruption from lines crossing their land without necessarily seeing any benefit at all.[16]
Interconnection may also be a better solution for shorter-term variation—peak use on the East Coast does not occur at the same time as on the West Coast, for example, and wind and solar resources are concentrated in different areas. As a solution to longer duration variability, interconnection seems somewhat risky (how much will interregional transmission work to balance missing supply? Who goes short if there isn’t enough energy in the system?). At any reasonable scale of build-out, it’s also not a big enough solution.
Virtual power plants (VPPs) knit together networks of end-user storage. As deployment of home solar plus batteries and electric vehicles (EVs) grows, there are more end-user batteries that could power a VPP.
VPPs could play a significant role in helping utilities avoid certain generating and battery investments, and in particular could help time-shift electricity supply to meet peak demand, charging EVs during daytime hours (for solar dominated grids) or at night (for wind-driven ones)—and then using them as batteries during the evening peak when they are not in use could be an attractive option and potentially reduce peak load on the grid.
But even a full buildout of VPPs does little to address long-duration variability, as none of these energy sources are available over long duration. They could help a lot with short-duration power needs, but they will likely not even be able to manage weekly variability.
Nuclear power provides baseload power; because it is so expensive to build, it runs 24/7 even though it’s technically possible to use nuclear as dispatchable backup power. A substantial increase in nuclear would directly reduce the overall VRE deficit—for example, a grid that runs on 30 percent nuclear and 70 percent VRE will by definition generate 30 percent less VRE deficit than a 100 percent VRE grid. However, no NREL scenario anticipates that nuclear will generate much more power in 2050 than it does in 2024 (of course, unexpected very large-scale success for new small modular reactors (SMRs) might change that, although even SMRs are probably also best seen as baseload power). And affordable fusion would make all this moot, as the world would get all its power from that source. However, it’s not clear that nuclear will help much to address VRE deficits.
Hydropower usually operates with high capacity utilization because it is in most cases relatively cheap—much cheaper than nuclear, for example. And it can be used as dispatchable power, but because it is cheap, it is usually one of the first choices for an electricity source: Utilities buy hydro first, which makes it primarily used as baseload power and hence unavailable for dispatch further up the stack. Still, hydro is technically dispatchable, and if wind and solar become cheaper than hydro, it’s possible that it could be used to fill VRE deficits. However, as we will see in the technology section of this paper, there are formidable nonprice barriers that will prevent deployment of sufficient hydropower.
Geothermal. New technologies for geothermal could possibly lead to rapid expansion beyond the relatively few locations currently favorable for geothermal. However, Fervo’s leading-edge technology is still at the pilot stage, so it’s not yet clear whether its best use is as baseload or dispatchable power, and NREL scenarios don’t anticipate any significant impact from this technology by 2050.
Overbuilding VRE. As VRE becomes cheaper, it may be less expensive to simply build more VRE than is needed, rather than investing in expensive alternatives. If VRE is overbuilt by 20–30 percent, that of course adds 20–30 percent to the capital cost of the system, but would reduce the periods during which VLDES is needed; those unexpected supply failures when the wind doesn’t blow would simply become smaller and shorter, while overbuilt VRE would also provide periods of very cheap power with which to charge VLDES storage systems.
The RS study argues that in the United Kingdom, VRE should be overbuilt by around 30 percent, thus sharply reducing the need for VLDES. Similarly, as Demark moves toward a wind-dominant grid, it is building a massive hub through which wind energy that cannot be used on the Danish grid can be sold to other countries—in effect, a different kind of overbuilding solution.[17]
In practice, overbuilding has plenty of problems, especially in market environments. An overbuilt grid is one that deliberately creates longer periods of excess supply, during which the price of VRE energy would fall toward zero or even below (especially in markets with subsidies). Longer periods with zero market revenues make VRE projects much less bankable, and less attractive to investors. While technically a solution, it is hard to see how deliberately overbuilding could even occur in a market-driven environment’ investors would simply refuse to pull out their wallets. And as we argued in a previous paper, all solutions need to scale globally, and that requires affordability; the additional costs of overbuilding cut against that.[18]
And then there are political problems. It will be very difficult indeed to persuade regulators to deliberately build more (expensive) supply than is “needed.” Of course, if the choice is between expensive VRE overbuilding and even more expensive VLDES, those politics may change, especially if the ultimate alternative is that the lights go out.
Bottom line: All these mitigation efforts may play a role at the margin, but they won’t address growing variability challenges as we transition into Phase II of decarbonizing the grid.
Gas and Phase II of the Energy Transition
Natural gas currently provides more power to the electric grid than does any other source—around 25 percent currently (see figure 2). Models anticipate that its share will fall steadily in coming decades, down to about 11 percent by 2050. But 11 percent is not nothing, and gas will likely play a very important role in solving the VLDES challenge.
Gas for power comes in two basic flavors: CCGTs are the workhorses of the grid—they provide stable, reliable, and continuous power at highly competitive costs. CCGTs are lower cost energy and operate for many more hours annually.[19]
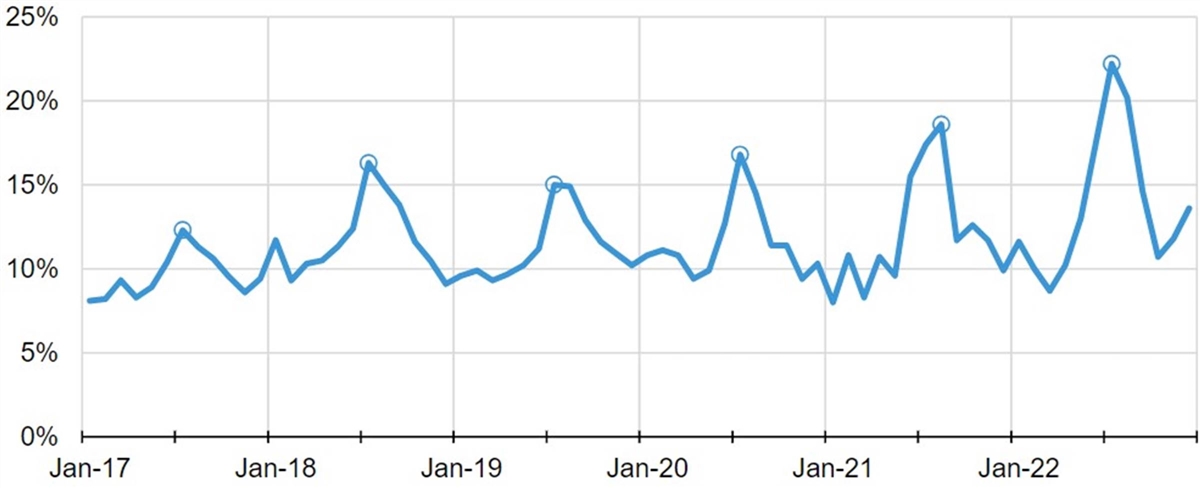
Gas peaker plants are simpler—they are essentially a jet engine turbine operating on only a single cycle (unlike CCGTs). They provide additional capacity for when CCGTs cannot handle demand, but are less efficient, and their energy is more costly. Peakers currently account for about a quarter of all U.S. electricity generating capacity, but only 3.1 percent of electricity production.[20]
Peaker plants are usually not used for more than 10–15 percent of hours annually (i.e., they have a capacity factor of 10–15 percent (often 4 percent or less), and rarely for more than 4 hours at a time).[21] Because they run so little, their capital cost is spread over only a few hours, which makes their energy expensive. Today, they act as insurance against grid undersupply. Lazard estimated the 2023 levelized cost of production at $168/megawatt hour (MWh) for gas peakers, compared with about $60/MWh for CCGTs, though of course these costs are both heavily influenced by the price of gas.[22]
Figure 7: U.S. simple-cycle natural gas turbines capacity factors, January 2017–December 2022[23]
We know that as VRE expands, both predictable and unpredictable deficits become more of a problem. But gas is a cheap, reliable, and available solution to that problem—at least until we get to very high VRE penetration on the grid.
We have peakers, which are used as insurance today. But we also have CCGT generating capacity, which can be used as insurance well into the future. This works along several dimensions
Most immediately, gas plants do not operate at full capacity—in fact, EIA says that annual capacity utilization in 2023 was 57 percent for CCGT plants. There is currently a lot of spare capacity on an annual basis. This is not always available—peakers exist for a reason (to help when CCGT plants and other energy sources together cannot match demand)—so CCGT can certainly provide additional energy to compensate for VRE deficits during the times when load is not at peak.
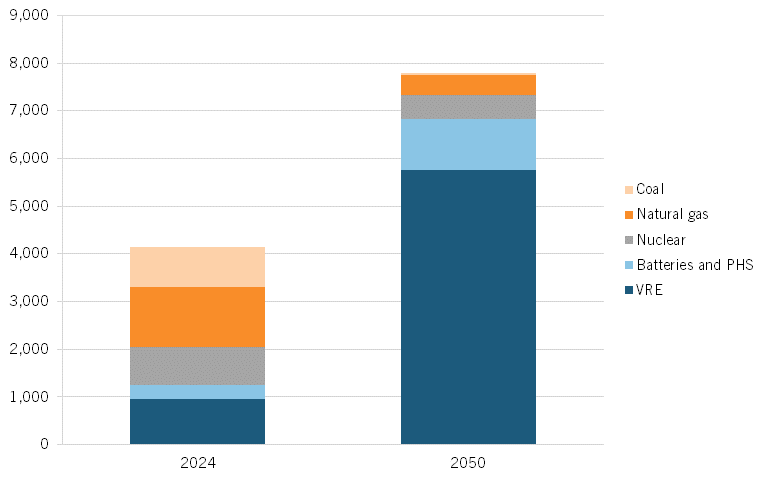
Over the longer term, however, CCGT functions can change. If the grid becomes increasingly dominated by VRE, then CCGT will not be needed for baseload power. And that is what figure 8 shows: In the NREL 95 percent scenario, CCGT falls from 28 percent of power generation in 2024 to only 8 percent in 2050.
But, in part because CCGT is needed much less for baseload power, a plant and its capabilities can be shifted to a different function: capacity insurance. That’s why NREL’s 95 percent scenario still sees natural gas providing 15.5 percent of electricity capacity in 2050. It has become an extended peaker system, leading to growth in CCGT generating capacity of 11 percent during this period, while peaker plant capacity is up 66 percent.
Figure 8: NREL projections for electricity generation capacity (TWh), 95 percent decarbonized scenario[24]
Even though generating companies try to maximize the use of their plants, there is still substantial untapped CCGT capacity—EIA has estimated that current CCGT capacity utilization is only 57 percent.
Box 3: Capacity vs. Generation—and Why It Matters
Electricity capacity refers to the maximum amount of electricity that can be produced at one time. It can apply to an individual source of generation or to the grid as a whole. For the latter, it is typically measured in gigawatts. Electricity generation is the total amount of electricity generated in a given period of time. It can also be applied to individual units or the entire grid. It is usually measured in terawatt hours.
While some energy sources are used 24/7, others are only used when there is insufficient capacity on the grid. Currently, gas peaker plants are the main provider of additional capacity; they provide critical capacity when there is a deficit but actually generate only a small share of energy across the year because they are used infrequently.
Today, CCGTs are almost always used to provide stable 24/7 energy. But over time, their function will change; they will provide more peak capacity and less power generation, becoming more like peaker plants today,
Figure 9: Projected natural gas and VRE capacity and generation, 2022–2050[25]
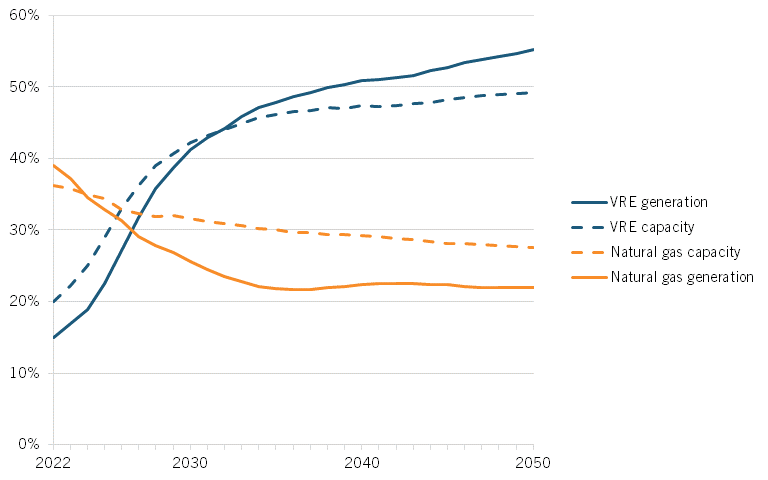
Under current circumstances, CCGT plants run flat out at peak periods, and their ability to address VRE deficits is limited. But as VRE replaces CCGT power on the grid, CCGT plants can increasingly meet the need for insurance, although this will—as we see ahead—requires changes to their business model and revenue streams.[26]
There is one further key component to consider: the relationship between natural gas and batteries.
We think of batteries as a natural complement to VRE for diurnal storage: more batteries means that solar can effectively serve customers at night. And that is indeed how batteries are coming onto the grid; an enormous expansion of battery power is already under way. NREL’s 95 percent scenario anticipates that the 12 GW of existing battery capacity on the grid will grow to almost 450 GW by 2050; the United States added 6.4 GW of new battery capacity in 2023.[27]
Diurnal use of batteries is powered by VRE: They charge when power is plentiful during the day, to be released during the evening peak and overnight. Batteries can also do more as their duration increases.[28] But batteries don’t always have to be powered by VRE.
The combination of available CCGT capacity and a large stock of batteries on the grid provides a further option when grids encounter VRE deficits. Batteries can be powered by gas, especially during off-peak hours when gas is not engaged at capacity and batteries are not being drained. Those batteries can be filled daily or even more frequently from CCGT (or peaker) plants. So while batteries are not themselves capable (or likely to become capable) of storing sufficient energy across seasons or years, they can be used in conjunction with natural gas to shave peak demand during periods of VRE deficit, thus reducing the amount of gas used for generation and potentially also reducing the gas capacity required to meet peak demand. This approach has two further benefits: Much of the gas infrastructure that will be needed already exists, so this incurs very little additional CAPEX. And battery capacity will itself continue to grow, as will the duration of batteries.
This very positive scenario has several challenges, of course, including the following:
1. The more gas we use, the more emissions we generate. Total decarbonization means either successful carbon capture or the elimination of fossil fuels from the grid. And while carbon capture might be feasible, especially if the amount of natural gas falls substantially, it is still expensive and technically challenging. So the emissions issue remains.
2. There are plenty of moving parts here, and it’s not certain that they will match up perfectly. Will sufficient gas be available? Will enough batteries be available to meet unexpected VRE deficits, or will additional batteries be needed (and paid for)?
3. The pathway from baseload power to seasonal and VLDES insurance has not yet been plotted. CCGT plants exist to see energy; peakers sell capacity insurance. It’s unclear whether CCGTs can transition to the required new business model. If not, they may just close.
4. There is plenty of political risk in this transition. It is difficult to explain that the fastest transition to a decarbonized grid means increasing the amount of natural gas capacity and keeping it for decades.
5. This transition will need a lot of detailed modeling that is more complex than the already complex task of matching and predicting supply and demand on today’s grid.
6. Given the sharp projected decline in CCGT production, will the unused capacity of what’s available be enough to manage VRE deficits? That unused CCGT capacity will be only about 5.5 percent of total U.S. annual generation in 2050—a long way from the need levels projected by the RS in the United Kingdom, for example.
All these concerns must be addressed. But looming ahead beyond Phase II are the challenges of Phase III, discussed ahead. Still, we stress that the last 20 percent of decarbonization is—according to EIA—several decades away. In the meantime, gas will likely be the key to solving the VRE variability challenge in the United States, and that’s central to the rapid and deep deployment of VRE in this country.
Beyond Phase II: Long-Duration Storage Technologies
One simple way to address variability is through energy storage. We are already seeing a massive increase in four-hour battery deployment as a complement to VRE, solving the need to shift energy between peak production and peak use periods. Are storage technologies that can solve variability emerging?
We know that successful VLDES technologies must have some key characteristics:
▪ They must be highly scalable. Mitsubishi is building the world’s biggest hydrogen store in Utah, capable of storing 300 GWh—around 15 days of production. The RS report claims that a hydrogen-based solution in the United Kingdom alone would need a store that is more than 400 times that big.[29]
▪ They must be durable, and the energy retained must not degrade, as time scales are very long. Again, the United Kingdom is looking at protection against negative supply shocks that typically happen only a few times across 37 years. Chemical batteries are therefore useless, as they lose energy over time.
▪ They must be cost effective. The massive scale implies enormous capital costs and possibly very large operating costs as well, so finding solutions that are cost effective and affordable is critical.
Energy storage technologies fall into four main clusters: electro-chemical (including li-ion batteries); mechanical (e.g., Energy Vault’s gravity storage); compressed gas (e.g., CAES); and thermal.
Of these, electro-chemical storage is currently (and for the foreseeable future) not a good fit for VLDES. These storage systems are currently not economic at more than four hours duration, and while that will extend, there is no sign that these batteries will reach months of storage over the next few decades.
Thermal storage at scale for VLDES is still at a relatively early stage of development. Current pilot projects involve both high temperature solutions such as molten salt and lower temperature experiments with heated rocks or other heat retaining materials. Both face problems of cost and scale, and it is not clear how quickly thermal energy stores will degrade over long durations. Thermal energy using manufactured solutions does offer potential economies once they become sufficiently reliable and cost competitive to deploy, but it is hard to see such storage reaching sufficient scale.
Mechanical storage is making less progress than perhaps expected. Indeed, one leading company (Energy Vault) has pivoted to other forms of storage, although it is still pursuing (and implementing) its original mechanical storage. Mechanical storage more generally has huge problems with scale and cost. Projects using old mineshafts or similar vertical gradients have limited geographies in which to work, and each project is largely bespoke: The technology being installed could be mass produced and hence see declining costs with scale, but site preparation and installation accounts will remain expensive. Pumped hydro is a different form of mechanical storage.
That’s true to a lesser extent for compressed gas storage—primarily CAES and hydrogen—as well as PHS. While all three technologies involve considerable bespoke work to prepare caverns for storage or to build a water management system for PHS, these systems can be huge, so the preparation costs can be a much lower percentage of total expenditures. They are still the leading technical options.
Pumped Hydro Storage
PHS is a well-established and widely used form of energy storage that relies on the potential gravitational energy of water. It accounts for 97 percent of energy storage today. China has already deployed 32 GW of PHS (and aims to grow PHS to 120 GW by 2030), Japan has 28 GW, and the United States 23 GW.[30] Large PHS projects are under way in Australia (the 2.0 GW Snowy 2.0 project), China (the 1.4 GW Jilin Dunhua project), and the United States (the 1.3 GW Eagle Mountain project in California).
Hydro comes in two flavors. Closed loop systems pump water from a lower reservoir to an upper reservoir during periods of low energy demand or when there is excess electricity available. When energy is needed, the water is released from the upper reservoir, flowing through turbines to generate electricity before being returned to the lower reservoir. Open loop systems don’t return the water, relying on dams to capture streams or rivers to refill the reservoir.
The technology behind PHS has existed for over a century (the first PHS plant was built in Switzerland in 1907). It is also potentially much more widely available than might be expected. A team at the Australian National University used geographic information system (GIS) data to map areas with sufficient top to bottom height differential and found 616,000 potential sites globally. In the United States, it found 244,332 sites capable of generating a total of 24.1 GW.[31]
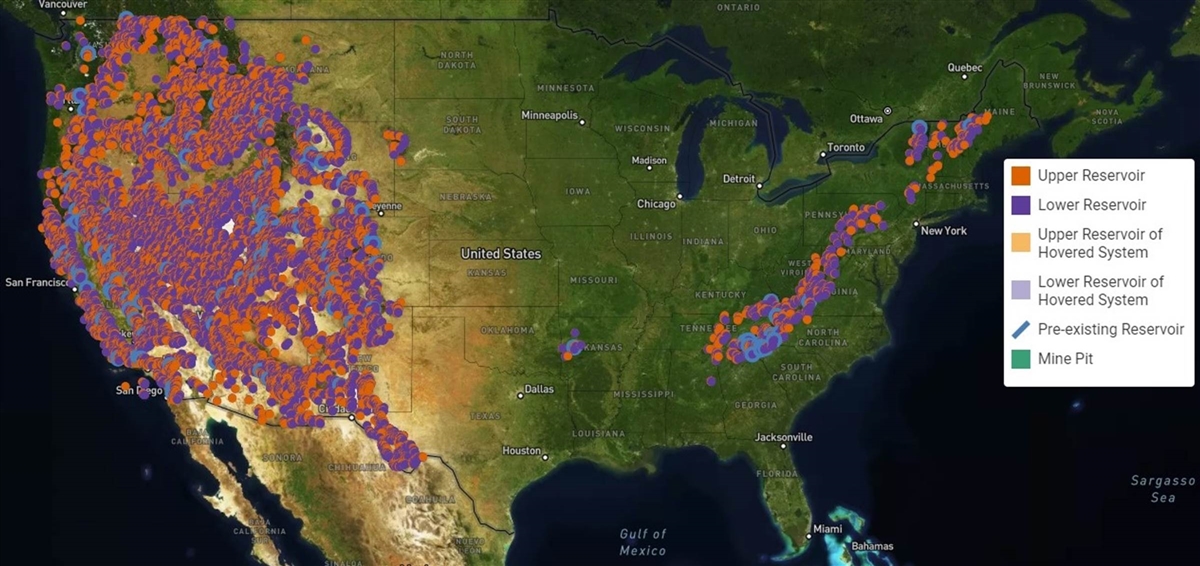
NREL’s map of existing and potential hydro sites shows that they are heavily clustered in the West and in the Appalachians. The map shows large areas where virtually no hydro potential exists, and a heavy tilt toward the West, which is of course where the water resources needed for PHS are already maxed out in many areas.
Figure 10: NREL map of potential sites for PHS in the lower 48 U.S. states[32]
Simply identifying sites that have enough height differential isn’t nearly enough. As NREL has pointed out, when assessing the potential of hydropower sites, “Technical potential encompasses technologically feasible sites; economic potential includes only those where economic benefits exceed economic costs to society; market potential consists of those where financial benefits exceed financial costs.”[33] These are very different things, and only the latter is likely to lead to dams being built and PHS developed.
NREL provides detailed cost estimates across a number of scenarios. One indicates approximate CAPEX of $7.1 million per megawatt for a medium sized (6–60 MW) facility (assuming medium costs).[34] Levelized costs typically range from $100 to $200 per MWh. That is comfortably less expensive than competing technologies, and there is no problem with duration, as hydropower can be stored more or less indefinitely at minimal operating cost.
From both a cost and technology maturity perspective, PHS is a clear winner. That’s certainly what some analysts believe.[35] PHS systems offer other advantages, including fast response times, high round-trip efficiency (70–85 percent), and long lifetimes (50–100 years). These are important advantages.
Cost advantages are important, but PHS has severe problems meeting the VLDES requirement for scale. Building or expanding dams has never been less popular than it is today: The number of large dams entering service globally has declined from about 1,500 in 1975 to fewer than 20 in 2021.[36] Conversely, 80 U.S. dams were removed in the United States for environmental or safety reasons in 2023.[37]
Both the Australian report and the NREL map identify technically feasible sites. But technical feasibility is just a start. The vast majority of these sites are in remote places where storage will never be needed, or where no effective grid even exists. And sites closer to population centers are correspondingly more challenging to navigate through the thicket of regulatory and political barriers. It takes an average of 5 years to gain a permit for one new dam in the United States, and 7.6 years to relicense one.[38] And as the International Renewable Energy Agency (IRENA)—a strong institutional backer of VRE—has observed, challenges are only becoming more difficult, as the most favorable dam sites have already been taken, and remaining sites are “usually located in less accessible locations, making construction significantly more expensive.”[39]
The median nameplate capacity of all PHS generators operating in the United States is 77.7 MW.[40] Assuming a VRE deficit of 500 TWh and a roundtrip efficiency of about 80 percent, we would need 600 TWh of PHS by 2050.[41] An average-size hydro generator can provide about 0.68 TWh annually. Starting in 2030, the United States would need to add about 3.3 generators annually over 20 years, each running 24/7, to generate the energy store needed by 2050. While multiple generators can be placed on a single dam, and large reservoirs can generate more power, adding ~68 new PHS generators totaling 6.9 GW of capacity seems implausible: The US added a total of only 2.1 GW of PHS between 2010 and 2022, at a handful of sites (mostly existing PHS facilities). Only eight greenfield projects have come online in more than a decade.[42] The nation would also incur capital costs on the order of $49 billion at current prices.[43]
PHS plants also need an adequate water supply, which is increasingly problematic in the West, as environmentalists strongly object to their impact on the land (which is why many dams are being removed). Construction times are also long (typically 5–10 years).
Even though PHS is a mature technology, innovation is possible. Some current approaches seek to address critical barriers by reducing the need for large amounts of land, dams, and water. These include the following:
▪ New kinds of closed-loop systems: These systems use man-made reservoirs that are not connected to natural water bodies, reducing environmental impacts and expanding site selection options. RheEnergize in the United Kingdom is piloting the use of heavier fluids instead of water, which reduces both environmental impacts and the height differential needed.[44]
▪ Underground PHS: This concept involves using underground caverns or abandoned mines as lower reservoirs, minimizing land use and visual impacts.
▪ Seawater PHS (SPHS): These systems use seawater as the working fluid, taking advantage of coastal topography and reducing freshwater requirements. However, the 30 MW Okinawa Yanbaru Seawater Pumped Hydro demonstration project in Japan required a costly 100 percent impermeable liner for the reservoir to prevent leakage of damaging salt water. Completed in 1999 at a cost of ¥2.2 billion ($15.5 million), it was dismantled in 2016. Still, academic analysis suggests SPHS may be feasible.[45]
▪ Pressurized rock storage: Qidnet is partnering with a utility to explore storing water under pressure in rock formations. If successful, this would dramatically increase the geologic options available.[46]
Further areas for longer-term research include innovative reservoir construction techniques, the alternative storage systems previously described, and advanced materials for turbines and generators, which could make PHS even more efficient and further reduce costs (e.g., variable-speed PHS uses advanced turbine designs and control systems to increase power output and reduces costs during charging cycles—one example is the enormous 3.6GW Fenging plant in China).[47] DOE’s Hydropower Program supports many of these activities.[48]
Bottom line: Today, PHS is both the dominant form of long-term energy storage and also a weak candidate to solve the variability problem. The technology is well known, round-trip efficiency is very high, there are no emissions, and costs are low—indeed, it is competitive with other sources of energy. But those low costs and other advantages have not led to a flurry of PHS plants in the United States. On the contrary, the negative environmental impacts have led to a slow-down or halt, not an acceleration. And given the scale of the VRE problem, it seems very unlikely that PHS will be the solution, at least in the United States.
Hydrogen Storage
Hydrogen has been proposed as a primary solution to the VLDES conundrum—it’s the choice recommended in the conclusions to the RS U.K. study for example. Hydrogen has important advantages: It can be generated at scale, can be stored essentially indefinitely at scale, is nonpolluting when burned, and it can be generated without emissions (via electrolysis powered by green energy or nuclear power).
However, hydrogen has very substantial disadvantages. Critically, the roundtrip efficiency for electricity —> hydrogen —> electricity is only about 40 percent. It takes 50 KWh of electrical energy to generate 1 kg of hydrogen, but that kilogram in turn generates only about 20 KWh of available stored energy. That inefficiency drives the second major problem: cost. Currently, green hydrogen costs about $5 to $6 per kilo, which is overwhelmingly (~85 percent) driven by the cost of the electricity used to power the process. Because input costs are so dominant, economies of scale are scarce: Even if electrolyzers became much cheaper, they would not make much difference to the overall cost of production. That’s why a previous ITIF paper argues that for almost all proposed uses, hydrogen is simply too expensive to be competitive, even with subsidies bringing down the cost of production.[49] It’s why Erik Zindel, Siemens Energy’s vice-president of hydrogen generation sales declared, “If I have renewable power, convert it to hydrogen and re-electrify it, with a total cycle efficiency of less than 40 percent, it obviously only makes sense if you’re using hydrogen as long-term storage and compensation for variable renewables.”[50]
Using hydrogen to address the ~500 TWh of VRE insurance that could be required in the United States in 2050 means producing a total of 50 billion kg of green hydrogen (at 20 KW/kg of output). That means adding ~50 new hydrogen plants over the period, at a cost of about $15.7 billion.[51] But that is just the tip of the cost iceberg. Because 85 percent of the cost is in the input electricity, and current costs of production are ~$5/kg, producing enough hydrogen would cost more than $200 billion.
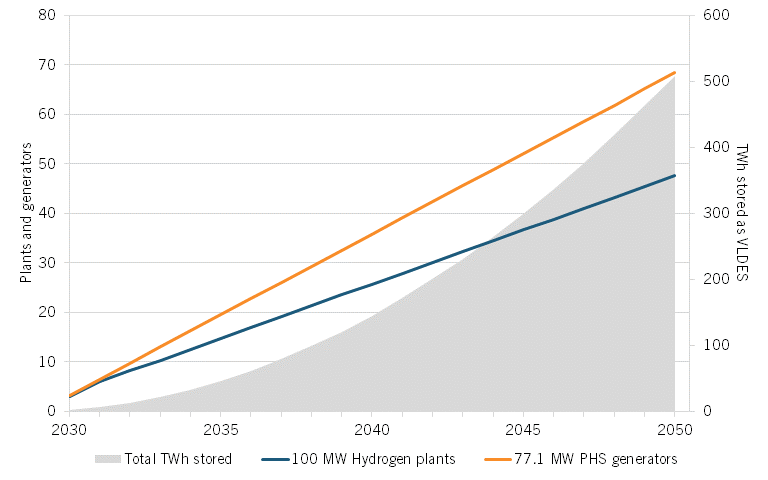
Of course, these are only back-of-an envelope calculations. We don’t know about the technology trajectory of hydrogen, but we can say that this very preliminary model generates results that show hydrogen will be a very expensive solution. Figure 11 shows schematically how additional units of PHS or hydrogen production would be needed to meet projected demand of ~500 TWh for VLDES in the United States by 2050.
Figure 11: Hydrogen and PHS necessary to meet projected U.S. VLDES demand without natural gas[52]
However, we can think about the economics differently. Variability is a long-term problem. Perhaps adopting a long-term framework for production would help. The key to cheap hydrogen is accessing cheap or free electricity: Hydrogen proponents argue that green hydrogen can be competitive if energy from solar or wind is available at low or zero cost; and low-cost VRE is a feature of VRE systems, as production spikes quite regularly, creating oversupply.
Typically, hydrogen production plants run 24/7, which spreads CAPEX over the maximum number of operational hours. But the real killer for hydrogen is OPEX—specifically, the cost of electricity inputs. A low-utilization plant operating perhaps 30–35 percent of the time—when VRE sources are oversupplied and hence free or very cheap—might be much more attractive, and could potentially produce hydrogen at much lower cost.
If this environment existed, CAPEX would become more important as OPEX costs fell sharply, so economies of scale (e.g., in electrolyzers) would become potentially important. Any standardization of storage (e.g., ways to assess new storage sites and prep them for hydrogen storage) would also impact costs, perhaps dramatically.
This is essentially the model proposed by the RS. However, their solution relies on deliberately creating long periods of close to zero electricity costs, which, from the perspective of VRE investors, would be disastrous. Perhaps these problems can be offset by the kind of capacity payments that fund peakers today, but it is hard to see how investors could be attracted to this model at sufficient scale.
Bottom line: Hydrogen can scale and is not limited to specific geographies, but it is expensive—and without extremely low-cost electricity as input, it won’t get much cheaper. It also suffers from potential emissions problems via leaks, and is a very inefficient way to use electricity, leaving aside issues of transportation.
Compressed Air Energy Storage
Dating back to the 19th century, compressed air technologies were critical for the development of new metal working technologies: new pneumatic drilling tools for example transformed tunneling (e.g., the Mont Cenis tunnel through the Alps, which was completed in only 14 years). In Paris, a compressed air network served more than 10,000 customers for more than 100 years.
However, those days are long gone. Today, two CAES plants are in operation globally, one in Germany (built in 1971), the other in the United States (1991). Both demonstrate low round-trip efficiency (40–42 percent and 51–54 percent, respectively). Both operate at 50–70 bars of pressure (around 10 times the pressure in a bicycle tire). Because energy density decreases with rising temperatures, both plants dump excess heat during the charging cycle—a significant source of energy loss. Decompression generates the same problem in reverse: The temperature of decompressed air falls, so components are at risk of freezing; hence, air must be warmed as it is decompressed. Currently, both CAES plants use fossil fuels for processes.[53]
Both CAES plants also use multi-stage compression, which progressively increases the pressure and cools the air after each compression stage, using circulating water that is pumped to a cooling tower and then released into the atmosphere.[54] Efficiency can be improved by using the waste heat of compression to reheat the compressed air upon expansion—a method known as Advanced Adiabatic CAES or nonfuel CAES. This approach could raise efficiency to around 70 percent, but may not be applicable when CAES is used for long-duration storage, as it is difficult to store the waste heat over long periods.[55]
CAES has significant advantages. Unlike PHS, it has minimal environmental impacts, and doesn’t require the flooding of land and damming of rivers. And unlike hydrogen, leaks have no adverse environmental consequences, while efficiency is better. It uses similar geologies (i.e., salt caverns or aquifers) to store large quantities of compressed air underground.
CAES has some major drawbacks. First, much like hydrogen, the cost of CAES is dominated by the cost of input electricity; low efficiency means high operating costs. Second, the turbines used in CAES are a mature technology. While improvements continue to be made, we are not on the rapid improvement part of the learning curve. Third, low pressure implies very large storage reservoirs, which are more expensive to create and maintain, and also scarcer. But using higher pressures would exacerbate the heating problems and make the round trip less efficient. Fourth, CAES itself—despite the long history of compressed air—is not a fully developed and tested technology. It is somewhat behind hydrogen in terms of deployment for storage purposes, and is, of course, decades behind PHS.
Bottom line: CAES may well have more room for improvement than hydrogen, especially when it comes to efficiency, but proof of concept at scale is still needed. The current low energy efficiency suggests that the costs would likely be more similar to hydrogen than to pumped storage. Current use of fossil fuels for thermal management doesn’t help to advance the case.
Box 4: Geologic Storage
Both hydrogen and CAES will need to use geological storage if they are to be useful for VLDES, given the scale of storage needed. Initial projects will likely focus on low-hanging fruit where conversion to storage is easier: salt caverns, aquifers, and abandoned mines and wells. Salt caverns are the primary option because they are self-sealing, the size and often shape of the caverns can be customized, and there is substantial cavern capacity near the petroleum industry hubs along the Gulf Coast.[56]
DOE has supported detailed analysis and modeling of these options, including by developing the Hydrogen Geological Storage Model, a prototype analytical framework highlighting the major components of a “gate-to-gate” large-scale hydrogen storage facility.
Figure 12: Geologic storage possibilities in the United States[57]
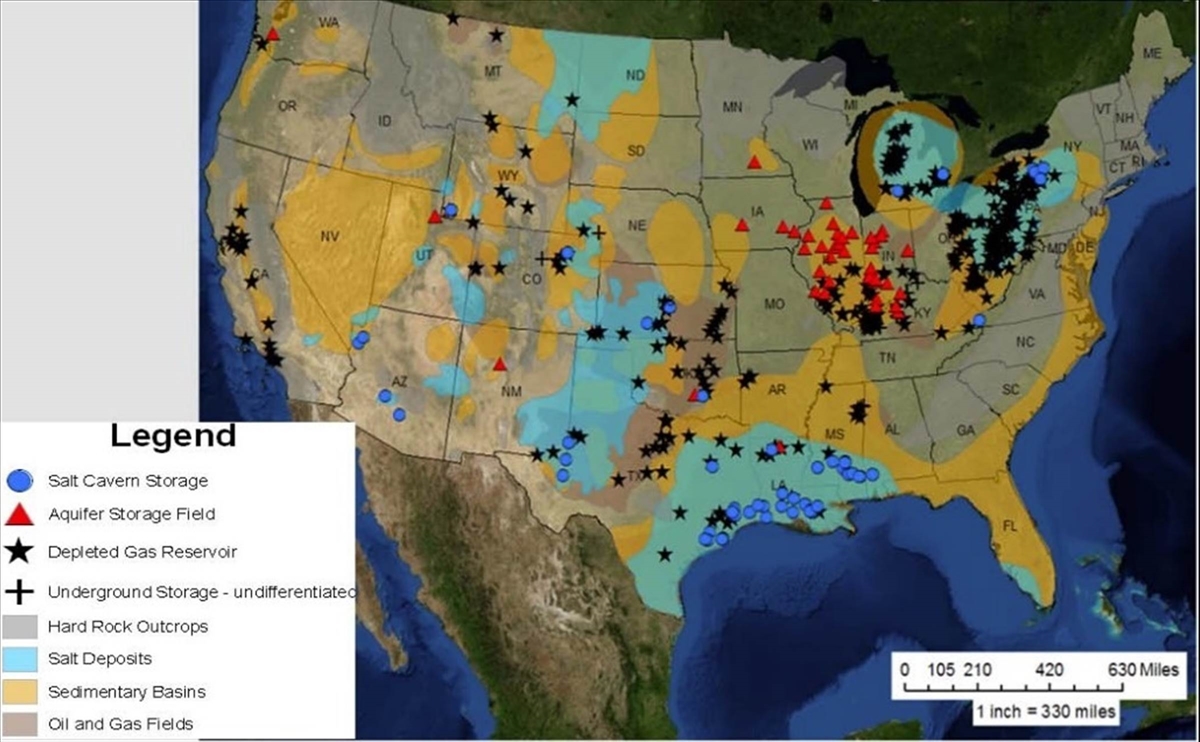
Depleted oil and gas reservoirs are much cheaper to develop—a levelized cost of $0.04 and $0.08 per kg, respectively, for hydrogen storage (in 2007 dollars)—but both have obvious physical drawbacks in that they may leak (hydrogen leaks can have devastating emissions impacts), may contaminate critical water supplies, and are concentrated in a few regions. Salt caverns, where costs are estimated at $1.60/kg in 2007 dollars ($2.40/kg in 2024 dollars), are therefore the option of choice for demonstration projects now under way or being developed in the United States.[58] But salt caverns are also only available in limited locations.
Bottom line: This review of available technologies suggests that while PHS is cheap and available, it is also impractical even beyond Phase II because it cannot be scaled sufficiently. In contrast, hydrogen and CAES could perhaps be scaled, costs might be cut, and they could emerge as possible solutions given that we have decades in which to improve performance before the end of Phase II looms. Other solutions could also emerge that would mitigate or eliminate the need for VLDES altogether: It’s possible that fusion will become commercially available or—perhaps less ambitiously—that geothermal will become a scalable alternative.
Until then, further progress in hydrogen and CAES innovation will be needed, including much better understanding of ways in which growing VRE penetration and associated curtailments can help to power up the necessary storage.
Markets and Revenues
The VRE challenge is only partly technical. It has an important economic component as well. For any variability solution to be sustainable, it must provide enough economic value to pay for its deployment plus a reasonable profit. That value must reflect actual services provided to the power system. While storage is currently used for at least 13 different functions (and hence has at least 13 revenue streams attached to it), they all fall into four fundamental buckets:
1. Ancillary services: Maintain the proper flow and direction of electricity, address imbalances between supply and demand, and help the system recover after a power system failure.
2. Increased system level utilization: Stored energy can be used to facilitate the use of other power system assets (e.g., wind resources, which would never be installed if the system could not meet needs when wind is low). The discussion of gas plus storage is one example.
3. Arbitrage: Storage can shift energy temporally (and geographically), which creates opportunities to exploit price differences in the demand for energy over time, while also helping to create a smoothly functioning market (most of the time).
4. Insurance: This is to guard against seasonal shifts and unexpected deficits.
Managing power quality on the grid is not a relevant cluster of functions for VLDES; that’s handled by chemical batteries and flywheels, which provide short bursts of energy on demand and allow the safe storage of similar energy spikes at other times.
VLDES could provide services for arbitrage, a function that can be found at various locations on the electricity delivery chain, including end users. However, arbitrage is currently focused on much shorter durations; longer-duration arbitrage opportunities on the grid are still barely nascent. This is in contrast to the very deep and well-established markets for energy arbitrage in natural gas and oil, where long-duration contracts are well understood and widely used for hedging and other purposes. As countries electrify, end users will likely be more interested in hedging electricity prices and hence be offered opportunities for longer-term arbitrage, but arbitrage does not seem likely to become a major revenue stream for VLDES, at least over the medium term and perhaps longer.
Energy storage also helps to make a renewables-heavy system more feasible. New renewables coming onto the grid are increasingly projects that combine solar and batteries; that way, solar can extend the timeframe across which it can contribute to the grid rather than simply waste energy during peak insolation and be of only limited use during peak demand. That makes more solar farms economically viable. However, this has little to do with VLDES. There is no business case for project-level storage that can adjust to seasonal variation in solar.
There is one further potential revenue stream: insurance. Currently, grid insurance is focused almost entirely on the “peaking function”: providing energy when regular sources of energy are maxed out. Peaker plants operate for only a short period to address unexpected demand or a failure of supply. This short-term function will increasingly be filled by batteries, which are simply becoming cheaper and cleaner than peakers. That kind of gap won’t be filled by VLDES. But there are also predictable gaps between the energy that VRE can supply in a given region and anticipated levels of peak demand, especially on a seasonal basis: Solar simply generates less power in winter, so a solar-heavy grid must find that missing energy from somewhere. Although NREL currently expects these gaps to be filled by gas plus storage, they could be filled by VLDES if VLDES is already implemented for insurance reasons, which would likely make its use much cheaper than standard peaker plants, and could perhaps make it competitive with other baseload options. It could even perhaps be competitive with CCGT.
In this scenario, it is the existence of VLDES that facilitates potential new applications. In some cases, these may even displace baseload power because these applications can draw on energy that is already stored, paying only the marginal costs of storage replenishment. However, its core function remains the provision of insurance for the grid, delivering energy when VRE and other alternatives cannot. That is the core case. It’s possible that some forms of storage—such as iron-air batteries, or perhaps new forms of pumped hydropower—might become competitive with baseload power. That’s certainly Form Energy’s strategy. Success there would reduce the VRE share of power generation for the grid, and hence depress demand for VLDES. But the meat of the matter is that VLDES must become an economically feasible source of insurance for the grid.
Who Pays and How?
In the end, electricity users will end up paying to close any VRE deficits. Those costs will be tacked onto the cost of delivering VRE to customers, and may—or may not—end up as a line item on a customer’s bill.
The question is how to ensure that the grid as a whole pays the price necessary to keep the lights on. This will not be simple. Every element in the grid will have cost avoidance reflexes triggered by being asked to pay for something that is not immediately useful or even immediately necessary. And unfortunately, corporate incentives are very much weighted toward avoiding costs today and kicking the reliability can down the road to a successor CEO.
However, regulators already impose contingency requirements on utilities; these are based on assessment of a remarkably wide range of possible failure points (although these assessments tend to focus heavily on problems with one or perhaps two individual grid components, not systemic challenges such as VRE variability).[59] Overall, U.S. grids aim to build spare capacity to about 15–20 percent of peak demand.[60] But a grid that were to become much more VRE-dominated would require additional reserves.
Box 5: Approximate Reserve Targets on Major U.S. Grids
All grids have a reserve margin calculated as a percentage of peak demand. These both vary by grid and also vary over time. The following are therefore illustrative targets, not hard values:[61]
§ ERCOT (Electric Reliability Council of Texas): 13.75 percent
§ California ISO (CAISO): 15 percent
§ Midcontinent ISO (MISO): 15–20 percent.
§ PJM Interconnection: 16.1 percent
§ New York ISO (NYISO): 16–17 percent.
From the perspective of the utilities, adding contingency reserves (or VLDES insurance) is simply a matter of regulators mandating the reserve, figuring out the best way to build it, and then passing the cost on to the consumer. While federal funding could help to address the substantial CAPEX costs of a major VLDES rollout, operating costs would almost certainly fall on utilities and their customers.
Sharply increasingly contingency reserves could be challenging. Recent studies show that electricity prices are already very sensitive to the amount of contingency reserves required by regulators, and high energy prices inevitably attract political pushback.[62] However, there should be no sudden sticker shock: VRE penetration will grow over decades, and contingency requirements will grow in parallel.
Payments could come through an alternative channel: market prices. Electricity markets today are largely dominated by day-ahead prices. In that environment, the energy provided by VLDES during times of scarcity would be extremely valuable: On the ERCOT grid in Texas, where winter storm Uri created massive scarcity, prices peaked at more than $9,000 per MWh and stayed at those elevated levels for a considerable period (ERCOT has since imposed a maximum price of $5,000 per MWh). Prices in the United Kingdom during the energy crisis that followed the Russian invasion of Ukraine peaked at more than £4,000/MWh ($5,300/MWh). As VRE dominance grows, there will be periods during which VLDES will be extremely profitable, and these deficit periods could last a long time on a VRE-dominated grid.
However, relying on the electricity market to pay for VLDES seems misguided. It will be a high-cost resource that would need to charge extremely expensive prices when its customers—the utilities—were desperate. For example, the levelized cost for hydrogen at large scale is approximately $441 per MWh. This is more than double the average cost of standard short-duration energy storage, while nonstorage energy is even cheaper. But in a crisis, prices paid on the open market would be far more than this. It’s imaginable, therefore, that the cost of building VLDES could—over very long periods—be substantially offset by the very high sale price of VLDES energy in conditions of prolonged scarcity. But it’s hard to imagine that investors would invest the enormous amounts required, based on the hope that markets would turn sufficiently in their favor some unknown time in the future, and that politicians and regulators would also not enforce price controls (as ERCOT is already doing).
If markets won’t work here, funding must come from an insurance model that is mandated by regulators, which builds an appropriate level of VRE insurance into the operating budgets of electric utilities, and those costs would then be passed that cost on to customers. Instead of exploiting potentially catastrophic price spikes, those additional costs would be normalized as part of the cost stack for electricity. The costs would differ for each regional grid.
This is what we do today with contingency reserves, and there are federal examples as well, such as the U.S. National Petroleum Reserve. It’s how we will increasingly pay for gas retaining capacity at CCGT gas plants as they transition from high usage today to backup tomorrow.
DOE and Electricity Storage
DOE’s Electricity Storage Division operates within the Office of Electricity (OE), running multiple programs and participating in collaborations across the agency and beyond.
Key programs include the following:
▪ Energy Storage Research, Development, and Demonstration (RD&D) is aimed at extending durations and reducing costs of electricity storage, developing analytic models, and addressing equity issues.[63] The RD&D program extends to pilot and demonstration projects in conjunction with many utilities and state energy organizations. It appears that this substantial program is largely focused on immediate needs of the grid and its operators.
▪ Grid Storage Launchpad provides access to a world-class research center to lower the barriers to innovation and deployment of grid-scale energy storage.[64] The facility enables independent testing of next-generation grid energy storage materials and systems under realistic grid operating conditions.
Cross-cutting DOE collaborations include the following:
▪ Energy Storage Grand Challenge (ESGC) aims to develop and domestically manufacture energy storage technologies that can meet all U.S. market demands by 2030, while OE coordinates department-wide activities to help develop and commercialize next-generation energy storage technologies.[65] ESGC has four tracks:
– Investments, commercialization, and scale-up
– Manufacturing and supply chain innovations, workforce
– Markets and valuation
– Technology development
VLDE’s work falls under markets and valuation, but does not appear to be an active concern.
▪ Long-Duration Energy Storage Earthshot targets a 90 percent reduction of costs within a decade for grid-scale energy storage, focused on systems that deliver 10+ hours of duration.[66] This is, of course, only partially related to VLDES. Projects include Storage Innovations (SI) 2030, which aims to develop specific and quantifiable RD&D pathways to achieve Long-Duration Storage Shot targets.[67]
▪ DOE’s Global Energy Storage Database, maintained at Sandia, contains information about energy storage projects around the globe, and provides a useful starting point for more detailed monitoring and assessment of international energy storage developments.[68]
▪ National Lab research project focused on multi-day storage is led by Argonne with Lawrence Berkeley and PPNL.[69]
Beyond OE, the Office of Commercial Energy Demonstrations (OCED) has $505 million available for LDES demonstration projects.[70] It recently awarded four projects and selected a further five for negotiation.[71] However, as OCED is focused on funding demonstrations for technologies and markets that are on the cusp of commercial viability, none of these projects are focused on seasonal storage. OCED is also funding the hydrogen hubs program, which again focuses primarily on blue hydrogen for immediate use.
The Hydrogen and Fuel Cells Technology Office (HFCTO) has developed an ambitious plan to ramp up hydrogen production for use in the United States.[72] Even though many aspects of the plan are focused on shorter-duration uses for hydrogen, LDES is one of the targeted high-impact uses for hydrogen, and much of the work undertaken will be relevant if hydrogen eventually emerges as the main energy source for addressing long-term VRE deficits.
Finally, DOE also supports work on carbon capture, which will be important for emissions reduction if natural gas is used—as we expect—to plug VRE-driven deficits in electricity supply. OCED is deploying $2.5 billion on carbon capture demonstration projects, of which $890 million has been awarded to three sites in Texas, North Dakota, and California.[73]
Clearly, driven by the Bilateral Infrastructure Law and the Inflation Reduction Act, there has been an enormous ramp-up of activity related to electricity storage at DOE. It is, however, fair to say first that the vast majority of this activity is focused on durations shorter than seasonal storage, and second that there is no central hub or institutional pillar focused on seasonal storage and beyond.
Research Conclusions
We know that VRE introduced variability into electricity supply, and that substantial insurance against possibly prolonged supply deficits will be needed as the grid becomes dominated by VRE. We also know that this need will emerge over a long period of time, and that conditions during Phase II (~35–80 percent decarbonized grid) will be different than Phase III (80–100 percent decarbonized). While EIA estimates suggest that Phase II will be reached in the early 2030s, they offer no timeline for when we will reach Phase III, except that it will be some time after 2050. NREL’s scenarios that describe what would be needed to decarbonize to different levels tell us nothing about when those scenarios might land. Still, some conclusions are already apparent:
▪ The growing variability of supply driven by VRE is a new challenge for the grid, with predictable and unpredictable components. As VRE grows, seasonal differences matter more and so do unpredictable events such as wind droughts as well as wider annual variation in both solar and wind.
▪ The scale and profile of deficits will vary substantially by region and energy technology, but very preliminary estimates from the extensive modeling work of the RS in the United Kingdom suggest that on a 100 percent VRE grid, dominated by wind power, the deficit will be on the order of 20–25 percent of the amount of energy produced annually by VRE. A more solar-dominated grid would have a different profile, and so would one where there is much greater use of firm nonemitting power such as nuclear or geothermal.
▪ It’s useful conceptually to differentiate three phases in the decarbonization of the grid:
– Phase I: Over the next decade and perhaps much longer, VRE penetration will grow but fossil fuels will remain dominant. Today, wind and solar are less than 20 percent of generation, according to EIA; this phase will likely last until they are ~40 percent. Existing flexibility within the grid will, with some modifications and the addition of battery storage, handle growing variability.
– Phase II: Existing flexibility becomes less and less sufficient; gradually, gas transitions from its current role as baseload power to dispatchable power, as VRE penetration increased from ~40 percent to ~80 percent.
– Phase III: Complete decarbonization, as very limited gas for peaker plants is either managed through carbon capture or addressed through carbon offsets. (>80 percent penetration.)
▪ There are useful ways to mitigate the variability problem. These include better long-distance interconnection to provide energy from locations not suffering from deficits. However, long distance interconnection remains a challenging governance problem, and DOE estimates suggest that even if the size of the grid doubled or tripled it would not be enough to address long-duration VRE deficits. Especially during Phase I, many of the challenges presented by VRE can be handled using tools that enhance the existing flexibility of the grid—for example, demand management, improved interconnection, VPPs, and microgrids.
▪ VRE deficits could be also partly mitigated by replacing some VRE with firm zero-emission power. In France, nuclear provides ~70 percent of electricity generation, so it will have a correspondingly smaller VRE challenge. Other new baseload technologies would have the same effect. But the deficits created by using VRE will not be fixed; it’s just that the amount of VRE will be reduced and so will the scale of deficits.
▪ Overbuilding VRE also changes the equation. The RS recommended that the United Kingdom overbuild VRE by ~30 percent, which directly reduces the time and scale of events during which the grid is unable to meet demand. However, deliberately overbuilding is challenging politically, and could have a highly destructive effect on VRE markets (long periods when prices for VRE are at zero or below will not encourage further private sector investment in VRE).
▪ Solar and wind have largely complementary meteorological profiles, both across days and across seasons, so an appropriate balance between wind and solar in a given location will reduce VRE deficits. The United Kingdom is building solar even though the climate is not optimal for that.
▪ Current candidate technologies for addressing Phase III variability all suffer from significant problems. These include the following:
– Energy inefficiency: Currently, hydrogen round-trip efficiency for power generation is less than 40 percent, so 2.5 KWh of electricity is needed to produce 1 KWh of usable stored electricity. CAES is not much better today. PHS is, in contrast, highly efficient, returning 70–85 percent of input electricity (partly because it uses gravity to do much of the work).
– Cost: Partly because of efficiency issues, green hydrogen is very expensive, and cost reductions rely very heavily on cheaper input electricity. Economies of scale don’t matter much unless input electricity is cheap or free. CAES is not yet demonstrated at sufficient scale to test cost assumptions, and it too will rely on cheap input electricity. PHS is a mature technology that works very well at low cost. Further alternative technologies have not proven that they can be cost competitive.
– Storage options: Realistically, only salt caverns and aquifers offer the scale and access that would allow development of long-term storage at sufficient scale. Aquifer storage faces inevitable opposition because of groundwater concerns. Salt caverns are practical, but are relatively concentrated geographically. And the enormous above-ground storage needed for some other technologies (e.g. mechanical storage) to operate at sufficient scale also seems impractical.
– Environmental concerns: Despite the multitude of potential sites, building new PHS at any scale is extremely challenging to say the least. The United States is currently building about minus 8 dams annually (more dams are being removed), and there is intense opposition to any further PHS-driven disruption of local environments. Salt caverns are an easier sell, but there are still concerns about leaks and aquifer contamination; leaked hydrogen emissions in particular are very damaging, and green hydrogen also requires about 10 liters of water to produce each kilo of hydrogen. CAES suffers from the need for heating and cooling during the storage and subsequent powering phases. That’s currently provided by electricity from fossil fuels. CAES also would require very large storage volumes at relatively low pressure; higher compression makes the thermal management problem worse.
– Technical limitations: Most new grid-scale energy storage uses short-duration li-ion batteries. While some other technologies that have longer planned durations may gain traction (e.g., Form’s 20-hour iron-air batteries), and batteries will probably continue to become cheaper, electrochemical batteries that are suited as stand-alone long-duration storage are not within reach.
▪ The economics of energy storage are different from the economics of energy production. Energy can be stored slowly and released more quickly, making it possible to use cheaper electricity when charging. This may be important for electricity-intensive solutions such as green hydrogen.
▪ Natural gas will play a central role in addressing VRE deficits, in conjunction with batteries. Currently, CCGT plants operate at close to peak capacity during periods of peak demand—but that lasts only a short time. On average, CCGTs operate at about 57 percent of total capacity annually. Peaker plants almost all run at less than 10 percent. So CCGT and peaker plants could provide substantial available capacity for off-peak electricity generation. In conjunction with some other mitigation strategies, natural gas could therefore successfully address VRE deficits flexibly, efficiently, and at low cost for decades—though of course with associated emissions. That is the primary Phase II solution, and is reflected in DOE projections summarized in figure 9.
▪ The available capacity from gas generators can work together with short-duration batteries to address both predictable and unpredictable VRE deficits. Batteries are being added now to enable diurnal power shifting as solar and wind come onto the grid, making these resources immediately more useful and reducing overall system costs. But those batteries don’t always have to be charged by wind or solar; during periods of low VRE supply, these batteries can be charged during off-peak hours using natural gas. That in turn makes the system as a whole more stable. More batteries will be added as VRE penetration grows, so the capacity of gas plus batteries to address VRE deficits will grow at the same time.
▪ Gas-based solutions work until there isn’t enough gas-generating capacity relative to VRE. The “last 20 percent problem” represents an approximate tipping point where existing gas resources can no longer fully address VRE energy deficits, and where the remaining emissions become unacceptable. That’s why the RS study—which focuses on a 100 percent decarbonized grid—emphasizes the need for massive hydrogen production and overbuilding as key solutions. There will likely not be a sharp tipping point, just an understanding that keeping the lights on will become an increasingly difficult problem as VRE penetration grows to very high levels.
▪ VRE deficits are fundamentally a very long-term problem, one that will become challenging only when VRE is a substantial share of the grid. Under most pathways, natural gas will address that problem successfully during Phase II, which may last for decades (depending on the pace of VRE penetration). So alternatives to gas (or gas+batteries as VRE penetration grows) are not needed now, and likely won’t be needed until 2050 or possibly well beyond that.
▪ Because gas will be integral to VRE rollout, carbon capture will be important. Otherwise, we will simply be accepting whatever emissions are needed to balance VRE production with gas, at least during Phase II.
▪ Finally, the long timelines involved have important implications:
– There is no current need to roll out VLDES demonstration projects using current technologies. These technologies are far from competitive with gas on cost (and all other factors except emissions), and will therefore simply not be adopted at scale in the near term.
– Specifically, hydrogen as long-duration storage will not be economically viable for decades without subsidies that will cost far too much, and given the scale of storage needed to address VRE deficits directly, subsidies will become prohibitively expensive.
– Long timelines also make using electricity to power hydrogen or CAES storage more feasible, because they can reduce the cost of electricity inputs, which dominate both hydrogen and CAES operational costs. Finding ways to tap VRE when production is curtailed (and solving problems related to the cost of electricity transmission to hydrogen/CASES plants) may be even more important than innovating to improve round-trip efficiency or reduce costs.
– Long timelines to deployment also mean we have a long period before us during which we can develop and improve the storage technologies that will likely be needed to solve the “last 20 percent problem.” This could include work on hydrogen and CAES, and newer technologies as well. And given the centrality of gas in coming decades, further investment in point-source carbon capture would be another useful research pathway. We can therefore refocus on technologies that are in the earlier stages of development, because they will only be needed many years into the future, not today or in the near term. That is an opportunity to steadily fund the technologies we will need, and to better understand how long timelines can affect their costs.
Policy Recommendations
Electricity storage is already having a moment. The United States added more than 6.5 GW of capacity its grid in 2023, and EIA expects a further 9.6 GW in 2024. But all of this is short-duration storage of four hours of less, and those short-duration batteries are not a step along the pathway toward longer-duration storage. They use different technologies for different purposes. Understandably, VLDES is not a problem for today, except in the sense that solutions to the last 20 percent problem cannot wait for the time when that problem becomes manifest—and disastrous. A realist policy approach to VRE deficits is as follows:
1. Focus on long-term solutions to a long-term problem. Current efforts to build hydrogen hubs or deploy CAES should be seen as unrelated initiatives, aimed at different markets.
2. Shift resources from seeking to deploy unrealistic storage solutions now, to earlier-stage research and development (R&D). Long-term problems require government support and guidance. No private sector investor will focus today on solutions that will be deployed after 2050.
3. Fold the eventual cost of addressing VRE deficits into the overall costs of VRE-dominated systems. Doing so is normal for electricity grids, where specified contingency reserves are mandated by regulators. VRE deficits require an insurance function, rather than markets that rely on the exploitation of VRE-related price spikes in spot markets.
4. Proceed on four tracks for R&D and commercialization, focusing on a) improved technologies, b) transmission, c) better business models and information, and d) new markets development, as follows:
a. Improved technologies: The long pathway to decarbonization that is before us means there will be a long period during which we can improve existing technologies. Better and cheaper electrolyzers will help hydrogen, new technologies for sealing caverns will help several technologies, and alternative approaches to thermal management could cut CAES costs. That long pathway also means that highly innovative technologies can be supported—we don’t have to focus on technologies that could be deployed today.
b. Transmission: Better transmission and improved interconnection have many benefits, but they can also help to reduce VRE deficits in connected regions on a systems basis by providing better balancing of different energy sources while providing direct support for regions that are experiencing VRE deficits. Transmission improvement is already, of course, the focus of intense activity.
c. Better business models and information: Future decisions about generation will determine whether the lights stay on—and those decisions will be intensely information driven. Government should therefore ensure that sufficient information is either gathered or developed on which to build new models or extend existing ones.
For example, the electricity industry must help drive meteorological data collection and development, rather than simply acting as end users. Projections of both predictable and unpredictable future deficits should be built on long data series that are also geographically granular; just using averages over time and across geographies is potentially disastrous in a VRE-heavy grid.
Business models also should differentiate between the three phases of VRE deployment previously described. Phase I models are already in operation and are being negotiated between utilities, generators, and grid operators, with support from the federal government via EIA, NREL, and others, as well as the analytic capabilities of EPRI and other industry collaboratives. Phase II models are only now starting to emerge, and DOE should dedicate specific resources to developing dynamic models that adjust to growing VRE penetration. In part, this means adjusting for the different timeframes that govern VRE deficits. For example, hydrogen as storage looks very different when powered by the grid and working 24/7, versus against hydrogen powered by curtailed VRE that is co-located with hydrogen production, over long periods of time. Phase III models will need to consider all possible ways of decarbonizing the last 20 percent of the grid—but that task is not urgent, and work done now will likely have to be redone with different technical, economic, and political parameters when we reach that transition point some decades in the future.[74]
VRE deficits will need their own modeling, which will, of course, vary regionally. It’s possible that NREL can develop a universal model with sufficient variables that would work for all U.S. regions, but developing such a model would need to become a policy priority.
The challenge of VRE is one that every grid will eventually face (we hope). Some countries are decarbonizing very rapidly, so the United States (and DOE specifically) should emphasize both as policy and institutionally the need to track and adopt the best tools and data around the globe. Relying only on international bodies such as IEA and IRENA won’t be sufficient.
d. New markets: Currently, there are no markets for VLDES as such. There are no buyers and therefore no sellers. As the potential VRE deficits grow, regulators will need to help develop appropriate mechanisms to fund VRE. Contingency planning will need to drive these new insurance markets.
e. DOE should help to develop models that regulators can use to ramp up VRE-related contingency payments at an appropriate rate, helping to smooth the transition first from gas as baseload power to gas as contingency power and then the eventual phaseout of gas altogether during the last 20 percent phase of decarbonization. Without that, we face a tragedy of the commons where each stakeholder finds it advantageous to avoid costs that are necessary for the system as a whole. The models and data previously outlined will be critical for that purpose.
5. DOE should step forward to lead work on VRE deficits. Doing so will require several initiatives:
a. Different Phases: DOE should clearly distinguish between phases I, II, and III. It should also differentiate between short-term storage (e.g., for grid management), medium-term storage (up to ~20 hours), and VLDES for seasonal and inter-annual insurance (>2,000 hours). Current programs do not identify these phases as generating separate sets of problems.
b. Developing appropriate models for addressing VRE deficits requires complex analytic work: DOE should build on the existing modeling work of NREL to create focused models that can be used by utilities, regulators, and investors, working in collaboration with other stakeholders. For example, EPRI’s Bulk Energy Storage Program does include work on VLDES solutions and models.[75] Modeling should include work based on the unique timelines of VRE deficits and VLDES technologies.
c. Learning from others: Other countries and regions are further down the VRE deployment curve than the United States, and hence face VRE deficit challenges on a more urgent basis. DOE should explicitly develop a systematic program to monitor international developments in this area. It could perhaps report to stakeholders annually on its findings.
d. Technology monitoring: Similarly, DOE should also devote resources to monitoring technical developments around the globe in relation to VRE deficits and VLDES technologies. This ongoing technology assessment should be integrated into the modelling program and annual reporting.
e. Innovation and technology development: Once variability is recognized as a specific target area, DOE should devote appropriate resources to technology development. DOE should explicitly maintain a comprehensive assessment of technological barriers to VLDES deployment—for example, an ongoing assessment of turbine technology, or of tools for mapping and preparing possible storage sites in salt caverns. Some of this work currently underpins the Annual Technology Baseline program, but is not collated into a working technology map or tuned to the needs of VLDES development. Technologies for ensuring (and proving) that caverns in use remain sealed should be a particular responsibility (some of this work is already under way at relevant DOE offices—e.g., PHS activities within the Water Power Technology Office).
f. Institutional development: Variability will become more and more important as VRE increasingly dominates the grid. We must make sure this challenge is fully represented within DOE, and that work on it is sufficiently insulated from other (bigger) programs. Accordingly, we recommend that DOE establish a separate program for addressing VRE variability, including research on VLDES technologies (in collaboration with other offices) and in alignment with work on carbon capture. The program should have its own budget and staffing, perhaps (but not necessarily) located within EERE.
g. DOE is the not the only relevant federal agency and addressing VRE deficits will likely require collaboration between multiple stakeholders including utilities, Regional Transmission Organizations, nonprofits such as EPRI, and others. The new office could become a useful convenor and collaborative space for those conversations.
As renewables grow in importance, their variability will pose a growing problem. Phase I is already being addressed, Phase II will require new ways to implement solutions primarily through the use of gas and short-term batteries, and Phase III remains an unanswered challenge, but one that is decades in the future. The multiple solutions described in this paper can play a range of roles in a complex world where different solutions will be optimal in different regions. What is, however, clear is that VRE variability is a growing but long-term challenge, and it is time to develop VLDES and other solutions within a long-term strategy for managing it.
About the Author
Dr. Robin Gaster is research director at ITIF’s Center for Clean Energy Innovation, president of Incumetrics Inc., and a visiting scholar at George Washington University. Dr. Gaster’s primary interests lie in climate, economic innovation policy, metrics, and innovation assessment. He has worked extensively on climate, innovation and small business, regional economic development, and transformation in education.
About ITIF
The Information Technology and Innovation Foundation (ITIF) is an independent 501(c)(3) nonprofit, nonpartisan research and educational institute that has been recognized repeatedly as the world’s leading think tank for science and technology policy. Its mission is to formulate, evaluate, and promote policy solutions that accelerate innovation and boost productivity to spur growth, opportunity, and progress. For more information, visit itif.org/about/.
Endnotes
[1]. VRE covers all kinds of renewable energy—notably solar and wind—where generation varies because of outside factors (e.g., the wind blows less). There is also baseload energy—from plants that run 24/7 (e.g., nuclear); and dispatchable energy—energy that can be dispatched as needed (e.g., gas).
[2]. Robert D. Atkinson, Robin Gaster, and Ed Rightor, “Beyond Force: A Realist Pathway Through the Green Transition” (ITIF, July 10, 2023), https://itif.org/publications/2023/07/10/beyond-force-a-realist-pathway-through-the-green-transition/.
[3]. Power terminology. The capacity for power generation is the maximum amount of electricity that a plant can produce, measured in kilowatts (KW), megawatts (MW) (1,000 KW), gigawatts (GW) (1,000 MW), and terawatts (TW) (1,000 GW). Actual power produced is called power generation, and is measured as the amount of energy produced in a given period of time (usually one hour). So a 1 KW power source generate 1 KWh per hour in use at maximum capacity. Power generation is measured in KWh, MWh, GWh, and TWh.
[4]. DOE Office of Energy Efficiency & Renewable Energy, “Confronting the Duck Curve: How to Address Over-Generation of Solar Energy,” October 12, 2017, https://www.energy.gov/eere/articles/confronting-duck-curve-how-address-over-generation-solar-energy.
[5]. EIA, “Annual Energy Outlook 2023,” calculated with data from tables 8 and 16, accessed September 1, 2024, https://www.eia.gov/outlooks/aeo/data/browser/#/?id=8-AEO2023&cases=ref2023&sourcekey=0.
[6]. Iain Staffell and Stefan Pfenninger, “The Increasing Impact of Weather on Electricity Supply and Demand,” Energy 145 (December 1, 2017), https://doi.org/10.1016/j.energy.2017.12.051. Chart used with authors’ permission.
[7]. Paul Denholm et al., “Examining Supply-Side Options to Achieve 100 percent Clean Electricity by 2035,” DOE Office of Scientific and Technical Information, technical report, September 6, 2022, https://doi.org/10.2172/1885591.
[8]. The Royal Society, “Large-Scale Electricity Storage,” accessed September 12, 2023, https://royalsociety.org/topics-policy/projects/low-carbon-energy-programme/large-scale-electricity-storage/.
[9]. Ibid. Used with permission.
[10]. Andrew Kumler et al., “Inter-Annual Variability of Wind and Solar Electricity Generation and Capacity Values in Texas,” Environmental Research Letters 14, no. 4 (April 2019): 044032, https://doi.org/10.1088/1748-9326/aaf935.
[11]. Bethany Frew et al., “Sunny with a Chance of Curtailment: Operating the US Grid with Very High Levels of Solar Photovoltaics,” iScience 21 (November 22, 2019): 436–47, https://doi.org/10.1016/j.isci.2019.10.017.
[12]. Ibid.
[13]. NREL Scenario Viewer, “Standard Scenarios 2023,” mid-case, website accessed August 26, 2024, https://scenarioviewer.nrel.gov/?project=03ad535d-f0ed-4a6b-8323-c582a606e92c&mode=view&layout=Default.
[14]. “Demand Response,” IEA, accessed April 9, 2024, https://www.iea.org/energy-system/energy-efficiency-and-demand/demand-response.
[15]. Gregory Brinkman et al., “Interconnections Seam Study” (NREL, n.d.), https://www.nrel.gov/analysis/seams.html; Denholm et al., “Examining Supply-Side Options to Achieve 100 percent Clean Electricity by 2035.”
[16]. Rona Kobell, “Maryland Consumer Watchdog Questions Need for 70-Mile Power Line,” The Baltimore Banner, July 24, 2024, https://www.thebaltimorebanner.com/community/local-news/david-lapp-peoples-counsel-QMSFBZAJL5BTJDJ2BO57CBNYKI/.
[17]. Stephanie Obadia, “Denmark’s Energy Policy: Built on Renewables, Driven by Wind,” Construction 21 International, February 7, 2024, https://www.construction21.org/articles/h/denmark.html.
[18]. Atkinson, Gaster, and Rightor, “Beyond Force: A Realist Pathway Through the Green Transition.”
[19]. EIA, “Natural gas combined-cycle power plants increased utilization with improved technology,” Today in Energy, November 20, 2023, https://www.eia.gov/todayinenergy/detail.php?id=60984.
[20]. U. S. Government Accountability Office, “Electricity: Information on Peak Demand Power Plants | U.S. GAO,” accessed May 22, 2024, https://www.gao.gov/products/gao-24-106145.
[21]. For example, New York City as of 2019 had 89 fossil peaker plants, averaging 47 years old, with a capacity of about 6 GW. The plants had an average capacity factor of 5.2 percent, or a total of about 450 hours of operation during the year. Fifty percent of operating runs lasted 4 hours or less. Capacity payments (payments made regardless of use) totaled about $422 million.
[22]. “Levelized Cost of Energy, Levelized Cost of Storage, and Levelized Cost of Hydrogen 2021,” lazard.com, accessed January 23, 2024, https://www.lazard.com/research-insights/levelized-cost-of-energy-levelized-cost-of-storage-and-levelized-cost-of-hydrogen-2021/. The 2023 estimate for CCGTs was inflated by gas shortages. The previous five years average below $60/MWh.
[23]. EIA, “U.S. simple-cycle natural gas turbines operated at record highs in summer 2022,” Today in Energy, March 1, 2023, https://www.eia.gov/todayinenergy/detail.php?id=55680.
[24]. NREL Scenario Viewer, “Standard Scenarios 2023.”
[25]. DOE. Annual Energy Outlook 2023, reference case scenario.
[26]. EAI, “Natural gas combined-cycle power plants increased utilization with improved technology,” Today in Energy, November 20, 2023, https://www.eia.gov/todayinenergy/detail.php?id=60984.
[27]. NREL Scenario Viewer, “Standard Scenarios 2023.”
[28]. Wesley Cole et al., “The Peaking Potential of Long-Duration Energy Storage in the United States Power System,” Journal of Energy Storage 62 (2023): 106932, https://doi.org/10.1016/j.est.2023.106932.
[29]. Emiliano Bellini, “World’s Largest Underground Hydrogen Storage Project,” PV Magazine International, August 4, 2022, https://www.pv-magazine.com/2022/08/04/worlds-largest-underground-hydrogen-storage-project/.
[30]. “2022 Hydropower Status Report” (International Hydropower Association), accessed July 2, 2024, https://www.hydropower.org/publications/2022-hydropower-status-report.
[31]. Australian National University, accessed June 26, 2024, https://www.dropbox.com/s/jcwpgkgl6fnff5f/Global percent20summary percent20spreadsheet.xlsx?e=1&dl=0.
[32]. NREL, “Pumped Storage Hydropower,” website accessed August 26, 2024, https://maps.nrel.gov/psh.
[33]. NREL, “Hydropower,” website accessed August 26, 2024, https://atb.nrel.gov/electricity/2024/hydropower.
[34]. NREL, Annual Technology Baseline,” 2024, https://atb.nrel.gov/electricity/2024/index.
[35]. Michael Barnard, “Gravity Storage 101 Or Why Pumped Hydro Is the Only Remotely Real Gravity Storage,” CleanTechnica, January 16, 2024, https://cleantechnica.com/2024/01/16/gravity-storage-101-or-why-pumped-hydro-is-the-only-remotely-real-gravity-storage/.
[36]. Duminda Perera et al., “Ageing Water Storage Infrastructure: An Emerging Global Risk 11,” 2021, https://doi.org/10.13140/RG.2.2.29149.44003.
[37]. Jessie Thomas-Blate, “Saying Adios to 80 Dams in 2023,” American Rivers, February 13, 2024, https://www.americanrivers.org/2024/02/saying-adios-to-80-dams-in-2023/.
[38]. DOE, accessed August 26, 2024, https://www.energy.gov/eere/water/articles/new-report-examines-us-hydropower-permitting-process.
[39]. “Global Landscape of Renewable Energy Finance 2023” (IRENA, 2023).
[40]. EIA, “Preliminary Monthly Electric Generator Inventory (based on Form EIA-860M as a supplement to Form EIA-860),” August 23, 2024, https://www.eia.gov/electricity/data/eia860m/. Some dams have more than one generator.
[41]. EIA, “Utility-scale batteries and pumped storage return about 80% of the electricity they store,” Today in Energy, February 12, 2021, https://www.eia.gov/todayinenergy/detail.php?id=46756.
[42]. “U.S. Hydropower Market Report 2023 Edition” (DOE, 2023).
[43]. 6.9 GW at $7.1 million per MW.
[44]. RheEnergize, “How It Works,” accessed August 26, 2024, https://www.rheenergise.com/how-it-works, and interviews with RheEnergize staff, February 2024.
[45]. Eoin McLean and Derek Kearney, “An Evaluation of Seawater Pumped Hydro Storage for Regulating the Export of Renewable Energy to the National Grid,” Energy Procedia, 8th International Renewable Energy Storage Conference and Exhibition (IRES 2013), 46 (January 1, 2014): 152–60, https://doi.org/10.1016/j.egypro.2014.01.168.
[46]. Quidnet Energy, “CPS Energy & Quidnet Energy Announce Landmark Agreement to Build Grid-Scale, Long Duration, Geomechanical Pumped Storage Project in Texas,” news release, March 7, 2022, https://quidnetenergy.com/news/2022/03/cps-energy--quidnet-energy-announce-landmark-agreement-to-build-gridscale-long-duration-geomechanical-pumped-storage-project-in-texas/.
[47]. Hydro Review, “3.6 GW Fengning pumped storage to power Beijing Winter Olympics,” January, 14, 2022, https://www.hydroreview.com/hydro-industry-news/pumped-storage-hydro/massive-3-6-gw-fengning-pumped-storage-to-power-beijing-winter-olympics/#gref.
[48]. DOE Water Power Technologies Office, “Hydropower Program,” website accessed August 26, 2024, https://www.energy.gov/eere/water/hydropower-program.
[49]. Robin Gaster, “A Realist Approach to Hydrogen,” January 16, 2024, https://itif.org/publications/2024/01/16/a-realist-approach-to-hydrogen/.
[50]. Leigh Collins, “Why Hydrogen-Fired Power Plants ‘Will Play a Major Role in the Energy Transition,’” Recharge, July 29, 2021, https://www.rechargenews.com/energy-transition/why-hydrogen-fired-power-plants-will-play-a-major-role-in-the-energy-transition/2-1-1045768.
[51]. EPRI, “Capex Rates,” accessed August 26, 2024, https://lcri-tools.epri.com/tea-electrolysis/capex-rates. EPRI estimates the cost of a 100 MW PEM plant at $250 million.
[52]. ITIF calculations.
[53]. Kris De Decker, “History and Future of the Compressed Air Economy,” LOW←TECH MAGAZINE, May 15, 2018, https://solar.lowtechmagazine.com/2018/05/history-and-future-of-the-compressed-air-economy/.
[54]. Behnam Zakeri and Sanna Syri, “Electrical Energy Storage Systems: A Comparative Life Cycle Cost Analysis,” Renewable and Sustainable Energy Reviews 42 (February 1, 2015): 569–96, https://doi.org/10.1016/j.rser.2014.10.011.
[55]. European Energy Storage Association, Compressed Air Energy Storage, accessed September 10 2024. https://ease-storage.eu/wp-content/uploads/2016/03/EASE_TD_ACAES.pdf; Energy Storage Association, “Advanced Adiabatic Compressed Air Energy Storage (AA-CAES),” accessed May 2018, http://energystorage.org/advanced-adiabatic-compressed-air-energy-storage-aa-caes.
[56]. Peter Holmes Kobos et al., “A Life Cycle Cost Analysis Framework for Geologic Storage of Hydrogen: A User’s Tool.,” Report, UNT Digital Library (Sandia National Laboratories, September 1, 2011), https://doi.org/10.2172/1029761. Note that this study is from 2011, and costs may have shifted since then.
[57]. Ibid.
[58]. Ibid.
[59]. See EPRI, “Contingency Analysis—Baseline,” https://smartgrid.epri.com/UseCases/ContingencyAnalysis-Baseline.pdf.
[60]. CASIO, California Public Utilities Commission, “Resource Adequacy Homepage,” accessed August 26, 2024, https://www.cpuc.ca.gov/industries-and-topics/electrical-energy/electric-power-procurement/resource-adequacy-homepage.
[61]. Sources: ISO websites.
[62]. Bethany Frew et al., “Impact of Operating Reserve Rules on Electricity Prices with High Penetrations of Renewable Energy,” Energy Policy 156 (September 1, 2021): 112443, https://doi.org/10.1016/j.enpol.2021.112443.
[63]. DOE Office of Electricity, “Energy Storage RD&D,” website accessed August 26, 2024, https://www.energy.gov/oe/energy-storage-rdd.
[64]. DOE Office of Electricity, “Grid Storage Launchpad,” website accessed August 26, 2024, https://www.energy.gov/oe/energy-storage-rdd.
[65]. DOE, “Energy Storage Grand Challenge,” website accessed August 26, 2024, https://www.energy.gov/energy-storage-grand-challenge/energy-storage-grand-challenge.
[66]. DOE Office of Energy Efficiency & Renewable Energy, “Long Duration Storage Shot,” website accessed August 26, 2024, https://www.energy.gov/eere/long-duration-storage-shot.
[67]. DOE Office of Electricity, “Storage Innovations 2030,” website accessed August 26, 2024, https://www.energy.gov/oe/storage-innovations-2030.
[68]. DOE Energy Storage Grand Challenge, “Energy Storage Reports and Data,” website accessed August 26, 2024, https://www.energy.gov/energy-storage-grand-challenge/energy-storage-reports-and-data.
[69]. Argonne National Laboratory, “Department of Energy selects Argonne to lead national energy storage hub,” news release, September 3, 2024, https://www.anl.gov/article/department-of-energy-selects-argonne-to-lead-national-energy-storage-hub.
[70]. DOE, “Office of Clean Energy Demonstrations,” https://www.energy.gov/sites/default/files/2024-01/OCED_CC_Demo.pdf.
[71]. DOE Office of Clean Energy Demonstrations, “Long-Duration Energy Storage Demonstrations Projects Selected and Awarded Projects,” accessed August 26, 2024, https://www.energy.gov/oced/long-duration-energy-storage-demonstrations-projects-selected-and-awarded-projects.
[72]. DOE, “U.S. National Clean Hydrogen Strategy and Roadmap at a Glance,” https://www.hydrogen.energy.gov/docs/hydrogenprogramlibraries/pdfs/clean-hydrogen-strategy-roadmap-at-a-glancee72a84ff4e104d9e9371a16ed7203f82.pdf.
[73]. DOE Office of Clean Energy Demonstrations, “OCED Selects Three Projects in CA, ND, and TX to Reduce Harmful Carbon Pollution, Create New Economic Opportunities, and Advance Carbon Reducing Technologies,” news release, December 14, 2023, https://www.energy.gov/oced/articles/oced-selects-three-projects-ca-nd-and-tx-reduce-harmful-carbon-pollution-create-new.
[74]. See for example NREL’s Storage Deployment Optimization Model, described in Omar Jose Guerra Fernandez and Joshua Eichman, “SDOM (Storage Deployment Optimization Model) [SWR-21-73]” (National Renewable Energy Laboratory, Golden, CO: August 2, 2023), https://doi.org/10.11578/dc.20230919.3.
[75]. EPRI, “Bulk Energy Storage,” program description, posted June 2, 2024, https://www.epri.com/portfolio/programs/113062.
