
A Realist Approach to Hydrogen

Clean hydrogen is expensive to produce, difficult to transport, and a second- or third-best clean energy solution in almost all proposed markets. To help drive the global green transition, a realist approach to hydrogen policy must address all these practical challenges.
KEY TAKEAWAYS
Key Takeaways
Contents
Policy Recommendations for the United States. 5
Transporting and Storing Hydrogen. 18
Transportation by Pipeline. 19
Solving for Hydrogen: A Different Approach to Transportation and Storage. 22
Existing Markets for Hydrogen. 23
The Swiss Army Knife of Decarbonization. 39
A Research Agenda for Hydrogen. 40
Transportation and Storage. 41
The Realist Case For Hydrogen. 42
Avoiding Hydrogen Pitfalls. 42
Potential Pathways to Sustainable Hydrogen. 44
A US Policy Agenda For Hydrogen. 46
Appendix: Levelized Cost of Energy. 48
Executive Summary
The world is high on hydrogen. The United States and Europe are racing to deploy subsidies,
the Department of Energy (DOE) recently announced seven new hydrogen hubs backed by
$8 billion from the Infrastructure Investment and Jobs Act (IIJA), while the Inflation Reduction Act offers unlimited production subsidies for “clean hydrogen.” Europe is gearing up, offering similar subsidies. China is mobilizing to claim the rapidly growing electrolyzer sector. Low-income countries are also jumping on the hydrogen train: Indonesia, India, the Philippines, Namibia, and many other countries have announced plans to build hydrogen production into
the renewables mix.
Unfortunately, much—but not all—of the hydrogen story is just hot air.
As ITIF described in a previous paper, “Beyond Force: A Realist Pathway through the Green Transition,” the critical need is for green technologies that can be adopted by low-income countries; that’s where all the growth in emissions is occurring, and low-income countries will only adopt technologies that are competitive with existing fossil-based technologies on price AND performance.[1] Price/performance parity (P3), without long-term subsidies, is the key benchmark to meet for addressing the global climate crisis, and rich country programs need to be directed to that end. Just solving emissions in the rich countries is not nearly enough.
Price/Performance Parity
As the West forces down global greenhouse gas (GHG) emissions, they are growing rapidly in low-income countries, where urbanization, population growth, and economic growth all require more energy. These countries cannot afford sufficient subsidies to go green today; that’s why they are overwhelmingly still using—and expanding—energy production from fossil fuels. They cannot pay a significant green premium for clean energy.
Global adoption of green technologies must therefore be driven by market forces, which will transform the world’s energy mix only when clean energy reaches price and performance parity with dirty energy. That is P3—price/performance parity.
Of course it’s true that fossil-driven products mostly do not pay for the externalities they create. And fossil energy has benefitted from subsidies in many countries, including the United States. In an ideal world, these advantages would be removed, but there is very limited political appetite even in the rich countries for high carbon taxes or similar policies. And we must live in the world we have, not the one we want.
The challenge for the hydrogen economy is that clean hydrogen is expensive to produce, difficult to transport, and a second- or third-best solution in almost all proposed markets.
“Clean” hydrogen is three to six times as expensive to produce as gray hydrogen (which accounts for ~98 percent of all hydrogen production today). Gray hydrogen is made using fossil fuels,
and generates 8–10 kilograms (kg) of carbon dioxide (CO2) for every kilogram of hydrogen produced.[2]
Hydrogen Colors Explained
There are today two main flavors of clean hydrogen: “blue hydrogen,” which is produced using fossil fuels plus the additional step of carbon capture, utilization, and storage (CCUS), and “green hydrogen,” made by applying green electricity to water to create hydrogen and oxygen. Along with other low-carbon- methods of making hydrogen, these are collectively called “clean hydrogen.”
Other colors:
§ Gray hydrogen uses natural gas or gasified coal as feedstock.
§ Brown hydrogen is produced from coal gasification, and generates the most GHG.
§ Pink hydrogen is produced via electrolysis using energy from nuclear power.
§ White hydrogen is extracted directly from underground deposits.
§ Turquoise hydrogen uses methane pyrolysis, and produces solid carbon instead of CO2.
§ Yellow hydrogen uses fossil-based electricity from the grid via electrolysis.
Blue hydrogen is made using the gray production process plus carbon capture and either utilization (often for enhanced oil recovery (EOR) in oil fields) or long-term storage (CCUS). This in theory captures the CO2 produced during gray hydrogen production, making the output “clean hydrogen.” CCUS for hydrogen has not been proven at scale, from either a cost or an emissions perspective: Currently, the world’s largest blue hydrogen facility captures only about 70 percent of GHG emissions, far below the level needed to qualify as “clean” hydrogen for U.S. or EU subsidies. Disposing of captured CO2 will be a growing challenge.
Green hydrogen is made by applying electricity to water (H2O), separating out hydrogen and oxygen through electrolysis. Proponents argue that economies of scale will drive down costs,
as they have done for wind and solar, and that green hydrogen will be cheaper than blue hydrogen by the early 2030s and will be fully price/performance competitive with fossil fuels
by 2050.[3]
Unfortunately, the economies of scale that drove down wind and solar costs will not apply to green hydrogen. According to DOE’s hydrogen production model, more than 85 percent of the cost of green hydrogen production comes directly from the cost of electricity as an input.[4] So even if the cost of electrolyzers declines dramatically as scale grows, that makes little difference to hydrogen prices. For green hydrogen to reach P3, the cost of renewable electricity inputs must fall very close to zero.[5]
In short, both green and blue hydrogen are much more expensive to produce than gray hydrogen, and are likely to remain so. Subsidies can make the math work, but they will be large, will be needed long term, and do not point to a useful energy pathway in low-income countries, or in other countries without the political will or fiscal headroom for ongoing subsidies.
Turning to delivery, hydrogen infrastructure is very limited today. Hydrogen can be transported
as gas though pipelines or in liquified form (at -253oC), but old gas pipelines are hard to repurpose and can carry only limited amounts of hydrogen, while new pipelines are expensive and require large quantities moving to tightly specified locations (e.g., between North Africa
and Europe). Both would need careful monitoring, as escaped hydrogen has highly negative climate impacts (worse than natural gas). Delivering hydrogen by truck is extremely expensive. High transport costs strongly encourage uses where hydrogen production is colocated with end uses—as it is in many oil refineries and ammonia plants today.
Markets for hydrogen constitute the third set of challenges. Proponents assume that the main existing markets for gray hydrogen (oil refining and ammonia) will switch quickly to clean hydrogen. They are wrong. Gray hydrogen is deeply embedded in these markets; gray hydrogen plants exist, they produce hydrogen at prices clean hydrogen cannot match, and production is often located on-site. In what world do large corporations abandon productive and efficient existing assets in order to adopt untested solutions that will rely on subsidies for the foreseeable future? Not this one.
Beyond existing uses, proponents have identified an extraordinary profusion of new use cases ripe for clean hydrogen. For every sector that is “hard to decarbonize,” hydrogen is seen as the right solution. It is the Swiss Army Knife of next-generation energy. Perhaps that’s why herds of VCs have already tumbled off the hydrogen cliff, with VC investments up more than 50 percent in 2022.[6]
A Swiss Army Knife makes a great holiday gift and it’s very useful if you are lost in the woods, but my own Swiss Army Knife is gathering dust in a drawer somewhere. Yes, it has many uses, but it offers only a second-best solution for every problem. Need to set a screw? Use a screwdriver! Open a bottle? Use a corkscrew! Hydrogen is indeed the Swiss Army Knife of energy: a second- or third-best solution for every use.
Often, hydrogen is fighting on two fronts: In road transportation, for example, it must compete against both internal combustion engine vehicles (ICEs) and also against battery electric vehicles (BEVs). Regulations and subsidies may eventually force ICEs off the roads in some rich countries, but they will very likely be replaced by BEVs, not by hydrogen fuel cell vehicles (HFCVs). In other sectors—such as aviation or cement—there is not even a plausible case that hydrogen can eventually become competitive without ongoing subsidies. Aside possibly from long-duration energy, there is no compelling use case for which hydrogen is undeniably the best.
Hydrogen could however be needed to address one real and unique problem at scale: very long-duration energy storage (LDES). Demand for LDES will grow as renewables spread. It is possible that solutions can be found that don’t require hydrogen (e.g. gas peaker plants, bigger and better-connected energy grids, compressed air storage, demand side management), but there is no similar existing LDES technology with which hydrogen must compete. Hydrogen storage has been proven at scale and at long duration, and while burning hydrogen for power is not in itself competitive, it could be an important insurance policy. Renewables do experience substantial seasonal and annual variation, and as renewables come to dominate the energy mix, insurance against low production will become increasingly important. Hydrogen could perhaps fill that role.
Policy Recommendations for the United States
To some extent, the die is cast in the United States for the next few years. Potentially huge production subsidies will be available through the IRA (notably sections 45C and 45V), DOE will spend $8 billion to stand up seven new “hydrogen hubs,” and more money will be poured into infrastructure, the manufacturing supply chain, and research and development (R&D). We hope that at least some of the hubs are successful, and the increase in production driven by these subsidies (and expanded R&D budgets) makes clean hydrogen more competitive. We also hope that lessons learned from each of the hubs will be widely publicized, leading to better design and improved economic models for their successors.
The key question, though, is whether this massive injection of funding will put hydrogen—either green or blue—on the path to P3, where it can expect widespread adoption and where these technologies can spread into the low-income countries that are the future focus of climate change. According to the evidence so far, and the policies adopted to date, that seems unlikely.
Our recommendations are therefore aimed at future policy, and at policies in other countries that are only now rolling out their hydrogen strategies. Our analysis leads to the following policy conclusions:
1. View hydrogen policy through the P3 lens. If there is no pathway to P3, piles of expensive subsidies in the rich countries will not turn hydrogen into a global decarbonization solution. Ensure that the solutions we fund are those that can in fact be adopted in low-income countries.
2. Economies of scale won’t transform the economics of green hydrogen. It is currently not close to P3, and production costs are overwhelmingly driven by the input cost of green energy, so even sharp declines in electrolyzer costs won’t make much difference. Green hydrogen projects that rely mainly on scale for anticipated cost reductions should be avoided.
3. Minimize investments in blue hydrogen. This technology will by definition always cost more than gray hydrogen, and hence has no long-term future in the global energy mix; indeed, any successes will mainly block the path for green hydrogen.
4. Don’t invest in second-best solutions. For most proposed markets, green hydrogen is and will be a second- or third-best solution. Governments should use the P3 framework to help identify target markets that make sense, and to avoid wasting enormous resources on markets that will never reach P3, including both existing markets and many proposed new ones.
5. We do not have all the technology we need! Of course we can produce green hydrogen, but not at P3, not at the price and performance needed for global adoption. A targeted research program is therefore the most pressing need, especially to improve the electrical efficiency of green hydrogen, improve net water use, and to reduce life cycle capital costs, particularly for applications around long-duration storage. And additional R&D aimed at further reducing the cost of renewable energy will also help improve the competitiveness of green hydrogen.
6. Location matters. “Additionality” is not theoretical; it is intensely practical: Green energy provided via the grid is heavily impacted by grid fees and taxes, which make green hydrogen uncompetitive (without substantial subsidies) even if the electricity itself is priced at close to zero.[7] We should therefore favor projects where green energy sources are colocated with green hydrogen production, and avoid those where electricity comes from the grid, especially where grid electricity is expensive. Green grid energy may also have uses with more emissions impacts than making green hydrogen.
7. Avoid projects that require expensive transportation infrastructure. Transporting hydrogen is difficult and expensive. Fantasies about a “network” of regional hydrogen facilities are just that. Policy should favor projects that are colocated with end users.
8. Invest in hydrogen as LDES. Focus on the best case for green hydrogen by investing in hydrogen for LDES, as it may be a key step toward a fully sustainable grid. This also offers the best opportunity to bring green hydrogen to scale. Upstream of production, provide more funding for research across all technology readiness levels (TRLs) focused on increasing the efficiency of electrolysis and reducing the use of other key inputs such as water. Downstream, fund technologies that improve natural underground storage, compression, and the eventual reconversion of hydrogen to energy.
We are not climate deniers. We believe fossil fuels are transforming the climate globally, and that we need a pathway through the green transition. Industrial policy in the form of subsidies, regulation, and public procurement has been an important driver for key technologies in the past, and can help generate market traction for green energy. But we also believe that simply subsidizing or regulating our way forward will not work: The backlash in rich countries is already strong and getting stronger; and fossil fuels are booming in low-income countries to meet their undeniable and rapidly growing needs for more energy. The only way to square that circle is to develop green technologies that are cheap enough for everyone. Green hydrogen could be one of them.
Hydrogen Production
Around 70 million metric tons (MMT) of dedicated hydrogen is produced annually (additional hydrogen is produced as an industrial byproduct).
Figure 1: Value chain for hydrogen, 2019
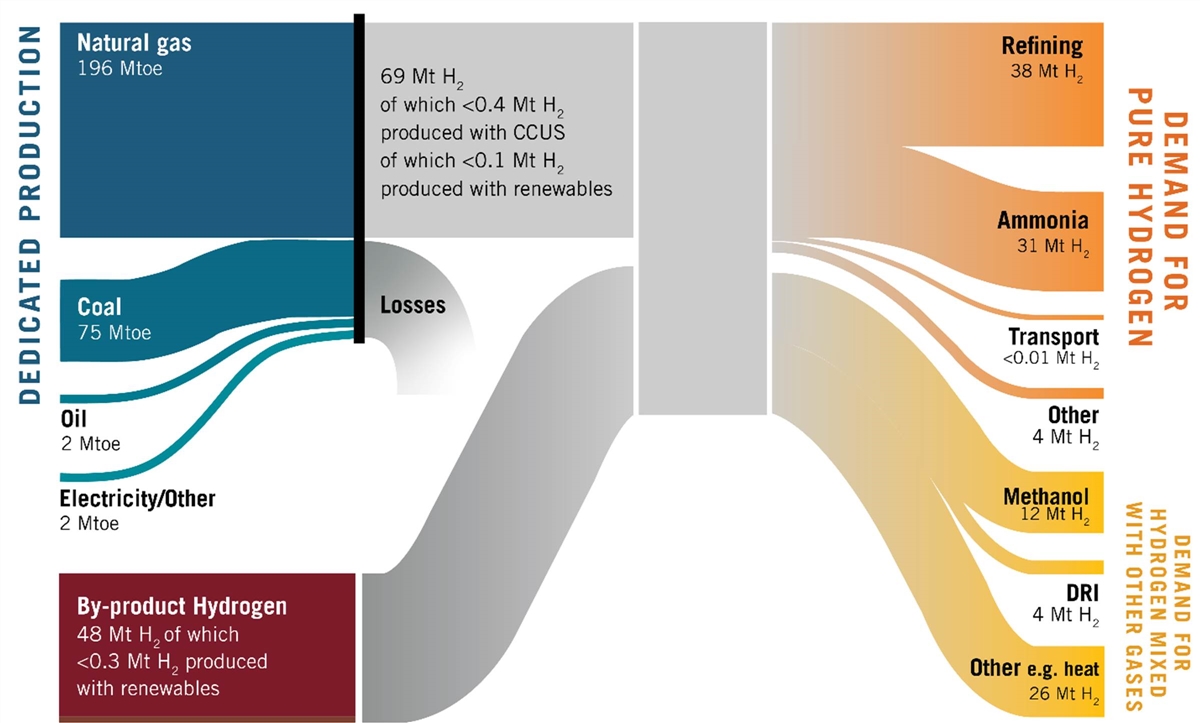
Less than 1 percent is produced by electrolysis, with the remainder overwhelmingly from natural gas (76 percent) and coal gasification (23 percent).[8] Aside from hydrogen used for heating in other industrial processes, and for methanol production, almost all the demand comes from oil refining and ammonia production; somewhat less than 4 percent is used in steel plants using direct iron reduction (DRI) technology. Overall, hydrogen demand is up about 50 percent in the past decade.[9]
Hydrogen made from fossil fuels is known as “gray hydrogen” (see the earlier box on “Hydrogen Colors Explained”) and is predominantly made through high-temperature steam methane reforming (SMR) or coal gasification.[10] It generates 8–10 kg of CO2 for every kilogram of hydrogen that is produced. Gray hydrogen accounts for 830 MMT of CO2 annually, or about 2.2 percent of GHG emissions.[11] It is therefore a significant target for net-zero emissions.
In contrast, “clean hydrogen” produces far less GHG emissions and has been touted as the pathway for decarbonizing a number of hard-to-decarbonize sectors, including steel, cement, aviation, heavy trucking, trains, shipping, industrial heat, and heat for buildings. Adoption in these markets would drive much-expanded use of clean hydrogen, and could also replace gray hydrogen for existing uses such as oil refining and ammonia production. Clean hydrogen can be produced either by electrolysis using renewable energy as an input (“green hydrogen”) or by applying CCUS to the standard gray hydrogen production process, thus removing the CO2 emissions at source (“blue hydrogen”).
The International Energy Agency’s (IEA’s) net-zero projections anticipate that demand for hydrogen will grow to more than 600 MMT by 2050, and that almost all of it will be clean hydrogen. However, many snares, delusions, and pitfalls stand between us and the promised land of a hydrogen-fueled net zero.
Blue Hydrogen
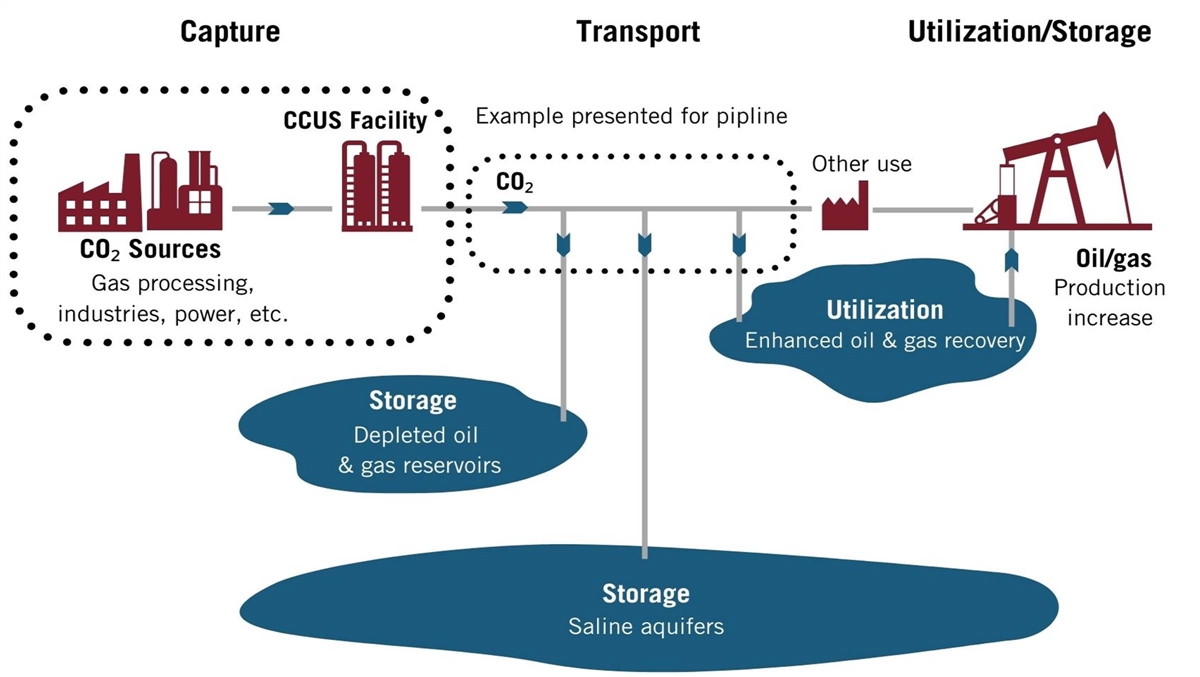
Blue hydrogen utilizes the same technology that produces gray hydrogen, plus additional steps to capture and store or utilize the CO2.
About three quarters of the very limited amount of blue hydrogen today is used for EOR, where CO2 adds pressure to oil fields to help increase production.[12] EOR is a widely used technology, and marketable natural gas also requires the removal of CO2 that is found in raw natural gas, so carbon capture has been an integral part of gas production. More recent non-EOR projects (e.g., the Sleipner project in Norway) simply capture and sequester the CO2 without seeking to find a use for it.
The energy required to run the capture system can typically be recovered from the hydrogen production process, so little additional energy is needed for capture.[13]
Proponents argue that blue hydrogen could be an important bridging technology, reducing GHG emissions (especially in certain sectors) until cleaner technologies such as green hydrogen are fully competitive sometime in the 2030s.[14] ExxonMobil recently announced a large blue hydrogen project in Baytown, Texas, which it claims will reduce emissions by 30 percent for olefins production.[15] Some of these proponents also argue that blue hydrogen technology is well understood, and that green hydrogen may not be competitive for decades.
Blue hydrogen is however the wrong pathway.
Figure 2: Blue hydrogen schematic[16]
Will CCUS effectively capture GHG at the levels (and costs) required? IEA projections assume that capture rates will be 90–95 percent.[17] The proposed ExxonMobil Baytown plant is anticipating capture rates of 98 percent.
Still, none of the 13 most significant carbon capture projects around the globe have aimed to capture more than 80 percent of emitted CO2, and only two have successfully reached the levels of capture that they targeted.[18] Shute Creek (the biggest) targeted around 75 percent capture, but overall fell far short of that. (See the box below on “Carbon Capture at Shutes Creek, WY.”) The enormous Gorgon project in Pilbara, Australia, missed its targets completely for the first 3.5 years of operation. Of the 300 megatons (MT) of CCUS anticipated in IEA’s 2009 roadmap, only 40 MT (13 percent) had been built by 2020.[19]
Carbon capture itself takes energy for absorbance, dehydration, compression, transport, and injection. For blue hydrogen plants, that energy comes from fossil-based electricity, and that offsets some of the capture. At the Quest project in Canada, for example, carbon capture and sequestration generated 1.16 MT of CO2 in 2016–2020, equivalent to more than 20 percent of the CO2 that was captured.[20]
Then there is the challenge of utilization or sequestration. EOR is the primary use for captured CO2, but raises multiple concerns. As Shute Creek demonstrates, EOR can put CCUS projects at the mercy of oil prices and local demand for its services. As renewables begin to dominate, demand for EOR is also likely to fall more generally. Some critics have argued that EOR itself generates enough Scope 2 emissions to cut the overall benefits of carbon capture by a third.[21]
Carbon Capture at Shutes Creek, WY[22]
Commissioned in 1986, ExxonMobil’s, Shutes Creek plant uses raw gas from its La Barge, Wyoming gas field. That gas is only 21 percent methane (the marketable gas) and 65 percent CO2. Original and additional investment totaled $256 million, which built a plant capturing 7 MMT of CO2 annually (the largest carbon capture and sequestration plant in the world). A new addition will add 1.2 MMT/CO2, at a cost of $400 million. Figure 3 summarizes the results:
Figure 3: Carbon capture at Shutes Creek, WY[23]
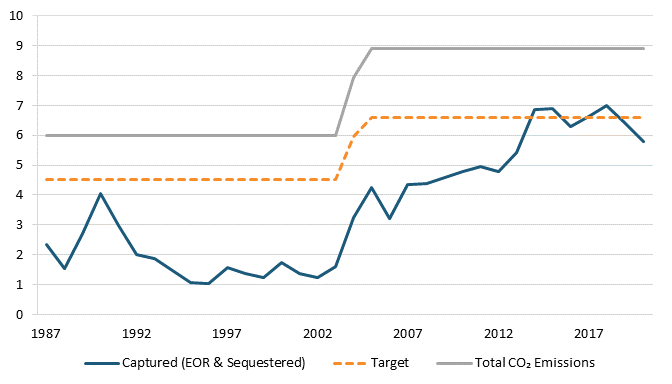
Two points stand out. The share of emissions targeted for capture was for every year about 25 percent lower than actual emissions. And in all years except two, the project did not meet its targets, in many cases missing them by substantial margins largely because low oil prices from the early 1990s until the mid-2000s made EOR activities uneconomic in the La Barge area, eliminating the key market.
Sequestering CO2 in oil fields also risks GHG emissions from leaks—many big oil fields have hundreds of abandoned boreholes. Finding and capping those wells is a significant (and expensive) challenge, but unless it is done rigorously, those boreholes may become pathways back to the surface for the CO2.
Blue hydrogen production for power will also increase natural gas usage. Air Products’ proposed new 800 MW blue hydrogen project in Humberside, United Kingdom, will replace 1 million cubic feet (cf) of natural gas for power production with hydrogen. However, that requires production of 3.33 million cf of hydrogen. But hydrogen production (using efficient SMR technology) requires about 4.5 cf of natural gas to make 1 cf of hydrogen. So, to replace 1 million cubic feet of natural gas with hydrogen, Air Products will use about 15 million cf of natural gas! Its CEO recently observed that this will raise prices and increase the use of natural gas, but argued that it will have social benefits (i.e., CO2 reduction).[24]
Blue hydrogen—much like gray hydrogen—is also powerfully affected by variations in the price of natural gas (or coal). Crises such as the Russia-driven spike in gas prices could therefore be devastating; costs jumped 36 percent as a result.[25] Price spikes don’t affect the competitiveness of blue hydrogen against gray hydrogen, but competing fuels not reliant on gas could become much more competitive.
In the end, though, it is the economics that makes blue hydrogen a diversion, not a solution. Because it is simply gray hydrogen plus additional steps, blue hydrogen will never be P3 competitive with gray hydrogen. It will therefore always depend on subsidies to make it competitive, and that makes it a technology for rich countries only. It works, for example, in Norway, where a 1991 CO2 law taxed carbon released into the atmosphere at $49/tonne, while the cost of sequestration was only $17/per tonne. Subsequent regulations have made the cost of carbon even higher.
Estimated costs for CCUS in the United States vary wildly. This is not surprising, as few practical examples exist. One paper concludes that CCUS for concentrated gas projects such as SMR hydrogen in the Northeastern and Midwest United States would cost $80–$90 per ton of CO2 (tCO2).[26] A different study estimates costs at $30–$45/tCO2.[27] Combined with variations in the amount of CO2 emitted in the course of production, we get a wide range of estimates for the additional costs for CCUS: $0.24–$1.08 per kilogram of hydrogen, or ~24–100 percent of existing production costs for gray hydrogen. That gap can only be closed by ongoing subsidies or the imposition of carbon taxes or other forcing regulations. And because blue hydrogen will be so dependent on sustained subsidies, there is a significant risk that expensive assets could be stranded if the political climate changes.[28]
In short, blue hydrogen has not been widely and successfully demonstrated at scale or at sufficient levels of carbon capture, CCUS technology is untested or has failed on multiple dimensions, and the additional cost of CCUS means that blue hydrogen will never reach P3. Blue hydrogen is therefore of minimal relevance to global decarbonization.
Green Hydrogen
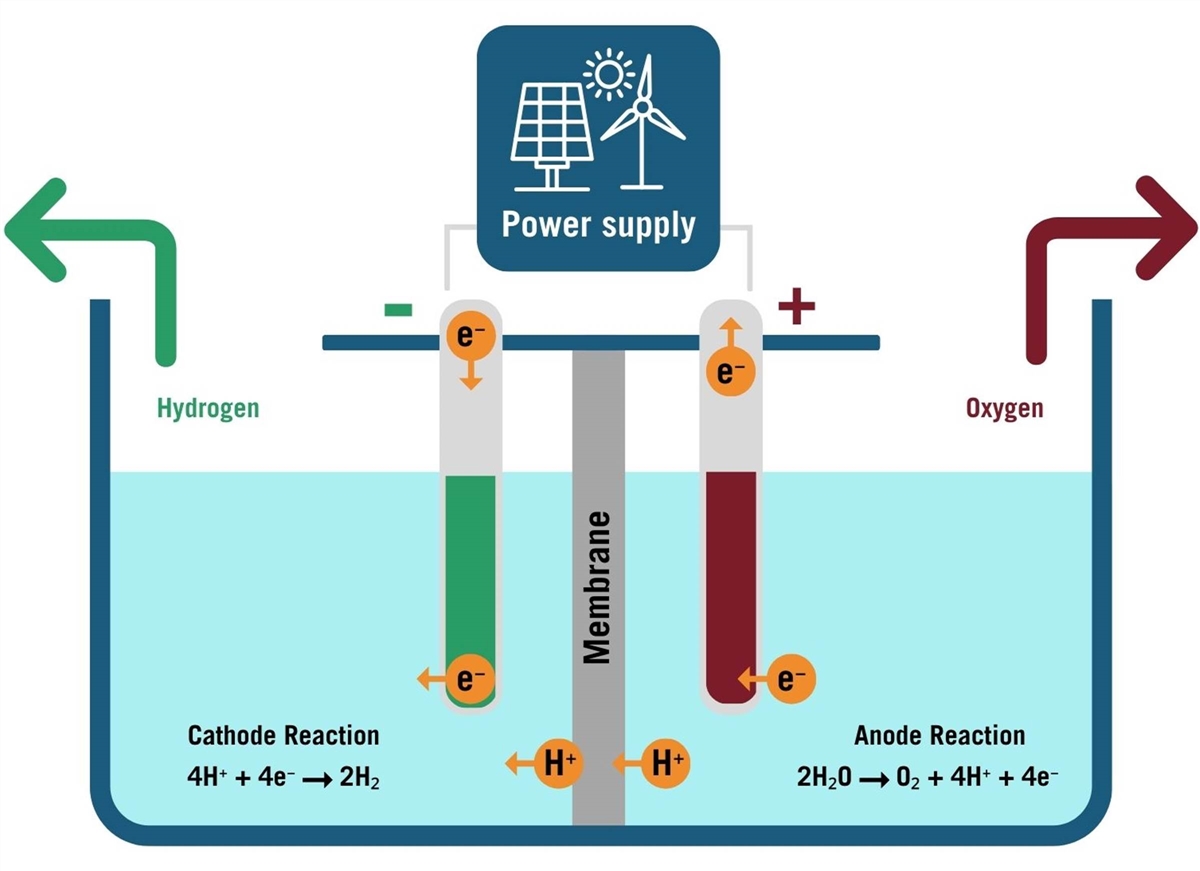
Green hydrogen might be different. It is made by applying electricity to water that contains the salts and minerals needed to conduct electricity. Two electrodes are immersed in water and connected to a power source and a direct current is applied. Water then breaks down into hydrogen and oxygen when the electrodes attract ions with an opposite charge (these electrodes often include substantial amounts of expensive or hard-to-source materials such as platinum).
A membrane then separates the oxygen and hydrogen. Production is “green” only when renewable power is used: The same process powered by energy from fossil fuels does not produce green hydrogen. Overall, green hydrogen accounts for less than 1 percent of total hydrogen production today.[29]
Figure 4: Green hydrogen production[30]
Two technologies dominate green hydrogen production: alkaline electrolysis (ALK) and proton exchange membranes (PEMs).[31] Solid oxide electrolysis cells (SOECs) have potential cost advantages because they use a different chemistry and less-expensive materials, but are only just reaching commercialization, while other technologies (e.g., high-temperature electrolysis) are at an even earlier stage of development.[32]
Key advantages for PEMs include operating below the 15 percent minimum capacity utilization that ALK requires, avoiding the use of an electrolyte (and accompanying maintenance costs), production at pressure, and a faster ramp-up and ramp-down time. However, ALK technology
is more efficient, has longer stack lifetimes, has a lower CAPEX, and is well suited to very large-scale production for local use. PEMs are a much newer technology, and hence are likely to see faster cost declines and further increased efficiency. Still, PEMs’ electrical efficiency, the critical variable, won’t change quickly: The International Renewable Energy Agency’s (IRENA’s) 2025 projections for green hydrogen production still require more than 50 kilowatt hours (kWh) of electricity per kilogram, somewhat improved from 2017. (See table 1.)
Table 1: Green hydrogen technologies compared[33]
|
Technology |
ALK |
PEM |
|||
|
Unit |
2017 |
2025 |
2017 |
2025 |
|
|
Efficiency |
kWh of electricity/kg of H2 |
51 |
49 |
58 |
52 |
|
Efficiency (LHV) |
percentage |
65 |
68 |
57 |
64 |
|
Lifetime Stack |
operating hours |
80,000 |
90,000 |
40,000 |
50,000 |
|
CAPEX—total system cost (incl. power supply and installation costs) |
EUR/kW |
750 |
480 |
1,200 |
700 |
|
OPEX |
percentage of initial |
2% |
2% |
2% |
2% |
|
CAPEX—stack replacement |
EUR/kW |
340 |
215 |
420 |
210 |
|
Typical output pressure |
bar |
Atmospheric |
15 |
30 |
60 |
|
System lifetime |
years |
20 |
30 |
||
Whatever the technology used, green hydrogen economics are overwhelmingly driven by a single input cost: electricity. According to DOE’s models, for a large hydrogen plant producing 50,000 kg/day, input electricity accounts for just over 85 percent of the cost of production for PEM plants.[34]
Production costs are therefore highly sensitive to changes in electricity costs. DOE’s models show that if electricity costs fall from the baseline price of 7.3 cents/kWh to 1.5 cents/kWh, the cost of production falls from almost $5/kg to $1.70/kg, much closer to P3. As DOE itself has stated, “Low-cost clean hydrogen via electrolysis will also depend on ample availability of low-cost clean electricity (<$20/megawatt-hour (MWh)) that will need to scale in parallel with market demand for clean hydrogen.”[35] How much less than $20/MWh remains to be determined.
In simplified form, the distribution of costs between operating expenses, capital, and electricity inputs is abundantly clear: electricity inputs dominate (see figure 5).
Figure 5: Example of cost shares for 1 kilogram of hydrogen using PEM electrolysis (2019)[36]
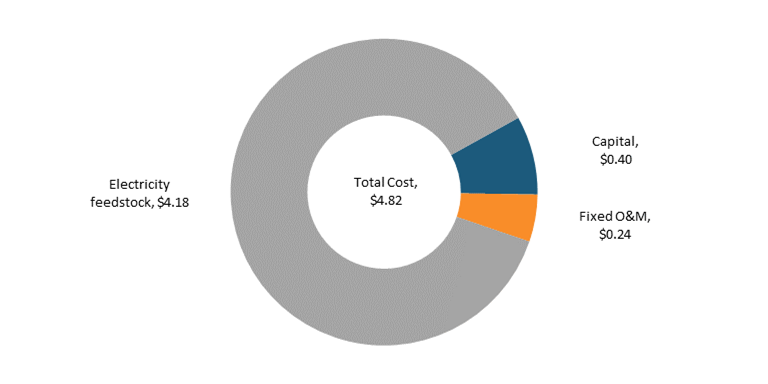
If input electricity costs drive the price of green hydrogen, then the rest of the cost stack is of more limited significance. While DOE’s models imply very substantial cost declines for electrolyzers as production ramps up, even a 30 percent decline in electrolyzer costs would result in only a 2 percent decline in overall production costs. Other estimates of projected price declines are even more fanciful.[37]
Scaling up electrolyzer production may also be difficult, as Chinese firms loom between U.S./European electrolyzer companies and global markets. China accounts for about 40 percent of the global electrolyzer market, and Bloomberg New Energy Finance (BNEF) has estimated that Chinese electrolyzers cost about 70 percent less than European or U.S. production.[38] China’s industrial policy may be creating an electrolyzer glut, making scale-up even more difficult for U.S. and European producers.[39]
Green Hydrogen’s Additional H20 Challenge
Green hydrogen is made from electricity and water—a lot of water:
De Levie et al. argue that “thermoelectricpower generation for electrolysis will on average withdraw approximately 1,100 gallons of cooling water and will consume 27 gallons of water as a feedstock and coolant for every kilogram of hydrogen that is produced using an electrolyzer that has an efficiency of 75 percent.”[40]
In the United States, geography exacerbates this problem, as renewable energy is mostly concentrated in the West, Midwest and Plains states, Mountain West, and Texas—precisely where water resources are becoming scarce and expensive. Water issues will become important globally as green hydrogen production expands.
Regardless of where the electrolyzers come from or how much they cost, the dominance of input electricity in the cost matrix means that economies of scale won’t matter much anyway. The cost of electrolyzers may fall substantially, we may get better at building and operating hydrogen plants, CAPEX requirements may be reduced, and certain components may fall in price as scale increase—but all of that affects only the ~15 percent of costs that are NOT input electricity.
Can green hydrogen get to P3? Can electricity costs be cut substantially? Perhaps by an order of magnitude?
Green energy is not always intrinsically expensive. In some locations, and at some times, wind and solar are highly competitive with or even cheaper than other energy sources, including natural gas and coal.[41]
The levelized cost of energy for wind and solar will most likely continue to decline, though probably not at the pace of the last two decades. And perhaps new green sources will become competitive, such as widespread geothermal energy at scale. That’s possible. New technologies such as perovskites offer potentially important opportunities. Still, we are at the flatter part of the cost-reduction curve now.
However, levelized cost is not everything. The cost of green energy—like all energy on the grid—is not static. There are periods when renewable energy is in surplus. Production occurs when it occurs, and sometimes the grid has no use for the energy produced. This energy is “curtailed” (i.e., wasted). If green hydrogen could access green energy only at times when it is in surplus, input costs could be close to zero and the math start to work.
There are two basic problems with the “use wasted energy” model: capacity utilization and energy delivery costs.
Traditionally, hydrogen production has operated at close to maximum capacity. Every percentage drop in capacity utilization means an increase in the levelized cost of hydrogen that’s produced, because CAPEX and operating costs must be spread over a smaller amount of production. So typically, hydrogen production models assume that capacity utilization will be 90 percent or even higher. However, to substantially cut electricity costs, the plant would need to operate when green energy is in surplus. Existing green energy producers are not likely to be in surplus more than 40 percent of hours spread across a year. But reducing capacity utilization to 40 percent would increase the levelized cost of hydrogen (LCOE) substantially.
Still, under a 40 percent utilization scenario, electricity costs would become far less important, falling from 82 percent of production costs to only 24 percent. Conversely, CAPEX would grow to 46 percent, and would become the most important cost component. That opens the door to significant further cost reductions as well as bigger impacts from reductions in OPEX (e.g., via longer-lasting electrolyzers or more plant automation). In this case, economies of scale and other improvements in electrolyzer efficiency could again become important cost drivers. It’s true that LCOE would indeed increase, but near zero renewable energy could reduce costs so much that the increased costs from low-capacity utilization would be acceptable. It’s a balancing act, but there is potentially a pathway there.
But where will the necessary green energy come from?
Unfortunately, close to zero-cost green electricity isn’t zero cost at all if it is delivered via the grid. Even for large users, electricity costs include not just the cost of production but also the cost of delivery, plus the inevitable taxes and surcharges imposed by governments (most governments charge taxes and fees on energy). For example, large customers of Southern Cal Edison are charged approximately 3.75 cents per kWh for delivery, and there are varied local taxes and surcharges as well.[42] Similar additional costs apply widely across the United States.[43]
These delivery costs are potentially devastating. To be competitive, DOE believes green hydrogen needs green electricity at less than $20/MWh, or 2 cents per kWh. But delivery fees and taxes are in themselves much more than that. In addition, of course, most grid electricity is still not 100 percent green—far from it. So “green” hydrogen using grid energy would instead be some shade of yellow (see the earlier box on “Hydrogen Colors Explained”).
The conclusion is clear: Green hydrogen producers must avoid taking energy from the grid if at all possible. The current arguments about “additionality” in both Washington and Brussels are limited to highly subsidized production regimes. That’s why the EU has concluded that green hydrogen projects can access its subsidy regime (for projects coming online in 2028 or later) only if they use “additional” green energy (i.e., projects that bring their own new green energy supplies).[44] Some form of additionality will likely be imposed in the United States as well. These additionality rules are needed when there are generous subsidies, as those subsidies allow green hydrogen producers to overcome grid fees and taxes, and could therefore be positioned to soak up scarce green energy. However, the subsidies necessary to overcome grid fees and taxes won’t be available in low-income countries. More generally, even in rich countries, green hydrogen producers will have strong incentives to avoid grid delivery.
The simplest way to do that is by colocating hydrogen production with new green energy sources. Colocation also helps avoid high national or regional electricity prices (e.g., in the United Kingdom); local electricity production costs may be much lower. Colocation is therefore highly desirable.
Green hydrogen also uses a lot of water—~9 liters per kilogram (l/kg). While even large-scale green hydrogen adoption would not significantly impact U.S. national water usage, many green hydrogen plants will likely be located in the increasingly arid Mountain, Southwest, and upper Plains states, along with Texas and California. So local water issues may well become very important in the United States, especially in the Colorado River basin. But water is challenging in many areas of the world, and water conflicts are on the rise in many regions. Successful use of salt or brackish water at scale and at low cost would be helpful.
Leaving aside economies of scale, are there breakthrough technologies coming soon to green hydrogen? Not obviously. IRENA, a strong backer of hydrogen, sees only limited progress in electrical efficiency—a seven-year decline from 58 to 52 kWh per kilogram of hydrogen. Deloitte anticipates an increase in efficiency from 65 percent to 80 percent between 2030 and 2050.[45] Still, SOECs are reaching commercialization, and have potential cost advantages because they use different chemistry with potentially less-expensive materials. Other earlier-stage technologies also offer promise.
Some conclusions emerge about green hydrogen production:
1. Currently, unsubsidized green hydrogen is six to eight times the cost of its primary existing competitor: gray hydrogen. It is about twice the cost of blue hydrogen. This is the economic backdrop for all green hydrogen development.
2. Economies of scale won’t make the difference for green hydrogen production costs.Electrolyzers will likely become cheaper as economies of scale drive down production costs, but that doesn’t matter much because they account for only a small percentage of production costs. Electricity inputs drive price, so the only way to make green hydrogen competitive is to sharply reduce electricity costs.
3. One pathway to reduced costs is to avoid electricity delivered via the grid.That energy carries significant fees and taxes. In the United States, those additional costs add on the order of 100 percent to the basic cost of production, even at wholesale prices.[46] Subsidies may pay for these costs, but that is not a path forward for low-income countries. To avoid crushing grid delivery costs, green hydrogen plants will mostly need to be colocated with green energy sources.
4. Low-cost renewable energy sources colocated with green hydrogen production may reduce costs substantially. Some green energy sources could provide electricity at or below $20/MWh, although certainly not 24/7.
5. Production costs are sensitive to capacity utilization. Reducing utilization has a significant effect on costs: at 40 percent utilization, the cost of production increases by 24 percent based on the National Renewable Energy Laboratory (NREL) model.[47] This matters, because 24/7 use of green energy requires expensive storage. Still, these additional costs may be manageable.
6. Green hydrogen will become more competitive as the energy efficiency of electrolyzers increases. Scale makes little difference to final cost, but efficiency matters a lot. A 10 percent increase in electrical efficiency means an 8.5 percent reduction in production costs.
7. If electricity costs are cut substantially, economies of scale and other efficiencies and innovation will become important. That is crucial for the medium-term outlook, but reduced electricity costs come first.
8. Green hydrogen production will require expensive subsidies for the foreseeable future. Before green hydrogen gains global traction and significant adoption in low-income countries, it must be at or near P3 with competing fuels. Currently, green hydrogen is not close to P3.
9. Research, development, and demonstration will be critically important. We do NOT have all the technologies we need to underpin a hydrogen economy. Substantial investment is needed in technologies that increase the electrical efficiency of electrolyzers, address water usage issues, and reduce or eliminate the need for scarce and expensive minerals from the supply chain. Those are top research priorities for green hydrogen production.
If green hydrogen can use this framework and get to P3, it could eventually become an extraordinarily valuable offtaker for green electricity, creating demand at times when there is none. It could also become a solution for long-duration energy storage at scale, a critical component of a renewables dominated energy system.
We have not reviewed pink hydrogen, powered by nuclear energy, because the LCOE for that energy is far higher than for other green energy sources—and because slow deployment means there is limited nuclear power available now and for the coming years.
Transporting and Storing Hydrogen
Most analysis of hydrogen production stops at the plant gate. That’s understandable: The cost to end users varies with the distance that the hydrogen must travel, plus a range of other factors (e.g., the plant and end user may be in different countries, or even different continents). However, the cost of transportation is just as real and just as important as the cost of production, so elaborate calculations that focus only on production mean little. It is the delivered price that users must pay.
Figure 6: Volumetric energy density of different fuels (MI/L)[48]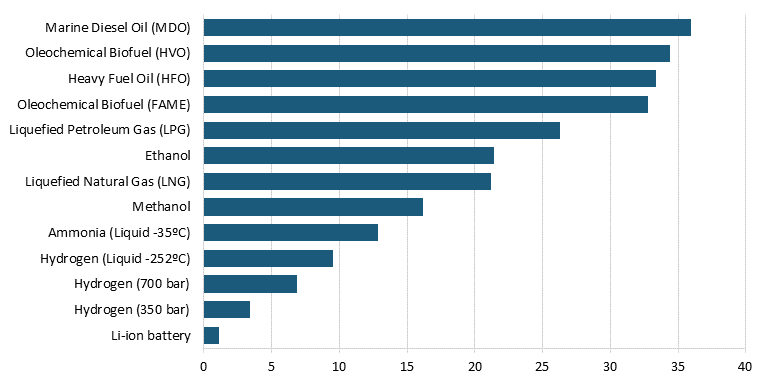
Today, hydrogen transportation isn’t much of a problem. Gray hydrogen production is often colocated with end users in oil refining and ammonia. But that will change. A recent report from the Hydrogen Council (a hydrogen trade group) calls for total hydrogen production of 660 MMT (million metric tons) by 2050, of which 400 MMT will be transported long distances.[49] And some countries are planning to rely on imported hydrogen or ammonia to transform their energy backbones. For example, “Japan aims to commercialize an international hydrogen supply chain by producing hydrogen in bulk at low cost in countries blessed with bountiful renewable energy resources coupled with marine transport infrastructure.”[50] Similarly, Germany has struck a series of agreements with African countries, including a massive project to produce green ammonia in Namibia.[51] Most of these plans seem to assume that transportation of hydrogen will be simple and cost comparable to transporting liquified natural gas (LNG) or petroleum.
That’s not the case. Most critically, it is much less energy dense than competing forms of energy (see figure 6). Liquid hydrogen has less than half the energy density of LNG, a primary competitor. Compressed hydrogen has even lower energy density (the exact energy density depends on the degree of compression), which translates directly into higher transportation costs.
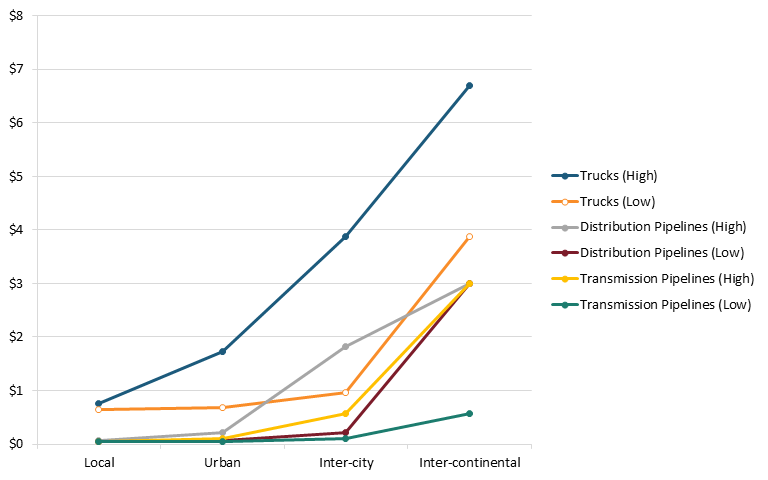
Costs vary by distance, scale, and technology. Figure 7 shows costs that range from 5 cents/kg for high volume over short distances to almost $7 per kg for intercontinental deliver by truck. While these estimates will likely change as more infrastructure is installed, they offer a useful framework for discussion.
Figure 7: Delivery costs of hydrogen by scale and distance (price per kg)[52]
Transportation by Pipeline
Pipelines are the least expensive and hence most attractive option for transporting hydrogen, which can be delivered either by blending it with natural gas and using existing pipelines or by building out new hydrogen-only pipelines. Using existing pipelines is obviously much cheaper, even if some refurbishment is necessary, but hydrogen can only be blended in at relatively low concentrations. NREL looked at the consequences of blending a 5–15 percent hydrogen mix to existing end users and concluded, “Any introduction of a hydrogen blend concentration would require extensive study, testing, and modifications to existing pipeline monitoring and maintenance practices (e.g., integrity management systems). Additional cost would be incurred as a result.”[53] It’s widely accepted that a 20 percent hydrogen mix is the maximum before steel embrittlement problems become severe.
Blending therefore doesn’t seem to be a good option for delivering large quantities of 99.99 percent pure hydrogen (needed for many industrial applications). New pipelines will be needed, but these face permitting challenges and scale limitations. While the Hydrogen Council predicts 40 new long distance pipelines by 2050, the distances make some of this impractical: Underwater pipeline links between Europe, North Africa, and the Gulf states may be feasible, but intercontinental pipelines between the United States and either Europe or Asia, and between Asia and Australia, seem out of reach.
New pipelines are also expensive. Onshore pipelines in the United States will require capital expenditures of $2.2 million to $4.5 million per kilometer. New offshore pipelines are much more expensive, at $4.5 million to $7.1 million per kilometer.[54] So a proposed pipeline from Rabat in Morocco to Seville in Spain (383 km) would cost $1.7 billion to $2.7 billion—before adding in the cost of pipelines to Rabat and also onward from Seville.
There are also substantial GHG risks to pipeline delivery. Hydrogen is a potent GHG, much more so than CO2, so any serious leaks could cut or eliminate any GHG benefits from the project. And pipelines do leak.
Trucking Hydrogen
Several proposed U.S. hubs anticipate using trucks to move hydrogen to end users, at least until sufficient scale emerges to justify building a pipeline. This avoids expensive (and initially underused) infrastructure. But shipping compressed hydrogen by truck is not cheap: A recent literature survey finds it would cost approximately $1 per kilogram per 100 km.[55] Trucking liquified hydrogen is much cheaper because it is denser, but it is still expensive, especially over longer distances, and requires more expensive facilities at either end.
Truck distribution makes the most sense when the end use is also distributed—for example, trucking hydrogen to refueling stations across a region—but that is very expensive. Hydrogen at the scale needed for industrial processes does not seem well suited to truck distribution.
Seaborne Transportation
Even liquified, hydrogen carries much less energy per unit of volume than does LNG: 60 percent less.[56] As a result, 2.5 times as much cargo space is needed for an equivalent amount of energy. Liquefied gas transporter ships cannot be made much bigger than they are today, as they need to fit through the Suez and Panama canals and into existing docking facilities. But a hydrogen carrier the size of the largest LNG carriers can carry only 40 percent of the energy, and would therefore require 2.5 times as many trips, which means 2.5 times the cost.
Hydrogen carriers will also be more expensive to operate per mile because liquid hydrogen is transported at -253oC while LNG travels at -162oC. Lower temperatures equal higher costs. Lower temperatures also mean a much higher rate of boil off during operations, which is both costly and presents GHG emission problems. Hydrogen carriers must also be built differently to resist the embrittlement that hydrogen causes to normal steel piping and valves.
Liquification and regasification are complex processes, and require additional steps to prevent re-evaporation of hydrogen (regardless of temperature). As a result, liquification consumes 30–40 percent of hydrogen’s energy content, compared with 10 percent for LNG.[57] Regasification adds a further energy tax (and cost). This all suggests that existing LNG terminals cannot easily be repurposed and therefore most existing infrastructure must be replaced.
Another approach is to avoid liquification altogether, transporting compressed hydrogen instead. Provirus Energy has designed such a ship, but at 250 bar, hydrogen provides about one-seventh the energy by volume of LNG, so shipping would require seven times the number of trips to deliver the same amount of energy.
Hydrogen can also be loaded into a chemical or metal container—such as a liquid organic hydrogen carrier (LOHC)—that allows transportation at ambient temperatures and pressures. But loading and unloading LOHCs requires the equivalent of about 30 percent of the hydrogen energy, and decades of research into metal hydrides (another alternative) have failed to generate a competitive solution.
In short, the low energy density of hydrogen in volumetric terms and its physical characteristics make transportation by sea much more expensive than shipping LNG. Micheal Liebreich has estimated that liquified hydrogen costs four to six times as much to ship as LNG, while alternative approaches do not seem promising.[58]
One final alternative is to ship hydrogen as ammonia. Countries in North Africa (Morocco) and sub-Saharan Africa (Namibia) have signed agreements with Germany to produce green hydrogen using new solar energy for transportation either by pipeline or in the form of ammonia.[59] These projects will likely come on stream well before any trans-Mediterranean pipeline is available.
Can shipping ammonia itself be cost effective? Critically, the volumetric energy density of LNG is 1.7 times that of ammonia, so more ships will be needed to ship the same amount of energy, and converting hydrogen to ammonia and then burning it as fuel imposes a heavy energy tax.
Storage
There are limited options for storing hydrogen at scale. Liquified hydrogen must be stored at very low temperatures (-253oC) or in a liquid organic hydrogen carrier. Both are expensive, as is the other nongaseous alternative: ammonia. Realistically, for LDES in particular, storage in salt caverns is the best solution; while depleted oil fields can be used and are cheaper than liquid storage, they are still far more expensive than salt caverns and risk substantial leakage through abandoned bore holes.
BNEF’s levelized cost of storage for hydrogen currently ranges from $0.23/kg for salt caverns to about $4.50/kg for liquid hydrogen and LCOH storage (see table 3 and table 4). BNEF expects these costs to fall substantially over time.
The cost of storage, and the reality that only salt caverns currently offer any scalable low-cost option, means that hydrogen production will likely be closely aligned with the availability of geologic storage; in fact, it has been a major selling point for several of the competing hydrogen hubs in the US.
Table 3: Storage options for hydrogen in a gaseous state[60]
|
Salt Caverns |
Depleted Gas Fields |
Rock Caverns |
Pressurized Containers |
|
|
Main Usage (volume and cycling) |
Large volumes, months-weeks |
Large volume, seasonal |
Medium volumes, months-weeks |
Small volumes, daily |
|
Benchmark LCOS ($/kg) |
$0.23 |
$1.90 |
$0.71 |
$0.19 |
|
Possible future LCOS |
$0.11 |
$1.07 |
$0.23 |
$0.17 |
|
Geographical availability |
Limited |
Limited |
Limited |
Not limited |
Table 4: Storage options for hydrogen in a liquid or solid state[61]
|
Liquid Nitrogen |
Ammonia |
LOHCs |
Metal Hydrides |
|
|
Main Usage (volume and cycling) |
Small—medium volumes, days-weeks |
Large volumes, months-weeks |
Large volumes, months-weeks |
Small volumes, days-weeks |
|
Benchmark LCOS ($/kg) |
$4.57 |
$2.83 |
$4.50 |
Not evaluated |
|
Possible future LCOS |
$0.95 |
$0.87 |
$1.86 |
Not evaluated |
|
Geographical availability |
Not limited |
Not limited |
Not limited |
Not limited |
While storage adds costs, these do seem manageable, provided that sufficient capacity is available locally and that large-scale commercial storage can be demonstrated quickly. A levelized cost of storage (LCOS) of 11–20 cents/kg is not a deal breaker, though above-ground storage at $1–$4/kg certainly is (future LCOS in table 3 is, of course, just an estimate).
Solving for Hydrogen: A Different Approach to Transportation and Storage
Transportation and storage impose substantial costs, and there are drawbacks to each of the main proposed methods of transporting hydrogen. We do know though that delivery by truck is always very expensive, and that pipelines must deliver large quantities of hydrogen gas in order to reach any kind of efficiency.
Avoiding transportation as much as possible is a key to reaching P3. The transportation burden is also one that competing technologies long ago amortized: LNG pipelines already exist and are largely paid for, gray hydrogen is very often produced on site by end users, and low-scale regional delivery networks are part of the existing hydrogen ecosystem.
Systems that require the widespread distribution of hydrogen (e.g., for fuel cell electric vehicles (FCEVs)) face enormous transportation and delivery costs; that’s largely why hydrogen fuel at the pump in California just hit $36/kg, even after substantial state investment, to subsidize the cost of refueling stations. California may be especially expensive, but the cost of delivery networks for hydrogen is substantial and inescapable.
Markets and End Users
Markets divide into existing markets currently served by high-emission gray hydrogen and prospective markets served today by nonhydrogen technologies.
Existing Markets for Hydrogen
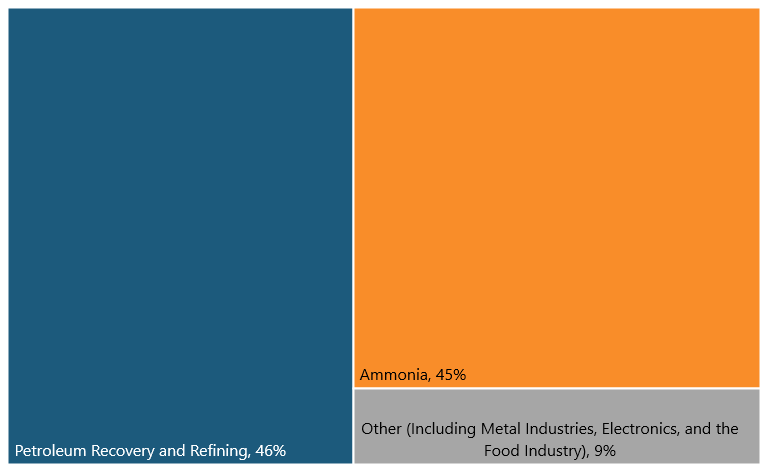
Oil refining and ammonia production, along with the smaller market for chemicals, use about 70 MMT of hydrogen production annually. Will these markets be the first to adopt clean hydrogen? At least these markets exist and there are buyers—and it seems natural to assume that, as clean hydrogen becomes competitive, these markets will be among the first to switch.[62]
However, clean hydrogen will find these markets very hard to crack. They are almost entirely supplied by gray hydrogen production facilities, which, in many cases are colocated with (and often share ownership with) the ammonia and refining plants. These gray hydrogen facilities thus avoid any transportation costs, and produce hydrogen at the lowest cost. They also represent existing sunk costs for refinery and ammonia plant owners.
Figure 8: Existing markets for hydrogen[63]
Hydrogen and Ammonia For Fertilizer
Globally, about 190 million tons of ammonia are produced annually, almost all using fossil fuels as feedstock for the standard Haber-Bosch process. Production accounts for about 1 percent of world energy use, and emits around 500 MT of CO2 annually. Around 80 percent is used for fertilizer, and about 50 percent of world food production relies on ammonia.[64] In contrast, less than 1 percent of production is used for power generation, mostly for pilots and demonstrations.[65]
So cleaning the ammonia production process is a distinct priority for decarbonization, and clean hydrogen could offer a pathway. The Heartland Hydrogen Hub, one of the winning hydrogen hub proposals to be funded by DOE, is focused on using clean hydrogen to reduce emissions from ammonia for fertilizer. The hub has not announced a fuel source, but it is expected to use blue hydrogen made using natural gas.[66]
However, as noted, gray hydrogen is deeply embedded and will remain cheaper than clean hydrogen. Subsidies might close the gap, and adding CCUS to existing gray hydrogen plants might not be a deal breaker. Once again, though, reliance on indefinite subsidies or carbon blocking regulation is a significant risk.
Hydrogen and Oil Refining
Hydrogen is used as both a catalyst in oil refining (to stimulate chemical reactions) and as a process byproduct that, in certain concentrations, can indicate that some critical action must be taken. For a typical oil refinery, real-time measurements of hydrogen can be critical at multiple physical locations.[67]
In recent years, while total demand for hydrogen in oil refineries has increased quite sharply as oil production has expanded, on-site production for oil refineries has changed very little, at least in the United States.[68] The U.S. Energy Information Administration has calculated that off-site production was up 135 percent between 2008 and 2014 and now accounts for more than half of the total.[69] So there is increasing room for third-party providers, although almost half of production is still on-site and is therefore tied to production owned by the oil refineries themselves.
Only blue hydrogen can replace gray hydrogen at colocated plants. Economically competitive sources of green hydrogen are unlikely to be available, and while adding CCUS to existing plants is challenging within the footprint of existing plants, it is not impossible. Gray hydrogen produced off-site also has certain competitive advantages over clean hydrogen, notably cost and existing distribution networks. Overall, clean hydrogen will struggle to break into the ammonia and oil refining markets.
New Markets for Hydrogen
Instead of competing in markets where incumbents are deeply entrenched and clean hydrogen will struggle to meet P3, perhaps new markets without the gray hydrogen incumbents will be easier. Their absence, however, does not mean there are no incumbents; every new market already has incumbents using nonhydrogen technologies.
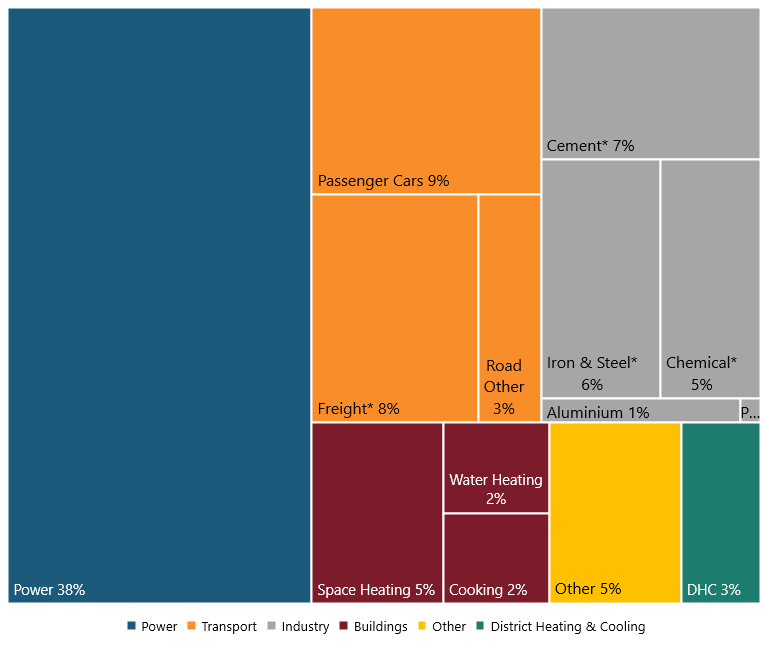
Figure 9 shows markets that have been identified both as significant sources of GHG emissions and as especially hard to decarbonize using existing technologies; in short, they are not good candidates for electrification. To them could be added aviation and shipping, neither of which will be electrified (batteries are simply too heavy).
These hard-to-decarbonize sectors—notably heavy transportation, chemicals, steel, and cement—are potential new markets for hydrogen. More speculative arguments have pushed hydrogen as solutions for light vehicles and building heating, aviation, and shipping. Hydrogen could also play various roles in decarbonizing the power sector itself.
Unfortunately, new markets turn out to be mostly a mirage, as the following analyses demonstrate.
Figure 9: Global GHG emissions by sector (* = no economically viable option for deep decarbonization)[70]
Road Transportation
Light-Weight Fuel Cell Electric Vehicles
Among the proposed future markets for hydrogen, FCEVs stand out. An FCEV world would generate enormous demand for hydrogen—and California is that world’s test case. The state is currently planning to expand its network of hydrogen refueling stations in line with its Zero Emission Vehicle (ZEV) program, which requires all vehicles sold in California to be zero emission by 2035.[71]
California has spent more than $100 million on FCEV infrastructure. And given the long distances driven by California drivers, it is also the state where the range limitations of EVs become more apparent. Yet, despite California’s plunge into hydrogen, FCEVs for light vehicles are simply not competitive now, and won’t be competitive in the future. Fighting on two fronts—against ICE engines and EVs—there is no competitive path forward for FCEVs, despite the heavy regulatory thumb on the scale in California. Battery EVs made up 22.6 percent of California’s new car sales in the second quarter of 2023, up 5 percentage points over Q2 2022. Fuel cells’ share fell to just 0.23 percent, and there are fewer than 12,000 FCEV vehicles on its roads today.[72]
FCEV for light vehicles is failing for three basic reasons. First, the conversion of energy to hydrogen and then back again results in low efficiency and hence high costs. Second, there is no widespread charging infrastructure to support use of FCEVs, and building it would cost billions of dollars. Finally, producing and delivering the hydrogen needed is enormously expensive, resulting in running costs that are many times those for BEVs and ICE engines.
Figure 10: PEM FCEV efficiency[73]
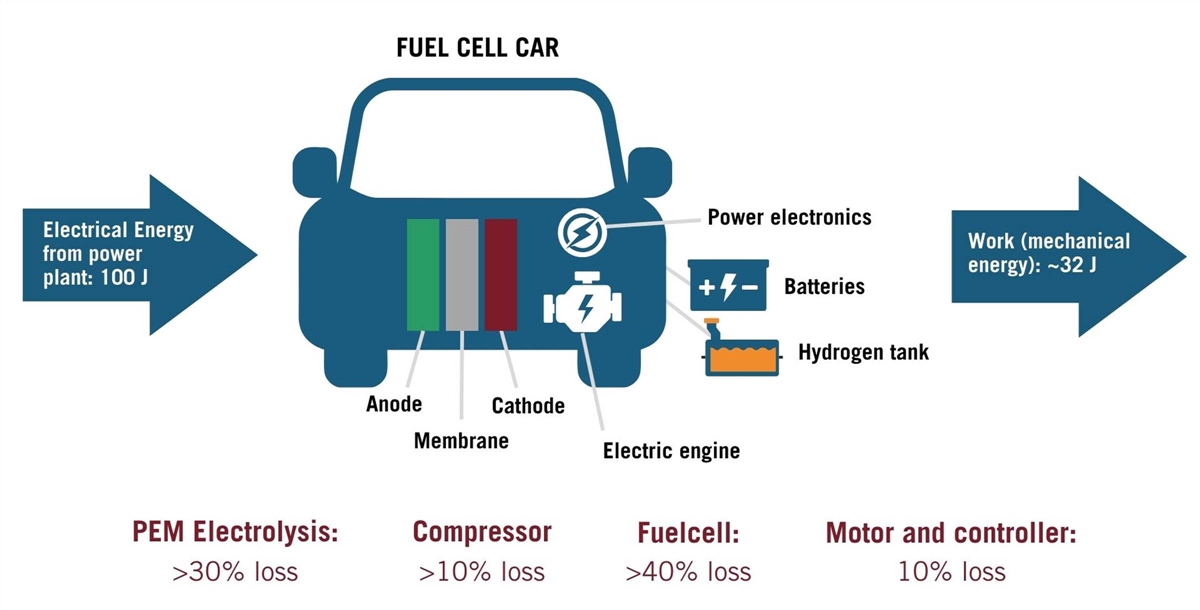
FCEVs require multiple steps to shift power from the grid to the wheels, but at each step, energy is lost. Paul Martin’s deconstruction of the FCEV power flow demonstrates this quite clearly:[74]
▪ 6 percent loss from grid distribution leakages
▪ 30 percent loss from electrolysis, where 70 percent is already an ambitious level of electrical efficiency
▪ 10 percent loss from compressing the hydrogen for use in the fuel cell
▪ 40–50 percent loss from PEM fuel cell operations (the ultimate thermodynamic limit is about 83 percent)[75]
▪ 10 percent loss from drive train efficiency
In the end, the total grid-to-wheels efficiency is about 32 percent (see figure 10). BEVs avoid most of these steps and operate at about 77 percent efficiency, so BEVs are currently more than twice as efficient as FCEVs.[76]
FCEVs need substantial fueling infrastructure, as they cannot be charged at home or at the office like BEVs can. This is an enormous problem, which can be solved only by the deployment of fueling stations. But this is impossible, as doing so would cost an enormous amount—evidence from Europe suggests current costs of ~$8 million per station, with thousands of stations needed.[77] Land purchases and permitting would be extremely difficult at the scale that’s needed, as new hydrogen fueling stations cannot simply replace the 8,000 existing gas stations in California—they will be needed to fuel ICE vehicles for decades.[78] And FCEVs are green only if the electricity used for hydrogen production is green, and that is in relatively short supply. As Paul Martin observed, “If the source electricity isn’t green, FCEVs just become an elaborate (and expensive) way of emitting carbon from grid sources rather than vehicles.”[79]
As elsewhere, though, the final deal breaker is the cost of hydrogen. Toyota’s hydrogen-powered Mirae is comparable to a Tesla 3 in many respects, but in September 2023, California’s largest hydrogen fuel retailer increased the per-kilo price of hydrogen to $36 at the pump. Based on the 400-mile range announced by Toyota for the Mirae, it would cost more than $200 to fill the tank—and the Mirae would cost 14 times as much to operate (50 cents per mile, compared with 3 cents for the Tesla 3).[80]
FCEVs still have a few advantages. They can charge much more quickly than EVs, and they could have a significantly longer range (although Toyota’s recent announcement of a 700 mile-per-charge solid-state battery may eliminate that advantage). But those advantages are not nearly big enough to overcome the three core disadvantages described previously. FCEVs for light vehicles are therefore just a fantasy.
Heavy-Duty Trucks
In contrast to light vehicles, heavy fuel cell electric vehicles (HFCEVs) do have some potential advantages for long distance routes: Notably, they refuel rapidly and hence reduce costly wait time; BEV batteries are heavy so capacity must be limited.[81] DOE’s hydrogen roadmap assumes that hydrogen may be workable for long-range hauling at 750 miles/day or beyond, although around two-thirds of freight by weight travels less than 250 miles.[82]
California is again leading the way on regulations (see the box below on “California Truck Regulations: A Force-First Approach”), where a technology-neutral model is setting up a competition in trucking between BEVs and HFCEVs. Of course, any take-up of clean vehicles over existing ICE trucks would be driven by regulation and subsidies, as no hydrogen (or BEV) trucks are P3 competitive.[83]
California Truck Regulations: A Force-First Approach
Advanced Clean Fleet (ACF) regulations require fleet operators to adopt an increasing percentage of zero emission vehicles (ZEVs) (including BEVs, electric hybrids, and HFCVs). The ACF identified three key segments for action:High priority fleets (>50 trucks or >$50 million in annual revenue), drayage truck fleets (trucks that operate at California ports or intermodal rail yards), and public fleets (fleets owned by state and local governments).
1. High-priority fleet operators must either purchase only new ZEVs starting in January 2024 (!) and must retire all ICEs in use for the lesser of 13 years or 800,000 miles, or match fleet composition to specific percentage targets based on vehicle year and model.
2. All drayage fleet vehicles must be ZEV by 2035; after 2024, only ZEVs can be purchased and all ICEs must be retired once they reach 800,000 miles or 18 years.
3. Public fleet compliance requires that 50 percent of new vehicle purchases from now until 2026 be ZEVs; from 2027 onwards, 100 percent of purchases must be ZEVs.
It’s true that charging times for HCFEVs are much shorter than for BEVs, but, even though HCFEVs take only a few minutes to fill up and BEVs require at least an hour to recharge (using one of the very few extremely fast chargers now available), charging time matters much less than it might seem.
In Europe, drivers may drive for nine hours, after which they must take at least a nine-hour break. They also must take a 30-minute break after 4.5 hours. In the United States, they must take an 11-hour break after 11 hours on the road, with a 30-minute break after 8 hours.[84] Those breaks are opportunities to refuel. Assuming that trucks are driven at an average of 60 mph, they can travel 660 miles in a day in the United States and 540 miles in the EU, and must take one 30-minute break.
Those breaks are critical. HFCEV vehicles can charge in only a few minutes, so charging time for them is not a concern. For BEVs, very high-speed chargers such as Tesla’s can completely charge a BEVS 900 kWh battery in about an hour and a quarter, and Tesla’s batteries seem capable of providing 450 miles per charge, according to Pepsi, which is piloting their use.[85], During a 30-minute break a truck can add perhaps 350 kWh of energy (using a Supercharger), enough to drive least 175 additional miles. So, in principle, that’s close to meeting the daily drive of 660 miles. BEV battery technology is also improving quite quickly (e.g., Toyota’s recently announced solid-state batteries). So mandatory rest stops at least in principle provide enough time to charge heavy BEVs—if there are enough chargers.
Currently, of course, there is no network of either HFCEV or super-fast BEV chargers, and the cost and difficulty of deploying one will be substantial. That’s why both BEVs and HFCEVs will start by working on specific long-distance routes. Charging stations are already being built for light BEVs across the country, so extending that to truck charging stations is not a substantial stretch. And every truck stop already has electricity—BEV chargers won’t need elaborate energy delivery networks.
In France, estimated CAPEX per charging station is $360,000 for BEVs and $5.6 million for HFCEVs (as of 2030). However, the same study concludes that a longer refueling time means that a single refueling station could handle 110 HFCEVs daily, but only 20 BEVs. So despite lower costs per station, the annual cost of infrastructure per vehicle is 45 percent higher for BEVs. Longer refueling times also mean that many more chargers will need to be built, which adds further difficulties, especially in more urban areas.[86] That could be a deal breaker for BEV trucks.
The initial strategy for both BEVs and HFCEVs is to focus on specific routes (also referenced in several of the U.S. hydrogen hub proposals). There are now three long distance HFCEV routes at the planning stage in the United States: GTI energy H2LA (Houston to Los Angeles; the I-10 Hydrogen Corridor Project); Calstart East Coast Commercial ZEV Corridor (I-95 corridor spanning Georgia to New Jersey); and the Cummins MD-HD ZEV project (the I-80 Midwest Corridor).[87] This is also the strategy being adopted by Tesla, which is seeking $97 million in federal funds (plus $24 million of its own) to build a 1,800-mile BEV Megacharger corridor between its factory in Fremont, California, and Laredo, Texas.[88] Tesla seems to be further advanced in its planning, and has signed up a number of vehicle manufacturers to use its technology, which is quickly emerging as the industry standard. It would be no surprise if the first leg of the Tesla Megacharger network gets built long before the HFCEV corridors are off the ground.
What does this tell us about markets for hydrogen? To begin with, we should remember that all ZEV markets for heavy trucks are entirely dependent on regulations that force their adoption. And while ambitious regulations can be put in place, they may not survive contact with reality. American Trucking Association president and CEO Chris Spear noted that “the decision to force motor carriers to purchase zero emission vehicles ignores the fact that these trucks are early-stage technologies and the infrastructure to support them does not exist.”[89]
Still, heavy trucks are mentioned in almost every laundry list of sectors that are hard to decarbonize, and hence are also listed as likely candidates for a shift to hydrogen. But despite some advantages over BEVs, HCFEVs are in a race to reach and dominate the market that for many reasons they are not likely to win. Data from France suggests that the total cost of ownership for HFCEVs will be significantly higher than that for BEVs well into the future, even for long distance trucking, although NREL found that the total cost of ownership for HFCEVs was lower than for heavy BEVs and competitive with diesel on long distance routes (albeit using some fairly favorable assumptions).[90]
Rolling out the charging infrastructure for both technologies will be immensely challenging, but the mountains of obstacles facing HFCEVs seem considerably higher. Certain specific corridors could find ways to support sustainable HCFEV routes, but everywhere else, HCFEVs will be second or third best (depending on the degree to which regulation forces ICE vehicles off the roads).
Even if the corridors pan out, HFCEVs will likely not provide the massive demand that the clean hydrogen economy requires to get off the ground. There may well be some corridors, especially given the massive subsidies available in the United States, but even with these subsidies, HFCEVs won’t be dominating the heavy truck market. And that’s the best case for hydrogen: In low-income countries, HFCEVs will not be close to P3 against either ICE or BEV alternatives. That helps to explain why Cummins, a major player, noted (in the course of a very optimistic presentation) that only 2.5 percent of Class 8 heavy duty trucks will be HFCEVs by 2030 in the United States.[91]
California Subsidies and Supports
California provides an extraordinary array of subsidies and supports for ZEVs. They include: the California Air Resources Board (CARB) Bus Replacement Grant (replacing shuttle, transit, and school buses); the Heavy Duty Low Emission Vehicle Replacement Grant (replacing class 7 and 8 trucks); Low Emission Truck and Bus Purchase Vouchers (reducing the incremental cost of qualified electric, hybrid, and natural gas buses); Plug-In Hybrid and Zero Emission Light-Duty Vehicle Rebates (rebates for the purchase or lease of qualified vehicles by the CARB below a maximum income threshold); the Bay Area Vehicle Replacement Program (cash incentive to turn in operable and registered vehicles made before 1998 for scrapping); the California Electric Vehicle Infrastructure Project (CALeVIP) (provides guidance and funding for property owners to develop and implement EV charging station incentive programs); the Clean Vehicle Rebate Project; the Clean Transportation Program (invests up to $100 million annually in a broad portfolio of transportation and fuel transportation projects throughout the state); and other programs offerring high-occupance vehicle (HOV) exemptions, weight limit exemptions, tax exemptions, charging station rebates, and many more.
Drayage, Buses, and Other Clusters
California’s Advanced Clean Fleets Rule will directly affect the Port of Los Angeles, as drayage trucks will need to be zero emissions by 2035.[92] That implies major expenditures, as clean energy trucks will cost $800,000 or more, compared with $150,000–$175,000 for diesel, although California subsidies offer up to $520,000 for qualifying vehicles traveling at least 52,000 miles annually.[93]
Essentially, the California model is to regulate first and then soften the blow with subsidies. This of course is far from a P3-style policy, but it also leaves hydrogen-powered vehicles facing direct competition with BEVs. As there is no existing hydrogen supply chain, and fuel costs account for about 70 percent of total ownership cost over the vehicle’s lifespan, relying on HFCEVs is very risky for fleet operators. The recent explosive price increase in hydrogen refueling costs will not have been encouraging.
Real limits on time in use for BEVs could offer certain competitive advantages for HFCEVs—BEV drayage vehicles in one port could only handle seven to eight hours of heavy work between charges, which implies the purchase of additional vehicles.[94] HFCEVs don’t face that recharging problem, and the geographically concentrated use (in a port) means there is no need to build out a widely distributed hydrogen refueling network. That’s an important factor.
The port transition has barely begun, and most bus fleets are not yet transitioning to ZEV, so it’s unclear whether BEVs or HFCEVs will dominate in these niche markets. We do, however, know that the capital cost of HFCEV vehicles is likely to be substantially more than for BEVs, even after California subsidies. This seems to apply across all heavy vehicle classes (including close-to-shore maritime tugs, for example).[95]
As with other niche markets, outcomes for the BEV/HFCEV race in drayage and buses will likely be determined by the extent to which BEVs resolve limitations imposed by recharging needs, and consequently by the capacity of leading BEV producers to reach scale quickly, while meeting domestic production requirements for the rich subsidies available in the United States and EU. While outcomes are uncertain, it is abundantly clear that these markets are not in any sense focused on P3. On the contrary, policymakers are focused on forcing the transition through regulation and matching subsidies.
Local Delivery
While there has been little interest in the United States in converting local delivery vehicles to FCEVs, one useful practical study was completed in Berlin, Germany, looking at food distribution. Berlin has 1,057 food markets placing 1,928 orders daily, fulfilled by 15 suppliers (carriers) with 17 distribution centers. Fresh, dry, and frozen are handled separately. The study assumes a delivered hydrogen price of €7.13/kg, and compares BEV and HFCEV alternatives to existing diesel delivery vehicles. It finds that BEVs would cost 17–23 percent more than diesels, but FECVs are even more expensive—22–57 percent more. The study concludes that, for urban delivery, BEVs offer a decisively better alternative to ICEs, unless the cost of hydrogen falls dramatically.[96]
Aviation
Aviation accounts for about 2.5 percent of global CO2 emissions and 3.5 percent of global warming when non-CO2 climate impacts are considered (the remainder comes from contrails, a different problem with different solutions).[97] Passenger air travel has now almost entirely recovered from the collapse during the COVID-19 pandemic, is booming in Asia in particular, and Boeing anticipates that, by 2025, it will have reached 120 percent of its pre-pandemic peak.[98]
To date, the EU has taken the lead in pressing for more sustainable fuels. As with California’s approach to ZEVs, the EU is imposing tight requirements that would force the adoption of sustainable aviation fuels (SAFs). The EU’s ReFuelEU Aviation regulations require that SAF fuels account for 2 percent of all fuel at EU airports by 2025, rising to 70 percent by 2050.[99]
Low-income countries might not be enthusiastic, but if flights ending in the EU (and perhaps eventually the United States) are forced to meet SAF requirements, their airlines might not have much choice. Fuel costs account for only around one-third of ticket prices, so a significant jump there might not translate into unsustainably high overall ticket prices. And of course, airline passengers are as a whole much wealthier than non-flyers, so the capacity to meet higher prices is greater, and airline tickets are in any event only a small percentage of their overall annual budgets.
So where does hydrogen fit into the sustainable aviation revolution? There are efforts to go directly to hydrogen-powered flight.Rolls-Royce and EasyJet recently tested a turboprop engine on pure hydrogen.[100] Airbus hopes to bring to market a 100-seat, 1,150-mile (1,850 km) range hydrogen-powered airplane by 2035.[101] Smaller hydrogen-powered aircraft will come earlier, perhaps even by 2025, from start-ups such as ZeroAvia and H2FLY.
However, current planes cannot use hydrogen directly. “Retrofitting an airliner with hydrogen engines is not a viable way to serve airlines,” according to Airbus’s head of ZEROe demonstrators and tests, Mathias Andriamisaina. “An aircraft with low maintenance and operating costs with hydrogen propulsion must start from a clean-sheet design with freedom to play with the locations of tanks and passengers.” Hydrogen-powered airplanes will likely require the use of liquid hydrogen because it is 80 percent more dense than gaseous hydrogen and thus takes far less fuel tank space. But that will in turn require onboard cryogenic systems—as liquid hydrogen is stored at -253oC—and a complete redesign because liquid hydrogen is still much less energy dense than Jet A, and hence requires much more space onboard to store it. As Michael Liebreich points out, replacing Jet-A with liquid hydrogen for the maximum take-off fuel load for a long-haul aircraft would require more space than the entire swept volume of its fuselage. For short-haul hydrogen-powered flights, such as those of interest to EasyJet, the fuel tank would take up around a third of the fuselage.[102] That’s why Airbus believes a complete redesign is necessary.[103]
Hydrogen planes would also likely require hydrogen-powered gas turbines, as fuel cells are simply too heavy to use for anything more than short-distance flights, especially as they require cooling, while turbines are self-venting. The high temperatures needed for current generation turbines would however generate nitrogen oxides (NOx), which fuel cells do not. And while hydrogen-powered flight would reduce direct GHG emissions, it could also make contrails much worse, as it generates three times as much water byproduct as does Jet A fuel.
Airports are also a major problem, as there is currently no infrastructure for hydrogen refueling. Airbus proposes hydrogen production hubs at airports, which might have cross-sector synergies. But scale issues are devastating: Current global production of liquified hydrogen would only be enough to power aviation at a single small airport.[104] Replacing Jet A with liquid hydrogen at Heathrow would require 2,300 trucks daily. The alternative is a pipeline that would deliver gaseous hydrogen, but the sheer scale of energy use in aviation poses other problems. Meeting hydrogen needs at Heathrow, would take 2.7 gigawatts (GW) of green electrical power, and would also require an enormous heat sink to accommodate the extracted heat. This is a severe chicken-and-egg problem: Demand must exist before production facilities are built, but demand cannot exist without those facilities, which must be built in tightly constrained physical spaces. Further, green hydrogen needs to be colocated with green production, and that production is also best colocated with end users. Neither would be possible near most major airports, as airlines explained to the U.S. Government Accountability Office (GAO).[105]
If hydrogen-powered flight will not exist at scale within the foreseeable future, perhaps hydrogen has a role to play in decarbonization through the production of efuels, as one possible pathway toward greener aviation.
Sustainable aviation fuel (SAF) has been a focus of attention before, albeit with little result. Between 2007 and 2010, major commitments were made by airlines and governments (e.g., in 2007, the International Air Transport Association called for SAF to account for 10 percent of all fuel by 2017). But SAF accounts for less than 1 percent of U.S. jet fuel usage—primarily in California, where it benefits from significant state tax incentives.[106]
SAF is a drop-in fuel that can be used directly in existing aircraft without sacrificing performance. The cost and scale of SAF varies by production pathway, but even the most advanced of these, hydroprocessed esters and fatty acids (HEFA) made from waste oils and fats, is still two to three times the cost of Jet A. Quantities are also limited, and it is extremely hard to scale.[107] Global SAF production totaled 80 million gallons in 2022, compared with 60 billion gallons of Jet A consumed in the same year.[108]
Optimists argue that the price of SAF will decline, and the Rhodium Group projects that the lowest-cost HEFA-based SAF will be able to compete with fossil-based jet fuel by 2027 with Inflation Reduction Act (IRA) subsidies.[109] However, HEFA production costs won’t decline much, scaling production to meet aviation industry needs is impossible, and there are other competing uses to consider as well.[110]
Other pathways will be easier to scale, at least in theory. Notably, SAF can be produced from hydrogen and carbon. This is known as “e-kerosene,” often described as the power-to-liquid pathway. This does not face severe feedstock limitations, but it is prohibitively expensive. Clean hydrogen production accounts for at least 70 percent of production costs, and as we have seen, any decline in those costs is highly dependent on declining green electricity prices.[111] E-kerosene also requires large-scale facilities, which can cost $1 billion or more according to GAO, and involve considerable technological and market risk.[112] Still, EU regulations do now demand the increasing use of SAF, and that will mitigate start-up risks to a considerable extent. E-kerosene production is therefore likely in the EU, even though it will remain far from price competitive. The extent to which governments accept the pain of regulation-driven price increases outside Europe remains to be seen. Still, a massive regulation-driven increase in SAF, perhaps with subsidies such as those in the IRA, would make e-kerosene one significant market for hydrogen, at least in the EU, although the IRA subsidies are time-limited and it seems unlikely that e-kerosene will be at P3 by the time they expire.
Steel
Steelmaking accounts for about 6 percent of GHG emissions globally, around 2.5 gigatons (GT) of CO2 annually (driven largely by the dominance of coal in the production process). That share is likely to increase quickly as steelmaking grows rapidly, especially in lower income countries. In 2021, China produced just over 1,000 MT, more than half of all steel produced globally that year—although production is growing rapidly in India, which, by 2050, is expected to produce almost one-fifth of all steel produced globally, up from about 5 percent today.[113]
There is a technical pathway for decarbonizing steel: replacing the dominant blast furnace production model with green steel. Steel is traditionally made using coke—a high-carbon fuel made by heating coal without air—to melt iron out of iron ore. That requires very high temperatures (1,200°C), which are typically achieved by burning coal or gas, which creates substantial emissions. Traditional blast furnaces then turn the resulting iron into steel, generating more GHG.
Figure 11: Green steel technology[114]
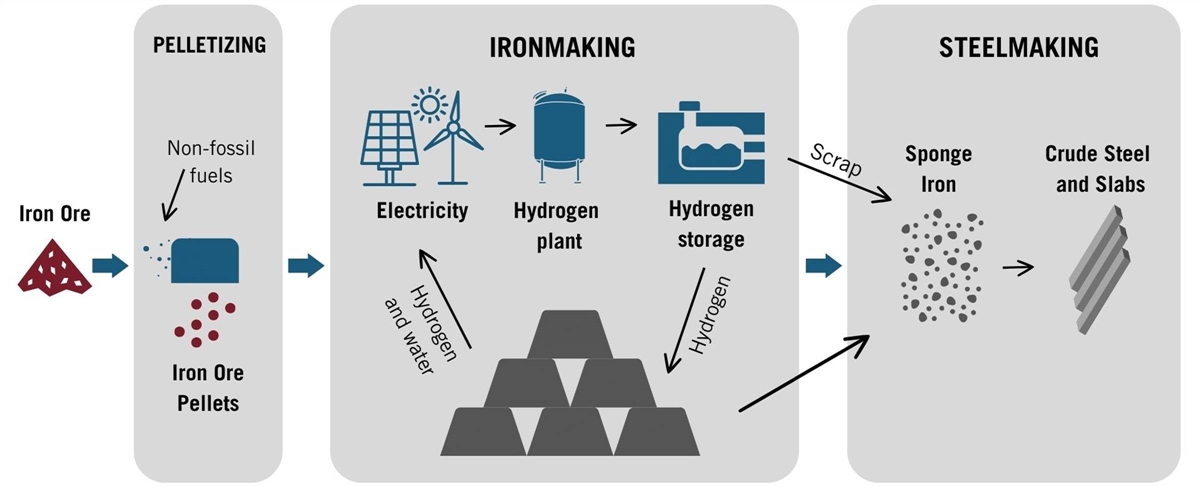
DRI offers a different pathway, one that replaces technologies that generate CO2 with cleaner technologies in all three stages: pelletizing iron ore, making iron, and then turning iron into steel. H2-DRI uses hydrogen in the second stage (iron making) where the hot blast furnace is replaced by DRI technology, which removes oxygen from iron ore at lower temperatures (800–1,200oC). That produces sponge iron, which is then converted into steel using electric arc furnaces to take advantage of the heat generated by DRI (scrap steel is also added in at this point). Using electricity for pelletizing can further reduce GHG emissions.
H2-DRI has significant advantages over blast furnaces: DRI furnaces don’t need to be part of a large integrated steel production plant, both CAPEX and OPEX are lower, and DRI works better with scrap metal. It also offers more opportunity for using the off gases created by arc furnace operations (worth perhaps 7 cents/kg).[115] It’s especially well-suited for smaller scale production, for example in minimills.
But DRI is a relatively new technology, and accounted for only about 127 MT in 2022, roughly 6.5 percent of global steel production. And DRI is not necessarily clean: India is the world’s leading producer of DRI, but most of it is produced using coal, while the second largest producer is Iran, which uses natural gas.[116]
Hydrogen has been proposed as the key driver for a shift to clean DRI, but it faces critical challenges:
▪ Most steel production is in China and India, so getting to P3 remains critical. Expensive technologies won’t be widely adopted.
▪ Currently, green hydrogen is much too expensive to allow H2-DRI to compete with either blast furnaces or fossil fuel DRI. A recent academic study finds that H2-DRI would be cost competitive at a hydrogen price of $1.63/kg.[117]
▪ As in other sectors, H2-DRI faces a double challenge: It will have to compete with both the traditional blast furnace model, which is still the most efficient for large-scale production and embodies enormous sunk investments, and “dirty” DRI, powered not by hydrogen but by coal or natural gas or even gray hydrogen. Beating the competition requires a large cut in the cost of green hydrogen.
▪ Scaling up will be a major challenge. Converting all steel production to H2-DRI would require more than 1 terawatt (TW) of new electrolyzer capacity.[118] According to IEA, global electrolyzer production was around 11 GW in 2022—1 percent of the projected need.[119]
▪ Green steel requires green hydrogen, which requires green electricity. Conversion to H2-DRI would require the addition of about 1.3 TW of renewable energy capacity (about 0.3 TW was added globally in 2022).[120] Existing projects in Sweden demonstrate just how damaging the diversion of green electricity into steel might be for net GHG emissions.[121]
Despite the challenges, there is plenty of activity, but it is at a very early stage. DRI production started to grow rapidly after 2016 (see figure 12), But it mostly based on non-renewable energy. ArcelorMittal, Saltzgitter AG, and ThyssenKrupp have plants under construction for commercial operation in 2025–2026, and an SSAD plant is scheduled to start commercial operations in 2026. Others are at the feasibility and planning stages.
Figure 12: DRI annual production (MTa)[122]
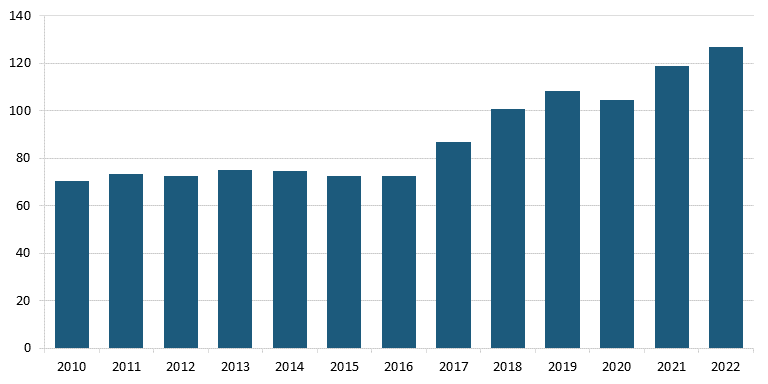
Even proposed plants are mostly hedging their technological bets, hoping that natural gas plus CCUS will solve their emission problems. For example, ArcelorMittal’s Dofasco steel mill in Hamilton, Ontario, will produce 2 MTa using natural gas as the reducing agent and will be able to use a hydrogen mix of up to 100 percent. While running natural gas, the plant will use CCUS to capture emissions.[123] Hydrogen will therefore have to compete directly with other fuels.
H2-DRI will become competitive when the price and availability of green hydrogen reaches P3. So even under its most optimistic Sustainable Development Scenario, IEA projects that hydrogen use in steel as energy consumption will reach 62 MTa by 2050, less than 10 percent of total energy consumption for steel, and that hydrogen will account for 8 percent of all steel GHG reductions by 2050.[124]
As in other sectors, hydrogen will be a second-best source of GHG mitigation technologies for steel, a solution that works but is not competitive against a range of alternatives.
Cement
Global cement production generates about 3 GtCO2/year (about 7 percent of emissions), and cement is always mentioned in the list of hard-to-decarbonized industries, but only 40 percent of cement GHG emissions come from fossil fuel combustion. The remainder are derived from the calcination of limestone and from calcium carbonate for clinker, a component in cement, both of which are beyond any impact from hydrogen. Hydrogen’s primary role would be as replacement for fossil fuels in heating during the cement production process.
Even a straight substitution of hydrogen for natural gas faces significant challenges, although hydrogen does burn at a high heat and high flux (levels can be changed quickly), which are competitive advantages. IEA notes that, compared with natural gas, hydrogen (i) has a higher combustion velocity and nonluminous flame (potentially requiring sensors, controls, or added gases), (ii) has lower radiation heat transfer (potentially requiring added material for heat transport and new burners), and (iii) may cause corrosion or brittleness in certain metals (potentially requiring protective coatings).[125]
Maybe these challenges can be overcome, but as in other sectors where clean hydrogen must compete directly with fossil fuels (gas and coal, depending on the local market), we are currently far from P3: A BNEF report concludes that clean hydrogen would need a delivered price of $1.00/kgH2 to be a competitive source of heat—along with a carbon price of $60/tCO2.”[126] We are at best decades away from meeting that price.
Unsurprisingly, then, even in carefully designed emissions reduction programs for cement, hydrogen figures minimally or not at all. A recent report from Chatham House argues that fuel substitution would focus on biomass and in particular wood pellets, not hydrogen.[127] While there are a few hydrogen-related pilot projects under way, aiming to inject some percentage of hydrogen into the combustion chamber, there is no real sign that hydrogen will play a significant role in decarbonizing cement.[128] Another study identifies five major pathways to emissions reduction for cement—and hydrogen is not one of them.[129] What we are left with is hydrogen proponents casting around for markets that make sense. This one doesn’t.
Power From Ammonia
Ammonia has decarbonization potential because burning it generates only nitrogen and water, and because it is produced using hydrogen. But using ammonia for fuel also requires higher combustion temperatures than do ICE engines, as well as a more tightly defined flammability range and lower combustion efficiency, and it generates much higher NOx emissions, which have much worse long-term GHG effects than does CO2, unless they are captured at the source. Ammonia is also much less dense than competing fossil fuels, so transportation costs are higher.
Still, there are significant efforts under way to use ammonia in the power production chain. Japan leads efforts to develop the Hydrogen->Ammonia->Power (H->A->P) model (though Germany is also very active). Japan’s decarbonization plans focus on replacing coal with ammonia (primarily from Australia) as feedstock for its existing power stations. It plans to introduce ammonia as fuel at increasing levels, starting at 20 percent and reaching 100 percent by 2050. This is a core component of Japan’s energy strategy.[130]
Like other pathways with multiple steps, the H->A->P pathway exacts a punishing energy-efficiency tax at every step: producing green hydrogen (70 percent efficiency); making ammonia via the Haber-Bosch process (70 percent efficiency); liquefying the resulting ammonia for transportation (90 percent efficiency); shipping it (90 percent efficiency); and burning it to generate power (45 percent efficiency). The end-to-end efficiency is only 20 percent, so the resulting power will cost five times as much as the original renewable energy, even ignoring additional costs involved in each step in this complex supply chain, including the massive transportation costs involved in shipping ammonia from Australia to Japan.[131] A detailed analysis of Japan’s H->A->P strategy by BNEF finds a disaster in the making:[132]
▪ Until ammonia reaches 50 percent of production, CO2 emissions will be higher than from an equivalent combined cycle gas turbine (CCGT).
▪ Coal/ammonia plants may emit more NOx.
▪ LCOE for a retrofitted coal plant using 50 percent clean ammonia will be at least $136/MWh in 2030, a cost that will reach at least $168/MWh for a plant running 100 percent ammonia in 2050. By comparison, the estimated cost of a 100 percent renewable system (including backup power and transmission upgrades) is $86–$112/MWh.[133]
▪ Strategically, this model creates new energy dependence on green ammonia producers in Australia and possibly also Africa.
In addition, the cost of transporting ammonia is much higher than transporting a similar amount of LNG, because ammonia is much less energy dense and hence requires more shipments to generate the same amount of energy. Transporting enough ammonia from Australia to Japan would be a large additional expense.
H->A->P is therefore not price competitive with existing fossil-based production. But it is not even competitive with renewables, especially for projects that require significant transportation. LCOEs for wind, solar, and even CCGT + carbon capture are already much lower than the H->A->P cost levels predicted by BNEF, and those costs are falling. Fully implementing this strategy would burden Japan with extremely costly energy into the foreseeable future—and seems designed primarily to support the power utilities that currently use coal to provide about 30 percent of Japan’s energy.
Long Duration Energy Storage
Even though green hydrogen is clearly not at P3 with either fossil fuels or renewables for most applications, it may still have a significant role in long duration storage. LDES is needed because renewable energy is variable in the long term.[134] A recent Royal Society study examining the shift to renewables in the United Kingdom identifies periods of “wind drought” that need to be addressed as the United Kingdom becomes more dependent on wind energy.[135] It seems likely that renewables in general will face this problem. As renewables become an important element in the energy mix, these longer-term variations must be mitigated.
Over shorter time horizons, batteries are the most flexible and—along with demand management and better interconnection agreements—probably the least costly storage solution.[136] Over longer periods and larger scales, hydrogen may have an important role to play. And as Liebreich has pointed out, “It's not just about providing back-up for when there is no wind or sun, it is also going to be about providing deep resilience in the case of weather disasters, cyber or physical attacks, neighboring countries shutting off interconnectors and the like.”[137]
Hydrogen may thus offer a critical long-duration storage option. The Royal Society study concludes that overcoming short-, medium-, and long-term variability will draw on a mix of solutions, and that hydrogen-based LDES offers the best option for longer timeframes. Other options include the following:[138]
1. Overbuilding. Wind energy in the United Kingdom could be overbuilt beyond the amount needed to service average national demand, perhaps to around 120–130 percent of projected average demand. Obviously, deliberately creating excess capacity has cost implications, but it also reduces periods of low energy provision.
2. Battery storage. This is the cheapest and most efficient option for relatively short-duration storage, but lithium-ion batteries are quickly ruled out for longer duration storage.
3. Combined cycle gas peaker plants plus carbon capture. If CCUS turns out to be effective and economically efficient at scale, it could provide power when needed, although the cost of peak-only energy is substantially higher than that of baseload energy.
4. Demand management. Evidence from Texas and California suggests demand can be reduced for short periods through forced cutbacks or financial incentives, although both impose costs on users.
5. Nuclear. Small modular reactors now in development might address supply-demand imbalances. However, small modular reactors are likely to be too expensive for widespread use, and seem poorly suited to providing backup rather than baseline power.
6. Other storage technologies. Pumped hydro (PH) is the most advanced alternative technology. PH projects are already in operation, and the United Kingdom is currently deploying a huge new project at Coire Glas in Scotland.[139] However, the sheer scale of storage needed to balance the renewables-heavy energy mix in the United Kingdom makes PH an unlikely solution: Geographies such as Coir Glas are relatively rare, and Scotland is a long way from the southeast of the United Kingdom where electricity demand is highest. Mechanical and thermal storage technologies are also under development, but are far from deployment at scale.
Figure 13: Energy storage technologies by scale and duration[140]
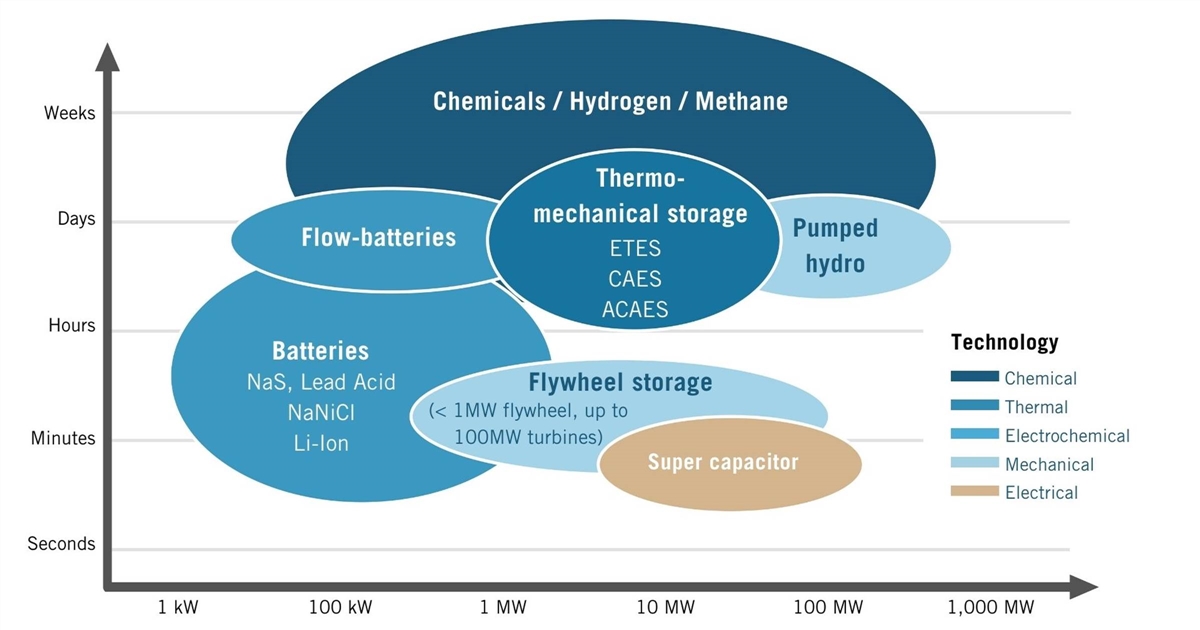
The Royal Society review concludes that U.K. energy security will require access to ~48 TWh of stored energy to replace the amount of wind that is missing during wind drought conditions that last for about a month.[141] The study recommends that the United Kingdom overbuild renewables to 130 percent of average demand so that for an average year, about 35 percent of capacity would be “wasted.” That “wasted” energy underpins can be used to generate hydrogen at essentially zero marginal cost. Actual storage costs are also relatively low: Underground storage is now a mature technology. Hydrogen would still need to be compressed, uncompressed, and then converted back to energy, with significant round trip efficiency losses (and consequent costs), but the lower efficiency is less important than the low cost of input electricity and the capacity to store energy cheaply at scale for long periods.
As the need for long-term energy storage at scale grows with increasing reliance on renewables to power the grid, hydrogen’s advantages emerge. After modeling all other options, the Royal Academies report concludes that hydrogen storage is the only feasible option at sufficient scale, duration, and cost.[142]
Of course, creating and storing the energy equivalent of 48 TWh in hydrogen is still expensive—$7.2 billion at $5/kg.[143] Hydrogen-to-power (HtP), as we have seen, offers overall efficiency of only about 45 percent, compared with using green energy directly. Adding in CAPEX and other operating costs, HtP will be perhaps three times as expensive as using green energy directly, and even more expensive than using energy from fossil fuels. Nonetheless, if green energy can be sourced at minimal cost, and especially if that energy could not otherwise be used, there may be a pathway to using hydrogen for energy storage.
The Swiss Army Knife of Decarbonization
Evidence from each of the specific markets for hydrogen indicates that it has a terrible Swiss Army Knife problem. In every case except LDES, the challenges of production and transportation make it too expensive or otherwise unsuitable for large-scale deployment. In many cases, it is the third-best solution, behind existing fossil-fuel technologies and better green technologies (e.g., BEVs). In some cases, such as cement and aviation, it is not a realistic alternative at all. Magical thinking, especially around economies of scale, is leading us to make a series of very high-risk policy bets.
It is therefore critical to bring the P3 perspective to bear on each of these markets. Forcing the introduction of hydrogen through endless subsidies or prescriptive regulation will not likely be a successful path to decarbonization even in rich countries, and it certainly won’t be adopted globally.
A Research Agenda for Hydrogen
Recent policy initiatives have focused heavily on rolling out hydrogen technology, not so much on improving it. In reality, better technology will be critically important. Right now, green hydrogen is not at P3, and just getting to scale will not close that gap. So, an aggressive innovation agenda should be central, focusing on system-level research, technologies for improving green hydrogen production efficiency, addressing transportation (particularly through pipelines), and a more limited program focused on blue hydrogen.
Systems
There are two main priorities in this area:
▪ Global market monitoring. Hydrogen development is occurring around the globe. U.S. policy should ensure that cutting-edge projects are constantly monitored and lessons to be learned from them are shared as widely as possible in the community of hydrogen stakeholders.
▪ Cost of capital and risk sharing. The United States has adopted a specific approach to risk sharing for hydrogen: a combination of capital grants for hydrogen hubs and ongoing fixed production subsidies for cleaner production. This model is highly experimental; we haven't tried this approach before, so we should make sure that it is subject to deep and ongoing scrutiny. Other kinds of support, especially from the DOE Loan Program Office (LPO) may play a role, although the hubs themselves will not be eligible for LPO loans. Oher countries have adopted other models, such as contracts for difference in the United Kingdom and elsewhere in Europe. These too should be carefully monitored, and once again successes and failures widely shared.
Green Hydrogen
The main R&D priorities for green hydrogen include:
▪ Improving electrolyzer efficiency should be the top priority—for example through research on better membranes. Only improved efficiency will substantially move the competitiveness needle for green hydrogen.
▪ Reducing CAPEX by increasing module size, stack density, and stack lifetime.
▪ Materials improvements, especially finding alternatives to expensive and hard to source materials in electrolyzer stacks.
▪ Water use reduction, and better capability to use salt or brackish water.
▪ Unless a clear path to substantial scaleup can be demonstrated, funding should not be allocated to biomass as a hydrogen feedstock.
▪ Carefully targeted demonstration projects focused on supporting concrete steps toward P3; earlier stage alternatives to PEM and alkaline electrolyzers, including solid oxide and anion exchange, but also early-stage work on cryogenic production, direct solar/thermal water splitting, and other more transformative technologies. This should include preliminary work on white hydrogen.
Blue Hydrogen Production
While blue hydrogen itself is not a global solution, there may be some markets where a transition from gray to blue hydrogen will be worth the expense. For example, the replacement of gray hydrogen by green hydrogen is not likely to succeed in existing markets (oil refining in particular). In these markets, especially after other sectors have decarbonized, it may be reasonable to pay the cost of adding CCUS to the process, thus using blue rather than gray hydrogen. Main focus areas should include the following:
▪ Development of advanced CO2 capture media (solvents, sorbents, and membranes), in particular aimed at reducing regeneration costs, and more energy efficient materials and advanced processes tailored for hydrogen separation.
▪ R&D on CO2 storage, especially the potential use of subsea installations.
Transportation and Storage
Pipelines are the key transportation technology for hydrogen, so research should focus there:
▪ New pipelines. Evaluate and test different technologies for new pipelines and different processes for new pipeline deployment. Aim to develop a national standard for new hydrogen pipelines that can help to ease permitting concerns and challenges.
▪ Repurposing existing pipelines. Complete a rigorous assessment—including independent third-party reviews—of the possibilities and limits of repurposing. For example, under what circumstances can 20 percent hydrogen be safely added to existing natural gas pipelines? Is this a hard limit? Is it time limited? This requires continuing and expanding the National Energy Technology Laboratory’s work on pipeline technologies.
▪ Storage. Further research is needed on CO2 and hydrogen storage underground. LDES is the key use case, and that requires long-term storage in natural formations. Again, development of models that can become standards should be a key research objective.
Market Transitions
Our focus on P3 does not mean that technologies should simply be left to themselves to find markets. Existing technologies are well embedded and difficult to dislodge. Help for better technologies has been a feature of U.S. industrial policy since Hamilton. What P3 does mean is that help should be focused on technologies that are on a potential pathway to P3 and not on those that will live on subsidies forever (e.g., blue hydrogen), and that help should be time limited: Technologies must eventually become self-sustaining.
Demonstration projects should play a significant role, but the U.S. hydrogen hubs are poorly designed to meet this need, and DOE’s non-transparent approach sharply reduces their utility. Demonstration projects should be focused on demonstrating that:
▪ the new technologies can be deployed at scale and on budget;
▪ gross production targets can be met;
▪ cost benchmarks can be met or exceeded, and scale does reduce balance of plant and some other costs;
▪ transportation to markets can be built at projected cost and meet efficiency milestones; and
▪ specific markets exist for hydrogen produced by each hub, and these markets are sufficient to make production commercially viable.
The last requirement for a well-designed demonstration project is of course muddied by the existence of large and varied subsidies. It will therefore be especially important for DOE to ensure that data about subsidies received is published by each hub.
The Realist Case For Hydrogen
Magical thinking is dangerous. It leads to dead ends and wastes time and resources, which we cannot afford. We need a realist approach instead, one that builds on what is possible, not what’s desirable.
First, it’s critically important to see past the hype and self-interest of multiple players in the hydrogen space. We have neither the time nor the resources to waste on fanciful and expensive projects that lead nowhere. A critical perspective is a precondition for any useful hydrogen policy, one that avoids obvious pitfalls on the path to net zero.
Second, we need to bring to bear the larger purpose identified in our previous paper: to focus on technologies and models that lead to global decarbonization. Subsidizing our way to net zero, even if it were possible in rich countries such as the United States, does very little for the global green transition. Finding pathways to P3 should be the primary objective.
Avoiding Hydrogen Pitfalls
We can begin with a few basic propositions.
1. Blue hydrogen. The cost of blue hydrogen will never reach P3. That fundamentally disqualifies blue hydrogen as a long-term component of global strategy for decarbonization. To the extent that blue hydrogen is organized around efforts to repurpose existing gas delivery pipelines, we will need very careful monitoring to avoid emissions that make GHG worse than sticking with natural gas. Carbon capture technology is also untested at scale; again, failure to capture sufficient GHG from hydrogen production would lead to a worse outcome than sticking with natural gas for power generation. Finally, to the extent that blue hydrogen develops in the United States and other high-income countries, it may well become an impediment to the later development of green hydrogen. We are, in the name of immediate emission reductions, subsidizing a technology that stands in the way of long-term global progress.
2. Transportation and delivery. Wishful thinking about “regional hydrogen networks” obscures a very obvious reality: Transporting hydrogen is in most cases prohibitively expensive. Liquified hydrogen requires deep refrigeration and is still much less energy dense than liquified natural gas, so transporting the same amount of energy requires at least twice as much effort (and cost). Existing pipelines can be repurposed but face significant technical challenges as the percentage of hydrogen in the mix rises, while new pipelines are of course expensive and difficult to permit and construct, and require very large sources of both supply and demand to make them economically feasible. Any sustainable hydrogen strategy must therefore minimize transportation except in specific circumstances where these criteria are met.
3. Economies of scale. Let me reiterate. Currently, green hydrogen costs at least $6/kg at the factory gate in most regions—that’s about six times the price of gray hydrogen. And there are only very limited economies of scale available. Proponents of green hydrogen argue that, like wind and solar, costs will fall dramatically as scale increases. They focus in particular on PEM and on solid oxide electrolyzers now starting to be produced in significant numbers. And they are correct in one respect: The cost of electrolyzers will likely fall significantly in coming years. However, electrolyzers account for only a minimal share of overall green hydrogen production costs (around 85 percent of those costs come from electricity inputs). That share—and those costs—doesn’t change as the scale of green hydrogen rises: They reflect the cost of green energy production itself. Economies of scale will never be enough to make green hydrogen competitive.
4. Existing markets. Many hydrogen proponents (e.g., DOE) assume that clean hydrogen will, first of all, replace gray hydrogen in existing markets. This would require huge ongoing subsidies (even those available in the United States may not be large enough). But beyond subsidies (which we know will not drive deployment in low-income countries), gray hydrogen production is heavily colocated with end users in ammonia and oil refining. These end users will not rip out existing plant and replace it with green hydrogen (which also needs to be colocated with green energy sources to be viable). Blue hydrogen could be an option, as retrofitting gray hydrogen plants with CCUS may be economically feasible given U.S. subsidies. However, existing plants still pose a formidable barrier. So existing markets are not an easy pathway to scale up hydrogen production.
5. New markets. The Swiss Army Knife problem is real. Hydrogen is a feasible alternative fuel in many new markets, but it’s a second- or third-best solution almost everywhere. Technology competitions are notoriously winner takes all (remember the Betamax?), so second-best solutions mostly just fade away.
– Light vehicles and trucks. FCEVs are simply not a feasible alternative for light vehicles. BEVs are already winning that war before FCEVs are even available, while the cost of building out a sufficiently widespread fueling infrastructure is beyond daunting. Further, the price of delivered hydrogen for light FCEVs is stratospheric (in California, the price of hydrogen refueling just hit $36/kg, making an FCEV 14 times as expensive to operate as a BEV).[144]
– Heavy vehicles. Hydrogen could potentially play a significant role in long distance trucking, especially along well-defined long distance routes, although projections suggest that even in 2050, the total cost of ownership will be higher than for BEV vehicles, and much higher than for ICE vehicles.[145] There may also be localized markets where fleets are heavily concentrated and where there are benefits to using FCEVs (e.g., refueling times)—bus fleets or drayage for example. California’s effort to force adoption of ZEVs within the Port of Los Angeles will be a test case for highly localized commercial use.
– Aviation. Current alternatives to the standard Jet A fuel all have significant limitations of cost and/or potential scale. That appears to open the door for hydrogen, but hydrogen’s much lower energy density means that planes would have to be redesigned from the ground up to accommodate hydrogen as fuel. Hydrogen delivery infrastructure for airports would be extraordinarily expensive, and would need to be deployed at multiple airports simultaneously while initially only a handful of planes would even be able to use it. The cost of implementation thus makes hydrogen-powered aviation very unlikely. Use of hydrogen to produce SAF is currently far from competitive on price, and will become cheaper only if the price of green hydrogen falls, which in turn relies on rapid declines in the cost of renewable energy.
– Building heating. Once again, hydrogen offers only a second-best alternative to existing technologies. Heat pumps are rapidly gaining traction and, as in other sectors, the cost of building the hydrogen distribution infrastructure is daunting. A 20 percent hydrogen mix could be delivered via existing gas pipes, but that would solve only 20 percent of the GHG problem, even assuming no leaks (hydrogen leaks generate much more GHG than do natural gas leaks) and that popular opposition could be overcome. Even assuming that hydrogen could be delivered at a competitive price (which despite U.S. subsidies seems unlikely), hydrogen for building heat seems little more than another effort by gas supply companies to repurpose their existing assets.
6. Grid-based green energy production. It has often been assumed that green hydrogen can be produced using grid-delivered energy when wind and solar generate excess energy (more than can be used at the time by the grid). Very low-cost (or zero-cost) energy would dramatically reduce the overall cost of green hydrogen. However, the existing grid has a surplus of green energy in only a handful of cases; there are many competing demands for that green energy on the grid, so if it is used for green hydrogen then it won’t be used for something else.[146] And grid-delivered green energy is prohibitively expensive because of fees, taxes, and delivery costs; even if the production cost of grid-based green energy were $0, the resulting delivered price of electricity would still be too high for green hydrogen to be competitive (without subsidies).
All these expensive pitfalls need to be avoided. Efforts and resources must be focused where they will do the most good.
Potential Pathways to Sustainable Hydrogen
We have already concluded that blue hydrogen is not a global solution for GHG emissions even in targeted industries, as it will never reach P3 with gray hydrogen, and there are significant risks that it will not effectively address GHG either. The production component is a mature technology, and is also shared with gray hydrogen, so improvements there will not make blue hydrogen more competitive.
Green hydrogen is different. It could reach P3, for some applications, in some regions. Again, we can draw on the previous analysis to offer some basic propositions.
1. Driving down the cost of green electricity is critical. While large subsidies in the United States and Europe obscure this reality, green hydrogen can only become fully cost competitive—and hence globally relevant—by using electricity that is on average far less expensive than the average wholesale cost of electricity in the United States. In fact, it needs electricity costs that are close to zero. How is this possible?
– Grid fees and taxes must be avoided. Unless these expenses are waived, green hydrogen production must be colocated with green energy production (wind, solar, geothermal). It’s impossible to be competitive while paying grid delivery fees and taxes (perhaps even with large subsidies in place).
– Capacity utilization is a trade-off, not a rigid requirement. Green hydrogen can be produced at a competitive cost, but only during times of surplus local green energy production. Intermittent production (and reduced capacity utilization) would raise CAPEX costs per kilogram of hydrogen, but that could be outweighed by the lower electricity cost.
2. Transporting hydrogen is expensive, so transportation must be reduced. This can be achieved by adopting the gray hydrogen model of colocating with end users. This is not a problem when building a greenfield plant somewhere with the available space and capacity to also build a renewable energy source. Minimizing transportation costs should be a key strategic goal.
3. Markets. Perhaps generous production subsidies in the United States and Europe will help build markets there. It’s possible that hydrogen’s advantages in long distance trucking will outweigh its additional costs, at least along a carefully defined and limited hub-and-spoke-route architectures. Mostly, hydrogen is a second-best solution in every market that’s been proposed—except LDES. An energy mix increasingly dominated by renewables requires rapidly growing amounts of nonrenewable backup power for short-, medium-, and long-term use. Batteries will meet short-term demand. Urgent needs can be partly addressed by demand-side management, and by better interconnection agreements that deliver electricity long distances to regions in need. Baseline energy that is both clean and nonvariable (e.g., hydrothermal, possibly nuclear) will reduce overall need for backup. Simply overbuilding renewable power is another alternative, although a costly one. But for duration storage at the scale that’s needed, hydrogen has some potential advantages. Compressed hydrogen, produced through dedicated facilities colocated with green energy, can be stored in salt caverns; that could provide a key element of long-term energy security.
Hydrogen is indeed the Swiss Army Knife of renewable fuels: theoretically useful, but in almost all cases a second-best solution. Its popularity with policymakers thus bears examination. Hydrogen hype begins with net zero. It was an excellent idea to post a hard target as a means of organizing the world to respond at scale and with urgency to the climate crisis. It has concentrated efforts and provided a new lens through which to view policy—a lens that has had profoundly positive impacts. We all now understand the urgency of the climate crisis. But a meme is not a strategy. And net zero has led us to view policy backwards, focusing too much on what we want instead of what we have.
Most analysis (including key documents from IEA, IRENA, the EU, and DOE) focuses on how we get to net zero by the target year of 2050. And in that context, hydrogen looks very attractive. It is a known technology, and it offers possible pathways to address hard-to-decarbonize sectors, while perhaps even competing effectively in other areas with electrification.
It’s easy to forget that this analysis is entirely theoretical. IEA projects that 600 million metric tons of hydrogen will be produced in 2050, up from around 70 MMT today.[147] That’s because if you believe that hydrogen is the pathway to decarbonization, and if you believe we will achieve net zero, that would indeed require production of 600 MMT annually. But treating that as an estimate or a market projection is a mistake. This is hope masquerading as strategy. It is magical thinking in its purest form: setting a target and then projecting the circumstances that would be needed for it to be met.
Magical thinking leads to further mistakes. If green hydrogen is to reach 600 MMT, then it must become much much cheaper—that is obvious. How can that happen? Through the further magic of “economies of scale,” even though any detailed review reveals that economies of scale won’t work with green hydrogen like they do with wind and solar. Cheaper can happen, but it relies primarily on cutting the cost of electricity inputs. Note also that at the projected ~50 kWh per 1 kg of hydrogen, production of 600 MMT would require 30,000 TWh of electricity.[148] That is almost exactly the amount of total electricity produced globally in 2022, of which only 8 percent is renewables. Around 2.6 TWh of renewables capacity was added globally in 2022.[149]
A US Policy Agenda For Hydrogen
U.S. policy is already heavily invested in hydrogen. Seven hydrogen hubs have been selected to receive $8 billion in grant support, and the IRA also introduced the hydrogen production subsidy (in section 45V), which offers an uncapped budget commitment to providing up to $3 per kilogram of hydrogen produced in projects with a lifecycle greenhouse gas emissions intensity of less than 0.45 kg CO2e/kg H2.[150] Blue hydrogen also benefited from the IRA, which substantially expanded support for carbon capture via section 45Q tax credits for the first 12 years of plant operation.[151]
Of the seven hubs, only two are completely centered on green hydrogen, two expect to use nuclear power at least in part, and four expect to use natural gas, at least in part.[152] Several claim to anticipate using multiple energy sources.
Both blue and pink hydrogen do not have a pathway to P3, and they comprise more than half the program. Green hydrogen could perhaps find a pathway, but we are years away from that. There is no evidence that any of the hubs will ever reach profitability beyond subsidies; None have even explained how they plan to get there. So, all the hubs will require ongoing subsidies for many years.
The analysis here leads to the following policy conclusions for the U.S. government (they also apply to the governments of other high-income countries):
1. View hydrogen policy through the P3 lens. If there is no pathway to P3, piles of expensive subsidies in the rich countries will not turn hydrogen into a global decarbonization solution. Ensure that we fund solutions that can in fact be adopted in low-income countries.
2. Economies of scale won’t transform the economics of green hydrogen.It is currently not close to P3, and production costs are overwhelmingly driven by the input cost of green energy, so even sharp declines in electrolyzer costs won’t close the gap. Projects that rely on scale economies for green hydrogen should be avoided.
3. Minimize investments in blue hydrogen. This technology will by definition always cost more than gray hydrogen, and hence has no long-term future in the global energy mix; indeed, any successes will mainly block the path for green hydrogen.
4. Don’t invest in second-best solutions. For most proposed markets, green hydrogen is and will be a second- or third-best solution. Governments should use the P3 framework to help identify target markets that make sense, and to avoid wasting enormous resources on markets that will never reach P3, including both existing markets and many proposed new ones.
5. We do not have all the technology we need! Of course we can produce green hydrogen, but not at P3, not at the price and performance needed for global adoption. A targeted research program is therefore the most pressing need, especially to accelerate the research, development, and deployment of green hydrogen as long duration storage.
6. Location matters. Additionality is not theoretical, it is intensely practical: green energy provided via the grid is heavily impacted by grid fees and taxes, making green hydrogen uneconomical without heavy ongoing subsidies. We should favor projects in which new green energy sources are colocated with green hydrogen production.
7. Avoid projects that require expensive transportation infrastructure. Transporting hydrogen is difficult and expensive. Fantasies about a “network” of regional hydrogen facilities are just that. Favor projects that are colocated with end users.
8. Invest in hydrogen as LDES. Focus on the best case for green hydrogen by investing in hydrogen for LDES as a key step toward a fully sustainable grid. This also offers the best opportunity to bring green hydrogen to scale. Upstream of production, provide more funding for research across all technology readiness levels (TRLs) focused on increasing the efficiency of electrolysis and reducing the use of other key inputs such as water. Downstream, fund technologies that improve natural underground storage, compression, and the eventual reconversion of hydrogen to energy.
We are not climate deniers. We believe fossil fuels are transforming the climate globally, and that we need a pathway through the green transition. Industrial policy in the form of subsidies, regulation, and public procurement were an important driver for key technologies in the past, and can still help get market traction with green energy. But we also believe that simply subsidizing or regulating our way forward will not work: The backlash in rich countries is already strong, and getting stronger—and fossil fuels are booming in low-income countries to meet their undeniable and rapidly growing needs for more energy. The only way to square that circle is to develop green technologies that are cheap enough for everyone.
Appendix: Levelized Cost of Energy
To provide context for this report, the figure below provides the levelized cost of energy estimates from Lazard for 2023. These estimates do not include delivery or storage costs for energy unless specifically marked. Median LCOE for utility solar is $60/MWh, for onshore wind is $50/MWh, for offshore wind is $106/MWh, and for gas combined cycle is $70/MWh. Note that DOE’s hydrogen lift-off report states that for green hydrogen to be competitive, it requires delivered input electricity costs of less than $20/MWh.
Figure 14: Lazard levelized cost of energy estimates, 2023 ($/MWh)[153]
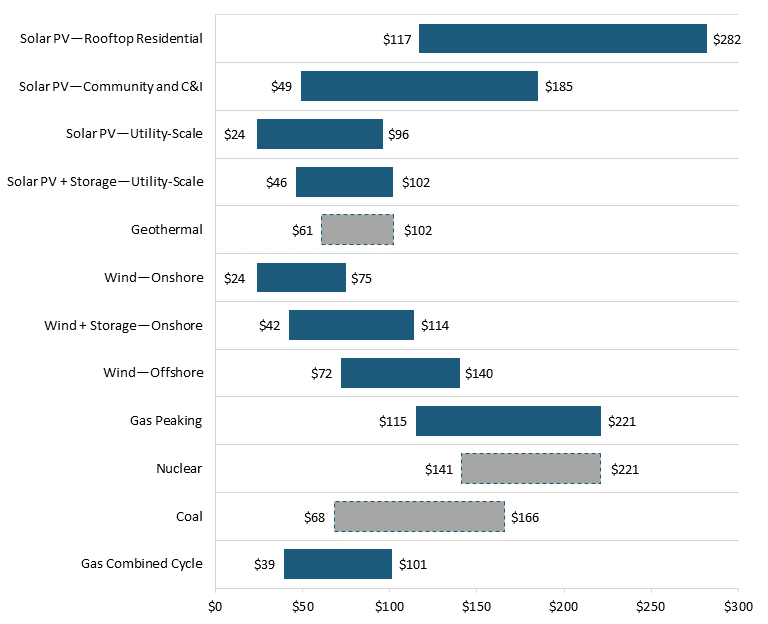
About the Author
Dr. Robin Gaster is president of Incumetrics Inc. and a visiting scholar at George Washington University. Dr. Gaster’s primary interests lie in climate, economic innovation policy, metrics, and assessment. He has worked extensively on innovation and small business, regional economic development, transformation in education, and the rise of the big technology companies. He serves as a nonresident senior fellow at ITIF’s Center for Clean Energy Innovation.
About ITIF
The Information Technology and Innovation Foundation (ITIF) is an independent 501(c)(3) nonprofit, nonpartisan research and educational institute that has been recognized repeatedly as the world’s leading think tank for science and technology policy. Its mission is to formulate, evaluate, and promote policy solutions that accelerate innovation and boost productivity to spur growth, opportunity, and progress. For more information, visit itif.org/about.
Endnotes
[1]. Robert D. Atkinson, Robin Gaster, and Ed Rightor, “Beyond Force: A Realist Pathway Through the Green Transition” (ITIF, July 10, 2023), https://itif.org/publications/2023/07/10/beyond-force-a-realist-pathway-through-the-green-transition/.
[2]. “The Future of Hydrogen—Analysis,” IEA, accessed March 28, 2023, https://www.iea.org/reports/the-future-of-hydrogen.
[3]. Leigh Collins, “IEA Shrinks Forecast for Blue Hydrogen Production by Almost Half in Wake of Global Gas Crisis in Net-Zero Scenario,” Hydrogen Insight, October 28, 2022, https://www.hydrogeninsight.com/production/iea-shrinks-forecast-for-blue-hydrogen-production-by-almost-half-in-wake-of-global-gas-crisis-in-net-zero-scenario/2-1-1342981.
[4]. David Peterson, David Vickers, and Dan DeSantis, “NREL Hydrogen Production Cost from PEM Electrolysis - 2019” (DOE, February 3, 2020), https://www.hydrogen.energy.gov/pdfs/19009_h2_production_cost_pem_electrolysis_2019.pdf.
[5]. For green hydrogen to be zero emissions, it must be powered by electricity that is also green. Hydrogen production that uses grid energy that is not green is therefore not “green hydrogen,” even if it uses exactly the same production technology.
[6]. “Q2 2023 Clean Energy Report” (Pitchbook, August 30, 2023), https://pitchbook.com/news/reports/q2-2023-clean-energy-report.
[7]. “Additionality” is the term used to describe policies that require green hydrogen projects to develop “additional” renewable energy to power them, rather than simply using green energy from existing sources delivered via the grid.
[8]. “The Future of Hydrogen: Seizing Today’s Opportunities” (IEA, 2019), https://www.iea.org/reports/the-future-of-hydrogen.
[9]. “The Future of Hydrogen: Seizing Today’s Opportunities.” p.18.
[10]. Other methods are in production, such as autothermal reduction and partial oxidation of methane, also produce substantial amounts of CO2. Coal gasification produces about 15kg CO2 per kg of hydrogen.
[11]. “The Future of Hydrogen: Seizing Today’s Opportunities.” p.17
[12]. Bruce Robertson and Milad Mousavian, “The Carbon Capture Crux: Lessons Learned” (IEEFA, September 2022), https://ieefa.org/resources/carbon-capture-crux-lessons-learned.
[13]. Christian Bauer et al., “On the Climate Impacts of Blue Hydrogen Production,” Sustainable Energy & Fuels 6, no. 1 (December 21, 2021): 66–75, https://doi.org/10.1039/D1SE01508G.
[14]. See for example “Special Report on Carbon Capture Utilisation and Storage: CCUS in Clean Energy Transitions,” IEA Energy Technology Perspectives, 2020. IEA identified in particular four hard-to-decarbonize sectors: cement, steel, chemicals, and long distance transport.
[15]. Darren Woods, “Low-Carbon Hydrogen: Fueling Our Baytown Facilities and Our Net-Zero Ambition,” ExxonMobil Viewpoints (blog), January 30, 2023, https://corporate.exxonmobil.com:443/what-we-do/delivering-industrial-solutions/hydrogen.
[16]. Ibid.
[17]. “Special Report on Carbon Capture Utilisation and Storage: CCUS in Clean Energy Transitions.” p. 74.
[18]. Robertson and Mousavian, “The Carbon Capture Crux: Lessons Learned.”
[19]. “Special Report on Carbon Capture Utilisation and Storage: CCUS in Clean Energy Transitions.”
[20]. Robertson and Mousavian, “The Carbon Capture Crux: Lessons Learned.”
[21]. Deepika Nagabhushan and Kurt Waltzer, “The Emission Reduction Benefits of Carbon Capture Utilization and Storage Using CO2 Enhanced Oil Recovery,” CATF (blog), nd., https://www.catf.us/wp-content/uploads/2018/11/CATF_Factsheet_CO2_EOR_LifeCycleAnalysis.pdf.
[22]. Robertson and Mousavian, “The Carbon Capture Crux: Lessons Learned.”
[23]. Ibid.
[24]. Leigh Collins, “‘Yes, Our Blue Hydrogen Project Will Increase Electricity Costs and Fossil Gas Use, but Society Will Benefit’ | Recharge,” Recharge | Latest renewable energy news, July 11, 2022, https://www.rechargenews.com/energy-transition/-yes-our-blue-hydrogen-project-will-increase-electricity-costs-and-fossil-gas-use-but-society-will-benefit-/2-1-1255631.
[25]. Arjun Flora and Maria Jaller-Makarewicz, “Russia Sanctions and Gas Price Crisis Reveal Danger of Investing in ‘Blue’ Hydrogen,” IEEFRA (blog), May 23, 2023, https://ieefa.org/resources/russia-sanctions-and-gas-price-crisis-reveal-danger-investing-blue-hydrogen.
[26]. William J. Schmelz, Gal Hochman, and Kenneth G. Miller, “Total Cost of Carbon Capture and Storage Implemented at a Regional Scale: Northeastern and Midwestern United States,” Interface Focus, October 6, 2020, https://doi.org/10.1098/rsfs.2019.0065.
[27]. Paul Butterworth, “Carbon Capture Economics: Why $200 /tCO2 Is the Crucial Figure,” CRU (blog), March 20, 2023, https://sustainability.crugroup.com/article/carbon-capture-economics-why-usd-200-per-tco2-is-the-crucial-figure.
[28]. Siri Hedreen, “Blue Hydrogen Runs ‘significant Risk’ of Becoming Stranded Asset,” 7/19/2022, S&P Global Market Intelligence (blog), accessed July 8, 2023, https://www.spglobal.com/marketintelligence/en/news-insights/latest-news-headlines/blue-hydrogen-runs-significant-risk-of-becoming-stranded-asset-8211-advisory-firm-71222790.
[29]. “Executive Summary—Global Hydrogen Review 2021—Analysis,” IEA, accessed March 21, 2023, https://www.iea.org/reports/global-hydrogen-review-2021/executive-summary.
[30]. Derived from a figure by Mackenzie Wood.
[31]. Green hydrogen production from biomass conversion represents an additional pathway, but it is much more expensive than electrolysis and much less easy to scale. It is therefore ignored in this analysis.
[32]. Aliaksei Patonia and Rahmatallah Poudineh, “Cost Competitive Green Hydrogen: How to Lower the Cost of Electrolysers,” OEIS 47 (January 2022), https://www.oxfordenergy.org/wpcms/wp-content/uploads/2022/01/Cost-competitive-green-hydrogen-how-to-lower-the-cost-of-electrolysers-EL47.pdf; Amrith Ramkumar, “The Secret Behind the First $1 Billion Green Hydrogen Startup,” Wall Street Journal, October 2, 2023, sec. Markets, https://www.wsj.com/business/energy-oil/the-secret-behind-the-first-1-billion-green-hydrogen-startup-994fee28.
[33]. “Hydrogen from Renewable Power: Technology Outlook for the Energy Transition” (IRENA, 2018), https://www.irena.org/-/media/files/irena/agency/publication/2018/sep/irena_hydrogen_from_renewable_power_2018.pdf.
[34]. Peterson, Vickers, and DeSantis, “NREL Hydrogen Production Cost from PEM Electrolysis - 2019.”
[35]. DOE, “Pathways to Commercial Liftoff: Clean Hydrogen,” March 2023, https://liftoff.energy.gov/wp-content/uploads/2023/05/20230523-Pathways-to-Commercial-Liftoff-Clean-Hydrogen.pdf.
[36]. Peterson, Vickers, and DeSantis, “NREL Hydrogen Production Cost from PEM Electrolysis - 2019.”
[37]. Bloomberg NEF global head of strategy, Kobad Bhavnagri, for example, expects this to lead to a tenfold reduction in green hydrogen costs by 2030. Leigh Collins, “‘White Elephants’ | Green Hydrogen Will Be Cheaper than Blue H2 in All Parts of World by 2030, Says BNEF | Recharge,” Recharge | Latest renewable energy news, May 17, 2022, https://www.rechargenews.com/energy-transition/white-elephants-green-hydrogen-will-be-cheaper-than-blue-h2-in-all-parts-of-world-by-2030-says-bnef/2-1-1220542.
[38]. Polly Martin, “Blue Hydrogen Cheaper than Green H2 in All Markets except China amid Falling Gas Prices: BNEF,” Hydrogen Insight, July 13, 2023, https://www.hydrogeninsight.com/production/blue-hydrogen-cheaper-than-green-h2-in-all-markets-except-china-amid-falling-gas-prices-bnef/2-1-1486049.
[39]. Rachel Parkes, “INTERVIEW | ‘China Is Overbuilding Hydrogen Electrolyser Manufacturing Capacity — and May Have to Shut Some of It down’: Citigroup,” Hydrogen News and Intelligence | Hydrogen Insight (blog), August 29, 2023, https://www.hydrogeninsight.com/electrolysers/interview-china-is-overbuilding-hydrogen-electrolyser-manufacturing-capacity-and-may-have-to-shut-some-of-it-down-citigroup/2-1-1506515.
[40]. R de Levie, “The Electrolysis of Water,” Journal of Electroanalytical Chemistry 476, no. 1 (October 1999): 92–93, https://doi.org/10.1016/S0022-0728(99)00365-4.
[41]. “Lazard 2023 Levelized Cost of Energy+” (Lazard, 2023), https://www.lazard.com/research-insights/2023-levelized-cost-of-energyplus/.
[42]. SoCal Edison, Tariffs 2023, accessed October 7, 2023, https://www.sce.com/regulatory/tariff-books/rates-pricing-choices; California, for example, has an energy surcharge tax of $0.0003 per kWh. https://www.cdtfa.ca.gov/lawguides/vol4/ersl/ersl-40016.html.
[43]. Jared Anderson, “US Power Transmission, Distribution Costs Seen Outpacing Electricity Production Costs,” S&P Global Commodity Insights, November 24, 2021, https://www.spglobal.com/commodityinsights/en/market-insights/latest-news/natural-gas/112421-us-power-transmission-distribution-costs-seen-outpacing-electricity-production-costs.
[44]. “Renewable Hydrogen Production: New Rules Formally Adopted,” European Commission, June 20, 2023, https://energy.ec.europa.eu/news/renewable-hydrogen-production-new-rules-formally-adopted-2023-06-20_en.
[45]. Johannes Truby, Pradeep Phillip, and Bernhard Lorentz, “Green Hydrogen: Energizing the Path to Net Zero,” (Deloitte, 2023), https://www.deloitte.com/global/en/issues/climate/green-hydrogen.html.
[46]. Anderson, “US Power Transmission, Distribution Costs Seen Outpacing Electricity Production Costs.”
[47]. Peterson, Vickers, and DeSantis, “NREL Hydrogen Production Cost from PEM Electrolysis - 2019.”
[48]. “Decarbonising Shipping,” Global Maritime Hub, December 9, 2020, https://globalmaritimehub.com/what-could-be-the-best-fuels-to-decarbonise-shipping.html.
[49]. Agnete Klevstrand, “More than 60 percent of All Clean Hydrogen Will Be Transported over Long Distances by 2050: Hydrogen Council | Hydrogen News and Intelligence,” Hydrogen news and intelligence | Hydrogen Insight, October 7, 2022, https://www.hydrogeninsight.com/analysis/more-than-60-of-all-clean-hydrogen-will-be-transported-over-long-distances-by-2050-hydrogen-council/2-1-1329563.
[50]. “Clean Energy Strategy to Achieve Carbon Neutrality by 2050,” The Government of Japan - Japan.Gov, June 23, 2022, https://www.japan.go.jp/kizuna/2022/06/clean_energy_strategy.html.
[51]. “Hyphen and Namibia Agree next Phase of $10 Billion Green Hydrogen Project,” Reuters, May 25, 2023, sec. Energy, https://www.reuters.com/business/energy/hyphen-namibia-agree-next-phase-10-bln-green-hydrogen-project-2023-05-24/.
[52]. “Hydrogen Economy Outlook: Key Messages” (BNEF, March 20, 2020), https://assets.bbhub.io/professional/sites/24/BNEF-Hydrogen-Economy-Outlook-Key-Messages-30-Mar-2020.pdf.
[53]. M W Melaina, O Antonia, and M Penev, “Blending Hydrogen into Natural Gas Pipeline Networks: A Review of Key Issues” (NREL, March 2013).
[54]. Estimated capital spending for new and retrofitted pipelines for hydrogen use worldwide in 2021, by pipeline type, Statista, https://www.statista.com/statistics/1220856/capex-new-retrofitted-h2-pipelines-by-type/.
[55]. Xianming Jimmy Li et al., “Paths to Low-Cost Hydrogen Energy at a Scale for Transportation Applications in the USA and China via Liquid-Hydrogen Distribution Networks.,” Clean Energy, 2020.
[56]. “Ammonia: Zero-Carbon Fertiliser, Fuel and Energy Store” (Royal Academy, February 2020), https://royalsociety.org/-/media/policy/projects/green-ammonia/green-ammonia-policy-briefing.pdf.
[57]. Julian David Hunt et al., “Solid Air Hydrogen Liquefaction, the Missing Link of the Hydrogen Economy,” International Journal of Hydrogen Energy 48, no. 75 (September 1, 2023): 29198–208, https://doi.org/10.1016/j.ijhydene.2023.03.405.
[58]. Michael Liebreich, “The Unbearable Lightness of Hydrogen,” BloombergNEF (blog), December 12, 2022, https://about.bnef.com/blog/liebreich-the-unbearable-lightness-of-hydrogen/.
[59]. Rachel Parkes, “Germany’s H2Global Kicks off World’s First Green Hydrogen Subsidy Scheme with Ammonia Import Tender,” Hydrogen Insight, December 7, 2022, https://www.hydrogeninsight.com/policy/germanys-h2global-kicks-off-world-s-first-green-hydrogen-subsidy-scheme-with-ammonia-import-tender/2-1-1369442.
[60]. “Hydrogen Economy Outlook: Key Messages.”
[61]. “Hydrogen Economy Outlook: Key Messages.”
[62]. See Michael Liebreich, “The Clean Hydrogen Ladder v 4.1,” accessed July 8, 2023, https://www.linkedin.com/pulse/clean-hydrogen-ladder-v40-michael-liebreich/. This widely read analysis anticipates that existing users of hydrogen will be key market targets for clean hydrogen.
[63]. “Quadrennial Technology Review 2015 Chapter 7: Advancing Systems and Technologies to Produce Cleaner Fuels” (DOE, 2015), https://www.energy.gov/sites/prod/files/2015/11/f27/QTR2015-7D-Hydrogen-Production-and-Delivery.pdf.
[64]. “Ammonia: Zero-Carbon Fertiliser, Fuel and Energy Store”; “Ammonia Technology Roadmap” (IEA, nd), https://www.iea.org/reports/ammonia-technology-roadmap.
[65]. Kanchuka Dissanayake, “Ammonia as an Alternative for Fuel Internal Combustion Engines,” IOSR Journal of Mechanical and Civil Engineering 14, no. 1 (February 2017).
[66]. DOE, “Regional clean hydrogen hubs selections for award negotiations, n.d.,” https://www.energy.gov/oced/regional-clean-hydrogen-hubs-selections-award-negotiations.
[67]. Dennis Reid, “Hydrogen in Oil Refineries: Understanding The Importance Of Hydrogen Monitoring And Best Practices,” Forbes, accessed September 26, 2023, https://www.forbes.com/sites/forbesbusinesscouncil/2022/09/08/hydrogen-in-oil-refineries-understanding-the-importance-of-hydrogen-monitoring-and-best-practices/.
[68]. EIA, US Hydrogen Refinery Production Capacity, 12/1/2023 https://www.eia.gov/dnav/pet/hist/LeafHandler.ashx?n=PET&s=8_NA_8PH_NUS_6&f=A.
[69]. “Hydrogen for Refineries Is Increasingly Provided by Industrial Suppliers,” Today in Energy (blog), January 20, 2014, https://www.eia.gov/todayinenergy/detail.php?id=24612.
[70]. IRENA Renewable Energy Statistics, 2018
[71]. California Energy Commission, Hydrogen Vehicles and Refueling Infrastructure, n.d., https://www.energy.ca.gov/programs-and-topics/programs/clean-transportation-program/clean-transportation-funding-areas-1; California Air Resources Board, Zero Emissions Vehicle Program, n.d., https://ww2.arb.ca.gov/our-work/programs/zero-emission-vehicle-program.
[72]. California ENERGYU Commission, “Light-duty vehicle population in California,” accessed October 12, 2023, https://www.energy.ca.gov/data-reports/energy-almanac/zero-emission-vehicle-and-infrastructure-statistics/light-duty-vehicle.
[73]. Paul Martin. Ibid.
[74]. Paul Martin, “Hydrogen fuelcell vehicles: A great idea—in theory,” August 1, 2017, https://www.linkedin.com/pulse/hydrogen-fuelcell-vehicle-great-idea-theory-paul-martin/.
[75]. Fuel cell efficiency. Princeton University. https://www.princeton.edu/~humcomp/sophlab/ther_58.htm.
[76]. Leigh Collins, “ANALYSIS | It Is Now Almost 14 Times More Expensive to Drive a Toyota Hydrogen Car in California than a Comparable Tesla EV,” Hydrogen Insight, September 18, 2023, https://www.hydrogeninsight.com/transport/analysis-it-is-now-almost-14-times-more-expensive-to-drive-a-toyota-hydrogen-car-in-california-than-a-comparable-tesla-ev/2-1-1519315.
[77]. “Comparison of Hydrogen and Battery Electric Trucks” (Transport and the Environment, June 2020), https://www.transportenvironment.org/wp-content/uploads/2021/07/2020_06_TE_comparison_hydrogen_battery_electric_trucks_methodology.pdf.
[78]. California energy commission, California retail fuel outlet annual reporting (cec-a15) results, 2022, https://www.energy.ca.gov/data-reports/energy-almanac/transportation-energy/california-retail-fuel-outlet-annual-reporting.
[79]. Paul Martin, op. cit.
[80]. Collins, “ANALYSIS | It Is Now Almost 14 Times More Expensive to Drive a Toyota Hydrogen Car in California than a Comparable Tesla EV.”
[81]. There may also be weight advantages, as heavy batteries themselves cost energy to move.
[82]. Jason Marcinkoski et al., “DOE Advanced Truck Technologies: Subsection of the Electrified Powertrain Roadmap. Technical Targets for Hydrogen-Fueled Long-Haul Tractor-Trailer Trucks.” (DOE, October 31, 2019).
[83]. “Making Sense of Heavy-Duty Hydrogen Fuel Cell Tractors,” North American Council for Freight Efficiency (blog), accessed April 18, 2022, https://nacfe.org/emerging-technology/electric-trucks-2/making-sense-of-heavy-duty-hydrogen-fuel-cell-tractors/.
[84]. Federal Motor Carrier Safety Administration, Summary of Hours of Service Regulations, accessed October 13, 2023, https://www.fmcsa.dot.gov/regulations/hours-service/summary-hours-service-regulations.
[85]. Fred Lambert, “Tesla Semi Battery Pack Design Leaks,” Electrek, January 2, 2023, https://electrek.co/2023/01/02/tesla-semi-battery-pack-design-leaks/; Daniel Zlatev, “Silent Tesla Semi Trucks Run Long and Far as Pepsi Tips How Fast They Charge on 750kW Megachargers,” Notebookcheck, August 5, 2023, https://www.notebookcheck.net/Silent-Tesla-Semi-trucks-run-long-and-far-as-Pepsi-tips-how-fast-they-charge-on-750kW-Megachargers.738834.0.html.
[86]. “Comparison of Hydrogen and Battery Electric Trucks.”
[87]. DOE, “Biden-Harris administration announces funding for zero-emission medium- and heavy-duty vehicle corridors, expansion of ev charging in underserved communities,” news release, February 15, 2023, https://www.energy.gov/articles/biden-harris-administration-announces-funding-zero-emission-medium-and-heavy-duty-vehicle; Calstart, “CALSTART Statement on Department of Energy Decision to Award East Coast Commercial ZEV Corridor Freight Corridor Planning Project,” news release, January 15, 2023 https://calstart.org/calstart-statement-on-award-for-mhd-zev-corridors/; Cummins, “Cummins’ Destination Zero strategy receives major support through implementation plan for ev charging equipment,” news release, January 17, 2023, https://www.cummins.com/news/releases/2023/02/17/cummins-destination-zero-strategy-receives-major-support-through.
[88]. Cristian Agatie, “Tesla Wants To Build a 1,800-Mile Megacharger Corridor Between Texas and California,” autoevolution, August 2, 2023, https://www.autoevolution.com/news/tesla-wants-to-build-a-1800-mile-megacharger-corridor-between-texas-and-california-218971.html.
[89]. American Trucking Association, California’s dream is becoming america’s supply chain nightmare, June 12, 2023, https://www.trucking.org/news-insights/californias-dream-becoming-americas-supply-chain-nightmare.
[90]. “Comparison of Hydrogen and Battery Electric Trucks”; Chad Hunter et al., “Spatial and Temporal Analysis of the Total Cost of Ownership for Class 8 Tractors and Class 4 Parcel Delivery Trucks” (NREL, September 16, 2021), https://doi.org/10.2172/1821615 (however, the NREL conclusions include IRA subsidies and further technological improvements).
[91]. “Cummins Hydrogen Day” (Cummins, November 16, 2020).
[92]. California Clean Air Resources Board, California approves groundbreaking regulation that accelerates the deployment of heavy-duty ZEVs to protect public health, April 28, 2023, https://ww2.arb.ca.gov/news/california-approves-groundbreaking-regulation-accelerates-deployment-heavy-duty-zevs-protect.
[93]. Powell Slaughter, “Painful Transition? Advance Clean Fleets Rule to Impact Shippers for Years to Come,” Furniture Today, August 30, 2023, https://www.furnituretoday.com/logistics/painful-transition-advance-clean-fleets-rule-to-impact-shippers-for-years-to-come/.
[94]. Tom Ewing, “The Real Cost of NetZero Ports,” Maritime Logistics Professional, September 26, 2023, https://www.maritimeprofessional.com/news/real-cost-zero-ports-388263.
[95]. Ibid.
[96]. John Kenneth Winkler et al., “Fuel Cell Drive for Urban Freight Transport in Comparison to Diesel and Battery Electric Drives: A Case Study of the Food Retailing Industry in Berlin,” European Transport Research Review 14, no. 1 (February 4, 2022): 2, https://doi.org/10.1186/s12544-022-00525-6.
[97]. Our World in Data, CO2 Emissions, accessed Oct 10 2023, https://ourworldindata.org/co2-emissions.
[98]. Boeing, “Passenger air travel; returning to growth,” accessed October 21, 2023, https://cmo.boeing.com/.
[99]. European Commission, “European green deal: new law agreed to cut aviation emissions by promoting sustainable aviation fuels,” April 26, 2023, https://ec.europa.eu/commission/presscorner/detail/en/ip_23_2389.
[100]. Michael Liebreich, op. cit.
[101]. Jack Roper, “Why Hydrogen as an Aviation Fuel Is in for the Long Haul,” Aerospace Testing International, February 1, 2023, https://www.aerospacetestinginternational.com/features/why-hydrogen-as-an-aviation-fuel-is-in-for-the-long-haul.html.
[102]. Michael Liebreich, op. cit.
[103]. Ibid.
[104]. Roper, “Why Hydrogen as an Aviation Fuel Is in for the Long Haul.”
[105]. “Sustainable Aviation Fuel” (GAO), accessed October 6, 2023, https://www.gao.gov/assets/820/818346.pdf.
[106]. “Sustainable Aviation Fuel.”
[107]. Hannah Boyles, “Climate-tech to watch: sustainable aviation fuel,” October 17, 2022, https://itif.org/publications/2022/10/17/climate-tech-to-watch-sustainable-aviation-fuel/.
[108]. IATA, “2022 SAF production increases 200% - more incentives needed to reach net zero,” December 7, 2022, https://www.iata.org/en/pressroom/2022-releases/2022-12-07-01/.
[109]. Eric G. O’Rear et al., “Sustainable Aviation Fuels: The Key to Decarbonizing Aviation,” Rhodium Group (blog), accessed January 4, 2024, https://rhg.com/research/sustainable-aviation-fuels/.
[110]. GAO, Sustainable avaiation fuel, March 2023, https://www.gao.gov/assets/820/818346.pdf.
[111]. Eric O”Rear, op. cit.
[112]. “Advanced Biofuels: What Holds Them Back?” (IRENA, 2019), https://www.irena.org/publications/2019/Nov/Advanced-biofuels-What-holds-them-back.
[113]. “Towards a Circular Steel Industry” (IRENA, July 26, 2023), https://www.irena.org/Publications/2023/Jul/Towards-a-Circular-Steel-Industry.
[114]. Christian Roselund, “Green Steel Is Picking up Steam in Europe,” Canary Media, June 23, 2021, https://www.canarymedia.com/articles/clean-industry/green-steel-is-coming-sooner-than-you-think.
[115]. Fabian Rosner et al., “Green Steel: Design and Cost Analysis of Hydrogen-Based Direct Iron Reduction,” Energy & Environmental Science 16, no. 10 (October 11, 2023): 4121–34, https://doi.org/10.1039/D3EE01077E.
[116]. “Midrex STATS Book 2022,” accessed October 17, 2023, https://www.midrex.com/wp-content/uploads/MidrexSTATSBook2022.pdf.
[117]. Rosner et al., “Green Steel.”
[118]. Omri Wallach, “Green Steel: Decarbonising with Hydrogen-Fueled Production,” Visual Capitalist, September 28, 2022, https://www.visualcapitalist.com/sp/green-steel-decarbonising-with-hydrogen-fueled-production/.
[119]. “Electrolysers - Energy System,” IEA, accessed October 17, 2023, https://www.iea.org/energy-system/low-emission-fuels/electrolysers.
[120]. IEA. Net renewable electricity capacity additions by technology, 2017-2024, https://www.iea.org/data-and-statistics/charts/net-renewable-electricity-capacity-additions-by-technology-2017-2024.
[121]. Christian Sandström and Carl Alm, “Why Green Deals May Fail—Evidence from Biogas, Bio-Ethanol and ‘Fossil Free’ Steel,” Ratio Working Paper (The Ratio Institute, June 13, 2023), https://econpapers.repec.org/paper/hhsratioi/0365.htm.
[122]. MIDREX, World Direct Reduction Statistics 2022, https://www.midrex.com/wp-content/uploads/MidrexSTATSBook2022.pdf.
[123]. MIDREX Ibid.
[124]. IEA, Energy consumption in the iron and steel sector by scenario, https://www.iea.org/data-and-statistics/charts/energy-consumption-in-the-iron-and-steel-sector-by-scenario; IEA, cumulative direct emission reductions by mitigation strategy in the sustainable development scenario between 2020 and 2050, Oct 1 2023, https://www.iea.org/data-and-statistics/charts/cumulative-direct-emission-reductions-by-mitigation-strategy-in-the-sustainable-development-scenario-between-2020-and-2050.
[125]. “The Future of Hydrogen: Seizing Today’s Opportunities.”
[126]. “Decarbonized Hydrogen in the US Power and Industrial Sectors: Identifying and Incentivizing Opportunities to Lower Emissions,” Resources for the Future, accessed October 17, 2023, https://www.rff.org/publications/reports/decarbonizing-hydrogen-us-power-and-industrial-sectors/.
[127]. Johanna Lehne and Felix Preston, “Making Concrete Change: Innovation in Low-Carbon Cement and Concrete” (Chatham House, June 13, 2018), https://www.chathamhouse.org/2018/06/making-concrete-change-innovation-low-carbon-cement-and-concrete.
[128]. “CEMEX to Introduce Hydrogen Technology to Reduce CO2 Emissions in Four Cement Plants in Mexico,” Cemex, accessed October 19, 2023, https://www.cemex.com/w/cemex-to-introduce-hydrogen-technology-to-reduce-co2-emissions-in-four-cement-plants-in-mexico.
[129]. Michael Lord, “Rethinking Cement” (Zero Carbon Australia), accessed October 19, 2023, https://www.bze.org.au/research/report/rethinking-cement.
[130]. “Japan’s Costly Ammonia Coal Co-Firing Strategy” (BNEF, September 28, 2022), https://assets.bbhub.io/professional/sites/24/BNEF-Japans-Costly-Ammonia-Coal-Co-Firing-Strategy_FINAL.pdf.
[131]. Michael Liebreich, Ibid.
[132]. “Japan’s Costly Ammonia Coal Co-Firing Strategy.”
[133]. Cheng Cheng et al., “100 percent Renewable Energy in Japan,” Energy Conversion and Management 255 (March 1, 2022): 115299, https://doi.org/10.1016/j.enconman.2022.115299.
[134]. “UK Energy Trends” (Department for Energy Security and NetZero, June 29, 2023).
[135]. “Large-Scale Electricity Storage | Royal Society,” accessed September 12, 2023, https://royalsociety.org/topics-policy/projects/low-carbon-energy-programme/large-scale-electricity-storage/.
[136]. Essentially shifting power availability within 24 hours, even though DOE calls 10 hours long-duration storage.
[137]. Michael Liebreich, The Hydrogen Ladder, accessed Sept 1, 2023, https://www.linkedin.com/pulse/clean-hydrogen-ladder-v40-michael-liebreich/.
[138]. Tony Roulstone and Paul Cosgrove, “Royal Society WG Working Paper on Energy Storage -Single Year Analysis,” July 29, 2020.
[139]. SSE Renewables, The Coire Glas project, accessed October 10, 2023, https://www.coireglas.com/project.
[140]. Siemens (2017) “Green Ammonia REFUEL Kickoff Meeting, August 17, Denver Elfriede Simon, CTREE STS,” https://arpa-e.energy.gov/sites/default/files/04c percent20Denver-Green percent20Ammonia-Siemens-final.pdf.
[141]. Roulstone and Cosgrove, “Royal Society WG Working Paper on Energy Storage -Single Year Analysis.”
[142]. “Wind Energy: Implications of Large-Scale Deployment on the GB Electricity System” (Royal Academy of Engineering, 2014), https://raeng.org.uk/media/duifixd5/wind_report.pdf.
[143]. It’s unclear whether overbuilding green energy would substantially reduce these costs, as the cost of additional renewables would have to be paid for.
[144]. Collins, “ANALYSIS | It Is Now Almost 14 Times More Expensive to Drive a Toyota Hydrogen Car in California than a Comparable Tesla EV.”
[145]. Miki Sasaki, “MHCV (Medium and Heavy Commercial Vehicles) Powertrain (Propulsion System) Long Term Forecast.,” S&P Global Mobility (blog), October 31, 2022, https://www.spglobal.com/mobility/en/research-analysis/mhcv-medium-and-heavy-commercial-vehicles-powertrain-propulsio.html.
[146]. This is the “additionality” argument—that if green hydrogen soaks up all the green energy, nothing has been gained from a decarbonization perspective.
[147]. “The Future of Hydrogen—Analysis.”
[148]. Calculation: 50*1,000 (MW)*1,000 (GW)*1,000(TW*600/(1(KG)*1,000(Tonnes)*1,000,000(MT).
[149]. Statista, Global electricity generation 1990-2022, https://www.statista.com/statistics/270281/electricity-generation-worldwide; “Renewables - Energy System,” IEA (blog), accessed October 15, 2023, https://www.iea.org/energy-system/renewables.
[150]. DOE, Regional clean hydrogen hubs selections for award negotiations, accessed December 21 2023, https://www.energy.gov/oced/regional-clean-hydrogen-hubs-selections-award-negotiations; How this is to be measured is currently the subject of a vicious lobbying effort as the U.S. Treasury prepares to issue detailed rules.
[151]. “The Section 45Q Tax Credit for Carbon Sequestration” (Congressional Research Service), accessed October 23, 2023, https://sgp.fas.org/crs/misc/IF11455.pdf.
[152]. DOE “Regional clean hydrogen hubs selections for award negotiations,” accessed January 5, 2024, https://www.energy.gov/oced/regional-clean-hydrogen-hubs-selections-award-negotiations.
[153]. “Lazard 2023 Levelized Cost of Energy+.”
Editors’ Recommendations
October 17, 2022
Climate-Tech to Watch: Sustainable Aviation Fuel
September 12, 2022
