
Not Again: Why the United States Can’t Afford to Lose Its Biopharma Industry

America’s leadership in advanced-technology industries can never be taken for granted, as evidenced by its losses in telecommunications equipment, semiconductors, televisions, solar panels, and chemicals. Policymakers must recognize what went wrong in those cases to avoid a similar industrial decline in the biopharmaceutical industry.
KEY TAKEAWAYS
Key Takeaways
Contents
U.S. Advanced Technology Industry Losses. 3
The U.S. Telecommunications Equipment Industry. 4
The U.S. Semiconductor Industry. 9
The U.S. Television Industry. 15
The U.S. Solar Panel Industry. 20
The U.S. Chemical Industry. 24
The U.S. Biopharmaceutical Industry. 29
Introduction
The United States has a long and rich tradition of pioneering the development of innovative industries, but later losing scaleup and production to countries with more effective government policies and companies with longer time horizons. In time, this loss erodes America’s early advantage, leaving out hollowed industries and lost jobs. Such industries include the telecommunications equipment, semiconductor, television, solar panels, and chemicals industries. America no longer has the luxury, or capability, of generating new industries only to lose them to competitors.
As such, if American policymakers want to avoid a deindustrialized economy dependent on raw materials, tourism, and financial services, they need to learn lessons from the experiences of these sectors to prevent its still strong advanced and emerging industries, including, among others, the biopharmaceutical industry, from experiencing the same fate. To maintain competitiveness in the still strong biopharma sector, policymakers need to stop taking for granted U.S. capabilities and jobs in the industry and instead create a supportive policy environment that stimulates private-sector domestic biopharmaceutical innovation and production. Consistent policies attacking the industry will lead to significantly reduced domestic production and competitiveness, and in this case, the likely emergence of China as the global leader.
America no longer has the luxury, or capability, of generating new industries only to lose them to competitors.
This report starts by exploring the factors that have contributed to the decline of five advanced industries in which the United States once led the world only to lose market share and jobs to other countries. It discusses the significance of American leadership in biopharmaceuticals and explains the factors that have contributed to achieving and maintaining this position. The report then explores lessons that can be learned from other industries and applies them to show how to maintain U.S. competitiveness in biopharmaceuticals in light of current trends in the global biopharmaceutical industry, particularly the rapid growth of China’s sector. It provides recommendations for policymakers to create a supportive environment that will enable the United States to maintain its future leadership in biopharmaceutical innovation and manufacturing, a sector critical for U.S. competitiveness, good jobs, and technology strength vis‑à‑vis China.
U.S. Advanced Technology Industry Losses
After World War II (WWII), America emerged as the world’s leading industrial country, in large part due to the core technology strengths it had built up with considerable financial support from the federal government.[1] The United States led the world in a plethora of advanced industries through the 1960s, but that leadership has eroded in several important industries over the ensuing decades, with other countries taking over that lead.
There are many reasons for this loss of competitiveness, including mistakes made by companies, but a common thread is that American policymakers took an overly laissez-faire approach to these industries, often leaving them to the free market alone without providing adequate policy support to the sectors, such as protecting them from foreign predatory trade practices, recognizing they require scale to compete in global markets, investing in their innovation potential, or supporting them with research and development (R&D) funding.
Meanwhile, in many cases, foreign governments developed sophisticated industrial strategies to support their industries, often intentionally targeted to siphon market share from the United States, and over time these policies successfully chipped away at the market share of U.S. firms. And while the competition from countries such as Germany, Japan, and Korea was fierce enough in the 1980s and the 1990s, China has emerged today as an intense competitive threat across virtually all advanced-technology industries.
For instance, a recent Information Technology and Innovation Foundation (ITIF) report, “The Hamilton Index, 2023,” which examines 40 countries’ share of global output across 10 strategically important industries, finds China to be the leading producer in 7 of those industries. Moreover, it finds that, overall, China is producing more than any other nation—and more than all other nations outside the top 10 combined.[2] Turbocharged Chinese competitiveness in advanced-technology industries has only further intensified the global contest for leadership in these industries, and more than ever, it means that no country, not even the United States, can take its leadership in these industries for granted.
The United States led the world in a plethora of advanced industries through the 1960s, but that leadership has eroded in several important industries over the ensuing decades, with other countries sometimes taking over that lead.
This report explores how the United States lost its lead across five advanced-technology industries: telecommunications equipment, semiconductors, television, solar panels, and chemicals. (Case studies could have been written for several others, including machine tools, steel, and motor vehicles.) It shows that failure to sustain a supportive policy environment has been a core contributing reason for U.S. loss of leadership in these sectors.
However, over the past four decades, the United States has come to be the global leader in biopharmaceutical innovation, in no small part due to supportive public policies, such as robust federal funding for biomedical R&D, R&D tax credits, effective technology transfer and commercialization policies, robust intellectual property (IP) protections, substantial exit opportunities, and a drug pricing system that enables companies to capture a share of the profits from successful products to reinvest in future generations of biomedical innovation. But, as this report shows, policies recently made or proposed by the Biden administration put America’s successful life-science innovation environment at serious risk, and may put the United States on the same path it’s suffered on in many other advanced industries: unnecessarily losing leadership in an industry vital to U.S. economic competitiveness.
The experience of the U.S. semiconductor industry should be a vital lesson to policymakers. Once the United States loses advanced industry share globally, it becomes much more expensive and more difficult to get it back. The U.S. biopharmaceutical sector is still strong, and therefore policymakers have time to preserve and even expand its global position, but only if they sustain, and not compromise, the very policies that made the U.S. industry a global leader in the first place.
The U.S. Telecommunications Equipment Industry
Telecommunications equipment manufacturers are companies that produce the hardware and software that enable wired and wireless communications.[3]
The Rise of U.S. Telecom Equipment Leadership
The telecom equipment industry traces its roots to the invention of the telephone by Alexander Graham Bell in 1876. The patent for the novel telephone design became the basis for the Bell Telephone Company, which was established in 1877 to commercialize the telephone and build telecommunication services throughout the United States and Canada.[4] Bell turned to manufacturing company Western Electric for its equipment needs, and by 1882, it had a controlling interest in the manufacturer.
In 1885, Bell became American Telephone & Telegraph (AT&T), and Western Electric remained a wholly owned subsidiary for the next 120 years, producing telecommunications equipment. By 1913, Western Electric commanded 59 percent of the global equipment market.[5] In 1925, AT&T and Western Electric combined resources to launch Bell Laboratories, which would go on to become the world’s most successful industrial laboratory, producing numerous inventions, including cellular technology, fiber optics, and the UNIX operating system.[6] By 1997, the United States was producing one-third of the world’s telecom equipment, and had a trade surplus of $3 billion.[7]
The Decline of the U.S. Telecom Equipment Industry
After WWII, the U.S. government, in its mission to rebuild Japan, pressured Western Electric to help modernize Japan’s electronics industry by offering technical courses to its companies, including Fujitsu, Hitachi, NEC, Sanyo, and Toshiba. At the same time, “government procurement activities in other countries resulted in much more closed communications equipment markets than in the United States,” leaving Western Electric with less access to foreign markets and more competition from imports.[8] While the United States left the fate of its telecom equipment industry solely to the free market, foreign countries provided direct financial support to their domestic telecom industries and followed protectionist policies.[9]
At the same time, the American government also took antitrust regulatory action against major players in the telecom equipment industry, diminishing their innovation capabilities. In the 1949 case United States v. Western Electric, the Department of Justice (DOJ) accused AT&T of illegally excluding other manufacturers by buying equipment only from Western Electric, itself a part of AT&T. As part of the 1956 settlement, AT&T was allowed to retain ownership of Western Electric but agreed to license its existing patents for free to domestic companies and its new patents at reasonable rates.
While sharing AT&T’s IP helped advance domestic innovation, it also provided a significant boost to foreign companies. For example, after Bell Labs invented the transistor, one of the most important technological breakthroughs of the 20th century, in 1947, antitrust regulators pushed AT&T to license the technology. In 1952, 35 companies, including 10 foreign firms such as Siemens, Ericsson, and Sony, gained valuable information to enable core advances, allowing them to take market share from leading American companies.[10] A 1991 U.S. International Trade Commission (ITC) report notes that requiring AT&T and Western Electric to license their patents opened “the door for new entrants to commercialize AT&T’s technology while at the same time precluding AT&T from entering other markets … Such technological diffusion enabled other firms, including foreign manufacturers, to narrow the technological gap and even advance ahead of U.S. firms in some areas.”[11]
In 1974, DOJ initiated a second major antitrust lawsuit that impacted the telecom equipment industry: United States v. AT&T. At the time, the United States boasted the best phone system in the world and the most advanced telecom equipment manufacturer in Western Electric. The lawsuit alleged both that AT&T’s association with Western Electric was illegal and that AT&T was monopolizing the long-distance market. DOJ asked AT&T to divest its manufacturing and long distance operations from local service, though there were calls against this breakup on national security grounds.[12] The settlement, a decade later, required AT&T to divest its local telephone companies (Regional Bell Operating Companies, or RBOCs), but allowed AT&T to continue manufacturing telephone equipment. This meant that the RBOCs were free to purchase equipment from anyone, not only Western Electric, and enabled several foreign manufacturers to gain American market share in the telecom equipment industry.[13] The breakup of AT&T also had a negative impact on Bell Labs. A report from the National Research Council notes:
Prior to the restructuring of the telecommunications industry in 1984, [Bell Labs] played a dominant role in long-term, fundamental telecommunications research for the United States. Post-restructuring, industrial support for such research has declined, become more short-term in scope, and become less stable. A diverse array of competing telecommunications firms—telephone, cable, Internet, and wireless—emerged, leaving most research to equipment vendors, which increasingly focused on short-term goals.[14]
While there are many instances in which competition can help spur innovation, the decades of antitrust action against AT&T have hindered it in America’s telecom equipment industry.[15]
In 1996, Congress passed the Telecommunications Act in an attempt to restructure the American telecom market to promote competition and safeguard against companies leveraging monopoly power. The act mandated “interconnection of telecommunications networks, unbundling, non-discrimination, and cost-based pricing of leased parts of the network, so that competitors can enter easily and compete component by component as well as service by service.”[16] The act financed hundreds of entrants that raised billions of dollars to compete with AT&T, but those companies largely went bankrupt shortly thereafter.
Without government support or major technological changes, the United States will find it difficult to regain competitiveness in the telecom equipment industry, but it can learn important lessons that are timely and relevant for other advanced industries, such as biopharmaceuticals.
Also in 1996, AT&T spun off Bell Labs and Western Electric into Lucent Technologies. By 1999, Lucent had become the world’s largest telecom equipment company, earning $38.3 billion in revenue, making $4.8 billion in profits, and employing 153,000 workers. But the burst of the dot-com bubble in 2000 led to a huge reduction in telecom equipment spending, and Lucent’s stock price dropped from $65 in September 1999 to $0.76 cents in September 2002. Even after the market rebounded, Lucent could not recover due to fierce competition, notably from Chinese company Huawei. In 2006, a struggling Lucent was sold to the French company Alcatel, and in 2015, the Finnish company Nokia acquired Alcatel-Lucent.[17]
From the 1970s to the 1990s, the United States had the two largest telecom equipment manufacturers in the world (first Western Electric and International Telephone & Telegraph (ITT), followed by Lucent and Nortel, which was Canadian but had tens of thousands of U.S.-based employees). But within two decades, as Lucent was sold and Nortel declared bankruptcy, the United States lost its leadership in the telecom equipment industry. While managerial reasons were partly to blame, the failures also stemmed from the U.S. government’s blind trust in free-market policies and decades of antitrust action, coupled with strong industrial policies from foreign nations, which weakened both Western Electric, Lucent’s predecessor, and Bell Labs. Without government support or major technological changes, the United Stateswill find it difficult to regain competitiveness in the telecom equipment industry, but it can learn important lessons that are timely and relevant for other advanced industries, such as biopharmaceuticals.[18]
China’s Industrial Policy in the Telecom Equipment Industry
ITIF comprehensively explained the loss of U.S. leadership in the global telecommunications equipment industry in a 2020 American Affairs article entitled “Who Lost Lucent?: The decline of America’s telecom equipment industry.”[19] But in addition to the factors described previously, including such U.S. government policy decisions as overly aggressive antitrust actions, top-down restructuring of markets, a lack of a domestic industrial strategy, and a resulting climate that discourages long-term investments by U.S. telecommunications companies, there is also the emergence of China’s telecommunications industry and the failure, until recently, of the United States to challenge Chinese technological mercantilism.[20]
Huawei’s founder, Ren Zhengfei, noted in 2002, “If there had been no government policy to protect [nationally owned companies], Huawei would no longer exist.”
While the United States generally left the telecom equipment industry to its own devices, other countries embraced strategies to protect and support their domestic companies. In October 2002, the Chinese government announced the Ministry of Information Industry’s (MII’s) support to expand TD-SCDMA, China’s 3G standard, to promote and protect its own industry from foreign competitors. Soon after, seven major Chinese telecom equipment companies, including Huawei and ZTE, formed the government-backed TD-SCDMA Industrial Alliance. The TD-SCDMA standard enabled Chinese manufacturers to use TD-SCDMA freely and to receive lower fees to use other standards. Noting the impact of these actions on the industry, Huawei’s founder, Ren Zhengfei, noted in 2002, “If there had been no government policy to protect [nationally owned companies], Huawei would no longer exist.”[21]
To further nurture its fledgling domestic industry, China promoted the establishment of joint ventures for any foreign companies seeking to enter the large Chinese market. This scheme had several requirements: The Chinese side would hold a majority share of the venture, custom equipment would be produced in China, and, importantly, the foreign side would transfer technology to the Chinese side. This approach enabled domestic firms to both acquire knowledge and create local jobs. Bell was the first to establish such a joint venture, named Shanghai Bell.[22] The Chinese government provided subsidies to buyers of Shanghai Bell equipment and lowered Shanghai Bell’s taxes and tariffs on imported parts. Many companies soon followed suit and established joint ventures in China, including Ericsson, Siemens, Fujitsu, Lucent, Motorola, NEC, and Nortel. Leveraging the expertise gained from these ventures, China financially supported the development of domestic companies, and set up protective import barriers.[23]
Chinese telecom equipment companies have long been eligible for preferential interest rates on export credits from China’s Export-Import Bank and the China Development Bank.[24] As the U.S. Export-Import Bank concluded, “[M]ost of the terms and conditions of their [China Exim Bank’s] financing did not and do not fit within the OECD [Organization for Economic Cooperation and Development] guidelines.”[25] Chinese banks have also made loans to bail out foreign telecom service providers that buy equipment from Chinese companies. One study finds that “since 2015 China has provided more funding each year to support its exports than the OECD’s 36 member-nations combined.”[26] As China rolled out its Belt and Road Initiative to support Chinese exports in emerging markets and parts of Europe, Huawei benefited substantially. Indeed, in a 2016 speech a senior Chinese official, Zhang Yansheng, noted that “without the Belt and Road Initiative, there wouldn’t be Huawei.”[27]
Further, Bloomberg noted, “By the 2000s, Huawei was taking its strategy overseas, with the help of $10.6 billion in credit from China Development Bank and the Export-Import Bank of China, both controlled by Beijing. Its credit line would reach $100 billion over the next decade.”[28]
The U.S. Telecom Equipment Industry Today
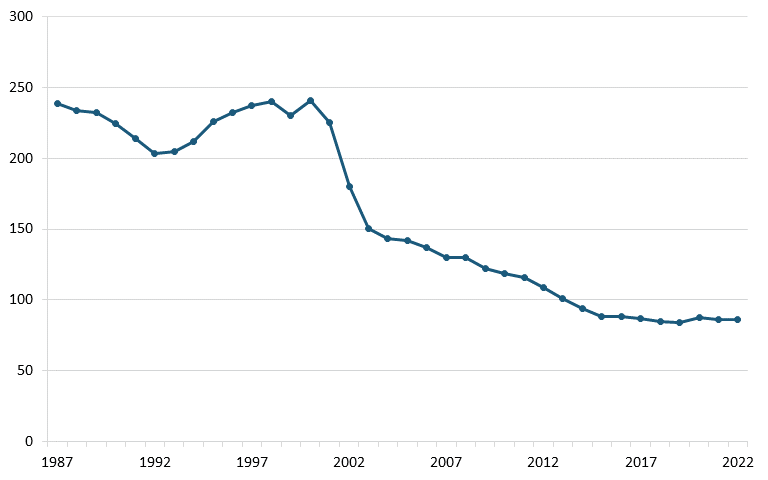
The U.S. telecom equipment industry has experienced substantial losses since the late 1990s in both annual output and employment. According to annual output and employment data from the Bureau of Labor Statistics (BLS), the sector’s output dwindled from $120 million in 2000 to less than $40 million by 2022, and employment declined from more than 240,000 to 86,000 over the same period. (See figure 1 and figure 2.)
Figure 1: U.S. communications equipment manufacturing, annual output (billions)[29]
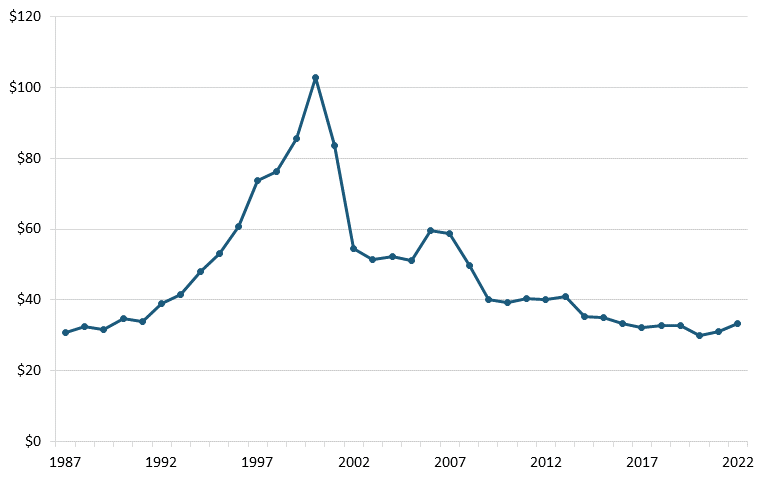
Figure 2: U.S. communications equipment manufacturing, employment (thousands)[30]
The loss of the U.S. telecom equipment industry entailed several factors, and managerial errors should be understood in the context of U.S. government policies such as aggressive antitrust actions, a lack of domestic industrial strategy, and a failure to respond to foreign nations’ policies. Shifting the focus to competitiveness in antitrust regulation and devising a thoughtful domestic industrial strategy could help other advanced industries in the United States, including biopharmaceuticals, avoid the fate of the telecom equipment industry.[31]
The U.S. Semiconductor Industry
Semiconductors, which consist of transistors that control electrical currents, are critical for the operation of most electronic devices, from laptops and smartphones to medical devices and avionics.[32] Analysts expect the semiconductor industry to reach $588 billion in revenues in 2024, driven by rising demand for semiconductors from technologies such as 5G, cloud computing, and artificial intelligence (AI).[33]
The Rise of U.S. Semiconductor Leadership
The foundation for semiconductor development began in the 1930s in response to a need to create radar technology due to impending war. After the end of WWII, in 1946, a team of scientists, including John Bardeen, Walter Brattain, and William Shockley, convened at Bell Labs.[34] In December 1947, the trio invented the transistor, a small semiconductor device, for which they later won the Nobel Prize in Physics. The device could amplify or switch electronic signals and electrical power.[35] In those days, Bell Labs, still a part of AT&T, had ample resources to support such long-term, fundamental research projects. It received its first military contract to support transistor technology R&D in 1949, and “by the early 1950s, Bell Labs had become the world’s richest source of technical and scientific information about transistors and semiconductor materials.”[36]
As part of the 1956 AT&T antitrust settlement, Bell Labs agreed to organize a symposium for military personnel, as well as academic and private sector contractors. This was part of the government’s mission to disseminate scientific information about semiconductors throughout industry and academia. Further, the complex nature of the military’s technological demands required multi-entity cooperation, shaping the culture and structure of the semiconductor industry. For example, the Minuteman I and II missile programs during the 1960s required collaboration across many firms, including Autonetics, Fairchild Semiconductor Corporation, Bell Labs, and Motorola.[37]
American industrial policies supported the expansion of the nascent semiconductor industry. The Department of Defense used procurement contracts to ensure demand, prompting many firms to invest in R&D, and its backing of semiconductor research in university and industry labs also helped cultivate scientific and technical expertise.[38] Historian Daniel Holbrook has noted, “For early semiconductor technology, the United States government helped provide an environment conducive to both high flows of technical and scientific information and diversity in approaches to innovation.”[39] While the industry relied heavily on military purchases in the late 1940s, by the end of the 1960s, the sector had experienced significant growth, and military contracts comprised less than one-quarter of the market.[40] By 1972, the U.S. semiconductor industry was a global leader, accounting for 60 percent of market value.[41]
Foreign Challenges to the U.S. Semiconductor Industry
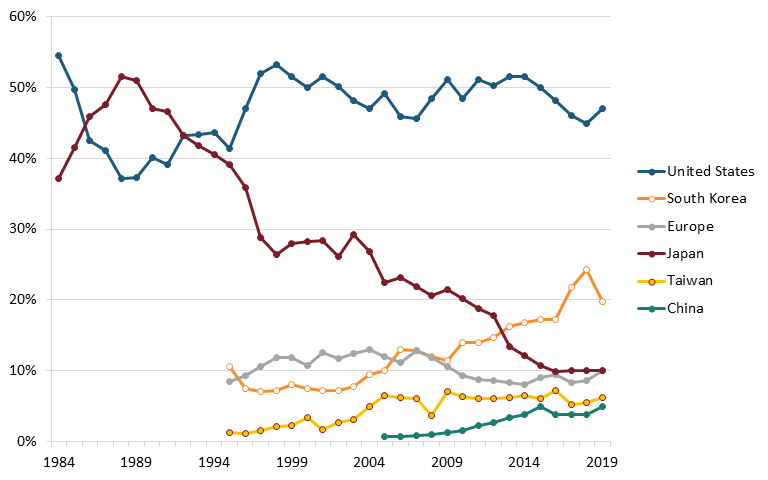
By the 1980s, Japan’s semiconductor industry was growing rapidly due in large part to government support in the form of R&D investments, subsidies, tax incentives, and protectionist trade policies restricting foreign competitors, as well as its growing technical engineering expertise.[42] Meanwhile, production subsidies and cheap labor in South Korea, Taiwan, and Southeast Asia, led most American semiconductor firms to open manufacturing plants overseas in the 1970s and into the 1980s.[43] By the late-1980s, across all memory, logic, and analog chips in the global semiconductor market, Japan’s global market share in terms of sales eclipsed 50 percent while the United States’ fell to less than 40 percent.[44] (See figure 3.)
In 1987, an analysis by the U.S. Defense Science Board’s Task Force on Semiconductor Dependency found that the United States was losing semiconductor manufacturing capacity and technological leadership to foreign competitors, particularly from Japan. The task force recommended the launch of a federally funded industry-government consortium to regain competitiveness.[45] This led 14 U.S. semiconductor firms to found SEMATECH (Semiconductor Manufacturing Technology), a public-private research consortium based in Austin, Texas, committed to supporting advances in manufacturing technology. Over the next eight years, Congress, through the Defense Advanced Research Projects Agency (DARPA), provided $870 million to SEMATECH.[46]
By 1994, the American industry share in the global semiconductor market was growing again, supported by public-private partnerships and other U.S. government actions, such as the 1986 U.S.-Japan Semiconductor Agreement, which called for an end to Japanese dumping and an opening of Japan’s market to foreign firms, incentivizing American companies to invest in R&D.[47] Policy intervention in the 1980s may have saved much of the U.S. semiconductor industry at the time, and the industry flourished through the start of the 2000s, especially as U.S. firms came to lead in fabless chip design, that is, firms such as Apple, AMD, Qualcomm, and NVIDIA that design application-specific chips in-house, usually to be manufactured at foundries such as TSMC. (This is called the “fabless-foundry” business model.) But in the ensuing decades, U.S. competitiveness in semiconductor manufacturing began to falter again, due in no small part to aggressive foreign government incentives seeking to attract globally mobile semiconductor industry investment, as the following section elaborates.
Figure 3: Global semiconductor market share, by revenues, 1984–2019[48]
Foreign Investment Incentives
While other countries have been willing to subsidize the building of semiconductor fabrication facilities (“fabs”), the United States largely has not. This helps explain much of the U.S. decline in semiconductor manufacturing. Other nations help companies defray the high fixed costs of building a fab, with incentives to reduce up-front capital expenditures on land, construction, and equipment and that can also extend to recurrent operating expenses such as utilities and labor.[49] Foreign government incentives may offset from 15 to 40 percent of the gross total cost of ownership (TCO) (pre-incentives) of a new fab, depending on the country.[50] The 10-year TCO of U.S.-based semiconductor fabs is 25 to 50 percent higher than in other locations, with government incentives accounting for 40 to 70 percent of the U.S. TCO gap.[51]
While other countries have been willing to subsidize the building of semiconductor fabs, the United States largely has not. This helps explain much of the U.S. decline in semiconductor manufacturing.
Over the past two decades, China has become a far more significant competitor in the global semiconductor industry. China’s semiconductor industry has received over $170 billion worth of government subsidies, which China has used both to launch entirely new companies and to finance the acquisition of foreign competitors. In fact, China invested $290.8 billion in semiconductor projects between 2021 to 2022 alone.[52] Between 2010 and 2020, the time required to build a new fab declined from 747 to 675 days in China, while it rose from roughly 700 to over 900 days in the United States.[53] Elsewhere, Japan announced $21 billion in funding in 2023 to support its semiconductor industry, including a $3.5 billion subsidy for a new 10 nanometer (nm) to 20 nm fab in the Kumamoto prefecture. Taiwan’s Chips Act, passed in January 2023, offers investment tax credits of 25 percent on R&D and 5 percent on equipment.[54] South Korea’s K-Belt strategy seeks to build the world’s best semiconductor supply chain by 2030 with a $450 billion investment plan. It offers semiconductor manufacturers tax credits that cover up to 25 percent of facility costs and 30 to 40 percent of R&D expenditures.[55] In April 2023, the European Union approved its $47 billion European Chips Act, which includes investment incentives, R&D funding, and talent building measures.[56] And in July 2023, Germany allocated $20 billion for semiconductor incentives.[57] In short, other nations are competing fiercely for semiconductor manufacturing activity.
The U.S. Semiconductor Industry Today
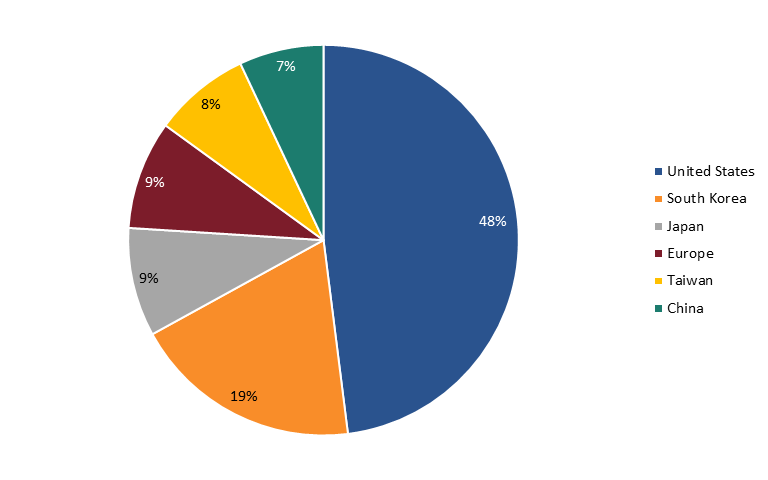
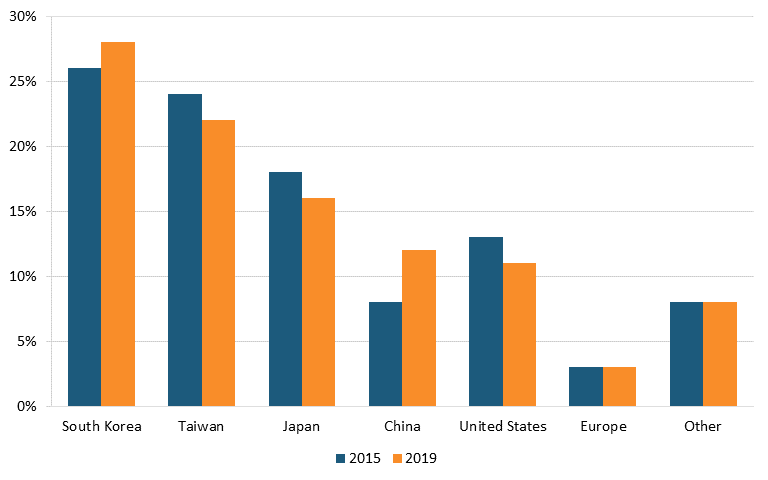
When considering nations’ global semiconductor market share (by industry sales of firms headquartered in nations), the United States does clearly continue to lead the world. In fact, in 2022, U.S.-headquartered semiconductor enterprises held a 48 percent market share of global semiconductor industry sales (down about 4 percent from the 51.8 percent share they held in 2012), followed by South Korean firms with 19 percent, Japanese and European firms with 9 percent each, Taiwanese firms with 8 percent, and Chinese enterprises with 7 percent. (See figure 4.) This especially reflects the strength of the U.S. fabless semiconductor companies.
Figure 4: 2022 Global semiconductor industry sales market share by nationally headquartered company[58]
However, production shares are different, as many semiconductors are produced for U.S. customers in places such as Taiwan and China. Indeed, as of 2019, the United States possessed just 11 percent of global semiconductor fabrication capacity, whereas South Korea held 28 percent, Taiwan 22 percent, Japan 16 percent, China 12 percent, and Europe 3 percent. (See figure 5.) And in fact, from 1990 to 2021, the U.S. share of global semiconductor production fell from 37 percent to 12 percent.[59] China’s share of global semiconductor fabrication capacity doubled from 2015 to 2019. As of year-end 2020, there were just 20 semiconductor fabs operating in the United States.[60]
Figure 5: Global semiconductor fabrication capacity by country[61]
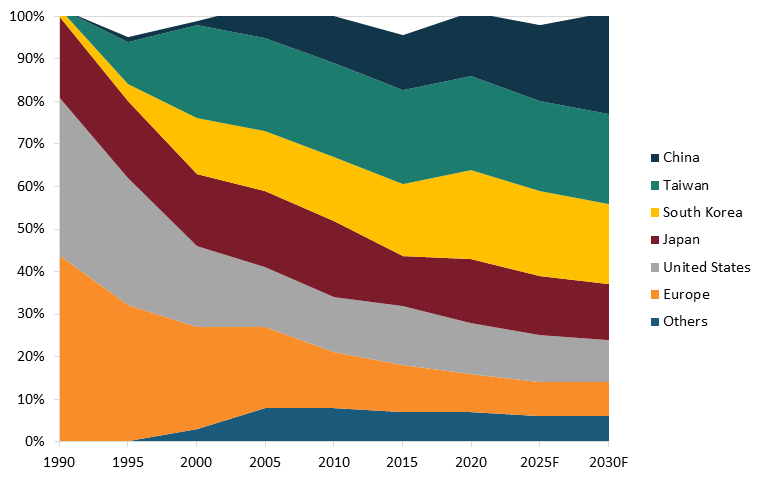
In total, according to a report from the Boston Consulting Group, from 1990 to 2020, the U.S. share of global semiconductor production fell by approximately 70 percent, from a 37 percent share in 1990 to 12 percent by 2020. (See figure 6 for an illustration of the U.S. drop in global semiconductor production share.) That report finds that, absent effective policy intervention, the U.S. share of global semiconductor manufacturing would continue to wither, to about 10 percent, by 2030.
America’s loss of semiconductor manufacturing activity was a critical motivating factor behind congressional and Biden administration passage of the CHIPS and Science Act in August 2022. The legislation provides a substantial boost to the semiconductor industry by offering $39 billion in incentives, $13 billion for semiconductor R&D and workforce training, and a 25 percent investment tax credit to promote domestic chip manufacturing.[62] To be sure, several other factors motivated the CHIPS Act’s passage, including a global chip shortage in 2021 and 2022, which was worsened by the COVID-19 pandemic—a shortage that exposed vulnerabilities in semiconductor supply chains, which span numerous countries and entail a long, expensive, and complex process.
Figure 6: Global semiconductor manufacturing capacity, by location, 1990–2030 forecast[63]
As a 2022 study notes, “Supply disruptions included the forced closure of chip manufacturing plants due to global lockdowns, resulting in the depletion of semiconductors production and inventory. Other supply disruptions were due to logistic-related issues.”[64] Geopolitical conflicts, including trade tensions between the United States and China, have further disrupted supply chains, creating challenges for Chinese semiconductor manufacturing and aggravating the shortage. These conditions have led the United States to reevaluate its policies to support an increase in domestic semiconductor chip production.[65]
The CHIPS and Science Act also spurred the creation of the National Semiconductor Technology Center (NSTC), a public-private consortium dedicated to supporting semiconductor research, design, engineering, and advanced manufacturing. Erica Fuchs, professor in the Department of Engineering and Public Policy at Carnegie Mellon University, director of The National Network for Critical Technology Assessment (NNCTA), and a member of the inaugural board of trustees overseeing the NSTC, noted:
Semiconductor chips are the driving force behind our economy, national security and an infinite number of systems that ensure societal well-being. To maintain our national sovereignty and way of life, we must invest in the manufacturing capability necessary to lead not only in the production of today’s chips, but also to innovate, commercialize and lead in the manufacturing of the chips of the future. Executed smartly, the NSTC holds the potential to be a pivotal first step toward getting the country where it needs to be.[66]
The act represents an effort on the part of the government to uphold American leadership in critical industries, such as semiconductors. The government has engaged experts across academia and industry to ensure effective investments. For example, the National Science Foundation (NSF) allocated nearly $4 million in 2022 to the NNCTA for a year-long academic effort to identify critical challenges facing the United States and to recommend areas of strategic government investment in important sectors such as semiconductors, AI, biopharmaceuticals, and energy and critical minerals. The resulting report, “Securing America’s Future: A Framework for Critical Technology Assessment,” identifies specific technological areas in these sectors where funding could be most effective at bolstering U.S. competitiveness.[67]
Since the enactment of the CHIPS act in 2022, companies have already announced investments exceeding $220 billion in semiconductor and electronics manufacturing across 22 states.[68] A total of 70 new semiconductor projects are underway, with initiatives including the construction of new semiconductor fabs, the expansion of existing sites, and facilities that supply the materials and equipment used in chip manufacturing. These projects are expected to lead to the creation of 44,000 new jobs.[69] A study jointly conducted by The Semiconductor Industry Association (SIA) and Oxford Economics finds that for each American worker employed by the semiconductor industry, 5.7 more jobs are created in the wider U.S. economy.[70] Such industrial policies intended to resuscitate domestic manufacturing are critical for the long-term competitiveness of the United States in the critical semiconductor industry.
The U.S. Television Industry
The Rise of the U.S. TV Industry
During WWII, the American electrical industry shifted to war production, and television research pivoted toward military applications such as guided missiles and long-range reconnaissance. Companies such as Western Electric, Bell Labs, Eastman Kodak, and Radio Corporation of America (RCA) all redirected their R&D to support the war effort. At the start of the war, David Sarnoff, president of RCA, telegraphed President Franklin Roosevelt, stating, “All our facilities and personnel are ready and at your instant service. We await your commands.”[71]
RCA’s large base of scientists and engineers leveraged their experience working on airborne reconnaissance television systems since 1935 to develop critical radar, sonar, and electronic navigation systems. Most wartime advances in television weaponry resulted from collaborations between RCA and the Office of Scientific Research and Development (OSRD) of the U.S. military.[72]
In 1946, enhanced by innovations developed during WWII, television emerged significantly improved.[73] While in 1948 about 800,000 television receivers were sold, by 1950, this figure had surged to 7.5 million. The postwar years were a time of remarkable growth for U.S. television manufacturing and programming, and RCA generated substantial revenue from its patents and manufacturing.[74]
Japan’s Challenge to the U.S. TV Industry
Meanwhile, the Japanese electronics industry began to recover in 1953, as American forces allowed it to resume production of radios and television transmissions. The Japanese television industry underwent swift growth from the mid-1950s to the mid-1970s, spurred by rising personal incomes, widespread acceptance of Japanese consumer electronics, and government policies.[75] Measures included support from the Japanese Ministry of International Trade and Industry (MITI) for consumer electronics, import restrictions to protect nascent local television producers, and the creation of the Japan Metal and Machinery Institute in 1957 to set quality standards for exports. One project sponsored by MITI resulted in Hitachi’s production of the first all-transistor color television set in 1969. By 1970, the Japanese domestic television industry was booming. Domestic manufacturers enjoyed cheap local labor, a large network of component suppliers, and access to new MITI-supported technology.[76] Japan protected its domestic television industry through tariffs, quotas, and import restrictions. Tariffs on color TV imports were 30 percent in Japan until 1968, compared with 7.5–10 percent in the United States over the same period.[77]
In the 1950s, Japan prevented imports by denying the distribution of foreign company products through the country’s extensive network of dealers. Import restrictions forced foreign companies to license their television technology to Japanese companies to enter the market. The U.S. government encouraged this technology transfer from American companies, such as RCA and General Electric, to their Japanese counterparts in an effort to help rebuild Japan after the war. Licensing brought short-term profits to American companies, but the knowledge acquired by Japanese companies was much more valuable.[78]
The Decline of the U.S. TV Industry
During the 1950s, RCA was the leading American color TV producer, and DOJ took aggressive antitrust actions against RCA due to its dominant market share in this sector. However, research shows that RCA’s “monopoly” had raised the price of TVs by only 2.26 percent, while RCA supplied most product and process innovations in the industry thanks to its scale and scope.[79] Economist Steven Klepper argued in his book Experimental Capitalism: The Nanoeconomics of American High-Tech Industries that such action was one of the triggers that led to the eventual demise of the American color TV industry.[80] DOJ required RCA to share its patents freely with domestic competitors, and to only charge royalties from foreign competitors. RCA, reliant on licensing revenue, was forced to license its technologies to foreign companies, primarily ones from Japan.
Technology historian James Abegglen wrote, “Unwittingly, RCA actually assisted the Japanese by selling them whatever technology licenses they required. It was a highly profitable exercise … Japan was dependent on foreign sources for virtually all of the technology employed even to the stage of color television … RCA licenses made Japanese color television possible.”[81] The Japanese government, aware of the value of this licensing, awarded RCA president Sarnoff the Order of the Rising Sun in 1960 for his contributions to the Japanese electronics industry. Historian John Steele Gordon wrote, “To protect an American industry from the dominance of one company, antitrust had killed off the entire industry. That’s a bit like using a guillotine to cure a headache.”[82]
By the 1960s, Japanese televisions were flooding the American market, sold at cheaper prices than their American counterparts. This was made possible by lower labor costs and technology transfer, as well as the practice of “dumping,” which involved pricing below cost in the United States but pricing high in Japan, where the industry was protected from foreign competition.[83] In 1975, Japan sold 5.5 million of its own TV sets in domestic markets, but imported only 11,644 units, which decreased to 485 by 1978.[84]
In 1963, Japanese companies, including Hitachi, Matsushita, Sharp, and Toshiba, formed the Television Export Council. The Council developed the “Five-Company Rule,” which required each Japanese exporter to specify five U.S. companies as its only, exclusive customers. This distribution of American retailers aimed to reduce intra-Japanese competition for American firms. It also set common minimum prices for exports, in an attempt to prevent Japanese companies from being accused of dumping under the U.S. Antidumping Act of 1921, which prohibits exports to the United States at prices lower than those charged at home if such exports cause substantial injury to an American industry.[85] Still, American companies complained about dumping violations by Japanese companies, and the first legal proceedings began in March 1968.[86] In 1971, the U.S. Department of Treasury found Japanese companies guilty, but duties were not collected until 1979 when the antidumping duty law was overhauled. By that time, the American television industry had incurred substantial damage.[87]
In another case brought against Japanese companies, American companies Zenith Radio Corporation and National Union Electric Corporation (NUE) filed a lawsuit against Japanese TV manufacturers in 1974, alleging they had engaged in an illegal predatory pricing conspiracy “to raise, fix and maintain artificially high prices … in Japan and … to fix and maintain low prices for television receivers exported to and sold in the United States,” resulting in large losses and reduced manufacturing investments by American firms.[88]
Twelve years later, in 1986, the U.S. Supreme Court ruled that Zenith and NUE had failed to provide sufficient admissible evidence to prove that Japanese companies had engaged in a predatory pricing conspiracy to monopolize the American consumer electronics market. This ruling raised the standard of proof required to show evidence of a conspiracy, and further harmed the American television industry.[89] One of the reasons the Court ruled this way is that it did not take the time to understand the Japanese industrial policy system and the role of “administrative guidance” provided by Japan’s MITI, which coordinated foreign markets, including pricing policies, of major Japanese companies in particular industries. In the 1970s, imports accounted for over 50 percent of America’s consumer electronics market, and many American companies had exited due to competition from Japan.[90]
The U.S. Television Industry Today
Japan’s support of its television industry enabled its companies to grow to dominate the global television market while American television manufacturing collapsed, in part due to a failure of the U.S. government to protect the industry from aggressive and unfair foreign practices.[91] Over almost three decades, from 1952 to the late 1970s, the Japanese share of America’s consumer electronics product market rose from 20 percent to almost 50 percent. By 1986, U.S. manufacturers sold only 37 percent of the TVs and radios in the United States.[92] Zenith, the last well-known U.S. television manufacturer, was acquired by Korea’s LG Electronics in the late 1990s, following a trend by other American companies, including Philco, Sylvania, Emerson, Motorola, RCA, Westinghouse, Admiral, GE, and Magnavox, to leave the television manufacturing business or be acquired by foreign companies.[93]
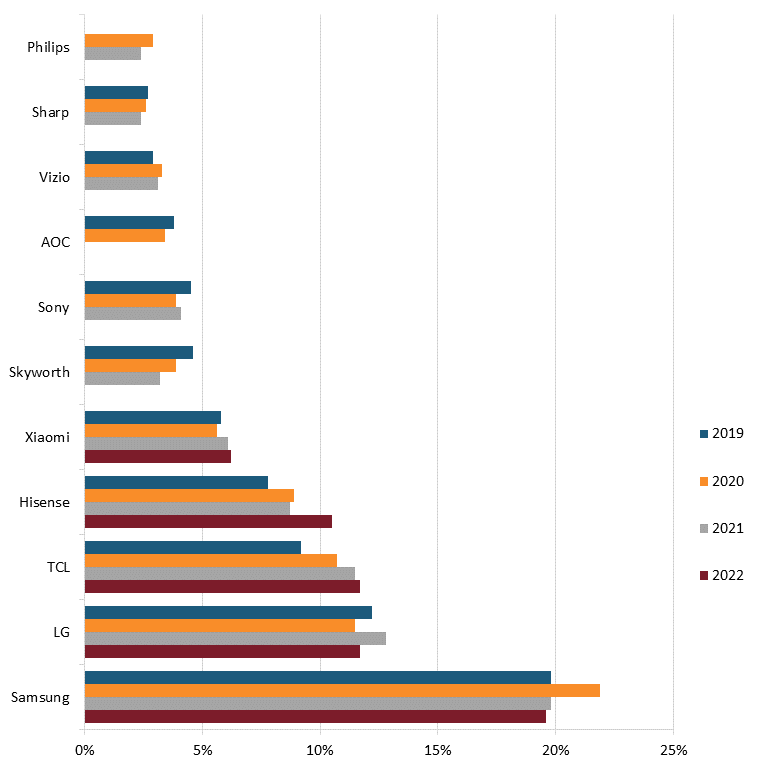
Today, only two U.S. television manufacturers remain: Vizio, which was founded in 2002 to provide high-quality, low-cost flat-panel televisions but produces primarily in countries such as China, Mexico, and Taiwan, and South Carolina-based Element Electronics, founded in 2006 to manufacture budget-friendly LCD and LED TVs.[94] According to 2022 market data, foreign competitors such as Samsung, LG, TCL, Hisense, Xiaomi, Skyworth, Sony, and AOC lead the world in the industry.[95] (See figure 7.)
Figure 7: Market share of top TV manufacturers globally, 2019–2022, by sales volume[96]
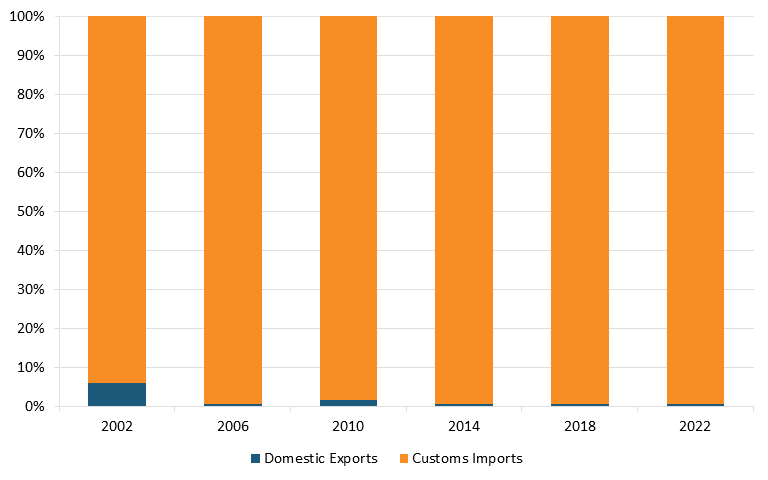
Moreover, according to The Observatory of Economic Complexity, in 2021, China was the top exporter of broadcasting equipment in the world. It held a $231 billion export value, representing 48.8 percent of the world market, while the United States had an export value of $25.1 billion, representing only 5.31 percent.[97] According to trade data from the U.S. Census Bureau, the United States has a massive trade deficit in the radio/TV broadcast and wireless communication equipment industry, which widened between 2002 and 2022. (See figure 8 and figure 9.)[98]
Figure 8: U.S. imports and exports of radio/TV broadcast and wireless communication equipment, world total[99]
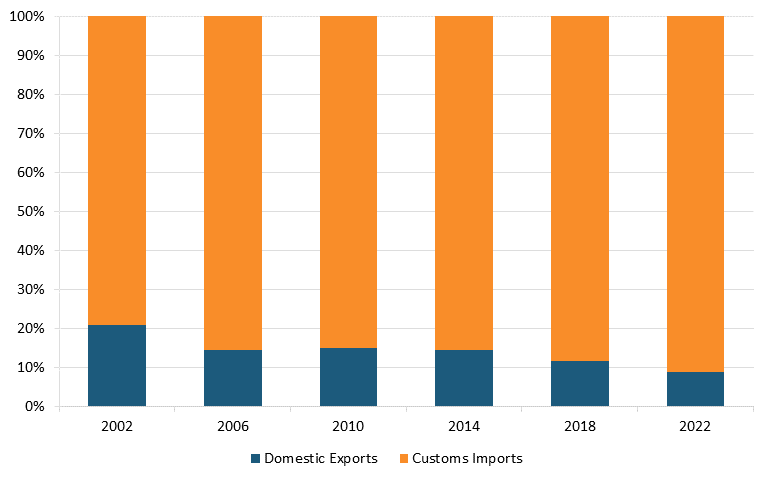
Figure 9: U.S. imports and exports of radio/TV broadcast and wireless communication equipment, U.S. and China[100]
The U.S. Solar Panel Industry
Solar power resources, abundant and accessible, are a renewable energy source with considerable potential. The primary solar power technology in current use is solar photovoltaics (PVs). Commonly known as solar panels, these devices absorb energy from sunlight and convert it into electricity through semiconducting materials.[101]
The Rise of the U.S. Solar Panel Industry
Charles Fritts invented the first solar panel in 1883, coating selenium with a thin layer of gold and placing it on a New York City rooftop. While electrically inefficient, his invention laid the groundwork for the future of solar panels. In 1954, three Bell Labs scientists—Daryl Chapin, Calvin Fuller, and Gerard Parson—pioneered the first practical solar cell, using silicon material that had served as the foundation for the transistor seven years earlier.[102] Dubbed the “Bell Solar Battery,” the silicon cell was capable of a 6 percent energy conversion rate, and received a patent in 1957.[103]
Western Electric began licensing the solar cell patent in the 1950s as part of its antitrust settlement policy to share its patent portfolio. In 1962, AT&T also used the cells to launch the Telstar satellite that relayed TV signals across the United States. However, solar cells were expensive and had limited applications in the first few decades.[104] Instead, aerospace, including unmanned space probes and satellites, represented the primary market for solar cells, providing crucial early demand to jump-start the industry. To meet this demand, the U.S. government supported the solar cell space industry in the 1960s through federal procurement contracts. The successful launch of the Vanguard I satellite in March 1958 marked the first use of solar cells in space. The solar cells lasted six years, a significant increase over the four-month life span of chemical batteries previously used by the National Aeronautics and Space Administration (NASA).[105] NASA itself supported the launch of the solar industry’s first professional society, the Institute of Electrical and Electronics Engineers’ (IEEE) Photovoltaic Specialists Conference, hosting the conference at its headquarters from 1961 to 1968.[106]
Energy Crises
The 1973 and 1979 oil crises spurred the U.S. government’s interest in using solar energy beyond space missions for terrestrial applications to power homes and businesses.[107] The industry advocated for increased federal funding to adapt the solar cells used in space for broader markets. This task required making them smaller, cheaper, and flexible to changing weather conditions. In response, the U.S. government launched a large-scale R&D project to tailor solar cells to more cost-sensitive markets. From 1975 to 1986, the Energy Research and Development Administration, and later the Department of Energy (DOE), invested $235 million to fund the Low-Cost Silicon Solar Array (LSSA) project, a consortium for university and industry research.[108]
In the late 1980s, the U.S. government supported several pioneering experiments in California’s Mojave Desert, which laid the foundation for utility-scale solar power generation. At the time, the United States boasted the largest grid-connected solar facilities in the world, and American firms were the largest global suppliers of solar technology. Yet, a decline in fossil fuel prices reduced consumer, commercial, and utility interest in expensive solar cells to replace traditional energy sources, and prompted an end to government subsidies. In the United States, solar interest waned during the 1990s, but in countries with higher energy prices, heightened environmental awareness, and proactive industrial policies, particularly Japan and Germany, domestic solar panel industries were on the rise. By the late 1990s, the global solar panel industry was roughly evenly divided between the United States, Japan, and Europe.[109]
China’s Challenge to the U.S. Solar Panel Industry
As with telecommunications equipment, ITIF comprehensively documented the competitive challenge to the United States from China’s solar industry in our report, “The Impact of China’s Production Surge on Innovation in the Global Solar Photovoltaics Industry.” The following again summarizes some of the key dynamics.
Before 2000, China’s domestic solar panel industry was small and had few domestic applications. However, a rise in global demand prompted the Chinese government to implement a series of incentives, including direct subsidies for solar cell installations, and a national Feed-in Tariff (FIT) scheme, which led to rapid industry growth.[110] One report finds that “the dramatic increase in demand for PV by European countries since 2004, especially Germany … has led China to a huge solar production ramp on all fronts of the domestic supply chain, from polysilicon, wafers to cells and modules.”[111] In 2008, China became the largest solar cell manufacturing nation, contributing one-third of worldwide total cell shipments.[112]
China has enacted a number of policies to support the expansion of its domestic solar industry. Two early measures were the Brightness Program in 1996 and the Township Electrification Program in 2002. They provided financial support to companies building solar stations and wind systems in remote areas of Western China to address rural electrification needs, stimulating rapid development of China’s domestic solar industry.[113] Later measures, including The Renewable Energy Law in 2006, which created the first national framework for the promotion of renewable energy, The Rooftop Subsidy Program, and the Golden Sun Demonstration Program of 2009, provided subsidies for rooftop systems and the supply of critical components of solar panels. Recently, the first national FIT scheme for solar cell development, enacted in 2012, aimed to support China’s industry by providing a guaranteed, above-market price for producers.[114] These measures were introduced to boost domestic PV production and reduce China’s reliance on international markets for solar industry needs amidst escalating trade tensions.[115]
In total, China’s share of global solar panel exports grew from just 5 percent in the mid-2000s to 67 percent today, with Chinese solar output turbocharged by at least $42 billion of subsidies from 2010 to 2012 alone.[116] This instigated a global glut that saw world prices for solar panels crash by 80 percent from 2008 to 2013, bankrupting most of the more-innovative foreign competitors and setting up Chinese producers for a final coup de grace: using their government-enabled profits to try to buy bankrupt U.S. solar firms in order to strip out their remaining technology and send it back to China.[117] Indeed, the decimation of PV manufacturing outside China drove many innovative firms out of the business, in large part because they could not match the predatory prices offered by government-subsidized Chinese competitors.[118] As Ben Santarris of SolarWorld, a German solar panel manufacturer, explained, “Pervasive and all-encompassing Chinese subsidies are decimating our industry.”[119]
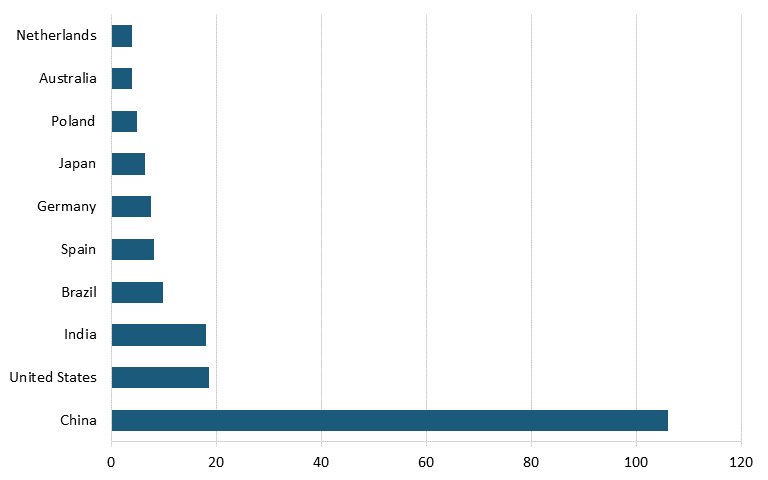
According to the Renewables 2023 Global Status Report, Energy Supply Module, in 2022, China had nearly three times the solar cell capacity of the United States. (See figure 10.) China also led the world in solar cell capacity installation in 2022, installing more than five times as much solar cell capacity as did the United States. (See figure 11.)
Figure 10: Cumulative solar PV capacity globally in 2022, by country (GW)[120]
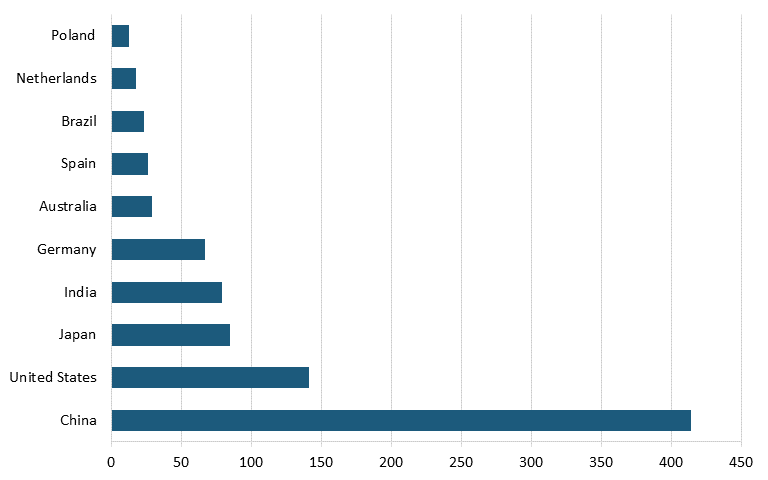
Figure 11: Top countries based on new solar PV capacity additions in 2022 (GW)[121]
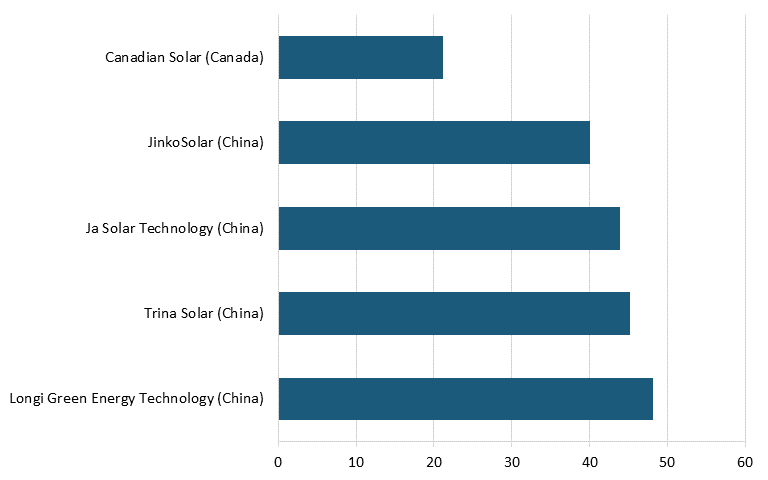
Based on survey data from Energy Digital, as of 2023, the largest solar panel power plants in the world were located in China, India, Egypt, and the United Arab Emirates. As of 2022, the top five PV module manufacturers in the world by production were Chinese companies Longi Green Energy Technology, Trina Solar, Ja Solar Technology, and JinkoSolar, followed by Canada-based Canadian Solar (See figure 12.)[122]
Figure 12: Leading solar companies based on production, 2022 (GW)[123]
According to the U.S. Energy Information Administration (EIA), China controls over 80 percent of the global solar panel supply chain and has the world’s top 10 suppliers of solar cell manufacturing equipment.[124] While the United States has critical raw materials for solar panels, it lacks manufacturing capacity. As of 2021, the United States was the top exporter of silica sand ($476 million), the primary mineral used for solar generation, and China was the world’s largest importer.[125] To regain competitiveness in the solar panel industry, the U.S. government has recently prioritized building up its supply chain.
The U.S. Solar Panel Industry Today
The Inflation Reduction Act (IRA), enacted in August 2022, seeks to expedite the shift toward clean energy, committing $370 billion in tax incentives and procurement funding for such programs.[126] The act could serve as a catalyst for the U.S. solar panel industry, as it contains incentives to boost solar panel installations and tax credits for manufacturing solar components in the United States. It includes a 30 percent tax credit for renewable energy facilities such as solar and wind farms, and an additional 10 percent for the use of domestic content.[127] The Solar Energy Industries Association (SEIA) states that the IRA has had a profound impact on America’s domestic solar industry.[128] Since its passage, domestic companies have made over $100 billion in new private sector investments, with 51 new solar manufacturing facilities announced or expanded, constituting 155 gigawatts (GW) of new production capacity.[129] First Solar, America’s top solar panel manufacturer, has pledged $1.2 billion to increase its domestic manufacturing capacity, creating hundreds of domestic jobs.[130] SEIA forecasts that over the next decade, the IRA will lead to 48 percent more solar deployment than what would be expected in the absence of the IRA.[131]
In May 2023, the DOE announced $26 million through the Bipartisan Infrastructure Law to support eight projects that seek to demonstrate how solar, wind, and other clean energy sources can support a reliable and resilient clean energy power grid. For example, The Portland General Electric Company received $4.5 million for a project to develop the first center to combine solar, wind, and energy storage systems in one location.[132] More generally, DOE, through its Solar Energy Technologies Office (SETO), has played an important role in supporting efforts to integrate more solar energy into the grid, enhance the use and storage of solar energy, and lower solar electricity costs.[133]
In 2011, SETO launched the SunShot Initiative seeking to make solar-generated electricity cost competitive with conventional energy sources by 2020. SETO has invested hundreds of millions of dollars in projects to reduce this cost. A 2014 SETO report shows that the projects in the SETO solar cell portfolio represent a $200 million investment in areas such as next-generation PVs, PV efficiency, and cross-cutting PV efforts.[134] SunShot achieved its original cost targets in 2017, three years early. Its success led the DOE to renew the program, with novel targets proposed for 2030, and renewed support for efforts by companies, universities, and national labs to make solar electricity affordable. Achieving the 2030 goals could position solar energy as one of the most economical sources of electricity in much of the United States, accounting for 30 to 50 percent of the country’s electricity supply as part of the Biden administration’s “100% Clean Energy by 2035” target.[135] Such measures undertaken by the U.S government aim to restore lost domestic competitiveness in the solar panel industry.
The U.S. Chemical Industry
As Thomas Ilgen wrote in the early 1980s, the chemical industry is “the handmaiden of other sectors, ‘industry’s industry,’ improving products or discovering substitutes and helping to develop better manufacturing processes.”[136] The industry has supplied numerous sectors, including textiles, agriculture and food, construction, automobiles, and pharmaceuticals. Top companies in the global chemical industry, such as Hoechst, BASF, Bayer, DuPont, Imperial Chemical Industries, and Rhone-Poulenc, produce thousands of products.
The Rise of the U.S. Chemical Industry
Advances in the chemical industry historically occurred primarily during wartime, due to pressing needs for chemical substitutes. These include the production of gunpowder, synthetic dyes, and synthetic rubber.[137] Prior to World War I (WWI), the United States had depended on Germany for organic chemicals, especially dyestuffs. But when Germany stopped shipments in 1914, American companies began production. Throughout the 1930s, American chemical companies, including Union Carbide, Allied Chemical, and DuPont, specialized around distinct processing technologies, being each other’s best customers.[138]
But when the Japanese cut off America’s supply of natural rubber during WWII, the U.S. government committed extensive support to the development of synthetic rubber substitutes, including an assured market and funding to build plants, and most chemical companies pivoted to polymer production. Historian John Kenly Smith, Jr., noted, “The chemical equivalent of the Manhattan Project was the wartime creation of an American synthetic-rubber industry. In America there was no incentive for developing a general-purpose synthetic rubber; until the Japanese shut off the flow of natural rubber, there was plenty of it.”[139] Government support during the development and commercialization stages was critical for the industry’s advances in petrochemistry and the development of polymer technology, which had applications to radar and nuclear fission.[140]
Advances in the chemical industry historically occurred primarily during wartime, due to pressing needs for chemical substitutes.
Kenly Smith, Jr., added, “In technologically centered industries the capital required, the financial risks, and the technological expertise necessary to produce some innovations are so great that not even the largest firms have sufficient resources to undertake the task alone. During the war the U.S. government removed the obstacles to technological change by providing capital, buying the products, and promoting cooperation between companies.”[141] After WWII, polymers derived from petrochemicals emerged as the driving force behind the chemical industry’s growth, and polymer knowledge diffused through the industry through collaborative wartime projects. In the 1940s, the chemical industry doubled its investments and tripled its sales; and in 1950, Fortune magazine declared it America’s premier industry.[142]
Environmental Regulations
The U.S. chemical industry has made vast contributions to the national and global economy, including improvements to economic growth, employment, health, living conditions, and life expectancy.[143] The chemical industry provides essential goods used in daily life and ingredients for other industries.[144]
A 1996 report by the Department of Commerce’s Office of Technology Policy observes:
The U.S. chemical industry is vital to the U.S. economy … chemicals is a keystone industry, one critical to the global competitiveness of other U.S. industries. Because so many modern products depend on chemicals, the international competitiveness of other U.S. industries requires a high-tech, globally competitive U.S. chemical industry that can supply new products at prices that give U.S. producers an edge … [The 70,000 products produced by the industry] range from … chemicals such as benzene, toluene, and chlorine that are vital to other production, to finished consumer products such as medicines, soap, and toothpaste that are seldom associated with the chemical industry.[145]
At the same time, chemical manufacturing processes also emit substances that can harm the environment, meaning the industry creates both clear benefits and also potential health and environmental challenges.[146] In the 1970s, environmental consciousness grew in the United States, leading to a series of environmental measures that impacted the industry, such as limiting the release of toxic substances from the production of synthetic organic chemicals. Actions included The Clean Air Act (CAA) of 1963 and its subsequent amendments in 1970, 1977, and 1990 aimed to limit chemical discharges, especially air pollutants, from chemical plants, and the establishment of the Environmental Protection Agency (EPA) in 1970 to develop and enforce environmental regulations.[147] Stringent environmental regulations have increased compliance costs for U.S. chemical manufacturers. By 1992, the chemical industry was spending nearly 10 percent of its capital expenditures on environmental compliance, compared with an industry average of less than 2 percent.[148]
Several studies have explored the impact of environmental regulations on industrial activity. For example, since the 1977 CAA amendment, an important policy lever has been the annual designation of county air quality status, through which every county in the United States receives nonattainment or attainment status for several pollutants. Nonattainment-status counties have air concentrations of pollutants that exceed the federal standard, and industrial plants in nonattainment areas face more stringent regulatory oversight and equipment requirements.[149] A 2000 study finds that nonattainment status reduces the establishment of new plants in industries whose processes cause pollution by 40 to 50 percent, and shifts such industrial activity to attainment areas.[150]
Using comprehensive data on clean air regulations and manufacturing activity, a 2002 study shows that in the first 15 years after the amendment, nonattainment counties (relative to attainment ones) lost 590,000 jobs, $37 billion in capital stock, and $75 billion of output in pollution-intensive industries, hindering industrial activity.[151] A 2002 study further finds that, in the period between 1977 and 1994, a 10 percent increase in relative manufacturing pollution abatement costs (the cost associated with removing negative byproducts created during production) is associated with a 1.98 percent decrease in foreign direct investment in the chemical industry, suggesting that such regulations can harm the chemical industry.[152]
China’s Chemical Industry
China’s chemical industry has been growing rapidly and has been the largest in the world by revenue since 2011. Moreover, the Chinese government’s Made in China 2025 policy has prioritized several high-tech industries, including aerospace, electric vehicles (EVs), and batteries, which could lead to increased production of sophisticated chemical products. Chinese chemical companies’ R&D investments have also surged. At the same time, the industry’s development has prioritized growth over environmental concerns, but new environmental policies are seeking to restructure the chemical industry, consolidating thousands of plants currently spread across mixed urban industrial and residential areas into special chemical parks where wastewater and hazardous waste treatment equipment is centralized and shared across companies.[153]
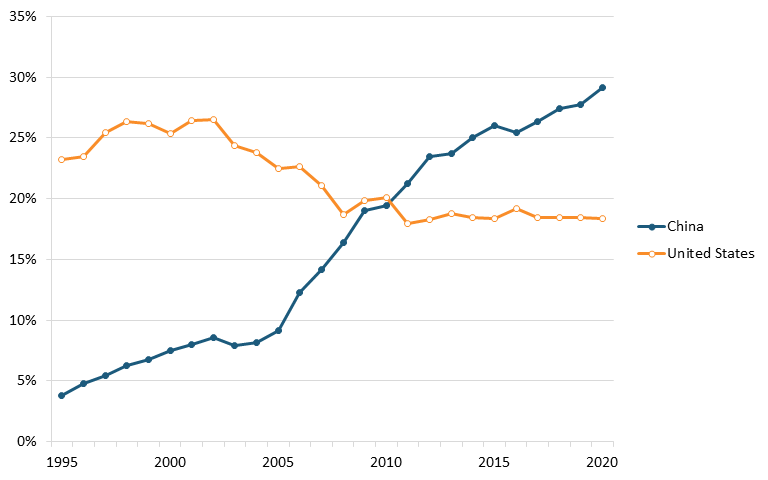
Data from ITIF’s aforementioned 2023 Hamilton Index, which ranks 40 countries on their performance across 10 advanced industries, shows that China leads the world in terms of output in the chemical industry. In 2020, China had 29.1 percent of chemicals production, substantially higher than its 3.8 percent in 1995. The United States was second, with 18.3 percent, down from 23.2 percent in 1995. (See figure 13.)[154]
Figure 13: Historical shares of global output in chemicals[155]
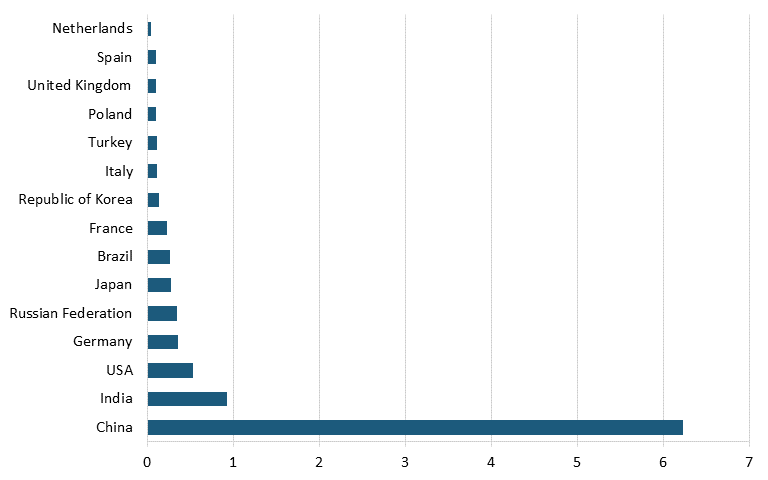
Moreover, according to data from Oxford Economics and the International Council of Chemical Associations, as of 2017, the leading countries based on chemical R&D investments were China, with $14.6 billion, followed by the United States with $12.1 billion, Japan with $6.9 billion, and Germany with $4.6 billion. (See figure 14.)[156] Further, data from the German Chemicals Industry Association (VCI) shows that the United States is also trailing China in terms of number of employees in the chemical industry. In 2022, China had nearly 12 times as many workers in the chemical sector as did the United States. (See figure 15.)[157]
Figure 14: Global chemical R&D investment by country, 2017 (billions)[158]
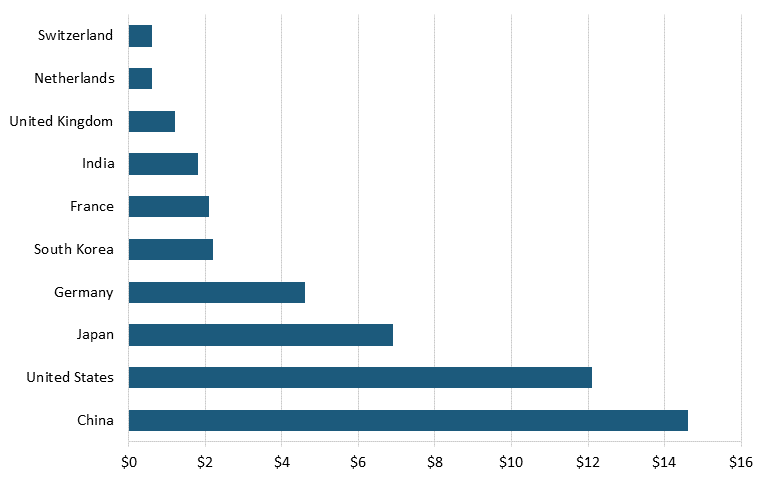
Figure 15: Number of chemical industry employees by country, 2022 (millions)[159]
The U.S. Chemical Industry Today
In May 2023, the Biden administration proposed the first new rules in decades to restrict or ban toxic chemicals widely used in chemical manufacturing processes.[160] The reforms seek to expand EPA’s authority to regulate toxic chemicals, initially granted under the 1976 Toxic Substances Control Act (TSCA). The act had sought to regulate chemicals of significant environmental concern, but was widely seen to have failed to meet its goals of assessing and controlling such chemicals, and of motivating industry investment in cleaner technologies.[161]
The proposed reforms constitute a challenging tradeoff between the Biden administration’s economic and public health objectives, as many of the chemicals identified are critical in industries such as semiconductors and EVs, the very industries the Biden administration is supporting through other policies to uphold U.S. competitiveness and national security.
Semiconductor and EV manufacturers argue that the repercussions of the new restrictions could cripple these advanced industries. In a letter to EPA objecting to the proposed rules, American battery manufacturer Eagle Pitcher, which specializes in batteries essential for military, space, and medical uses, claims that the new rules would significantly disrupt national security, the economy, and critical infrastructure.[162]
As the above case studies document, U.S. leadership eroded in several important industries since the 1960s. Among the reasons for this loss, a common thread is that American policymakers took an overly laissez-faire approach, often leaving industries to the free market alone without providing adequate policy support, such as protecting them from foreign predatory trade practices, recognizing they require scale to compete in global markets, investing in their innovation potential, or supporting them with R&D funding. It is imperative for the United States not to repeat similar mistakes with the biopharmaceutical industry, but instead to create a supportive policy environment that upholds the sector’s competitiveness.
The U.S. Biopharmaceutical Industry
The biopharmaceutical industry represents a key traded sector in the U.S. economy, employing 1,233,300 workers at significantly higher wages than the U.S. average.[163] While the United States stands as a global leader in this sector, this leadership is at risk without a more supportive domestic policy environment amidst robust foreign competition.
New Drugs
America’s new drug development has been substantially higher than that of the rest of the world. While biopharmaceutical R&D, scientific publications, and patents represent starting points, the real test of nations’ and enterprises’ investments is whether they translate into new-to-the-world drugs.
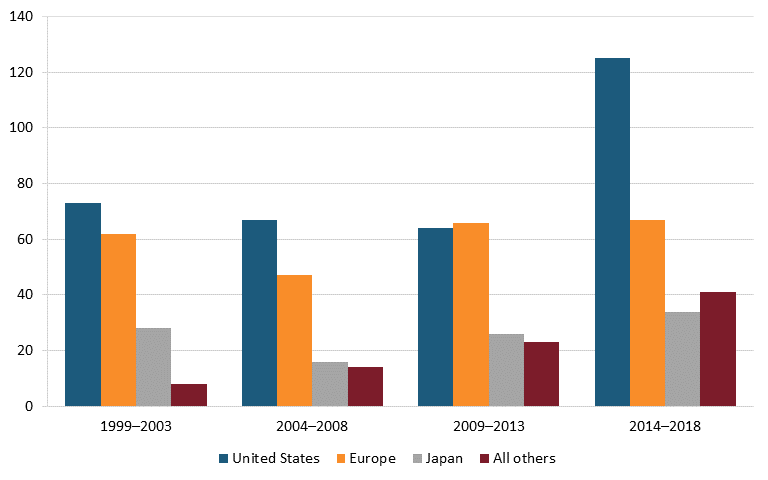
On this score, the United States excels, with a growing lead over Europe and Japan. From 2014 to 2018, U.S.-headquartered enterprises produced almost twice as many new chemical or biological entities as European ones, and nearly four times as many as Japan. (See figure 16.) However, at least in percentage terms, new drugs from other nations, such as China, have been growing even faster (albeit from a smaller base).
Figure 16: Number of new chemical or biological entities[164]
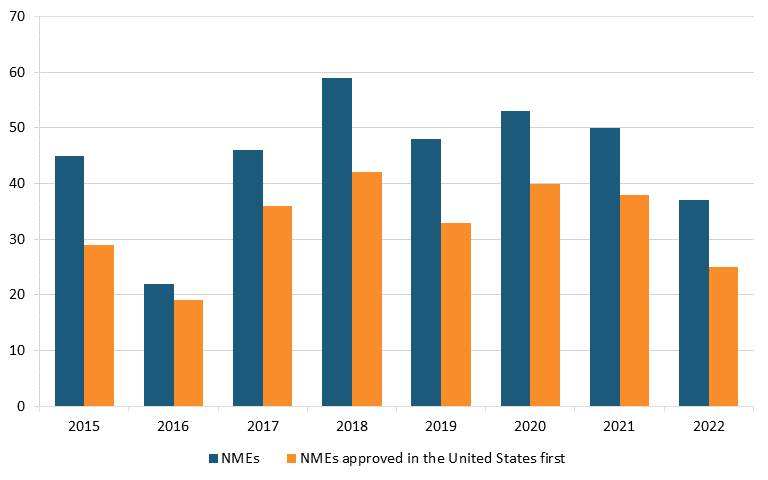
The United States also leads in drug availability. Most new molecular entities (NMEs)—novel active ingredients—approved by the U.S. Food and Drug Association (FDA) between 2015 and 2021 were approved in the United States before other countries (74 percent on average across these years). (See figure 17.)[165]
Figure 17: Annual total NME approvals, and approvals in United States, before other countries, 2015–2022[166]
The FDA has developed different regulatory-approval pathways over time in an effort to expedite biopharmaceutical innovation. In 1983, the Orphan Drug Act introduced the first such designation, orphan status, to support the development of treatments for rare diseases. In 1988, in the wake of the AIDS epidemic, the fast track designation was introduced to speed up drug development for serious diseases. In 1992, the Prescription Drug User Fee Act (PDUFA) created the accelerated category to expedite approval by substituting surrogate endpoints (e.g., tumor size) for clinical endpoints (e.g., death). The PDUFA also developed a two-tiered review time system: standard and priority review. In 2012, the Food and Drug Administration Safety and Innovation Act (FDASIA) created the breakthrough label for drugs whose preliminary evidence suggests they represent a substantial improvement over existing therapeutics.[167] The rationale for these pathways was to expedite the availability of medicines that treat serious conditions and respond to significant unmet medical need.
Research shows that out of the 312 NMEs approved between 2002 and 2013, 174 (56 percent) used at least one pathway to expedite development and review, and many drugs used multiple pathways.[168] The priority review program is also associated with a decrease in drug review times, from more than 30 months in the 1980s to 9.9 months in 2011.[169] These findings suggest that these new approval pathways have substantially reduced drug development and approval times.
China’s Challenge to the U.S. Biopharmaceutical Industry
Pharmaceutical Production
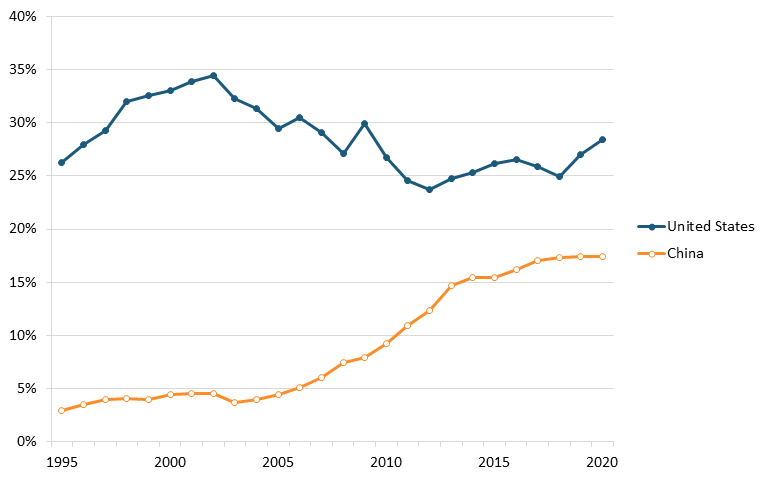
ITIF’s 2023 Hamilton Index shows that the global biopharmaceutical industry experienced a 223 percent growth from 1995 to 2020 in nominal U.S. dollars, compared with 174 percent for global gross domestic product (GDP).[170] The report finds that the United States ranks first in the world for pharmaceutical production (28.4 percent of global production), followed by China with 17.4 percent. But while U.S. pharmaceutical companies, including Amgen, Eli Lilly, Johnson & Johnson, Merck, and Pfizer, are world leaders, China’s industry is growing rapidly. From 1995 to 2020, China’s global share of the industry increased 14.4 percentage points, compared with the United States’ 2.2 percentage point increase. (See figure 18.)[171]
Figure 18: Global shares of value-added output in pharmaceuticals, 1995–2020[172]
API Manufacturing
Moreover, the United States has also been losing domestic pharmaceutical manufacturing capacity, particularly for manufacturers of active pharmaceutical ingredients (APIs), the components in medications that are biologically active, directly contributing to the therapeutic effects used to treat, diagnose, or prevent diseases.[173] As in the case of other industries, production subsidies, cheaper labor, and less-stringent environmental regulations have attracted API manufacturers to build plants overseas.
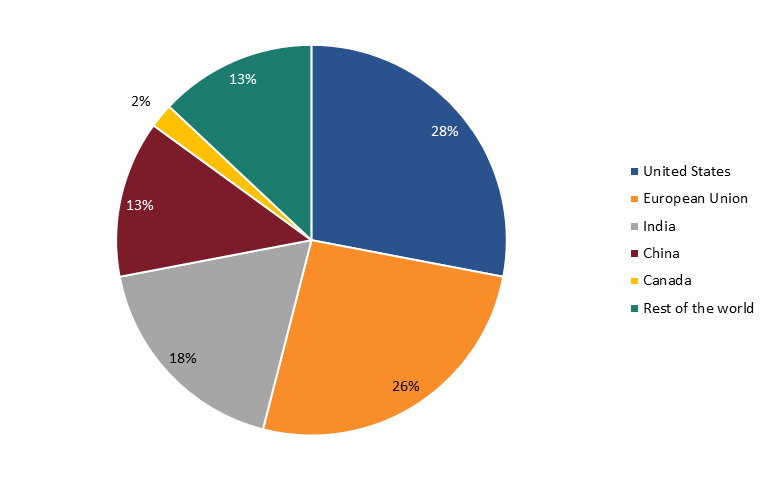
Data from the FDA shows that in 2019, only 28 percent of API manufacturers were in the United States, while 72 percent were overseas—with 13 percent in China. (See figure 19.) Heavy dependence on foreign sourcing for critical ingredients can leave American pharmaceutical companies exposed to supply disruptions and quality control problems that could put the United States at risk of drug shortages.[174]
Figure 19: API manufacturers for U.S. pharmaceutical market by location, 2019[175]
Out of the 461 drugs listed in the 2019 World Health Organization’s (WHO’s) Essential Medicines List, FDA data further shows that 1,079 API manufacturers worldwide make these drugs, with 15 percent in China, 21 percent in the United States, and 64 percent in the rest of the world. Three essential medicines have API manufacturers that are all based in China. In congressional testimony in October 2019, Dr. Janet Woodcock, director of the Center for Drug Evaluation and Research (CDER) at the FDA, explained how the agency is supporting the growth of advanced manufacturing (innovative technologies) to reduce U.S. dependence on overseas manufacturers, improve the resilience of American manufacturing, and mitigate the potential risk of drug shortages in the United States.[176]
In 2020, the Biden administration directed the FDA to identify an “Essential Medicines” list. The FDA selected drugs “that are medically necessary to have available in adequate supply which can be used for the widest populations to have the greatest potential impact on public health.”[177] In September 2022, the administration announced new investments to support the resilience of domestic pharmaceutical manufacturing, committing $40 million to expand the role of advanced manufacturing, namely, biomanufacturing—the use of biological systems to produce drugs—to support domestic production of APIs, antibiotics, and other critical materials needed to produce essential medications.[178] In November 2023, the administration took further measures to reduce reliance on high-risk foreign suppliers by invoking the use of the Defense Production Act to expand the Department of Health and Human Services’ (HHS’s) authority to invest in domestic manufacturing of essential medicines. HHS will commit $35 million to efforts to bolster the strength of the domestic supply chain for essential medicines.[179]
Value Added
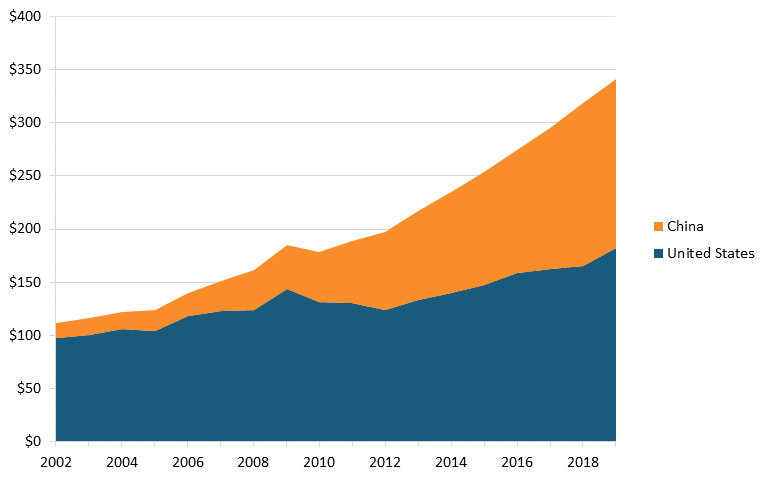
The global value added of the pharmaceutical industry increased 156 percent between 2002 and 2019. Some of the global increase reflects the growth of domestic markets and associated production in developing nations. Notably, Chinese value added grew almost 11 times, from roughly $14 billion to $158 billion, while U.S. value added grew nearly 2 times, from $97 billion to $182 billion. (See figure 20.)
Figure 20: Value-added output of pharmaceutical industry by region, 2002–2019 (billions, constant dollars)[180]
Patenting
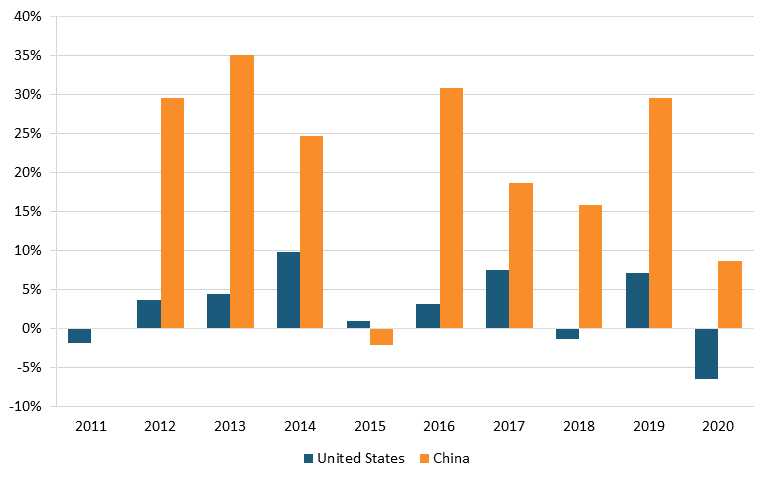
Data from the NSF Science & Engineering Indicators report show that in 2020, the United States held 4,667 pharmaceutical patents and 3,251 biotechnology patents, compared with China’s 413 and 238 patents, respectively. These figures suggest that the United States had more than 10 times as many patents as China did in 2020. However, from 2011 to 2020, China’s growth rate in patenting far surpassed the U.S. rate. During that time, China had a 22.2 percent increase in pharmaceutical patents (versus America’s 4 percent increase) and a 19.1 percent in biotechnology (compared with America’s 2.6 percent). (See figure 21 and figure 22.)
Figure 21: Annual change in U.S. & Chinese United States Patent and Trademark Office (USPTO) utility patents granted in pharmaceuticals[181]
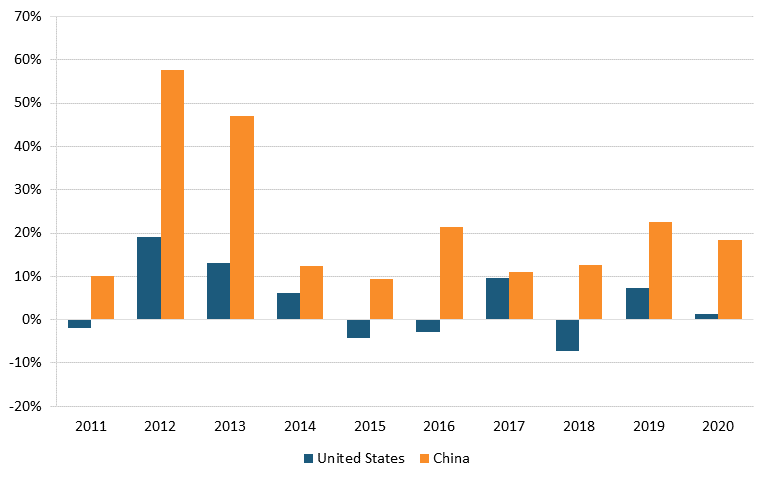
Figure 22: Annual change in U.S. & Chinese USPTO utility patents granted in biotechnology[182]
Drug Development
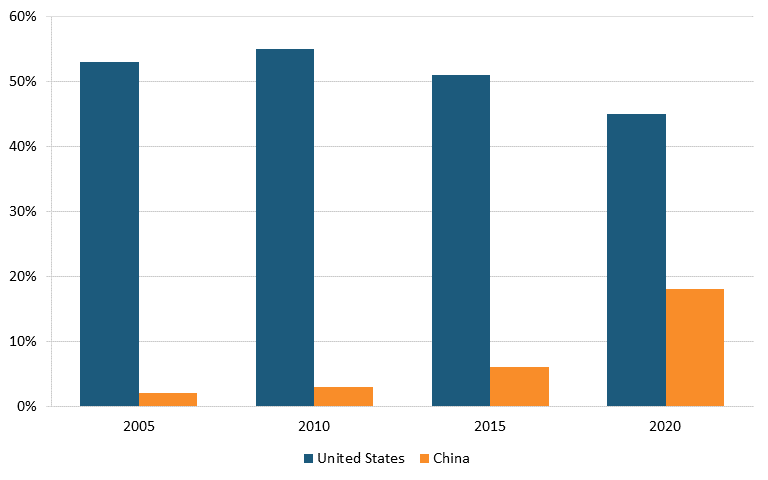
According to IQVIA data, in 2020, drugs from U.S. biopharma companies represented 42 percent of the entire early-stage drug pipeline, down from 47 percent in 2010, while the share of drugs originating from Chinese pharma companies increased from 2 to 10 percent over the same time period. (See figure 23.) In oncology, the share of drugs in the early-stage pipeline from U.S. companies decreased from 55 to 45 percent between 2010 and 2020, while this figure increased from 3 to 18 percent for Chinese-produced drugs. (See figure 24.)[183]
Figure 23: Shares of new drugs under development, by select region, 2005–2020[184]
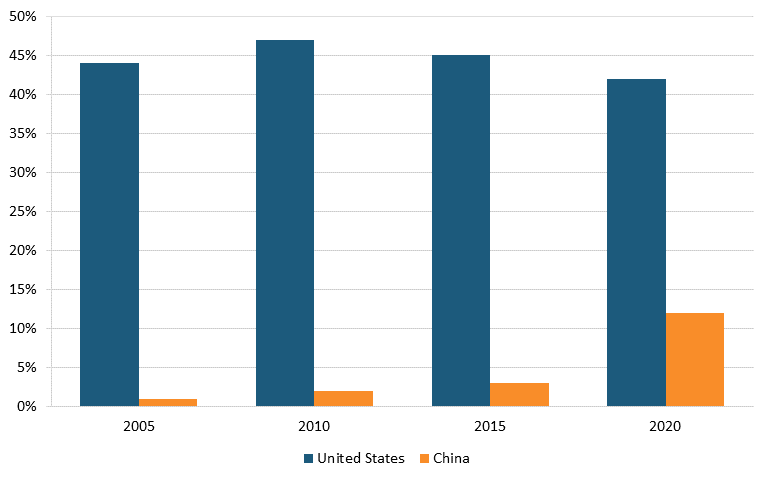
Figure 24: Shares of new oncology drugs under development, by select region, 2005–2020[185]
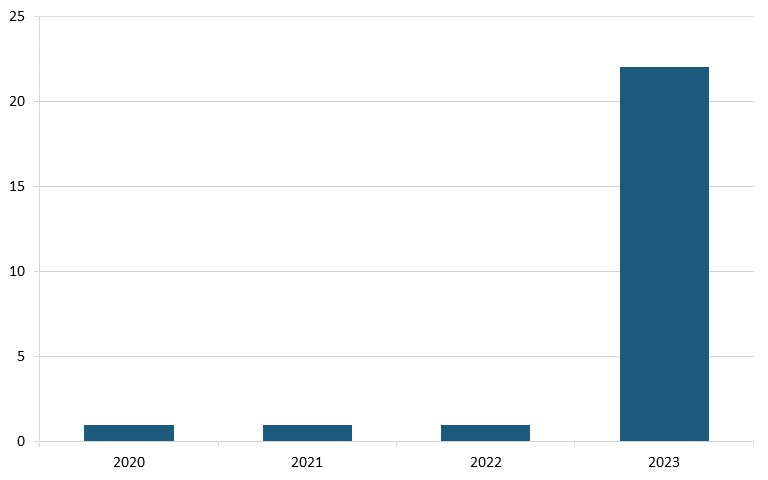
And in Alzheimer’s disease, analysis from Vital Transformation, a health care economics consultancy, shows there were 23 Chinese clinical trials in 2023, a sharp increase from just one in each of the three years prior. (See figure 25.)[186]
Figure 25: Alzheimer’s disease clinical trials originating from Chinese pharma companies, 2020–2023 (count)[187]
Trade Balance
According to trade data from the U.S. Census Bureau, between 2010 and 2022, America’s trade deficit in the biopharmaceutical industry grew significantly, from $37.2 billion in 2010 to billion in 2022. (See figure 26.) During the same period, America’s trade deficit with China also worsened, from $959 million to $4.07 billion. (See figure 27.) A 2020 ITIF report argues that there are a number of likely reasons for the poor U.S. trade performance, including low wages in certain countries such as India and China, strong national manufacturing and engineering systems in developed countries such as Switzerland and Germany, and price controls by other countries on pharmaceuticals, which lead to mismeasurement of the value of exports and imports, since countries imposing price controls on drugs are likely to lead American companies to value exported drugs at the lower prices constrained by those policies.[188]
Figures 26 and 27 indicate that while the United States is currently a global leader in the biopharmaceutical industry, China’s domestic sector has accelerated rapidly in recent years, presenting a growing competitive threat to U.S. leadership at a time when the U.S. policy environment supporting the sector is weakening. Without a more supportive policy environment, the U.S. biopharmaceutical industry could follow the downward trends previously seen in the telecommunications equipment, semiconductor, television, solar panels, and chemicals industries. If this were to happen, policymakers might need to pass a DRUGS Act (similar to the CHIPS Act) several decades from now to restore U.S. leadership in the sector. That’s certainly a situation the United States should never find itself in, but it did in semiconductors—and if the country continues to weaken its policy environment supporting life-sciences innovation, then it’s certainly not inconceivable it could happen again.
Figure 26: U.S. global trade balance in pharmaceutical manufacturing, 2010–2022 (billions)[189]
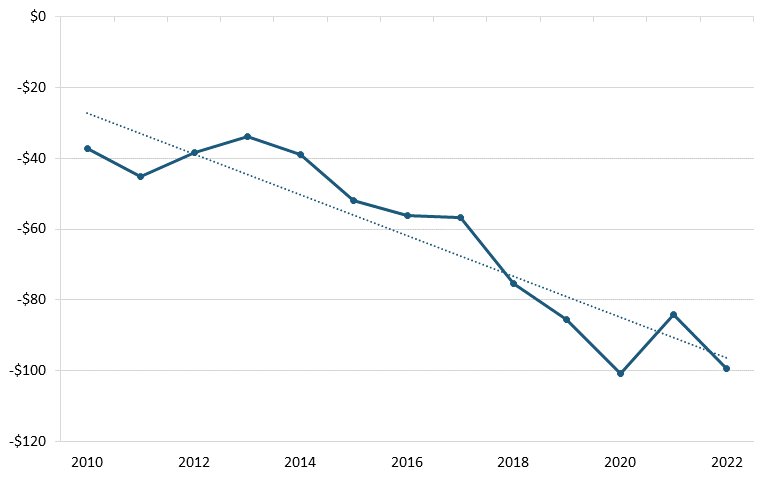
Figure 27: U.S. trade balance with China in pharmaceutical manufacturing, 2010–2022 (billions)[190]
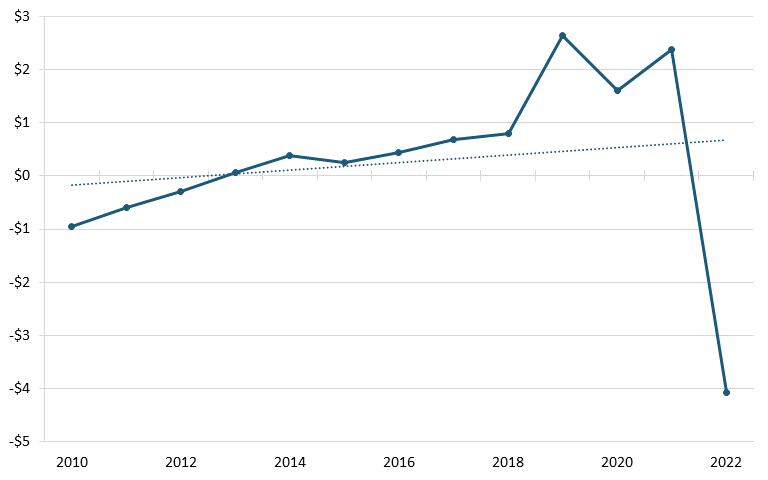
Reasons for U.S. Biopharmaceuticals Leadership
Besides the large size of the U.S. domestic market, which accounts for 42 percent of global drug sales, a number of other factors have contributed to America becoming the world’s leader in biopharmaceutical innovation.
Strong Institutions
One reason is the existence of many strong research universities and institutions such as the National Institutes of Health (NIH) to support their scientists. With a nearly $48 billion budget in 2022, up from $11 billion in 1996, NIH supports 300,000 scientists at more than 2,500 universities, medical schools, and other research institutions in every state in its mission to “foster fundamental creative discoveries, innovative research strategies, and their applications as a basis for ultimately protecting and improving health.”[191] Moreover, the Advanced Research Projects Agency for Health (ARPA-H), an independent entity within NIH with a current budget of $1.5 billion, was founded in 2022 to “accelerate better health outcomes for everyone by supporting the development of high-impact solutions to society’s most challenging health problems” by supporting scientists who are developing completely new ways to tackle some of the toughest health challenges.[192]
Pharmaceutical Legislation
Other policies favorable to the U.S. biopharmaceutical industry include the Orphan Drug Act, enacted in 1983, and the Prescription Drug User Fee Act (PDUFA) of 1992 (and its subsequent reauthorizations). The Orphan Drug Act aimed to incentivize the development of drugs for rare diseases, which may not be economically viable without special incentives, through benefits such as tax credits, grants, and market exclusivity to pharmaceutical companies that develop and bring to market drugs for these rare diseases.[193] From 1983 to 2022, there were 1,122 approvals of orphan-designated products, including new molecules, indication, and formulation approvals.[194]
The passage of PDUFA in 1992 specified performance goals for the FDA in the form of quicker drug application review times in exchange for authorizing the FDA to collect fees from drug manufacturers to enhance resources that would expedite the review process. A 2005 study finds that PDUFA substantially accelerated the FDA’s drug review process. Instead of a counterfactual 16 percent reduction in approval times in the absence of PDUFA from 24.2 to 20.4 months, approval times decreased 42 percent, from 24.2 to 14.2 months, between 1991 and 2002. Therefore, PDUFA accounted for approximately 62 percent of the decline during this period.[195]
In addition, the U.S. market has a robust IP protection regime and historically limited drug government drug price regulation, which have also spurred domestic pharmaceutical innovation and greater availability of medicines for patients in the United States.[196]
Robust IP Protection Regime
The drug development and approval process is expensive, lengthy, and risky.[197] According to a recent study, it costs $2.6 billion to develop a new drug.[198] Drug development also takes 10–15 years, and few drugs ever reach the market. A pharmaceutical company developing a new drug incurs the full costs of R&D, but it often does not capture the full benefits because as soon as the new drug is released, other firms can quickly replicate it. The existence of such knowledge spillovers means that incentives need to be created for a pharmaceutical company to invest in the necessary R&D to create a drug in the first place. To encourage socially desirable levels of R&D, a commonly used policy tool is patent protection.[199]
Patents, a form of IP protection, grant exclusive rights to commercialization of an invention for a specific period, typically 20 years. In the pharmaceutical industry, where drug development is lengthy and costly, patents are especially important to stimulate R&D investments. Patents enable pharmaceutical companies to recover their R&D investments and generate profits to sustain future R&D efforts.[200]
Using data from the Carnegie Mellon Survey on Industrial R&D, a 2008 study provides evidence that patent protection leads to higher private returns on R&D, which in turn stimulates future R&D investments in the pharmaceutical industry.[201] Another study of 60 countries from 2000 to 2013 finds that patents are associated with earlier release of new drugs.[202] And a third study using data on the launches of 642 drugs in 76 countries from 1983 to 2002 finds that a higher length and strength of patent protection significantly accelerates drug diffusion, spurring market entry in high-income countries.[203] It also appears that IP protection on research tools in biomedical innovation seldom hinders the pursuit of scientifically promising projects, meaning that patents do not impede future innovation.[204]
A paper in the American Economic Review studying cancer clinical trial investments reveals that lags in commercialization tend to cause pharmaceutical R&D investments to be redirected away from drugs targeting early-stage cancers. There are more incentives to focus on the development of late-stage, rather than early-stage, cancer drugs due to shorter clinical trials for late-stage drugs and the fixed-term nature of the patent system, which provides a longer effective patent protection for drugs with a shorter time between invention and commercialization. While patents provide a fixed period of market exclusivity, “since in many industries firms file patents at the time of discovery (‘invention’) rather than first sale (‘commercialization’), effective patent terms vary: inventions that commercialize at the time of invention receive a full patent term, whereas inventions that have a long time lag between invention and commercialization receive substantially reduced—or in extreme cases, zero—effective patent terms.”[205] Since it takes a longer time for early-stage cancer drugs to reach the market, their effective patent terms are shorter than those of late-stage drugs, so this combination of clinical trial length and patent system design may under-incentivize longer projects. To stimulate more long-term cancer research, the authors endorse: 1) policies to allow pharmaceutical companies to rely on surrogate endpoints in clinical trials, 2) a restructuring of the patent system to start the clock at commercialization (i.e., time of FDA approval rather than time of invention), and 3) R&D subsidies for projects with long commercialization lags.[206]
Moreover, unclear patent subject matter eligibility is a challenge for the U.S. life sciences innovation system. A recent study shows that although 17,743 patent applications were rejected in the United States as ineligible for patent protection, 1,694 of those were granted by the European Patent Office, by China, or both. This suggests that U.S. courts have been interpreting patent subject matter eligibility more narrowly than other countries.[207] Therefore, as it considers patent reform, Congress should make clearer that innovative diagnostic and screening tools in the life sciences arena should be viewed as novel and patentable.
Limited Drug Price Regulations
There is an inherent linkage between biopharmaceutical companies’ ability to earn profits and their ability to invest in R&D toward future generations of innovation. Indeed, just like in the semiconductor industry, where the profits from the 10 nm chip line beget the revenues to invest in 7 nm and then 5 and 3 nm chips, the profits from a cholesterol drug, for instance, beget the revenues to invest in solutions for challenges at the forefront of biomedical innovation and the next generation of cures, for diseases such as pancreatic cancer, Alzheimer’s disease, or COVID‑19.
This is why, as Joe Kennedy wrote in the ITIF report “The Link Between Drug Prices and Research on the Next Generation of Cures,” most academic assessments find strong links between industry returns and R&D investments.[208] For instance, academic research shows a statistically significant relationship between a biopharma enterprise’s profits from the previous year and its R&D expenditures in the current year.[209] Likewise, Gambardella found that sales revenue from previous periods has a significant, positive impact on current-period biopharma R&D.[210] Henderson and Cockburn found that the pharmaceutical firms with the greatest sales are also the ones with the largest R&D investments.[211] Dubois et al. made this dynamic quite evident, finding that every $2.5 billion of additional biopharmaceutical revenue leads to one new drug approval.[212]
The pharmaceutical market in the United States has historically been characterized by limited price regulations set by the government, instead relying on private sector mechanisms. Rather than centrally determined, drug prices in the United States are determined by market forces, competition, and the negotiation between drug developers and various purchasers. Other countries, including Canada, England, and EU members have instituted processes or agencies to impose drug price limits, which contribute to delays in the availability of new drugs in those markets. A recent report from the Fraser Institute finds that drugs are approved an average of 15 months later in Canada than in the United States.[213] A study by the Galen Institute shows that out of 290 new drugs released between 2011 and 2018, 89 percent were available in the United States, compared with 62 percent in Germany and 48 percent in France and Switzerland. A 2016 paper provides further evidence that strong or even moderate price regulation dissuades pharmaceutical entry into a market. The analysis also finds that new drugs launch much more quickly in countries with health policy institutions that promote drug availability, especially those that adopt WHO’s Essential Drug List and those that have a national formulary.[214]
If the United States were to impose drug price controls of similar magnitude to those in Europe, pharmaceutical companies would reduce R&D investments, leading to fewer important treatments and cures being invented. Research shows that the long-term societal costs of those lost drugs outweigh the short-term benefits of reduced drug prices. A study published in Pharmacoeconomics shows that EU price controls have reduced European pharmaceutical firms’ R&D investments compared with American companies, resulting in 46 fewer new drugs and 1,680 fewer research jobs in the EU between 1986 and 2004. Estimates show that had the United States adopted similar price controls, it would have cost the United States 117 new drugs and 4,368 research jobs.[215] Moreover, a study in Health Affairs estimates that such a measure would hurt future generations of Americans and cost the United States $8 trillion.[216]
Recently Proposed Damaging Policy Changes
While policies such as a robust IP protection regime and the general absence of government-imposed price controls have encouraged U.S. biopharmaceutical innovation, recent proposed measures to dictate drug prices and weaken IP protection risk hurting American innovation and leadership in this industry. The motivation for these policies is a desire for cheaper drugs in the United States and abroad. But these particular measures suggest either that policymakers do not value U.S. biopharmaceuticals competitiveness or they are unaware that the measures will hurt this position. Such policies contrast with a coherent industry advancement strategy. For example, if the CHIPS Act were to also come with rules to reduce patent length on U.S. semiconductors and price regulations, it would suggest that the act helps with one hand and hurts with the other. But in the case of biopharmaceuticals, the proposed policies hurt with one hand and do nothing with the other.
Drug Price Controls
Policymakers in the United States have been under increasing pressure to make health care more affordable for the American public, triggering fervent debates about the best ways to do so. At the core of these discussions lies a trade-off between providing affordable drugs to the current generation and ensuring access to new drugs for future generations of Americans.[217] While medicines account for just 14 percent of national health care spending, proponents of drug price controls argue that consumers need to be protected from rising drug prices.[218] This argument ignores that drug prices after discounts and rebates, which do not go to the developers of innovative medicines, have decreased for years, but discounts are rarely passed on to patients, going instead to middlemen such as pharmacy benefits managers owned by insurance companies. A 2023 ITIF report shows that the share of each dollar spent in the United States on drugs going to manufacturers declined over 17 percentage points from 2013 to 2020, from 66.8 to 49.5 percent, as middlemen in the supply chain captured a greater share of revenues.[219] To the extent that policymakers wish to meaningfully lower spending, they need to consider the costs that are introduced by all actors across the pharmaceutical supply chain and compare the nature of profits in all relevant health care subsectors.
In January 2024, the FDA approved Florida’s “first-in-the-nation” plan to import prescription drugs from Canada, where prices are lower, and other states are also seeking FDA approval to purchase medicines in bulk from Canadian wholesalers. Aside from logistical and supply challenges, importing drugs from other countries because of cheaper prices also implies importing those countries’ price controls, which may signal race to the lowest price and fewer innovation incentives.[220]
In August 2022, Congress passed the IRA, the first law in American history to grant the Centers for Medicare & Medicaid Services the ability to control the prices of certain drugs. In August 2023, Medicare released a list of the first 10 drugs to become subject to price negotiations. The drugs target a wide range of diseases, including diabetes, heart disease, and cancer.[221]
Studies show that such regulations can harm the development of important treatments and cures in the long run. A 2021 University of Chicago paper estimates that the impact of price controls proposed by the IRA would result in a 45 percent decrease in pharmaceutical R&D between 2021 and 2039, 254 fewer new drugs, and a loss of life in the next decade that is 20 times larger than that from COVID-19 in the United States between March 2020 and September 2021.[222]
When RAND studied the effects of different approaches to price regulation on consumer costs and life expectancy, it found that price controls that reduce pharmaceutical company revenues by 20 percent result in a negative long-term per capita net present value (as measured by the monetary value of life expectancy minus the value of medical and drug spending). The report argues that decreasing patient copayments without reducing pharmaceutical revenues would better serve both current and future generations. Simulations show that a 20 percent copay reduction financed by the government has a positive net lifetime value of $32,000 for each American by 2060, compared with a cost of $51,000 under the price control scenario. The analysis concludes that imposing price controls offers modest benefits to the current generation but potentially very high costs to future ones, while copayment-reduction strategies are a better alternative.[223] To support continued biopharmaceutical innovation, the United States should explore strategies other than price controls, such as copayment reductions.
A recent 2023 report from the U.S. Chamber of Commerce shows price controls proposed by the IRA could substantially reduce funding for clinical trials. Such trials play a pivotal role in evaluating the safety and efficacy of new drugs. A reduction in clinical trials would translate into fewer novel therapies, including for heart disease and cancer, the leading causes of death in the United States. A comparison between the United States and a sample of developed, major OECD countries with similar scientific strengths but stronger price controls reveals that the United States consistently outperforms the OECD average in terms of clinical trial activity and overall life-sciences innovation. In all phases of clinical research, the United States has an activity level 42 to 220 percent higher than the OECD average. This disparity further widens in early-phase research, where the U.S. activity level was 85 to 313 percent higher than the OECD average. The report underscores that this leadership position would be at risk if price controls were implemented in the United States. Depending on the therapeutic field, estimates show that the adoption of IRA-proposed price controls could result in a 50 percent reduction in early-phase research. Research on biologics and cancer could decrease by 59 and 54 percent, respectively, hampering life-sciences innovation and leading to fewer potentially life-saving therapeutics.[224]
COVID-19 TRIPS Patent Waiver
In addition to proposed drug price controls, a recent COVID-19 patent waiver, which the United States misguidedly permitted to be enacted by the World Trade Organization (WTO), could also deter biopharmaceutical innovation. The 1995 Agreement on Trade-Related Aspects of Intellectual Property Rights (TRIPS) is a multilateral treaty requiring WTO member nations to provide and enforce a minimum level of IP rights through patents, copyrights, and trademarks.[225] Long-running debates regarding the balance in TRIPS to promote innovation on one hand and societal objectives such as public health on the other intensified during the COVID-19 pandemic due to uneven global access to vaccines and treatments.[226]
In June 2022, following two years of negotiations, WTO members approved a five-year TRIPS patent waiver. The waiver suspended certain requirements to protect IP for COVID-19 vaccine ingredients and manufacturing processes, allowing WTO countries to use patented inventions needed for COVID-19 vaccine production without the patent right holder’s consent. A 2022 article published in Drug Discovery Today argues that IP waivers reduce innovation incentives, hinder start-up firms from securing funding, and result in fewer new drugs and medical innovations. Once a waiver goes into effect, potential imitators can acquire knowledge they can keep even if IP protection is later restored.[227]
In the long term, IP waivers can decrease innovation across many diseases, since the bases for COVID-19 vaccines, such as mRNA technology, have numerous applications beyond COVID-19. The waiver was originally meant as a short-term emergency measure to tackle the global pandemic, but since spring 2023, the WTO has been considering expanding the waiver to include COVID-19 diagnostics and therapeutics. This would cover a wide range of products and again have implications for diseases beyond COVID-19.[228] Life-sciences innovation-supporting stakeholders have argued against an expanded IP waiver, as it could threaten biopharmaceutical innovation and U.S. competitiveness.[229]
Loss of IP protections on COVID-19 vaccines and treatments could weaken pharmaceutical companies’ incentives to invest in risky technology in the future.
In December 2022, ITC, at the request of the U.S. Trade Representative, launched an analysis into COVID-19 market dynamics to inform WTO discussions on possible expansion of the waiver. Published in October 2023, the ITC report stopped short of making any recommendations, but did not find evidence that IP rights pose a barrier to access for COVID-19 diagnostics and therapeutics.[230] As of the most recent meeting of the WTO Council on TRIPS in late 2023, no decision has been reached on the waiver expansion, although observers believe a decision will be made at the 13th WTO Ministerial to be held in Abu Dhabi, United Arab Emirates, in late February 2024.
Loss of IP protections on COVID-19 vaccines and treatments could weaken pharmaceutical companies’ incentives to invest in risky technology in the future. For example, mRNA vaccine technology took decades to develop, and entailed collaboration among universities, government labs, and small and large firms (efforts incentivized by the security of IP protections). An expanded waiver would disincentivize innovation and leave the world less prepared to tackle future health challenges, including possible future pandemics.[231]
Bayh-Dole March-in Rights
In 1980, Congress enacted the Bayh-Dole Patent and Trademark Amendments Act, which created a framework for public-private collaboration. The act enabled universities to patent and license inventions that were developed with federal funding. Before 1980, the government owned such discoveries, which reduced universities’ incentives to turn them into commercial products. Universities responded to the legislation by engaging more deeply in the commercialization of university science.[232]
The Bayh-Dole Act was part of a broader shift in U.S. policy toward a more robust IP rights environment. Other initiatives included the establishment of the Court of Appeals for the Federal Circuit, a staunch advocate for patentholder rights, in 1982 and the 1980 Supreme Court decision in Diamond v. Chakrabarty, which upheld the validity of a broad patent in the fledgling biotechnology industry. Thus, the act was one of several factors that contributed to the documented growth in university patenting and licensing since 1980.[233]
The number of patents granted to universities increased from 380 in 1980 to 3,088 in 2009.[234] Between 1995 and 2015, university patent applications also surged, from roughly 2,700 to more than 15,000 per year, and university licensing income increased from $0.6 billion to $2.3 billion.[235] Further, the number of university-spawned start-ups nearly doubled, from 400 in 2001 to 760 in 2013.[236]
The Bayh-Dole Act proscribes four specific and limited instances in which the government is permitted to exercise march-in rights:[237]
1. If the contractor or assignee has not taken, or is not expected to take within a reasonable time, effective steps to achieve practical application of the subject invention
2. If action is necessary to alleviate health or safety needs not reasonably satisfied by the patent holder or its licensees
3. If action is necessary to meet requirements for public use specified by federal regulations and such requirements are not reasonably satisfied by the contractor, assignee, or licensees
4. If action is necessary, in exigent cases, because the patented product cannot be manufactured substantially in the United States[238]
In recent years, some academics and policymakers have called for the application of march-in rights to lower drug prices. Although the text and legislative history of the act do not support such an interpretation, proponents have nevertheless erroneously argued that reasonable terms include selling the invention for a reasonable price “on the basis that the public should not be charged, or should be charged less, for goods based on inventions for which the taxpayers have already paid.”[239]
However, lower prices for resulting products were simply never the rationale laid out in the act. In fact, as senators Birch Bayh and Bob Dole have themselves noted, the Bayh-Dole Act’s march-in rights were never intended to control or ensure “reasonable prices.”[240] As the two wrote in a 2002 Washington Post op-ed titled, “Our Law Helps Patients Get New Drugs Sooner,” the Bayh-Dole Act:
did not intend that government set prices on resulting products. The law makes no reference to a reasonable price that should be dictated by the government. This omission was intentional; the primary purpose of the act was to entice the private sector to seek public-private research collaboration rather than focusing on its own proprietary research.[241]
The op-ed reiterated that the price of a product or service was not a legitimate basis for the government to use march-in rights, noting:
The ability of the government to revoke a license granted under the act is not contingent on the pricing of a resulting product or tied to the profitability of a company that has commercialized a product that results in part from government-funded research. The law instructs the government to revoke such licenses only when the private industry collaborator has not successfully commercialized the invention as a product.[242]
Despite this, on December 7, 2023, the Biden administration announced a suite of proposals to reduce drug prices, one of which contemplates giving federal agencies the potential capacity to leverage Bayh-Dole march-in rights to license patent rights of drugs developed with federal funding to other manufacturers if the government deems the drugs’ prices to be too high. Commerce’s National Institute of Standards and Technology (NIST) has released a proposed framework for agencies on the use of march-in rights for products whose IP stems at least in part from federal R&D funding, including drugs. What follows is a 60-day comment period, after which NIST will finalize the guidance.[243]
Using march-in rights as a price-control mechanism would undermine partnerships among universities, federal laboratories, and private companies that have produced biopharmaceutical innovations and helped sustain American competitiveness in this sector.
A letter sent to HHS Secretary Xavier Becerra, signed by academics and private-sector experts, including the Association of American Universities and the Association of American Medical Colleges, argues that this measure is a misuse of Bayh-Dole march-in rights: “This is a misinterpretation of the law’s plain language, intent, and forty-two-year history. March-in rights are intended to assure the commercialization of government-funded inventions. The Bayh-Dole Act never mentions or suggests that pricing is a consideration or criterion as to whether a product is reasonably available to the public, nor has ‘government use’ ever been accepted to cover such a broad claim of authority under the government use license.”[244] A 2020 study argues that march-in rights should not be used as a form of drug price control as part of efforts to make health care more affordable.[245] Bayh-Dole has played an important role in spurring innovation, and the use of march-in rights to tie price to technology could disrupt this function. Moreover, march-in rights are a blunt tool that could have wide-ranging implications across an array of federally funded inventions.[246] Using march-in rights as a price-control mechanism would undermine partnerships among universities, federal laboratories, and private companies that have produced biopharmaceutical innovations and helped sustain American competitiveness in this sector.[247]
One of the Biden administration’s justifications for such new proposals to reduce drug prices is that the U.S. biopharmaceutical industry is too concentrated. However, evidence suggests that America’s biopharmaceutical industry has actually become less concentrated over time. In 2006, the top 10 U.S. drug producers accounted for 56 percent of global sales, while the top 60 U.S. producers accounted for 92 percent. By 2019, the top 10 U.S. producers accounted for 43 percent, and the top 60 accounted for 86 percent.[248] This implies that claims that America’s biopharmaceutical industry is excessively concentrated are unsubstantiated, making assertions of this rationale as the basis for policies such as the misuse of Bayh-Dole march-in rights flawed.[249] As ITIF wrote in a February 2024 comments to the National Institute of Standards and Technology, the Biden administration’s Draft Interagency Guidance Framework for Considering the Exercise of March-In Rights should be withdrawn immediately.[250]
Moreover, the biopharmaceutical industry encounters economies of scale benefits when it comes to production and commercialization. As Nobel laureate Oliver Williamson has argued, ignoring efficiencies that may result from proposed mergers in antitrust law “fail[s] to meet the basic test of economic rationality.”[251]
Williamson’s theory highlights a key tradeoff: the strategic choice between minimizing transaction costs through internal production (make) or external sourcing (buy). While vertical integration offers greater control over production processes, market mechanisms provide increased autonomy. The decision to make or buy rests on the level of asset specificity, the degree to which an asset is specialized to a particular use, limiting its potential value in alternative applications. Williamson advocates for the discretionary application of antitrust policy, tailored to individual cases based on firms’ levels of specific investments and their associated transaction costs.
In the pharmaceutical industry, which is capital and technology-intensive, organizing production under a market structure involving many small producers transacting with each other may not be economically rational. This is because the necessary R&D efforts, investments, and technology required to develop new drugs are highly specific and would lead to excessively high transaction costs. According to Williamson, in these situations, market concentration leads to cost advantages of producing in-house, leading to more efficient outcomes. It suggests that pharmaceutical companies need to have more market concentration to be able to minimize the transaction costs associated with the specific investment, development, and promotion of new drugs. Thus, a more concentrated market structure, in this case, is not only more efficient than the alternative, but also enables the development of new drugs that may otherwise never be produced due to prohibitive transaction costs.[252]Nevertheless, as noted, America’s biopharmaceutical industry is nowhere near as concentrated as other sectors, such as PBMs.
Section 1498
Some advocates and elected officials are also seeking to misuse Section 1498, claiming it gives the government a right of eminent domain in all U.S. patents and, thus, the power of compulsory licensing.[253] Section 1498 states the following:
Whenever an invention described in and covered by a patent of the United States is used or manufactured by or for the United States [by a contractor, a subcontractor, or any person, firm, or corporation for the Government and with the authorization or consent of the Government] without license of the owner thereof or lawful right to use or manufacture the same, the owner’s remedy shall be by action against the United States in the United States Court of Federal Claims for the recovery of his reasonable and entire compensation for such use and manufacture.[254]
In other words, if the government directs an entity (public or private) to manufacture or use a patented innovation for the government’s use, the patent owner can recover reasonable and entire compensation for infringement by bringing a suit in the U.S. Court of Federal Claims.
This legislation originated to stimulate the manufacturing of items needed during WWI and WWII and later to immunize contractors that manufactured patented innovations under the direction of the U.S. government for the war effort. However, Section 1498 does not grant the government unlimited eminent domain over patents. Rather, the law relinquishes the U.S. government’s sovereign immunity with respect to patented innovations used or manufactured for the government’s use. In other words, the government agrees to submit to a civil action for infringement, allowing the private citizen (i.e., the patent owner) to be adequately compensated as it would by any other infringer. Thus, the federal government must compensate the patent holder by paying damages of not less than a reasonable royalty.[255]
However, spurred on by a single article by Amy Kapczynski and Aaron S. Kesselheim in 2016, price control advocates have sought to expand and redefine Section 1498 as a means for the federal government to assert price controls over pharmaceuticals.[256] Basically, the authors claimed that if an innovator has a patent in the United States, the government essentially owns the patent and does not have to respect the innovator’s rights if it chooses not to, so long as it throws a little money their way. This approach to IP poses a direct threat to a thriving innovation ecosystem.
Advocates argue that government funding for Medicare and Medicaid constitute substantial-enough interests to assert such activity as being “for the government.” However, precedent proves otherwise.
Moreover, the entire premise behind reducing drug prices via 1498 ignores two facts written into the law: 1) 1498 does not entitle the government to engage in negotiations to lower prices; rather, it says the patent owner must bring a suit before the U.S. Court of Federal Claims to obtain a financial remedy (a costly endeavor for both the rightsholder and the government using taxpayer funding for it); and 2) the law states patent owners are entitled to reasonable “and entire” compensation, including certain fees related to court proceedings. Therefore, the U.S. government would have to litigate (not negotiate) in the hopes the costly procedure and “reasonable and entire compensation” might somehow reduce pharmaceutical costs (an unlikely outcome). The government’s efforts would be much better spent investing in further biopharmaceutical R&D rather than IP infringement.
Advocates further argue that government funding for Medicare and Medicaid constitute substantial-enough interests to assert such activity as being “for the government.” However, precedent proves otherwise, including a case the authors relied on for their own arguments. According to the U.S. Court for Federal Claims’ website, Advanced Software Design Corp. v. Federal Reserve Bank of St. Louis:
Interpreted the term ‘for the government’ to mean that the government derives a benefit from the use or manufacture of the patented technology. [If] the government simply has an ‘interest in the program generally, or funds or reimburses all or part of its costs,’ that interest is too remote to support a finding of a government benefit. In other words, the government’s mere funding of an infringing activity does not establish that such activity is ‘for the government’ within the meaning of §1498(a).[257]
Conclusion
The United States has become a global leader in biopharmaceutical innovation. Several factors have contributed to this, such as a large domestic market and a supportive policy environment, which includes an absence of government price setting and strong IP protections. These, in turn, have encouraged the emergence of substantial private R&D investment, advanced biomedical research infrastructure, biomedical education and talent development, government funding of basic research, a dynamic biotech startup ecosystem that creates demand for venture capital investments, and a collaborative environment between academia, government, and industry. This leadership position is not assured, however, and must be constantly nurtured through a supportive policy environment, especially as other nations are implementing increasingly aggressive policies to strengthen their own domestic pharmaceutical industries’ manufacturing and innovation capabilities.
The importance of government efforts that create supportive policy environments in upholding an advanced industry’s competitiveness can also be seen from the experiences of five other American industries—telecommunications equipment, semiconductors, television, solar panels, and chemicals—sectors in which the United States initially led but then lost leadership to other nations with more effective domestic industrial strategies.
Recent American policies targeting the biopharmaceutical industry, such as proposed government price regulation through the IRA and the misuse of Bayh-Dole march-in rights, which would also weaken the IP protection regime and reduce incentives for pharmaceutical firms to invest in critical R&D, harm innovation. Instead, the U.S. government needs to sustain a supportive policy environment to uphold competitiveness in its domestic biopharmaceutical industry, continuing its efforts to strengthen domestic supply chains for essential medical ingredients. It should also consider policies such as improving the IP system to incentivize long-term medical research while employing patient copayment reductions and drug supply chain reforms to make treatments more widely affordable.
Acknowledgments
The author would like to thank Robert Atkinson and Stephen Ezell for their assistance on this report. Any errors or omissions are the author’s responsibility alone.
About the Author
Sandra Barbosu, PhD, is senior policy manager in the Economics of Biopharmaceutical Innovation at ITIF’s Center for Life Sciences Innovation. Her research focuses on the economics of science and innovation, with a particular interest in emerging technologies in the healthcare setting. Sandra is also adjunct professor in the Technology Management and Innovation Department at New York University's Tandon School of Engineering. Prior to joining ITIF, Sandra served as program officer in Economics at the Alfred P. Sloan Foundation in New York, where she oversaw and assisted in the evaluation of academic grant proposals and strategy development. Sandra holds a PhD in Strategic Management from the Rotman School of Management at the University of Toronto, an MSc in Precision Cancer Medicine from the University of Oxford, and a BA in Economics and Mathematics from the University of Rochester.
About ITIF
The Information Technology and Innovation Foundation (ITIF) is an independent 501(c)(3) nonprofit, nonpartisan research and educational institute that has been recognized repeatedly as the world’s leading think tank for science and technology policy. Its mission is to formulate, evaluate, and promote policy solutions that accelerate innovation and boost productivity to spur growth, opportunity, and progress. For more information, visit itif.org/about.
Endnotes
[1]. Stephen Ezell, “Going, Going, Gone? To Stay Competitive in Biopharmaceuticals, America Must Learn From Its Semiconductor Mistakes” (ITIF, November 2021), https://www2.itif.org/2021-exec-summary-biopharma-semiconductor.pdf.
[2]. Robert D. Atkinson and Ian Tufts, “The Hamilton Index, 2023: China is Running Away with Strategic Industries” (ITIF, December 2023), https://itif.org/publications/2023/12/13/2023-hamilton-index/.
[3]. Robert D. Atkinson, “Who Lost Lucent?: The Decline of America’s Telecom Equipment Industry.” American Affairs, vol. 4, no. 3 (2020), https://americanaffairsjournal.org/2020/08/who-lost-lucent-the-decline-of-americas-telecom-equipment-industry/.
[4]. Michael E. Gorman, “Alexander Graham Bell,” Encyclopedia of Creativity (1999), 185–186.
[5]. Atkinson, “Who Lost Lucent?”
[6]. Jon Gertner, The Idea Factory: Bell Labs and the Great Age of American Innovation (New York: Penguin, 2021), 270; Iulia Georgescu, “Bringing back the golden days of Bell Labs.” Nature Reviews Physics 4, no. 2 (2022): 76–78, https://www.nature.com/articles/s42254-022-00426-6.
[7]. Atkinson, “Who Lost Lucent?”
[8]. Arona Butcher et al., “Global Competitiveness of U.S. Advanced-Technology Manufacturing Industries: Communications Technology and Equipment,” USITC Publication 2439 (Washington, D.C.: U.S. International Trade Commission, October 1991), 4–26, https://www.usitc.gov/publications/332/pub2439.pdf.
[9]. Atkinson, “Who Lost Lucent?
[10]. Robert D. Atkinson and Michael Lind, Big is beautiful: Debunking the myth of small business (MIT Press, 2018) 185.
[11]. Butcher et al., “Global Competitiveness of U.S. Advanced-Technology Manufacturing Industries.”
[12]. Nicholas Economides, “Telecommunications regulation: an introduction” (2004), https://neconomides.stern.nyu.edu/networks/Economides_Telecommunications_Regulation.pdf.
[13]. Diane Katz, “A Telecommunications Policy Primer: 20 Comprehensive Answers” (2004), https://www.mackinac.org/archives/2004/s2004-04.pdf; Nicholas Economides, “The Telecommunications Act of 1996 and its impact,” Japan and the World Economy, vol. 11, no. 4 (1999): 455–483, https://www.sciencedirect.com/science/article/pii/S0922142598000565.
[14]. National Research Council, Renewing US telecommunications research. National Academies Press (2006), https://nap.nationalacademies.org/catalog/11711/renewing-us-telecommunications-research.
[15]. Atkinson, “Who Lost Lucent?
[16]. Economides, “Telecommunications regulation: an introduction.”
[17]. Atkinson, “Who Lost Lucent?”
[18]. Ibid.
[19]. Atkinson, “Who Lost Lucent?”
[20]. Ibid.
[21]. Peilei Fan, “Catching up through developing innovation capability: evidence from China's telecom-equipment industry,” technovation, vol. 26, no. 3 (2006): 359–368, https://www.sciencedirect.com/science/article/abs/pii/S016649720400183X.
[22]. Qing Mu and Keun Lee, “Knowledge diffusion, market segmentation and technological catch-up: The case of the telecommunication industry in China.” Research Policy, vol. 34, no. 6 (2005): 759–783, https://www.sciencedirect.com/science/article/abs/pii/S0048733305000946.
[23]. Atkinson, “Who Lost Lucent?”
[24]. Quoted in Michael O. McCarthy, “Background Material for US-China Economic and Security Review Commission” (June 6, 2012), 8.
[25]. McCarthy, “Background Material,” 9.
[26]. Ryan Mcmorrow, “Huawei a Key Beneficiary of China Subsidies That US Wants Ended,” Phys.org, May 30, 2019.
[27]. Xiaofei Liu, “Zhang Yansheng: ‘Without BRI, There Wouldn’t Be Huawei’” (张燕生:没有一带一路就没有华为), China.com, accessed December 31, 2019; Atkinson, “Who Lost Lucent?”
[28]. Natalie Obiko Pearson, “Did a Chinese Hack Kill Canada’s Greatest Tech Company?” Bloomberg, July 17, 2020, https://www/bloomberg.com/news/features/2020-07-01/did-china-steal-canada-s-edge-in-5g-from-nortel.
[29]. Bureau of Labor Statistics, Annual sectoral output (millions of current dollars) for NAICS 3342, communications equipment manufacturing, U.S. total, accessed December 11, 2023, https://beta.bls.gov/dataViewer/view/timeseries/IPUEN3342__T300000000.
[30]. Bureau of Labor Statistics, Annual employment (thousands of jobs) for NAICS 3342, communications equipment manufacturing, U.S. total, accessed December 11, 2023, https://beta.bls.gov/dataViewer/view/timeseries/IPUEN3342__W200000000.
[31]. Atkinson, “Who Lost Lucent?
[32]. Semiconductor Industry Association, “What is a Semiconductor?” https://www.semiconductors.org/semiconductors-101/what-is-a-semiconductor/.
[33]. Semiconductor Industry Association, “Global Semiconductor Sales Increase 3.9% Month-to-Month in October; Annual Sales Projected to Increase 13.1% in 2024,” news release, December 4, 2023, https://www.semiconductors.org/global-semiconductor-sales-increase-3-9-month-to-month-in-october-annual-sales-projected-to-increase-13-1-in-2024.
[34]. Tudor Jenkins, “A brief history of... semiconductors,” Physics education, vol. 40, no. 5 (2005): 430, https://iopscience.iop.org/article/10.1088/0031-9120/40/5/002.
[35]. Nokia Bell Labs, “1956 Nobel Prize in Physics,” https://www.bell-labs.com/about/awards/1956-nobel-prize-physics/#gref.
[36]. Daniel Holbrook, “Government support of the semiconductor industry: diverse approaches and information flows,” Business and Economic History, vol. 24, no. 2 (1995): 133–165, https://www.jstor.org/stable/23703131.
[37]. Ibid.
[38]. Ibid.
[39]. Ibid.
[40]. Alex Williams and Hassan Khan, “A Brief History of Semiconductors: How the US Cut Costs and Lost the Leading Edge,” Employ America (Medium), March 20, 2021, https://employamerica.medium.com/a-brief-history-of-semiconductors-how-the-us-cut-costs-and-lost-the-leading-edge-c21b96707cd2.
[41]. Michaela D. Platzer and John F. Sargent, “US semiconductor manufacturing: Industry trends, global competition,” Congressional Research Service, June 27, 2016, https://sgp.fas.org/crs/misc/R44544.pdf.
[42]. Ezell, “Going, Going, Gone?”; Daniel I. Okimoto et al., Competitive edge: the semiconductor industry in the US and Japan, vol. 1 (Stanford University Press: 1984); Chris Miller, Chip war: the fight for the world's most critical technology (Simon and Schuster: 2022).
[43]. Jenna Kawar, “The CHIPS and Science Act: The United States’ Race for Semiconductor Sovereignty,” Scholarship@Western (2023), https://ir.lib.uwo.ca/cgi/viewcontent.cgi?article=1020&context=politicalscience_maresearchpapers.
[44]. Platzer and Sargent, “US semiconductor manufacturing: Industry trends, global competition”; Douglas A. Irwin, “The semiconductor industry,” Brookings Trade Forum: 173–200 (Brookings Institution Press: 1998), https://www.jstor.org/stable/25063126.
[45]. Platzer and Sargent, “US semiconductor manufacturing: Industry trends, global competition”; “Report of Defense Science Board Task Force on Semiconductor Dependency,” Department of Defense, Defense Technical Information Center (February 1987), https://apps.dtic.mil/sti/citations/ADA178284.
[46]. Platzer and Sargent, “US semiconductor manufacturing: Industry trends, global competition”; Ezell, “Going, Going, Gone?”
[47]. National Research Council, 21st Century Innovation Systems for Japan and the United States: Lessons from a Decade of Change: Report of a Symposium (2009): 8; Dylan Gerstel, “From industrial policy to innovation strategy: Lessons from Japan, Europe, and the United States” (2020).
[48]. Dylan Gerstel and Matthew P. Goodman, “From Industrial Policy to Innovation Strategy: Lessons From Japan, Europe, and the United States” (Center for Strategic and International Studies, September 2020), 30, https://csis-website-prod.s3.amazonaws.com/s3fs-public/publication/200901_Gerstel_InnovationStrategy_FullReport_FINAL_0.pdf. Information provided by the Semiconductor Industry Association.
[49]. Ezell, “Going, Going, Gone?”
[50]. Antonio Varas et al., “Strengthening the Global Semiconductor Supply Chain in an Uncertain Era,” Boston Consulting Group and Semiconductor Industry Association (April 2021): 17, https://www.semiconductors.org/wp-content/uploads/2021/05/BCG-x-SIA-Strengthening-the-Global-Semiconductor-Value-Chain-April-2021_1.pdf.
[51]. Ibid.
[52]. Judy Lin, “China invested US$290.8 billion in semiconductor projects between 2021-2022,” DigiTimes Asia, June 27, 2023, https://www.digitimes.com/news/a20230627VL205/china-ic-manufacturing-semiconductor-chips+components.html.
[53]. Thomas Hochman, “It’s Not Just NEPA: Reforming Environmental Permitting,” American Affairs, vo. VII, no. 4 (2023), https://americanaffairsjournal.org/2023/11/its-not-just-nepa-reforming-environmental-permitting/.
[54]. “Latest step taken to pave way for Taiwan version of CHIPS Act,” May 1, 2023. Focus Taiwan CAN English News, https://focustaiwan.tw/business/202305010006.
[55]. Kim Jaewon, “South Korea plans to invest $450bn to become chip ‘powerhouse’,” Nikkei Asia, May 13 2021, https://asia.nikkei.com/Business/Tech/Semiconductors/South-Korea-plans-to-invest-450bn-to-become-chip-powerhouse.
[56]. “European Chips Act,” European Commission, https://commission.europa.eu/strategy-and-policy/priorities-2019-2024/europe-fit-digital-age/european-chips-act_en.
[57]. Riham Alkousaa and Supantha Mukherjee, “Germany earmarks 20 billion euros in subsidies for chip industry,” Reuters, July 25, 2023, https://www.reuters.com/technology/germany-earmarks-20-bln-eur-chip-industry-coming-years-2023-07-25/.
[58]. “2023 State of the U.S. Semiconductor Industry,” Semiconductor Industry Association (2023): 20, https://www.semiconductors.org/wp-content/uploads/2023/07/SIA_State-of-Industry-Report_2023_Final_072723.pdf.
[59]. Antonio Varas et al., “Government Incentives and U.S. Competitiveness in Semiconductor Manufacturing” (SIA and Boston Consulting Group), 7, https://www.bcg.com/en-us/publications/2020/incentives-and-competitiveness-in-semiconductor-manufacturing.
[60]. Congressional Research Service (CRS), “Semiconductors: U.S. Industry, Global Competition, and Federal Policy” (CRS, October 2020), i, https://fas.org/sgp/crs/misc/R46581.pdf.
[61]. CRS, “Semiconductors: U.S. Industry, Global Competition, and Federal Policy,” 22. Note: 300 nm Equivalent Wafer Capacity by Country/Region, 2015 and 2019. CRS cites IC Insights, Global Wafer Capacity, 2020–2024. CRS also makes this caveat: “While actual production outputs are proprietary and generally confidential, production capacities are well known and used as the primary metric for assessing where semiconductors are made.”
[62]. “Fact Sheet: CHIPS and Science Act Will Lower Costs, Create Jobs, Strengthen Supply Chains, and Counter China,” The White House press release, August 9, 2022, https://www.whitehouse.gov/briefing-room/statements-releases/2022/08/09/fact-sheet-chips-and-science-act-will-lower-costs-create-jobs-strengthen-supply-chains-and-counter-china/.
[63]. Varas et al., “Government Incentives and U.S. Competitiveness in Semiconductor Manufacturing.”
[64]. Wassen Mohammad, Adel Elomri, and Laoucine Kerbache, “The Global Semiconductor Chip Shortage: Causes, Implications, and Potential Remedies,” IFAC-PapersOnLine 55, no. 10 (2022): 476–483, https://www.sciencedirect.com/science/article/pii/S2405896322017293.
[65]. Kawar, “The CHIPS and Science Act.”
[66]. Laura Snyder, “Fuchs Appointed to National Semiconductor Technology Center Board,” Carnegie Mellon University News, October 18, 2023, https://www.cmu.edu/news/stories/archives/2023/October/fuchs-nstc-board.
[67]. “New report identifies pathways to strengthen U.S. competitiveness in key technology areas,” National Science Foundation, news release, October 24, 2023, https://new.nsf.gov/news/new-report-identifies-pathways-strengthen-us.
[68]. “Fact Sheet: One Year after the CHIPS and Science Act, Biden-Harris Administration marks Historic Progress in Bringing Semiconductor Supply Chains Home, Supporting Innovation, and Protecting National Security,” The White House press release, August 9, 2023, https://www.whitehouse.gov/briefing-room/statements-releases/2023/08/09/fact-sheet-one-year-after-the-chips-and-science-act-biden-harris-administration-marks-historic-progress-in-bringing-semiconductor-supply-chains-home-supporting-innovation-and-protecting-national-s/; Matt Furlow, “CHIPS and Science Act Anniversary: Progress Made but Work Remains.” U.S. Chamber of Commerce, August 28, 2023, https://www.uschamber.com/technology/chips-and-science-act-anniversary-progress-made-but-work-remains.
[69]. Robert Casanova, “The CHIPS Act Has Already Sparked $200 Billion in Private Investments for U.S. Semiconductor Production,” Semiconductor Industry Association, December 6, 2023, https://www.semiconductors.org/the-chips-act-has-already-sparked-200-billion-in-private-investments-for-u-s-semiconductor-production/
[70]. “Chipping In: The U.S. Semiconductor Industry Workforce and How Federal Incentives Will Increase Domestic Jobs,” SIA/Oxford Economics Report, 2021, https://www.semiconductors.org/wp-content/uploads/2021/05/SIA-Impact_May2021-FINAL-May-19-2021_2.pdf.
[71]. Albert Abramson, The history of television, 1942 to 2000 (McFarland, 2003), 3.
[72]. Ibid.
[73]. Ibid, 18.
[74]. Gary Hoover, “Tech Wars: RCA and the Television Industry,” American Business History Center, February 5, 2021, https://americanbusinesshistory.org/tech-wars-rca-and-the-television-industry/.
[75]. Fred N. Burton and F. H. Saelens, “Trade barriers and Japanese foreign direct investment in the colour television industry,” Managerial and Decision Economics, vol. 8, no. 4 (1987): 285–293, https://onlinelibrary.wiley.com/doi/abs/10.1002/mde.4090080404.
[76]. Ibid.
[77]. “The Big Picture: HDTV and High- Resolution Systems,” OTA-BP-CI’I’-64, U.S. Congress, Office of Technology Assessment (Washington, D.C.: U.S. Government Printing Office, June 1990): 93–94.
[78]. Burton and Saelens, “Trade barriers and Japanese foreign direct investment in the colour television industry.”
[79]. Richard N. Langlois, “Organizing the electronic century,” The third industrial revolution in global business (2013): 119–167; Kenneth L. Simons, “Engine of dominance: Competence-enhancing process innovation,” presented at Industry Studies Conference, Minneapolis, 2016.
[80]. Steven Klepper, Experimental Capitalism: The Nanoeconomics of American High-Tech Industries (Princeton University Press: 2015); Serguey Braguinsky et al., “Mega Firms and Recent Trends in the US Innovation: Empirical Evidence from the US Patent Data” (working paper, no. w31460, National Bureau of Economic Research, 2023).
[81]. Abegglen quoted in Robert Sobel, RCA (New York: Stein and Day, 1986), 212; Robert D. Atkinson and Aurelien Portuese, “Platforms Are the New Organizational Paradigm” (ITIF, March 2023), https://itif.org/publications/2023/03/13/platforms-are-the-new-organizational-paradigm/#.
[82]. Robert D. Atkinson and Michael Lind, Big Is Beautiful: Debunking The Myth Of Small Business (MIT Press, 2018).
[83]. Douglas Frantz and Catherine Collins, Selling Out: How We Are Letting Japan Buy Our Land, Our Industries, Our Financial Institutions, And Our Future (Contemporary Books, 1990): 90–91.
[84]. Marvin J. Wolf, The Japanese Conspiracy: Their Plot to Dominate the Industry World-Wide, and How to Deal With It (Empire Books: 1983): 23–25.
[85]. Kozo Yamamura and Jan Vandenberg, “Japan’s rapid-growth policy on trial: The television case,” in Law and Trade Issues of the Japanese Economy: American and Japanese Perspectives, edited by G. R. Saxonhouse and K. Yamamura (University of Washington Press, 1986): 238–283.
[86]. “The Big Picture: HDTV and High- Resolution Systems,” U.S. Congress, Office of Technology Assessment.
[87]. Chester L. Mize, “Television Receiving Sets from Japan: Determination of Injury in Investigation No. AA1921-66 Under the Antidumping Act, 1921, As Amended,” United States Tariff Commission (March 1971), https://www.usitc.gov/publications/tariff_affairs/pub367.pdf; Pat Choate, “Japan and the Big Squeeze,” The Washington Post, September 30, 1990, https://www.washingtonpost.com/archive/opinions/1990/09/30/japan-and-the-big-squeeze/0fb1617e-8756-4390-a776-f1619d59869a/; Yamamura and Vandenberg, “Japan’s rapid-growth policy on trial: The television case.”
[88]. Monroe Leigh, “Matsushita Electric Industrial Co. v. Zenith Radio Corp,” American Journal of International Law, vol. 80, no. 4 (1986): 955-958, https://www.jstor.org/stable/2202080; “The Big Picture: HDTV and High- Resolution Systems,”U.S. Congress, Office of Technology Assessment.
[89]. Geoffrey T. Tong, “Matsushita Electric Industrial Co. v. Zenith Radio Corp.: Supreme Court Leaves Extraterritorial Antitrust Questions Unanswered,” Loy. LA Int'l & Comp, LJ 10 (1988): 401, https://digitalcommons.lmu.edu/cgi/viewcontent.cgi?article=1138&context=ilr.
[90]. John D. Moteff, “The Role of DoD’s Investment in Electronics on the Decline of the Consumer Electronics Industry” (1996), https://apps.dtic.mil/sti/tr/pdf/ADA314887.pdf.
[91]. Abramson, The history of television, 1942 to 2000, 3.
[92]. Tong, “Matsushita Electric Industrial Co. v. Zenith Radio Corp.: Supreme Court Leaves Extraterritorial Antitrust Questions Unanswered.”
[93]. Choate, “Japan and the Big Squeeze.”
[94]. “Vizio: About Us,” https://www.vizio.com/en/about-vizio; “Element Electronics: Our Company,” https://elementelectronics.com/our-company.
[95]. “Market share of leading TV manufacturers worldwide from 2019 to 2022, by sales volume,” TCL, Statista, March 10, 2023, https://www-statista-com.proxy.library.nyu.edu/statistics/1266988/global-leading-manufacturers-tv-market-share-sales-volume/.
[96]. Ibid.
[97]. “Broadcasting Equipment,” The Observatory of Economic Complexity (2021), https://oec.world/en/profile/hs/broadcasting-equipment.
[98]. U.S. Census Bureau, USA Trade Online, Exports & Imports by NAICS Commodities (NAICS Code 334220 Radio/TV Broadcast & Wireless Communication Equipment), accessed December 1, 2023, https://usatrade.census.gov/.
[99]. Ibid.
[100]. Ibid.
[101]. Sufang Zhang and Yongxiu He, “Analysis on the development and policy of solar PV power in China,” Renewable and Sustainable Energy Reviews, vol. 21 (2013): 393–401; “Photovoltaics,” Solar Energy Technology Offices, Office of Energy & Renewable Energy, https://www.energy.gov/eere/solar/photovoltaics.
[102]. Joel West, “Too little, too early: California’s transient advantage in the photovoltaic solar industry,” The Journal of Technology Transfer, vol. 39 (2014): 487–501, https://link.springer.com/article/10.1007/s10961-012-9291-6; John Perlin, “The Silicon Solar Cell Turns 50,” National Renewable Energy Laboratory (2004), www.nrel.gov/docs/fy04osti/33947.pdf.
[103]. “History and the Development of Photovoltaics,” AE-SOLAR (2022), https://ae-solar.com/history-of-solar-module/.
[104]. Sheila G. Bailey, Ryne Raffaelle, and Keith Emery, “Space and terrestrial photovoltaics: Synergy and diversity,” Progress in Photovoltaics: Research and Applications, vol. 10, no. 6 (2002): 399–406.
[105]. West, “Too little, too early: California’s transient advantage in the photovoltaic solar industry.”
[106]. Thomas Keith Glennan and J. D. Hunley, The Birth of NASA: The Diary of T. Keith Glennan. NASA, No. NASA-SP-4105 (1993), https://history.nasa.gov/SP-4105.pdf.
[107]. Geoffrey G. Jones and Loubna Bouamane, “Power from Sunshine: A Business History of Solar Energy” (working paper, Harvard Business School Working Paper Series, 2012).
[108]. West, “Too little, too early: California’s transient advantage in the photovoltaic solar industry.”
[109]. Ibid.
[110]. Zhang and He, “Analysis on the development and policy of solar PV power in China.”
[111]. Ibid.
[112]. Ibid.
[113]. Ibid.
[114]. Ibid.
[115]. Ping Huang et al, “How China became a leader in solar PV: An innovation system analysis,” Renewable and Sustainable Energy Reviews, vol. 64 (2016): 777–789, https://www.sciencedirect.com/science/article/abs/pii/S1364032116302969.
[116]. Sherisse Pham and Matt Rivers, “China is crushing the U.S. in renewable energy,” CNN Business, July 18, 2017, https://money.cnn.com/2017/07/18/technology/china-us-clean-energy-solar-farm/index.html.
[117]. Stephen Ezell, “China-Induced Global Overcapacity an Increasing Threat to High-Tech Industries” (ITIF, February 2018), https://itif.org/publications/2018/02/27/china-induced-global-overcapacity-increasing-threat-high-tech-industries/.
[118]. David Hart, “The Impact of China’s Production Surge on Innovation in the Global Solar Photovoltaics Industry” (ITIF, October 2020), https://itif.org/publications/2020/10/05/impact-chinas-production-surge-innovation-global-solar-photovoltaics/.
[119]. Keith Bradsher, “200 Chinese Subsidies Violate Rules, U.S. Says,” The New York Times, October 5, 2011, https://www.nytimes.com/2011/10/07/business/us-says-some-chinese-subsidies-violate-trade-rules.html.
[120]. “Cumulative solar photovoltaic capacity globally as of 2022, by select country (in gigawatts),” REN21, Statista, June 13, 2023, https://www-statista-com.proxy.library.nyu.edu/statistics/264629/existing-solar-pv-capacity-worldwide/.
[121]. “Leading countries based on new solar photovoltaic capacity additions in 2022 (in gigawatts),” REN21, Statista, June 13, 2023, https://www-statista-com.proxy.library.nyu.edu/statistics/275932/world-construction-of-photovoltaic-systems-by-installed-capacity/.
[122]. “Largest solar photovoltaic power plants worldwide as of May 2023, by capacity (in gigawatts),” Energy Digital, Statista, May 30, 2023., https://www-statista-com.proxy.library.nyu.edu/statistics/217265/largest-solar-pv-power-plants-in-operation-worldwide/; “Production of the leading solar PV module manufacturers worldwide in 2022 (in gigawatts),” PVPS and IEA, Statista, September 29, 2023, https://www-statista-com.proxy.library.nyu.edu/statistics/1377223/major-pv-manufacturers-module-production-globally/.
[123]. Ibid.
[124]. “Solar PV Global Supply Chains,” IEA, Paris (2022), https://www.iea.org/reports/solar-pv-global-supply-chains. License: CC BY 4.0.
[125]. “Silica sands and quartz sands,” The Observatory of Economic Complexity (2021), https://oec.world/en/profile/hs/silica-sands-and-quartz-sands.
[126]. David Hart, “Recent legislation in the United States: consequences for the US and global energy and climate innovation systems,” Environmental Research Letters, vol. 18, no. 9 (2023): 091002, https://iopscience.iop.org/article/10.1088/1748-9326/acf148; Jesse D. Jenkins et al., “2022 Preliminary Report: The Climate and Energy Impacts of the Inflation Reduction Act of 2022,” Princeton University Zero Lab (August 2022), https://repeatproject.org/docs/REPEAT_IRA_Prelminary_Report_2022-08-04.pdf.
[127]. “Treasury Releases New Guidance, Strengthening Incentives for Domestic Clean Energy Manufacturing,” The White House Clean Energy Updates, May 12, 2023, https://www.whitehouse.gov/cleanenergy/clean-energy-updates/2023/05/12/treasury-releases-new-guidance-strengthening-incentives-for-domestic-clean-energy-manufacturing/.
[128]. “Turning America Into a Solar Manufacturing Powerhouse,” Solar Energy Industries Association, March 30, 2023, https://www.seia.org/blog/turning-america-solar-manufacturing-powerhouse.
[129]. “Impact of the Inflation Reduction Act,” Solar Energy Industries Association, https://www.seia.org/research-resources/impact-inflation-reduction-act.
[130]. Nichola Groom, “First Solar pledges big U.S. factory expansion thanks to climate law,” Reuters, August 30, 2022, https://www.reuters.com/business/sustainable-business/first-solar-pledges-big-us-factory-expansion-thanks-climate-law-2022-08-30/.
[131]. “Impact of the Inflation Reduction Act,” Solar Energy Industries Association.
[132]. “Biden-Harris Administration Invests $26 Million to Support a Modern, Reliable, and Resilient American Clean Energy Grid,” Department of Energy, May 10, 2023, https://www.energy.gov/articles/biden-harris-administration-invests-26-million-support-modern-reliable-and-resilient.
[133]. “Solar Energy Technologies Office Fact Sheet,” U.S. Department of Energy Office of Scientific and Technical Information, March 13, 2018, https://www.osti.gov/biblio/1436224.
[134]. “Tackling Challenges in Solar: 2014 Portfolio,” SunShot Initiative, Solar Energy Technologies Office, U.S. Department of Energy, https://www.energy.gov/eere/solar/articles/download-sunshot-initiative-2014-portfolio.
[135]. “The SunShot Initiative: Making Solar Energy Affordable for All Americans,” SunShot Initiative, Solar Energy Technologies Office, U.S. Department of Energy (October 2013), https://www.nrel.gov/docs/fy14osti/60491.pdf; “2030 Solar Cost Targets,” Solar Energy Technologies Office, Department of Energy, August 14, 2021, https://www.energy.gov/eere/solar/articles/2030-solar-cost-targets.
[136]. Thomas L. Ilgen, “Better living through chemistry: the chemical industry in the world economy,” International Organization, vol. 37, no. 4 (1983): 647–680, https://www.cambridge.org/core/journals/international-organization/article/abs/better-living-through-chemistry-the-chemical-industry-in-the-world-economy/6D997E461DCC179605A5A74974FB5BEE.
[137]. Ilgen, “Better living through chemistry: the chemical industry in the world economy.”
[138]. John Kenly Smith, Jr., “Science, Technology and the Military,” in Sociology of the Sciences, no. 2, edited by E. Mendelsohn, M. Roe-Smith, and P. Weingart (1988): 307–308.
[139]. Ibid.
[140]. Ilgen, “Better living through chemistry: the chemical industry in the world economy.”
[141]. Kenly Smith, Jr., “Science, Technology and the Military,” 318–320.
[142]. Ibid.
[143]. Ashish Arora, Ralph Landau, and Nathan Rosenberg, Chemicals and long-term economic growth: insights from the chemical industry (Wiley-Interscience, 1998); Peter H. Spitz, The chemical industry at the millennium: maturity, restructuring, and globalization (Chemical Heritage Foundation: 2003).
[144]. Michael P. Wilson and Megan R. Schwarzman, “Toward a new US chemicals policy: rebuilding the foundation to advance new science, green chemistry, and environmental health,” Environmental Health Perspectives, vol. 117, no. 8 (2009): 1202–1209, https://www.ncbi.nlm.nih.gov/pmc/articles/PMC2721862/.
[145]. Allen J. Lenz and John Lafrance, “Meeting the challenge: US industry faces the 21st century,” US Department of Commerce, Office of Technology Policy (1996), https://webharvest.gov/peth04/20041017030737/http://www.technology.gov/Reports/chemicals/chemical.pdf.
[146]. Wilson and Schwarzman, “Toward a new US chemicals policy: rebuilding the foundation to advance new science, green chemistry, and environmental health.”
[147]. Christopher Schroeder, “A decade of change in regulating the chemical industry,” Law and Contemporary Problems, vol. 46, no. 3 (1983), https://www.jstor.org/stable/1191556.
[148]. Andrew Hoffman, “Institutional Evolution and Change: Environmentalism and the US Chemical Industry,” Academy of Management Journal, vol. 42, no. 4 (1999): 351–371, https://deepblue.lib.umich.edu/bitstream/handle/2027.42/136182/1349_Hoffman.pdf.
[149]. Michael Greenstone, “The impacts of environmental regulations on industrial activity: Evidence from the 1970 and 1977 Clean Air Act amendments and the census of manufacturers,” Journal of Political Economy, vol. 110, no. 6 (2002): 1175–1219, https://www.jstor.org/stable/10.1086/342808.
[150]. Randy Becker and Vernon Henderson, “Effects of air quality regulations on polluting industries,” Journal of Political Economy, vol. 108, no. 2 (2000): 379–421, https://www.jstor.org/stable/10.1086/262123.
[151]. Greenstone, “The impacts of environmental regulations on industrial activity.”
[152]. Wolfgang Keller and Arik Levinson, “Pollution abatement costs and foreign direct investment inflows to US states,” Review of Economics and Statistics, vol. 84, no. 4 (2002): 691–703, https://www.jstor.org/stable/40043083.
[153]. Sheng Hong et al., “China’s chemical industry: new strategies for a new era,” McKinsey & Company (2019), https://www.mckinsey.com/industries/chemicals/our-insights/chinas-chemical-industry-new-strategies-for-a-new-era#.
[154]. Atkinson and Tufts, “The Hamilton Index, 2023: China is Running Away with Strategic Industries.”
[155]. Ibid.
[156]. “Leading countries based on chemical research and development spending worldwide in 2017 (in billion U.S. dollars),” Oxford Economics & International Council of Chemical Associations, Statista, March 8, 2019, https://www-statista-com.proxy.library.nyu.edu/statistics/1079313/research-development-spending-chemical-industry-leading-countries/.
[157]. “Number of employees in the chemical industry worldwide in 2022, by select country (in 1,000s),” VCI, Statista, September 29, 2023, https://www-statista-com.proxy.library.nyu.edu/statistics/1330080/global-chemical-industry-employees-by-country/.
[158]. “Leading countries based on chemical research and development spending worldwide.” Statista.
[159]. “Number of employees in the chemical industry worldwide in 2022, by select country (in 1,000s),” VCI, Statista (September 2023), https://www-statista-com.proxy.library.nyu.edu/statistics/1330080/global-chemical-industry-employees-by-country/.
[160]. “Biden-Harris Administration Proposes Reforms to New Chemical Review Process to Protect Public Health, Promote Efficiency and Consistency,” U.S. Environmental Protection Agency news release, May 16, 2023, https://www.epa.gov/newsreleases/biden-harris-administration-proposes-reforms-new-chemical-review-process-protect.
[161]. Michael P. Wilson and Megan R. Schwarzman, “Toward a new US chemicals policy: rebuilding the foundation to advance new science, green chemistry, and environmental health,” Environmental Health Perspectives, vol. 117, no. 8 (2009): 1202–1209, https://www.ncbi.nlm.nih.gov/pmc/articles/PMC2721862/.
[162]. “Comment submitted by Aaron Rice, Environmental Health & Safety Director, EaglePicher Technologies, LLC,” January 23, 2020, https://www.regulations.gov/document/EPA-HQ-OPPT-2019-0236-0049.
[163]. “Current Employment Statistics – CES (National), Employment and Earnings Table B-1a,” U.S. Bureau of Labor Statistics, accessed November 25, 2023, https://www.bls.gov/web/empsit/ceseeb1a.htm.
[164]. European Federation of Pharmaceutical Industries and Associations (EFPIA), “The Pharmaceutical Industry in Figures, Key Data, 2019,” 8, https://www.efpia.eu/media/413006/the-pharmaceutical-industry-in-figures.pdf.
[165]. “Novel Drug Approvals.” U.S. Food & Drug Administration. https://www.fda.gov/drugs/new-drugs-fda-cders-new-molecular-entities-and-new-therapeutic-biological-products/novel-drug-approvals-2023
[166]. Ibid.
[167]. “Fast Track, Breakthrough Therapy, Accelerated Approval, Priority Review,” FDA, https://www.fda.gov/patients/learn-about-drug-and-device-approvals/fast-track-breakthrough-therapy-accelerated-approval-priority-review; John Swann, “The Story Behind the Orphan Drug Act,” FDA, https://www.fda.gov/industry/fdas-rare-disease-day/story-behind-orphan-drug-act.; A.S. Kesselheim and J. J. Darrow, “FDA designations for therapeutics and their impact on drug development and regulatory review outcomes,” Clinical Pharmacology & Therapeutics, vol. 97, no. 1 (2015): 29–36, https://pubmed.ncbi.nlm.nih.gov/25670381/.
[168]. Ibid.
[169]. “FY 2012 innovative drug approvals,” FDA (2012), https://www.fdanews.com/ext/resources/files/archives/1/12/12-7-12-approvals.pdf.
[170]. Atkinson and Tufts, “The Hamilton Index, 2023: China is Running Away with Strategic Industries.”
[171]. Ibid.
[172]. Ibid.
[173]. Safeguarding Pharmaceutical Supply Chains in a Global Economy, October 30, 2019 (Congressional Testimony of Janet Woodcock before the House Committee on Energy and Commerce, Subcommittee on Health), https://www.fda.gov/news-events/congressional-testimony/safeguarding-pharmaceutical-supply-chains-global-economy-10302019#ftn3.
[174]. Department of Commerce, “Reliance on Foreign Sourcing in the Healthcare and Public Health Sector: Pharmaceuticals, Medical Devices, and Surgical Equipment” (December 2011), https://www.bis.doc.gov/index.php/documents/other-areas/642-department-of-homeland-security-dhs-assessment-impact-of-foreign-sourcing-on-health-related-infra/file; “Drug Shortages: Root Causes and Potential Solutions,” FDA (October 2019), https://www.fda.gov/media/131130/download; “The US Active Pharmaceutical Ingredient Infrastructure: The Current State and Considerations to Increase US Healthcare Security,” Olin Business School, Washington University (August 2021), https://www.fdanews.com/ext/resources/files/2021/08-26-21-USActivePharmaIngredientInfrastructure.pdf?1630013957.
[175]. Safeguarding Pharmaceutical Supply Chains in a Global Economy (Congressional Testimony of Janet Woodcock).
[176]. Ibid.
[177]. Petra Brhlikova et al., “Essential medicines lists are for high income countries too,” British Medical Journal, vol. 382 (2023), https://www.bmj.com/content/382/bmj-2023-076783.
[178]. “Fact Sheet: The United States Announced New Investments and Resources to Advance President Biden’s National Biotechnology and Biomanufacturing Initiative,” The White House press release, September 14, 2022, https://www.whitehouse.gov/briefing-room/statements-releases/2022/09/14/fact-sheet-the-united-states-announces-new-investments-and-resources-to-advance-president-bidens-national-biotechnology-and-biomanufacturing-initiative/.
[179]. “Fact Sheet: President Biden Announces New Actions to Strengthen America’s Supply Chains, Lower Costs for Families, and Secure Key Sectors,” The White House press release, November 27, 2023, https://www.whitehouse.gov/briefing-room/statements-releases/2023/11/27/fact-sheet-president-biden-announces-new-actions-to-strengthen-americas-supply-chains-lower-costs-for-families-and-secure-key-sectors/.
[180]. National Science Foundation (NSF), “Science and Engineering Indicators: 2022,” Supplemental Table SKTI-9, https://ncses.nsf.gov/pubs/nsb20226/data.
[181]. NSF Science & Engineering Indicators, “Invention, Knowledge Transfer, and Innovation,” March 2022 (Table SINV-60: USPTO utility patents granted in pharmaceuticals, by region, country, or economy: 1998-2020), https://ncses.nsf.gov/pubs/nsb20224/data.
[182]. Ibid.
[183]. David Ricks, “Building an Innovation Ecosystem for a Healthier and More Secure Future” (PhRMA, January 28, 2022), 10, http://www.phrma-jp.org/wordpress/wp-content/uploads/2022/01/220128_PhRMA_Press_Conference_Presentation_ENG.pdf. Citing: IQVIA Institute for Human Data Science, “Global Trends in R&D: Overview Through 2020” (IQVIA, May 2021), https://www.iqvia.com/insights/the-iqvia-institute/reports/global-trends-in-r-and-d.
[184]. Ibid.
[185]. Ibid.
[186]. Vital Transformation, “Growth in Chinese Alzheimer’s Clinical Trials” (2023), data source: https://www.chictr.org.cn/.
[187]. Ibid.
[188]. Stephen Ezell, “Ensuring U.S. Biopharmaceutical Competitiveness” (ITIF, July 2020), https://www2.itif.org/2020-biopharma-competitiveness.pdf.
[189]. U.S. Census Bureau, USA Trade Online, Exports & Imports by NAICS Commodities, NAICS Code 32541 Pharmaceuticals & Medicines, accessed December 1, 2023, https://usatrade.census.gov/.
[190]. Ibid.
[191]. “National Institutes of Health (NIH) Funding: FY1996-FY2023,” Congressional Research Service, March 8, 2023, https://crsreports.congress.gov/product/pdf/R/R43341/45; National Institutes of Health, Budget, accessed January 11, 2024, https://www.nih.gov/about-nih/what-we-do/budget; National Institutes of Health, Mission and Goals, accessed January 11, 2024, https://www.nih.gov/about-nih/what-we-do/mission-goals.
[192]. ARPA-H, About Us, accessed January 11, 2024, https://arpa-h.gov/about; ARPA-H, Budget and Appropriations, accessed January 11, 2024, https://arpa-h.gov/about/budget.
[193]. John Swann, “The Story Behind the Orphan Drug Act,” FDA (February 23, 2018), https://www.fda.gov/industry/fdas-rare-disease-day/story-behind-orphan-drug-act.
[194]. Lewis J. Fermaglich and Kathleen L. Miller, “A comprehensive study of the rare diseases and conditions targeted by orphan drug designations and approvals over the forty years of the Orphan Drug Act,” Orphanet Journal of Rare Diseases, vol. 18 (2023), 163, https://www.ncbi.nlm.nih.gov/pmc/articles/PMC10290406/.
[195]. Ernst R. Berndt et al., “Assessing the impacts of the prescription drug user fee acts (PDUFA) on the FDA approval process,” Forum for Health Economics & Policy, vol. 8, no. 1. (2005), https://doi.org/10.2202/1558-9544.1013.
[196]. Bacchus Barua, Will Westcott, and Van Nghiem Vo, “Timely Access to New Pharmaceuticals in Canada, the United States, and the European Union” (Fraser Institute, 2021), https://www.fraserinstitute.org/sites/default/files/timely-access-to-new-pharmaceuticals-in-canada-US-and-EU.pdf.
[197]. Elina Petrova, “Innovation in the pharmaceutical industry: The process of drug discovery and development,” Innovation and Marketing in the Pharmaceutical Industry: Emerging Practices, Research, and Policies (New York: Springer, 2013), 19–81.
[198]. DiMasi, Joseph A., Henry G. Grabowski, and Ronald W. Hansen, “Innovation in the pharmaceutical industry: new estimates of R&D costs,” Journal of Health Economics, vol. 47 (2016): 20–33, https://pubmed.ncbi.nlm.nih.gov/26928437/.
[199]. Heidi L. Williams, “How do patents affect research investments?” Annual Review of Economics, vol. 9 (2017): 441–469, https://www.annualreviews.org/doi/10.1146/annurev-economics-110216-100959.
[200]. Olga Gurgula, “Strategic patenting by pharmaceutical companies–should competition law intervene?” IIC-International Review of Intellectual Property and Competition Law, vol. 51, no. 9 (2020): 1062–1085, https://www.ncbi.nlm.nih.gov/pmc/articles/PMC7592140/.
[201]. Ashish Arora, Marco Ceccagnoli, and Wesley M. Cohen, “R&D and the patent premium,” International Journal of Industrial Organization, vol. 26, no. 5 (2008): 1153–1179, https://www.sciencedirect.com/science/article/abs/pii/S0167718707001373.
[202]. Margaret Kyle and Yi Qian, “Intellectual property rights and access to innovation: evidence from TRIPS” (working paper, National Bureau of Economic Research, 2014), https://www.nber.org/papers/w20799.
[203]. Iain M. Cockburn et al., “Patents and the global diffusion of new drugs,” American Economic Review, vol. 106, no. 1 (2016): 136–164, https://www.aeaweb.org/articles?id=10.1257/aer.20141482.
[204]. John P. Walsh, Ashish Arora, and Wesley M. Cohen, “Effects of research tool patents and licensing on biomedical innovation,” Patents in the Knowledge-based Economy, vol. 285 (2003): 286, http://elibrary.pcu.edu.ph:9000/digi/NA02/2003/10770.pdf#page=298.
[205]. Eric Budish, Benjamin N. Roin, and Heidi Williams, “Do firms underinvest in long-term research? Evidence from cancer clinical trials,” American Economic Review, vol. 105, no. 7 (2015): 204–2085, https://www.aeaweb.org/articles?id=10.1257/aer.20131176.
[206]. Ibid.
[207]. Kevin Madigan and Adam Mossoff, “Turning Lead to Gold: How Patent Eligibility Doctrine Is Undermining U.S. Leadership in Innovation” (April 2017). George Mason Law Review, vol. 24: 939-960, George Mason Law & Economics Research Paper No. 17-16, https://papers.ssrn.com/sol3/papers.cfm?abstract_id=2943431.
[208]. Joe Kennedy, “The Link Between Drug Prices and Research on the Next Generation of Cures” (ITIF, September 2019), https://itif.org/publications/2019/09/09/link-between-drug-prices-and-research-next-generation-cures/.
[209]. Destrina Grace Simanjuntak and Raymond R. Tjandrawinata, “Impact of Profitability, R&D Intensity, and Cash Flow on R&D Expenditure in Pharmaceutical Companies” (working paper, Social Science Research Network, April 29, 2011), http://papers.ssrn.com/sol3/papers.cfm?abstract_id=1824267.
[210]. Alfonso Gambardella, Science and Innovation: The US Pharmaceutical Industry During the 1980s (Cambridge University Press, 1995).
[211]. Rebecca Henderson and Iain Cockburn, “Measuring Competence? Exploring Firm Effects in Pharmaceutical Research,” Strategic Management Journal, vol. 15, no. S1 (1994): 63–84, https://doi.org/10.1002/smj.4250150906.
[212]. Pierre Dubois, “Market size and pharmaceutical innovation,” The Rand Journal of Economics, vol. 46, no. 4 (October 2015): 844–871, https://onlinelibrary.wiley.com/doi/full/10.1111/1756-2171.12113.
[213]. Barua, Westcott, and Vo, “Timely Access to New Pharmaceuticals in Canada, the United States, and the European Union.”
[214]. Cockburn et al., “Patents and the global diffusion of new drugs.”
[215]. Joseph Golec and John A. Vernon, “Financial effects of pharmaceutical price regulation on R&D spending by EU versus US firms,” Pharmacoeconomics, vol. 28 (2010): 615–628, https://pubmed.ncbi.nlm.nih.gov/20617857/.
[216]. Lakdawalla et al., “US Pharmaceutical Policy In A Global Marketplace.”
[217]. Dana P. Goldman, “Regulating Drug Prices: U.S. Policy Alternatives in a Global Context,” RAND Corporation (2008), https://www.rand.org/pubs/research_briefs/RB9412.html.
[218]. “Drug Expenditure Dynamics 1995-2020: Understanding Medicine Spending in Context,” IQVIA Institute for Human Data Science (2021), https://www.iqvia.com/-/media/iqvia/pdfs/institute-reports/drug-expenditure-dynamics/drug-expenditure-dynamics-19952020.pdf.
[219]. Stephen Ezell and Kelli Zhao, “The Economics of Biopharmaceutical Innovation: Symposium Report” (ITIF, March 2023), https://www2.itif.org/2023-biopharma-economics.pdf.; Stephen Ezell and Kelli Zhao, “How Skeptics Misconstrue the Link Between Drug Prices and Innovation” (ITIF, September 2023), https://www2.itif.org/2023-drug-price-skeptics.pdf.
[220]. “Importation Program under Section 804 of the FD&C Act,” FDA (January 5, 2024), https://www.fda.gov/about-fda/reports/importation-program-under-section-804-fdc-act.
[221]. Centers for Medicare & Medicaid Services, “Medicare Drug Price Negotiation Program: Selected Drugs for Initial Price Applicability Year 2026,” Medicare Drug Price Negotiation Program (August 2023), https://www.cms.gov/files/document/fact-sheet-medicare-selected-drug-negotiation-list-ipay-2026.pdf.
[222]. Tomas J. Philipson and Troy Durie, “The evidence base on the impact of price controls on medical innovation” (working paper, Becker Friedman Institute, University of Chicago, 2021), https://bfi.uchicago.edu/working-paper/the-evidence-base-on-the-impact-of-price-controls-on-medical-innovation/.
[223]. Goldman et al., “Regulating Drug Prices: U.S. Policy Alternatives in a Global Context.”
[224]. “From Innovation Oasis to Research Desert: The Impact of Price Controls on Clinical Research and Development,” U.S. Chamber of Commerce (2023), https://www.uschamber.com/assets/documents/From-Innovation-Oasis-to-Research-Desert-USCC.pdf
[225]. World Trade Organization, “TRIPS – Trade-Related Aspects of Intellectual Property Rights,” https://www.wto.org/english/tratop_e/trips_e/trips_e.htm.
[226]. S. Akhtar, “World Trade Organization: “TRIPS Waiver” for COVID-19 Vaccines,” Congressional Research Service (2022), https://crsreports.congress.gov/product/pdf/R/R47231/2.
[227]. Bastian Rake, “Waiting intellectual property rights: Boom or bust for medical innovation?” Drug Discovery Today, vol. 27, no. 2 (2002): 384–389, https://pubmed.ncbi.nlm.nih.gov/34718204/.
[228]. World Trade Organization, “Members continue discussion on TRIPS Decision extension to therapeutics and diagnostics,” March 17, 2023, https://www.wto.org/english/news_e/news23_e/heal_17mar23_e.htm.
[229]. PhRMA, “A TRIPS Waiver for COVID-19 Medicines is Harmful and Unnecessary,” https://phrma.org/en/policy-issues/International/TRIPS-Waiver.
[230]. David S. Johanson et al., “COVID-19 Diagnostics and Therapeutics: Supply, Demand, and TRIPS Agreement Flexibilities,” U.S. International Trade Commission (October 2023), https://www.usitc.gov/publications/332/pub5469.pdf.
[231]. Chris Borges, “TRIPS Waivers and Pharmaceutical Innovation,” Center for Strategic & International Studies, 15 March 2023, https://www.csis.org/blogs/perspectives-innovation/trips-waivers-and-pharmaceutical-innovation.
[232]. Ashish Arora et al., “The changing structure of American innovation: Some cautionary remarks for economic growth,” Innovation Policy and the Economy vol. 20, no. 1 (2020): 39–93, https://www.journals.uchicago.edu/doi/full/10.1086/705638.
[233]. David C. Mowery and Bhaven N. Sampat, “The Bayh-Dole Act of 1980 and university–industry technology transfer: a model for other OECD governments?” The Journal of Technology Transfer, vol. 30 (2004): 115–127; David C. Mowery et al., “The growth of patenting and licensing by US universities: an assessment of the effects of the Bayh–Dole act of 1980,” Research Policy, vol. 30, no. 1 (2001): 99–119, https://www.sciencedirect.com/science/article/abs/pii/S0048733399001006.
[234]. Howard Markel, “Patents, profits, and the American people—the Bayh–Dole Act of 1980,” New England Journal of Medicine, vol. 369, no. 9 (2013): 794–796, https://www.nejm.org/doi/full/10.1056/nejmp1306553.
[235]. Arora et al., “The changing structure of American innovation.”
[236]. Ashish Arora, Sharon Belenzon, and Andrea Patacconi, “Papers to patents,” Nature, vol. 552, no. 7683 (2017): S10, https://www.nature.com/articles/d41586-017-07421-3.
[237]. John H. Rabitschek and Norman J. Latker, “Reasonable Pricing – A New Twist for March-in Rights Under the Bayh-Dole Act,” Santa Clara Computer & High Tech, LJ 22 (2005): 149; Stephen Ezell, “The Bayh-Dole Act’s Vital Importance to the U.S. Life-Sciences Innovation System” (ITIF, March 2019), https://www2.itif.org/2019-bayh-dole-act.pdf.
[238]. John R. Thomas, “March-In Rights Under the Bayh-Dole Act,” Congressional Research Service, August 22, 2016, https://sgp.fas.org/crs/misc/R44597.pdf.
[239]. Ibid.; Brittany Day, “A Modest Proposal: Leveraging Private Enforcement Mechanisms and the Bayh-Dole Act to Reduce Drug Prices in the US Healthcare Industry,” Duke J. Const. L. & Pub. Pol'y Sidebar 17 (2021): 51, https://scholarship.law.duke.edu/djclpp/vol17/iss1/6/; Jennifer Penman and Fran Quigley, “Better late than never: How the US government can and should use Bayh-Dole March-in rights to respond to the medicines access crisis,” Willamette L. Rev., vol. 54 (2017): 171, https://scholarworks.iupui.edu/items/04b11c99-d6f2-4bd3-87b6-f26e1ed298b1.
[240]. Birch Bayh, “Statement of Birch Bayh to the National Institutes of Health,” May 25, 2014, http://www.essentialinventions.org/drug/nih05252004/birchbayh.pdf.
[241]. Birch Bayh and Bob Dole, “Our Law Helps Patients Get New Drugs Sooner,” The Washington Post, April 11, 2002, https://www.washingtonpost.com/archive/opinions/2002/04/11/our-law-helps-patients-get-new-drugs-sooner/d814d22a-6e63-4f06-8da3-d9698552fa24/?utm_term=.ddbf6876a380.
[242]. Ibid.
[243]. “Fact Sheet: Biden-Harris Administration Announces New Actions to Lower Health Care and Prescription Drug Costs by Promoting Competition,” The White House press release, December 7, 2023, https://www.whitehouse.gov/briefing-room/statements-releases/2023/12/07/fact-sheet-biden-harris-administration-announces-new-actions-to-lower-health-care-and-prescription-drug-costs-by-promoting-competition/.
[244]. Barbara Snyder et al., “Letter to The Honorable Xavier Becerra, U.S. Secretary of Health and Human Services,” July 27, 2022, https://www.aau.edu/sites/default/files/AAU-Files/Key-Issues/Intellectual-Property/FinalLetter7.27.22.pdf.
[245]. Ramon J. Ryan, “Marching Towards Disaster: Examining the Commerce Department’s Administration of the Bayh-Dole Act and Whether March-In Rights Should Be Used to Reduce Drug Costs” (working paper, SSRN 3752916, 2020), https://papers.ssrn.com/sol3/papers.cfm?abstract_id=3752916.
[246]. Ibid.
[247]. Stephen Ezell, “The Bayh-Dole Act’s Vital Importance to the U.S. Life-Sciences Innovation System” (ITIF, May 2019), https://itif.org/publications/2019/03/04/bayh-dole-acts-vital-importance-us-life-sciences-innovation-system/.
[248]. Stephen Ezell, “Biden’s Assertion of Excessive Biopharma Industry Concentration Is a Flawed Rationale for a Flawed Policy” (ITIF, December 2023), https://itif.org/publications/2023/12/11/biopharma-concentration-is-a-flawed-rationale-for-a-flawed-policy/; Robert D. Atkinson and Stephen Ezell, “Five Fatal Flaws in Rep. Katie Porter’s Indictment of the U.S. Drug Industry” (ITIF, May 2021), https://www2.itif.org/2021-porter-drug-industry-indictment.pdf.
[249]. Stephen Ezell, “Biden’s Assertion of Excessive Biopharma Industry Concentration Is a Flawed Rationale for a Flawed Policy,” The Innovation Files, December 11, 2023, https://itif.org/publications/2023/12/11/biopharma-concentration-is-a-flawed-rationale-for-a-flawed-policy/.
[250]. Stephen Ezell, “Comments to the NIST Regarding the Draft Interagency Guidance Framework for Considering the Exercise of March-In Rights” (ITIF, February 2024), https://itif.org/publications/2024/02/06/comments-nist-draft-interagency-guidance-framework-exercise-march-in-rights/.
[251]. Oliver E. Williamson, “Economies as an anti-trust defense: The welfare tradeoffs,” The American Economic Review, vol. 58, no. 1 (1968): 18–36, https://www.jstor.org/stable/1831653.
[252]. Ibid.
[253]. Prescription Drug Price Relief Act of 2021, S. 909, 117th Cong. (2021), https://www.congress.gov/bill/117th-congress/senate-bill/909?s=1&r=6.
[254]. U.S. Code 28, Part IV, Ch. 91, §1498.
[255]. Stephen Ezell, “Losing the Lead: Why the United States Must Again Become a Global Champion for Robust Intellectual Property (IP) Rights” (ITIF, June 2023), https://itif.org/publications/2023/06/12/losing-the-lead-why-united-states-must-reassert-itself-as-global-champion-for-robust-ip-rights/.
[256]. Amy Kapczynski and Aaron S. Kesselheim, “’Government Patent Use’: A Legal Approach To Reducing Drug Spending,” Health Affairs 35, No. 5, 791–797, May 2016, https://www.healthaffairs.org/doi/epdf/10.1377/hlthaff.2015.1120.
[257]. Judge Mary Ellen Coster Williams and Diane E. Ghrist, “Intellectual Property Suits in the United States Court of Federal Claims” (Washington, D.C.: U.S. Court of Federal Claims, October 4, 2017), https://www.uscfc.uscourts.gov/node/2927.
