
Comments to Department of Health and Human Services Regarding the Proposed GLOBE Model
Contents
U.S. Drug Prices Are Not Exorbitant 2
Drug Price Controls Harm Innovation. 7
Flaws in the GLOBE Model Itself 9
Introduction and Summary
ITIF believes the international reference pricing approach envisioned in the GLOBE model is conceptually ill-conceived, fundamentally flawed, and should be withdrawn in full. This submission will contend that drug price controls—whether imposed through international reference pricing approaches or other mechanisms—represent a fundamentally flawed approach to managing the prices Americans pay for drugs. It will then address misgivings regarding the GLOBE model specifically.
U.S. Drug Prices Are Not Exorbitant
Stringent drug price controls—whether embodied through the Inflation Reduction Act (IRA), GLOBE model, or sister Guarding U.S. Medicare Against Rising Drug Costs (GUARD) model—will harm, over both the short and long run, the U.S. biopharmaceutical innovation system and the patients that depend upon the life-improving, -saving, or -extending drugs that system delivers. Some contend that drug price controls are needed because the cost of drugs in the United States has been skyrocketing, but that has not been the case, and certainly so when compared to Americans’ expenditures on other facets of the healthcare system.
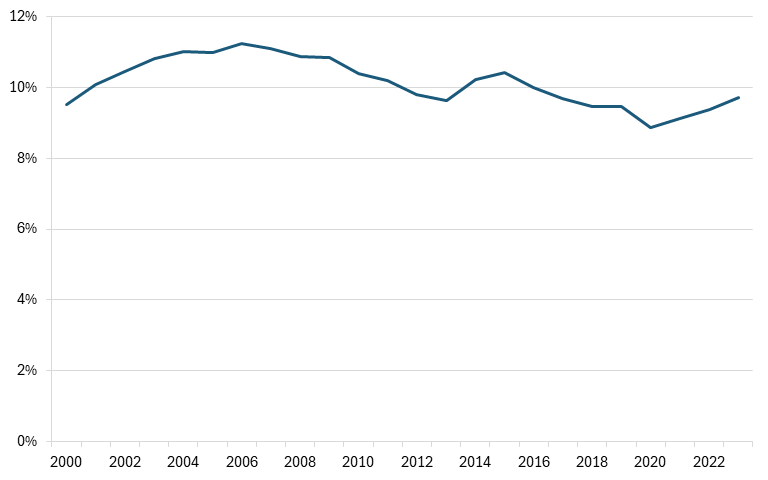
First, medicines account for just 14 percent of U.S. healthcare spending.[1] Moreover, U.S. drug expenditures have been stable over time. For instance, the percentage of total health spending going to prescription drugs in the United States stood at 9.5 percent in 2000 and by 2023 stood at 9.7 percent, a share that was even notably decreased from the 11.2 percent level it reached in 2005. (See Figure 1.)
Figure 1: Percentage of total health spending going to prescription drugs (2000–2023)[2]
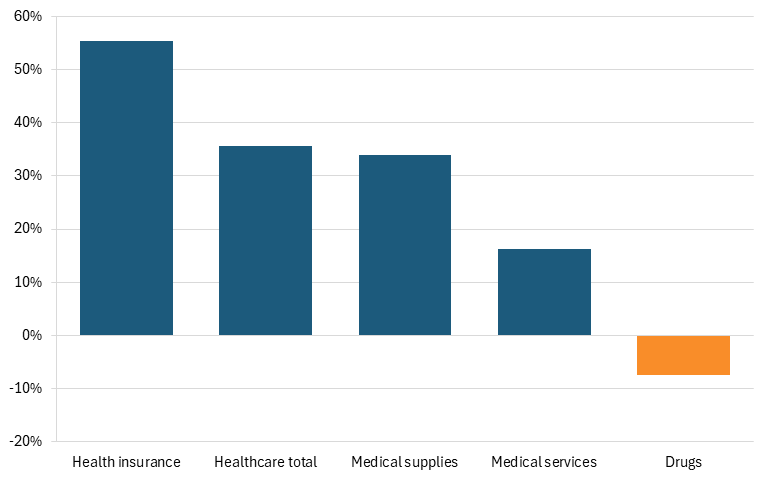
Furthermore, according to U.S. Bureau of Labor Statistics data, Americans’ reported expenditures on health insurance (in nominal dollars) increased by over 127 percent from 2006 to 2024, while their total healthcare expenditures increased 98 percent. While consumers’ expenditures on drugs did increase 35 percent over that time, that was barely more than one-third of the overall increase in healthcare expenditures. Moreover, in real dollars, consumers’ expenditures on drugs actually fell by 7 percent over that time frame, while their total healthcare expenditures increased 36 percent. (See Figure 2.)
Figure 2: Percent change in U.S. consumers’ healthcare expenditures from 2009–2024 (real dollars)[3]
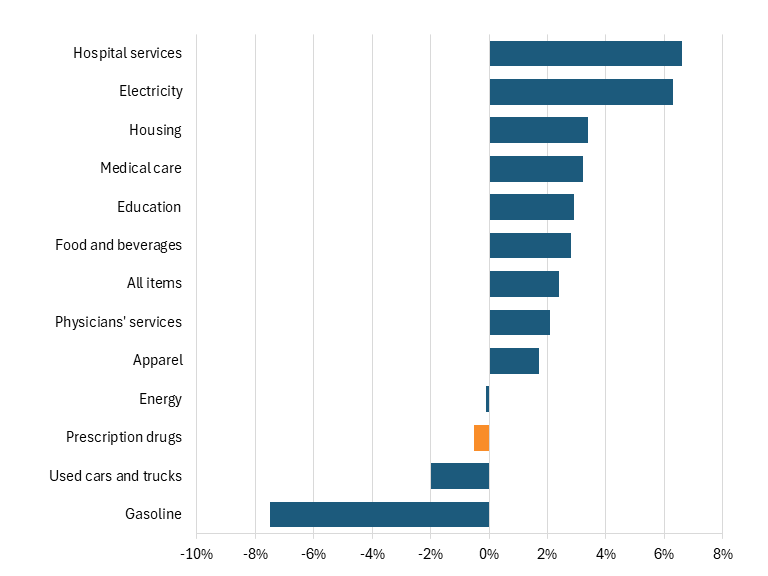
Some contend that rising drug prices have been a core driver of U.S. inflation in recent years. But over the past 12 months (ending in January 2026), prescription drug prices actually fell by 1 percent in the consumer price index, while costs for physician services grew at 2 percent and for hospital services grew 7 percent. (See Figure 3.)
Figure 3: Consumer price index 12-month change (ending in January 2026)[4]
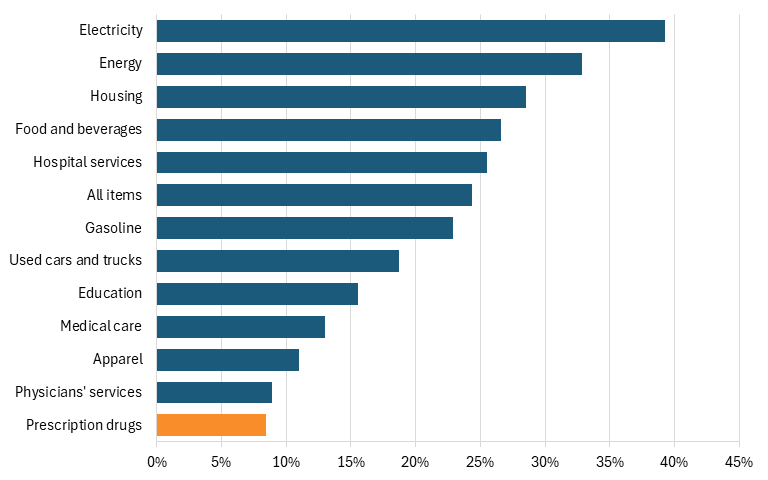
In fact, taking the data further back, to five years, shows that the prices which Americans pay for drugs grew at just one-third the rate they grew for all consumer drugs over that period, at just an 8 percent increase, compared to 24 percent for all items, and a 25 percent increase for hospital services. (See Figure 4.)
Figure 4: Consumer price index, change from January 2021 to January 2026[5]
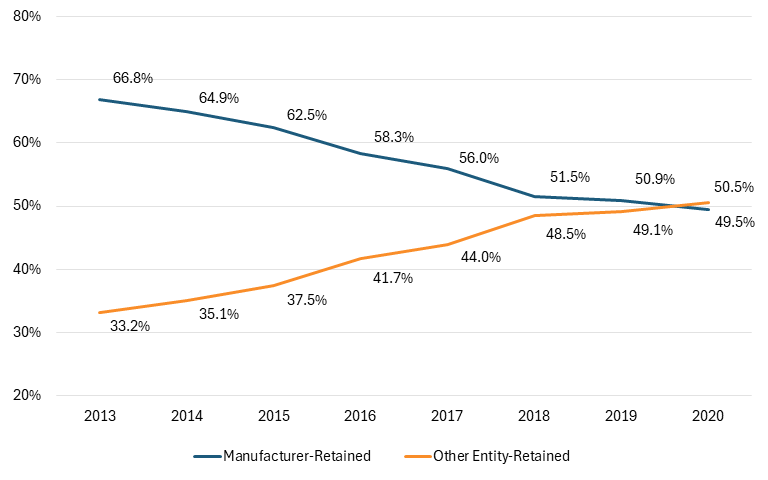
Thus, the reality is that drug prices—after rebates and discounts—have been falling for years, with much of the savings captured by intermediaries such as pharmacy benefit managers (PBMs) rather than patients, as drug developers’ share of each dollar spent on drugs fell from 66.8 percent in 2013 to 49.5 percent in 2020. (See Figure 5.) In other words, more than half of each $1 spent on drugs in the United States today goes to intermediaries, not to the companies actually innovating and manufacturing medicines. A far better way to tackle drug prices than implementing innovation-harming drug price controls would be to reduce the amounts going to intermediaries such as PBMs, wholesalers, and insurers.
Figure 5: Total gross expenditures for brand medicines received by manufacturers and other stakeholders (2013–2020)[6]
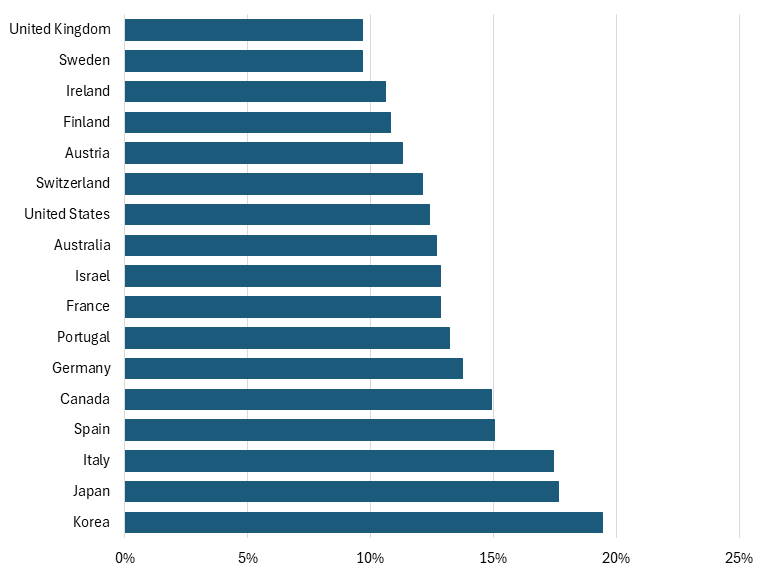
Lastly, while it is true that, on average, Americans do pay more for their drugs than citizens of other nations, it’s not true that pharmaceutical spending as a percentage of total health spending is significantly greater in the United States than in other Organization for Economic Cooperation and Development (OECD) nations. Indeed, on that measure, the United States is middle-of-the pack among OECD nations (at 12 percent), and well below the share for other countries such as Germany, Canada, Japan, and Korea. (See Figure 6.)
Figure 6: Pharmaceutical spending as a percentage of total health spending, 2023 (or latest available year)[7]
Drug Price Controls Harm Innovation
There exists an inherent linkage between biopharmaceutical companies’ ability to earn profits and their ability to invest in research and development (R&D) for the next generation of innovation, which is why most academic studies find strong positive links between industry returns and R&D investments.[8] One study, for example, found a statistically significant positive relationship between a biopharma firm’s profits from the previous year and its R&D expenditures in the current year.[9] Another showed that sales revenue from previous periods has a significant, positive impact on current-period biopharma R&D.[10] Other work has found that the pharmaceutical firms with the greatest sales have the largest R&D investments.[11] And this can translate into launched drugs, as a 2015 paper found that every $2.5 billion of additional biopharmaceutical revenue leads to one new drug approval.[12]
This explains why academic studies consistently reaffirm that a reduction in current drug revenues leads to a decrease in future research and the number of new drug discoveries.[13] For instance, one study found that a real 10 percent decrease in the growth of drug prices would be associated with an approximately 6 percent decrease in pharmaceutical R&D spending as a share of net revenues.[14] Similarly, Lichtenberg found that a 10 percent decrease in cancer drug prices would likely cause a 5 to 6 percent decline in both cancer regimens and research articles.[15] Likewise, Golec and Vernon show that if the United States had used a European Union (EU)-like drug pricing system from 1986 to 2004, this would have resulted in a decline in firms’ R&D expenditures of up to 33 percent and the development of 117 fewer new medicines.[16] Similarly, Maloney and Civan found that a 50 percent drop in U.S. drug prices would result in the number of drugs in the development pipeline decreasing by up to 24 percent.[17] Similarly, Abbot and Vernon estimated that a price cut of 40 to 45 percent in real terms would reduce the number of new development projects by 50 to 60 percent.[18] A Health Affairs study further estimated that such a policy would hurt future U.S. generations and impose a cost of $8 trillion on the United States.[19] Most recently, 2021 research by Tomas Philipson and Troy Durie at the University of Chicago estimated that a 1 percent reduction in pharmaceutical industry revenue leads on average to a 1.54 percent decrease in R&D investment.[20]
Conversely, research by Schwartz et al. found that if government price controls in non-U.S. OECD countries were lifted, the number of new treatments available would increase by 9 to 12 percent by 2030, equivalent to 8 to 13 new drugs in that year. This could potentially increase the life expectancy of someone 15 years old today by 0.6 to 1.6 years on average.[21] Instead of copying other OECD countries in a “reference-price-race-to-the-bottom,” U.S. policy should instead be to encourage peer countries to appropriately value innovative medicines.
The Inflation Reduction Act’s Harm to U.S. Biopharmaceutical Innovation
In August 2022, Congress passed the Inflation Reduction Act, which granted, for the first time, federal authority to the Centers for Medicare & Medicaid Services to control prices for selected drugs targeting a wide range of diseases, including diabetes, heart disease, and cancer.[22] While the intent was to make medicines more affordable for seniors, the early effects of the policy suggest significant risks for innovation. Indeed, since the IRA’s drug-pricing framework was first drafted in 2021, venture funding for small-molecule R&D has fallen roughly 70 percent.[23] Moreover, a PhRMA survey of biopharmaceutical companies found that 78 percent of them expect to cancel early-stage small-molecule projects.[24] Nearly two-thirds reported they plan to shift R&D away from small molecules entirely. This matters because small-molecule drugs are essential for conditions including neurogenerative and cardiovascular diseases that disproportionately affect older Americans. Another study found that the number of therapies in phase I and phase II of development declined 35 percent from 2021 to 2023 among small and midsize biotech companies, with analysts projecting fewer U.S. Food and Drug Administration (FDA) approvals five to six years from now.[25]
Estimates of long-run effects are even more concerning. A 2021 University of Chicago study projected that IRA-style price controls would reduce pharmaceutical R&D by 45 percent between 2021 and 2039, leading to 254 fewer new medicines and large long-term mortality impacts.[26] A 2023 U.S. Chamber of Commerce report further demonstrated that price controls could sharply reduce funding for clinical trials. The United States outperforms OECD peers by 42 to 220 percent in clinical research activity. IRA-style price controls could cut early-phase projects by 50 percent, including deep reductions in research on biologics (59 percent) and cancer (54 percent).[27]
In short, the IRA’s drug price controls—even applying to a limited set of Medicare Part D drugs initially (10 in 2023 and 15 more in 2025)—have already generated significantly deleterious effects for U.S. biopharmaceutical innovation. The last thing the Trump administration should be doing is expanding these flawed approaches.[28]
The Trump Administration Should Prioritize Getting Other Countries to Pay Their Fair Share for Innovative Medicines
While, as noted, it’s true that Americans pay more for their drugs than their European (or other OECD) counterparts, the solution to that issue should be to prevail upon America’s trading partners to pay more for the drugs they consume, not to import their flawed drug pricing models to the United States.[29] Indeed, as ITIF has written, the extensive use of drug price controls in European nations and in Japan played a catalytic role in significantly shrinking the extent of biopharmaceutical innovation—and the size of the biopharmaceutical industry and extent of employment—in those countries.[30] The United States should not be implementing the same failed approach.
Moreover, the international reference-style pricing approach embodied in the GLOBE model—by importing foreign government price controls into the U.S. market—would actually undermine the administration’s efforts to prevail upon other countries to pay more for their medicines. Indeed, rather than encouraging other countries to contribute more, it would entrench globally suppressed prices, weakening incentives for innovation and eroding the biopharmaceutical innovation system on which patients worldwide depend.
Flaws in the GLOBE Model Itself
In setting prices, GLOBE references 19 non-U.S. OECD countries that have a gross domestic product (GDP) per capita within at least 60 percent of the United States and an annual GDP of at least $400 billion (on a purchasing power parity basis). The countries referenced are: Australia, Austria, Belgium, Canada, the Czech Republic, Denmark, France, Germany, Ireland, Israel, Italy, Japan, the Netherlands, Norway, South Korea, Spain, Sweden, Switzerland, and the United Kingdom. But it’s not just that reference pricing would import these countries’ low drug prices, it would also import their undesirable use of quality adjusted life years (QALYs), as 16 of the 19 referenced countries use QALYs.
But, as ITIF has written, “QALYs discriminate against the disabled, seniors, the chronically ill and communities of color; for instance, a QALY for a patient with multiple sclerosis can be worth half as much as a healthy, young individual, and a person over the age of 70 is worth approximately 30 percent, simply due to their age.”[31] Moreover, Congress has expressly prohibited the use of QALYs by many federal programs to avoid discriminatory impacts.[32] That reflects public polling suggesting that the majority of (surveyed) Americans oppose the use of QALYs in healthcare decision-making.[33] Unfortunately, using international reference pricing would represent a backdoor to bringing the use of QALYs into factoring how American drug prices are determined.
Furthermore, the most-favored nation pricing approach envisioned in GLOBE wouldn’t actually help seniors afford their medicines. For instance, Avalere Health found that only 0.3 percent of sampled Medicare Part B fee-for-service (FFS) beneficiaries would be directly exposed to changes in out-of-pocket cost liability under the proposed GLOBE Model methodology, assuming the model applied to the 62 Part B drugs identified in the proposed rule.[34] Savings might go to the government, but the vast majority of seniors wouldn’t experience lower out-of-pocket costs as a result of the GLOBE model.
Moreover, per Congressional statute, CMS’s Innovation Center has been charged with conducting payment and delivery “tests,” which must be limited in scope in the initial phases. But the envisioned MFN-based GLOBE model certainly doesn’t constitute any kind of limited “test” or “experiment.” That’s because CMS states that manufacturer participation is mandatory for all manufacturers of GLOBE model drugs that receive a Part B inflation rebate report during an applicable period that overlaps with the GLOBE model performance period. Mandating broad participation simply does not reflect a test that’s limited in scope.
Lastly, while it’s true that the U.S. biopharmaceutical industry currently leads the word in biopharmaceutical innovation, it’s not inevitable that that leadership position continually endures, especially in the face of an increasingly worrying U.S. policy landscape (e.g., drug price controls, reduced science funding, threats to use Bayh-Dole march-in rights, etc.) and the increasingly intensifying competitive threat posed by China.
For instance, from 2017 to 2021, the number of clinical trials taking place in China more than doubled—from 3,000 to 6,500—such that now China accounts for one-third of global clinical trials. China has surpassed Europe and is now only a couple percentage points behind the United States in share of global new clinical trials starts, by company location.[35] The time it takes to secure approval for human trials in China has shrunk from 501 days to 87, such that now Chinese firms can take a drug from discovery to the start of human trials in about half the global industry’s average time.
Overall, the growth in Chinese innovative drugs under development has increased more than 200 percent since 2020, over two times the growth rate of novel U.S. drugs. Today, about 40 percent of China’s drug pipeline is now innovative or fast-follower drugs. Moreover, the number of outlicensing deals has more than doubled since 2019 (from 15 in 2019 to 33 in 2023), and that’s especially true in oncology. In short, Chinese firms are no longer just importing molecules; they’re exporting them.[36] In total, China’s share of global value added in biopharmaceuticals grew four-fold from 2002 to 2019, from 5.6 percent to 24.2 percent.[37]
In other words, China represents an increasingly fierce competitor in the global biopharmaceutical industry, and the United States must take this threat seriously. The last way the United States should respond is by doubling down on the use of drug price controls.
Conclusion
In summary, the international reference pricing-based GLOBE model lacks a sound premise for its rationale, is fundamentally flawed in its design, and should be withdrawn in full by CMS.
Thank you for your consideration.
Endnotes
[1]. “Drug Expenditure Dynamics 1995-2020: Understanding Medicine Spending in Context,” (IQVIA Institute for Human Data Science, 2021), https://www.iqvia.com/-/media/iqvia/pdfs/institute-reports/drug-expenditure-dynamics/drug-expenditure-dynamics-19952020.pdf.
[2]. Organization for Economic Cooperation and Development, (Health expenditure and financing, prescription drugs and total expenditure, 2020 PPP adjusted constant prices; accessed February 20, 2026), https://shorturl.at/f7ORq.
[3]. Bureau of Labor Statistics, Consumer Expenditure Survey (Healthcare expenditures, 2009-2024), accessed February 11, 2026, https://www.bls.gov/cex/.
[4]. Bureau of Labor Statistics, (Consumer price index; accessed February 20, 2026), https://data.bls.gov/pdq/SurveyOutputServlet.
[5]. Bureau of Labor Statistics, (Consumer price index 2021-2026; accessed February 20, 2026), https://data.bls.gov/pdq/SurveyOutputServlet.
[6]. Andrew Brownlee and Joran Watson, “The Pharmaceutical Supply Chain, 2013-2020” (Berkeley Research Group, 2022), 3, https://www.thinkbrg.com/insights/publications/pharmaceutical-supply-chain-2013-2020/.
[7]. Organization for Economic Cooperation and Development, (Health expenditure and financing, pharmaceuticals and total expenditure, 2020 PPP adjusted constant prices; accessed February 20, 2026), https://shorturl.at/LAbUr.
[8]. Joe Kennedy, “The Link Between Drug Prices and Research on the Next Generation of Cures” (ITIF, September 2019), https://itif.org/publications/2019/09/09/link-between-drug-prices-and-research-next-generation-cures/.
[9]. Destrina Grace Simanjuntak and Raymond R. Tjandrawinata, “Impact of Profitability, R&D Intensity, and Cash Flow on R&D Expenditure in Pharmaceutical Companies” (working paper, Social Science Research Network, April 29, 2011), http://papers.ssrn.com/sol3/papers.cfm?abstract_id=1824267.
[10]. Alfonso Gambardella, Science and Innovation: The US Pharmaceutical Industry During the 1980s (Cambridge University Press, 1995).
[11]. Rebecca Henderson and Iain Cockburn, “Measuring Competence? Exploring Firm Effects in Pharmaceutical Research” Strategic Management Journal Vol. 15, No. S1 (1994): 63–84,
https://doi.org/10.1002/smj.4250150906.
[12]. Pierre Dubois, “Market size and pharmaceutical innovation” The Rand Journal of Economics Vol. 46, No. 4 (October 2015): 844–871, https://onlinelibrary.wiley.com/doi/full/10.1111/1756-2171.12113.
[13]. Kennedy, “The Link Between Drug Prices and Research on the Next Generation of Cures.”
[14]. Carmelo Giaccotto, Rexford E. Santerre, and John A. Vernon, “Drug Prices and Research and Development Investment Behavior in the Pharmaceutical Industry” The Journal of Law & Economics Vol. 48, Issue 1 (April 2005), https://www.jstor.org/stable/10.1086/426882.
[15]. Frank R. Lichtenberg, “Importation and Innovation,” (NBER Working Paper No. 12539, September 2006), https://www.nber.org/papers/w12539.
[16]. Joseph Golec and John A. Vernon, “Financial Effects of Pharmaceutical Price Regulation on R&D Sending by EU Versus US Firms” Pharmacoeconomics, Vol. 28, Issue 8 (2010): 625, https://pubmed.ncbi.nlm.nih.gov/20617857/. All cost estimates were converted to 2019 dollars using the consumer price index.
[17]. Michael T. Maloney and Abdulkadir Civan, “The Effect of Price on Pharmaceutical R&D,” SSRN Electronic Journal Vol. 9, Issue 1 (2009): 1–14, https://ssrn.com/abstract=995175 or http://dx.doi.org/10.2139/ssrn.995175.
[18]. Thomas A. Abbott and John A. Vernon, “The Cost of U.S. Pharmaceutical Price Reductions: A Financial Simulation Model of R&D Decisions,” NBER Working Paper No. 11114 (February 2005), https://www.nber.org/papers/w11114.
[19]. Darius Lakdawalla et al., “U.S. Pharmaceutical Policy In A Global Marketplace,” Health Affairs Vol. 27 no. supplement 1 (2008).
[20]. Tomas J. Philipson and Troy Durie, “Issue Brief: The Impact of HR 5376 on Biopharmaceutical Innovation and Patient Health” November 9, 2021, https://cpb-us-w2.wpmucdn.com/voices.uchicago.edu/dist/d/3128/
files/2021/08/Issue-Brief-Drug-Pricing-in-HR-5376-11.30.pdf.
[21]. Taylor T. Schwartz et al., “The Impact of Lifting Government Price Controls on Global Biopharmaceutical Innovation and Population Health” (Precision Health Economics, 2018), https://tools.ispor.org/research_pdfs/58/pdffiles/PHP216.pdf.
[22]. Centers for Medicare & Medicaid Services, “Medicare Drug Price Negotiation Program: Selected Drugs for Initial Price Applicability Year 2026,” Medicare Drug Price Negotiation Program (August 2023), https://www.cms.gov/files/document/fact-sheet-medicare-selected-drug-negotiation-list-ipay-2026.pdf.
[23]. Duane Schulthess et al., “The Inflation Reduction Act’s Impact upon Early-Stage Venture Capital Investments,” Therapeutic Innovation & Regulatory Science, (2025), https://www.medrxiv.org/content/10.1101/2025.01.07.25320113v1.
[24]. “Inflation Reduction Act Already Impacting R&D”, PhRMA, https://cdn.aglty.io/phrma/global/resources/import/pdfs/Infographic%20%20Inflation%20Reduction%20Act%20Already%20Impacting%20RD%20%20010923%20FINAL.pdf.
[25]. “Inflation Reduction Act – Two Years On; Investor Behavior, R&D Impacts, & Proposed Solutions,” Vital Transformation, https://vitaltransformation.com/2025/04/inflation-reduction-act-two-years-on-investor-behavior-rd-impacts-proposed-solutions/.
[26]. Tomas J. Philipson and Troy Durie, “The evidence base on the impact of price controls on medical innovation” (working paper, Becker Friedman Institute, University of Chicago, 2021), https://bfi.uchicago.edu/working-paper/the-evidence-base-on-the-impact-of-price-controls-on-medical-innovation/.
[27]. “From Innovation Oasis to Research Desert: The Impact of Price Controls on Clinical Research and Development,” (U.S. Chamber of Commerce, 2023), https://www.uschamber.com/assets/documents/From-Innovation-Oasis-to-Research-Desert-USCC.pdf.
[28]. Stephen Ezell, Leah Kann, and Sandra Barbosu, “The Inflation Reduction Act Is Negotiating the United States Out of Drug Innovation” (ITIF, February 2025), https://itif.org/publications/2025/02/25/the-inflation-reduction-act-is-negotiating-the-united-states-out-of-drug-innovation/.
[29]. Trelysa Long and Stephen Ezell, “The hidden toll of drug price controls: Fewer new treatments and higher medical costs for the world,” (ITIF, July 2023), https://itif.org/publications/2023/07/17/hidden-toll-of-drug-price-controls-fewer-new-treatments-higher-medical-costs-for-world/.
[30]. Stephen Ezell, “Going, Going, Gone? To Stay Competitive in Biopharmaceuticals, America Must Learn From Its Semiconductor Mistakes” (ITIF, November 2021), https://itif.org/publications/2021/11/22/going-going-gone-stay-competitive-biopharmaceuticals-america-must-learn-its/; Stephen Ezell, “How Japan Squandered Its Biopharmaceutical Competitiveness: A Cautionary Tale” (ITIF, July 2022), https://itif.org/publications/2022/07/25/how-japan-squandered-its-biopharmaceutical-competitiveness-a-cautionary-tale/.
[31]. Stephen Ezell, “Responses to Questions for the Record: Prescription Drug Price Inflation: An Urgent Need to Lower Drug Prices in Medicare” (ITIF, March 2022),https://www2.itif.org/2022-senate-finance-drug-pricing-qfr.pdf.
[32]. Dominique Seo, Kenneth E. Thorpe, and T. Joseph Mattingly II, “The QALY Paradox: An Unintended Consequence Of Most Favored Nation Drug Pricing” Health Affairs, February 18, 2026, https://www.healthaffairs.org/content/forefront/qaly-paradox-unintended-consequence-most-favored-nation-drug-pricing.
[33]. Partnership to Improve Patient Care, “NEW POLL: Voters Oppose the Use of QALYs in Health Care Decision Making,” November 23, 2021, https://www.pipcpatients.org/resources/new-poll-voters-oppose-the-use-of-qalys-in-health-care-decision-making.
[34]. Avalere Health, “How MFN Pricing in Part B May Affect Beneficiary OOP Costs,” January 21, 2026, https://advisory.avalerehealth.com/insights/how-mfn-pricing-in-part-b-may-affect-beneficiary-oop-costs.
[35]. “Chinese pharma is on the cusp of going global,” The Economist, November 23, 2025, https://www.economist.com/china/2025/11/23/chinese-pharma-is-on-the-cusp-of-going-global.
[36]. Sandra Barbosu, “How Innovative Is China in Biotechnology?” (ITIF, July 2024), https://itif.org/publications/2024/07/30/how-innovative-is-china-in-biotechnology/.
[37]. National Science Foundation, Science & Engineering Indicators, Production and Trade of Knowledge- and Technology-Intensive Industries, Table SKTI-9: Value added of pharmaceuticals industry, by region, country, or economy: 2002–19; accessed May 5, 2024, https://ncses.nsf.gov/pubs/nsb20226/data.
Related
February 23, 2026
