
The Digital Inclusion Outlook: What It Looks Like and Where It’s Lacking
Achieving digital inclusion requires a comprehensive understanding of the digital divide and standardized methods for addressing related topics such as reasons for nonadoption and digital illiteracy—but in getting people online, individualized approaches are the way to go.
KEY TAKEAWAYS
Key Takeaways
Contents
Introduction: The Digital Divide. 2
Reasons for Nonadoption: NTIA’s Internet Use Survey 3
Addressing Price as a Barrier 5
Closing the Divide with Digital Inclusion. 6
The Digital Literacy Landscape 9
How Digital Literacy Fits Within Digital Inclusion. 12
Best Practices for Digital Literacy 13
The Importance of Digital Navigators 15
Comparing NTIA’s Internet Use Survey With Pew’s 17
Introduction: The Digital Divide
Both the individual and society as a whole benefit as more people go online. Societal institutions that run the gamut from health care to education to work to finance offer online versions that are frequently cheaper and more accessible than their in-person alternatives. In a rapidly digitizing society, lack of connectivity results in both significant disadvantages suffered by individuals that don’t use the Internet and economic losses to society.
Plenty of resources are inequitably distributed. But the digital divide is unique because it is relatively newer than other inequities, and because technology has the potential to stretch limited resources, transcend physical limitations, and overall increase equity in society. On the other hand, dividing lines between broadband haves and have-nots, since they often follow the same patterns as other instances of inequity, risk simply exacerbating existing disadvantages rather than mitigating them. This is why working to ensure that everybody has the opportunity to get online—in short, advancing digital inclusion—is a key mandate of the 21st century.
With all that said, it is unlikely that we will ever see 100 percent connectivity rates. This is likely true even if we achieve 100 percent broadband deployment rates—which the United States is very close to realizing with the advent of low-earth orbit (LEO) satellite broadband—because adoption will probably always lag behind deployment. The United States is a large, diverse country, home to a large, socioeconomically and demographically diverse population. The elderly population has seen life without an Internet connection and many see no real reason to adopt it now. Some people face structural barriers such as incompatible housing situations. And many people choose not to subscribe to a home broadband connection simply because they are not interested.
While this means aiming for truly ubiquitous connectivity may be unrealistic, there are aspects of the current U.S. state of adoption that suggest it needs improvement. In particular, marginalized groups are overrepresented among nonadopters, and some existing barriers to adoption would be solvable with the right approach. Even when it appears to be due to a true lack of interest, high nonadoption rates among traditionally underserved communities are not a good outcome for society and are therefore deserving of a closer look and efforts to lower them.
Dividing lines between broadband haves and have-nots, since they often follow the same patterns as other instances of inequity, risk exacerbating existing disadvantages rather than mitigating them.
Because the problem to be solved is so complex, successful efforts to get people online must reflect that complexity. We need a thorough understanding of the myriad reasons for nonadoption and the multiple approaches for solving it. The most effective digital inclusion efforts need to follow a few important ground rules. But above all else, they need to effectively target the sources of the problem. That starts with fully understanding the situation as it is.
Reasons for Nonadoption: NTIA’s Internet Use Survey
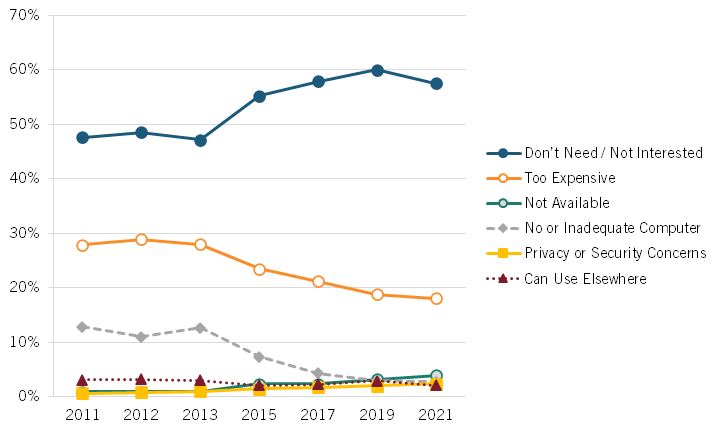
The National Telecommunications and Information Administration’s (NTIA) Internet Use Survey, which is periodically administered through the Census Bureau’s Current Population Survey (CPS), is the most authoritative source for reasons for nonadoption—“adoption” being the choice to subscribe to a home broadband connection.[1] One group the survey tracks is the households without home Internet. Through a questionnaire, NTIA groups respondents by their cited reason for nonadoption. There are six reasons respondents can choose from: lack of availability, the price of an Internet subscription, privacy or security concerns, the ability to use the Internet elsewhere, lack of a computer, and lack of interest or need.
Figure 1: Reasons for nonadoption reported in NTIA’s Internet Use Survey (2011–2021)
From a policy perspective, the disconnected can be lumped into two sub-groups. While there are those who would adopt but don’t have broadband services available to their home, there are also the true nonadopters: those who have service available but choose not to adopt it for some other reason. For the former group, policies geared toward deployment are needed—and any remaining coverage gaps are set to be closed with the emergence of LEO satellite broadband and the $42.5 billion allocated through NTIA’s Broadband Equity, Access, and Deployment (BEAD) program.[2] For the latter, the focus should be on boosting subscription rates. It is this second group, the nonadopters, that is the subject of this report.
There is significant evidence that the main cause of the digital divide is now on the adoption side and not due to a lack of networks. NTIA statistics for 2021—the most recent iteration—find only 3.9 percent of responding households citing lack of availability as their reason for not being online.[3] Federal Communications Commission (FCC) data collected directly from providers similarly shows that the vast majority of the country has coverage.[4] Though claims have been made that FCC data overstates connectivity, a more granular mapping process is underway and should recognize any such gaps.[5] Likewise, in addition to the advent of high-quality satellite broadband, tens of billions of dollars in infrastructure funding have been earmarked to cover any remaining infrastructure inadequacies. Going forward, the national challenge will be broadband adoption.
There is significant evidence that the main cause of the digital divide is now on the adoption side and not due to lack of networks.
A closer look at the nonadopters shows they can be broken into two groups as well. There are those who cite some specific reason for nonadoption—often a barrier—that could feasibly be addressed. NTIA’s questionnaire allows for reasons related to the price of broadband, privacy or security concerns, the ability to use the Internet elsewhere, and lack of an adequate computer. Of this first group, price is the most commonly given reason at 18.1 percent, although that share has been declining.[6] Lack of a computer used to be a significant reason but has also steeply declined over the last decade. It now sits at a low 2.7 percent, about on par with privacy or security concerns and the ability to use the Internet elsewhere.
In contrast, the second group cites no barrier and instead expresses no interest or no need to be online at all. In the 2021 iteration of NTIA data, 57.5 percent of offline households cited lack of need or interest as the most important reason—the highest by a wide margin. It is this group—the “not interested” group—that has consistently constituted the majority of nonadopters since 2015.[7]
Problems With NTIA Data
There is plenty of room for confusion over the details of NTIA’s assessment, though it’s the best starting place for understanding the nonadoption landscape. The different answers among which respondents can choose are not perfect substitutes, but rather are highly interrelated and not mutually exclusive. For example, a household that cites “availability elsewhere” is still choosing not to buy home broadband for some reason, maybe because the price of a subscription or computer is too high, or because no networks reach their home. It is also, of course, very possible that none of those barriers exist, and the respondent simply has—from their own perspective—easy enough access to broadband at, say, a public library down the street, that even the effort necessary to apply for a free plan at home would simply not be worth it to them. But there is nothing conveyed about that secondary reason within the scope of the response “availability elsewhere.” Nor are all reasons equally an obstacle to be overcome in the same sense. The availability of Internet outside the home, for example, while not as good as having home Internet, might be the best option for a particularly price-sensitive household, or somebody in an unstable housing situation, that at least grants them reliable access of some form when necessary.
The “not interested” group is particularly stymying. From a societal perspective, it is better to have everybody online. However, we should also respect an individual’s choice not to connect, though we should pay close attention when those choosing not to connect appear to all be lower-income or some other vulnerable group. Indications of some broader problem within the broadband marketplace and systemic factors separate from the broadband marketplace that are disproportionately leaving marginalized parts of the population offline are deserving of a closer look, though the solution there is still not to force people online.
Addressing Price as a Barrier
From a policy, though not a resource, perspective, the price problem is perhaps the simplest to address. U.S. broadband is priced quite competitively in most datasets that take relevant factors into account. But just as large subsets of the population struggle to afford necessities such as food and housing, a large-enough segment of the population views price as the biggest barrier that it rises to second place in reasons for nonadoption, at 18.1 percent.[8]
This isn’t to say the best policy solution for that group would simply try to lower prices. There are plenty of signals that broadband in the United States is relatively competitively priced: It’s outpaced by inflation, net margins for telecom providers are slimmer than those of utilities, and U.S. prices stack up fairly well against those of peer nations when income is taken into account.[9] Moreover, datasets that account for cost-side factors such as demand and geography and consider factors such as network quality tend to rank U.S. prices as relatively much more affordable than do untreated analyses.[10]
The most effective subsidies are flexible and applicable to the area of a consumer’s choosing—whether that is a computer, the cost of the broadband plan, or a digital skills class—and have as streamlined an application process as possible. It is also important to note that price as a barrier is falling over time, down from 23.5 in 2015 to 18.1 in 2021.[11] With the advent of programs such as Lifeline (which was modernized in 2016 to include broadband) and the Affordable Connectivity Program (ACP), which debuted during the COVID-19 pandemic as the Emergency Broadband Benefit Program (EBB), policymakers have made strides in broadband financial assistance policies by offering individualized subsidies on the consumer side.[12]
The most effective subsidies are flexible and applicable to the area of a consumer’s choosing—whether that is a computer, the cost of the broadband plan, or a digital skills class—and have as streamlined an application process as possible. The ACP checks many of these boxes, but it is projected to run out of funding in the near future, so shoring up that funding should therefore be a top policy priority. Many private Internet service providers (ISPs) also offer free or low-cost plans to eligible households through programs such as Access from AT&T, Verizon Forward, and T-Mobile’s Metro program.[13] So the price group, while still a key area of concern, appears to be on the right track.
The most significant remaining barrier to low-cost broadband uptake is consumers’ awareness of, and willingness to sign up for, low-cost plans. A Boston Consulting Group (BCG) survey commissioned by Comcast in 2021 finds that respondents who were unwilling to sign up for even no-cost broadband plans generally fell into four camps: Some of them were simply unaware of the program.[14] Some of them were unclear about the application process, citing confusion over anything from eligibility requirements to the logistics of the application itself. Some respondents were apprehensive about some stage of the process, stemming from concerns about data privacy—especially when the application involved sensitive information such as a Social Security number—or were biased against free services for being inherently substandard or not actually free (in which case the households expected some form of future cost to crop up despite the marketing).[15] The final group cited more structural limitations nonspecific to broadband: Language barriers, for example, and residence at an unofficial address (e.g., a home divided into multiple living quarters but registered as a single address) could both present insurmountable barriers to adoption even in the case of a free broadband plan.
The survey identifies some potential ways to address these hesitations through moves such as guaranteeing transparency in all fees associated with a low-cost plan and streamlining application processes as potential solutions.[16]
However, we can see a broader trend in the households that reject even no-cost plans, in NTIA’s “not interested” group, and even the general ambivalence toward home broadband that’s suggested by those who are content with an available public connection. It seems that there are reasons for nonadoption at play distinct from the simpler barriers of availability and cost. This signals the need for a policy approach that does something other than try to lower prices or build networks to people’s homes.
Closing the Divide with Digital Inclusion
Digital inclusion is the umbrella under which exist various efforts to bring people online. This can range from training individuals in digital literacy to bringing low-cost plans to entire communities. Because the definition is so broad, digital inclusion practices are varied and myriad. However, many of them share a few key traits that are being highlighted as digital inclusion becomes prominent in the policy sphere. Recent programs based around digital inclusion—particularly through the Digital Equity Act—have garnered significant attention, and the Communications Equity and Diversity Council has been working to understand the landscape and advise the FCC on best practices.[17]
The first important trait of effective digital inclusion efforts is flexibility. At this point, the remaining offline groups have shown themselves unable to be reached through existing methods and therefore require a more individualized touch.[18] Flexibility helps point limited resources in the most effective way to individual problem areas. The flip side of that is at the higher levels, cohesion and uniformity can be quite important—for example, consistent data is key to informing the digital inclusion process, and high-level standards for what digital inclusion looks like should be consistent across large areas, even if the precise means of achieving those standards vary depending on local need.
For example, Washington became the first state to pass legislation creating standards and best practices for digital citizenship, Internet safety, and media literacy education in 2016.[19] School districts are tasked with annually reviewing their policies and procedures on electronic resources and Internet safety, which includes soliciting the input of students, parents, teachers, and community representatives knowledgeable in digital literacy; optionally relying on the standards and best practices developed by the state school directors’ association; and considering ways to involve parents in digital literacy curricula.
Similarly, Connecticut has published a guidance document on digital learning for districts to use as necessary; it highlights common policies that have been successful among Connecticut districts and other resource and standards documents. Communities are allowed to fine-tune policies and objectives to fit their specific needs, though digital education policies must meet the state’s academic standards.[20]
Flexibility helps point limited resources in the most effective way to individual problem areas, but at the higher levels, cohesion and uniformity can be quite important. At the highest level, the International Society for Technology in Education (ISTE), a global community of advocates for technology in education, has put forth standards for technological competency on the part of both students and educators.[21] These standards are updated as necessary and have been adopted in every U.S. state and in countries around the world. They cover topics such as empowering students to use technology to learn, solve problems, and collaborate with others while understanding how to navigate technology safely.
Bodies promoting digital literacy standards ties into a second common theme in digital inclusion: the importance of collaboration and partnerships. The need for collaboration exists between different levels of government whose different perspectives leave them best suited for different tasks. Local governments, for example, are intimately aware of their communities’ individual needs, but systems of broader governance at the state level can better determine relative resource allocation. A state can also minimize waste by proliferating a successful local program statewide, or identifying a viable national option, rather than leaving every locality to recreate the same thing.
There are already many programs in existence that can be adjusted to suit individual needs. Northstar, which is widely used by thousands of organizations across all 50 states, is a platform that provides assessments, curricula, and individualized online learning in addition to standards for both specific digital skills and everyday use of technology.[22] It also customizes its strategies to match states’ individual digital equity plans and areas of need. A public library that subscribes to a platform such as this and only makes the necessary adjustments, rather than attempting to build out its own from scratch, is conserving resources that can be better spent on local outreach.
Collaboration and partnerships are also important between organizations with different skill sets, especially when those organizations already have preexisting roots in their communities. For example, channeling digital inclusion efforts through institutions with high community trust and engagement such as schools, libraries, social service agencies, and faith-based organizations can ameliorate the need to build new relationships and maximize the effectiveness of resources.[23]
Reliance on community institutions also helps identify at-risk groups most in need of digital inclusion efforts, as those groups are often already connected to an institution. For example, social service agencies exist chiefly to extend resources and assistance to vulnerable populations. One critical area here is post-prison reentry: This group already faces barriers to reemployment after release, and a widening skills mismatch between people and jobs only compounds the problem. Here, too, institutions such as probation offices have preexisting relationships with the community in need that could potentially be used to advance digital inclusion.
APDS, for example, is an ed-tech corporation that puts tablets and career-readiness courses such as cloud certification inside prisons.[24] It completed a cloud certification pilot program in Washington, D.C. in 2023, and 85 percent of participants passed that certification program and were left significantly better prepared for the labor market upon release.[25] This type of program is a good example of digital inclusion being built into the very system that often contributes to digital exclusion in order to counteract that exclusion at its root.
Measuring programs by performance metrics is key to ensuring the most evidence-based assessment of programs’ effectiveness, and this style of data-based assessment needs to be built into all programs at the outset to allow ongoing, iterative improvement.
A final critical part of digital inclusion programs is the need for accurate data.[26] Technology will keep changing, and the most effective programs will function as frameworks that can be tweaked as situations change over time, not minutia-heavy checklists that will have to be rewritten. The digital inclusion program Tech Goes Home (TGH), for example, offers classes, devices, and Internet services to people of all ages—and it also offers statistics regarding its effectiveness (e.g., the number of its graduates that accessed vaccine information or scheduled a vaccine appointment using digital skills taught in its courses [80 percent]) and impact reports that help quantify its progress.[27] Measuring programs by performance metrics is key to ensuring the most evidence-based assessment of programs’ effectiveness, and this style of data-based assessment needs to be built into all programs at the outset to allow ongoing, iterative improvement.
The digital inclusion program Connect 313 is a stellar example of this overarching philosophy of interconnectedness put into practice. Connect 313 is a community partnership of private sector groups, social service, and the city of Detroit—a self-defined “citywide, data-driven digital inclusion strategy that brings countless organizations together.”[28] Early in the COVID-19 pandemic, it provided a vehicle for the private investments that poured in to connect offline students and has since created multiple “tech hubs” as community locations for connectivity, digital literacy, technology support, and guidance.[29] One of its first steps was to begin collecting more-precise connectivity data to ensure investments were going to the areas in need, and to connect with a nonprofit that provides refurbished computers to people without them.[30] The concerted effort by multiple parties to synthesize different approaches under one umbrella of connectivity enabled growth over a few years: Detroit, which was ranked the least connected large city in 2019 at 64.4 percent, found 67.5 percent of residents digitally included in 2022.[31]
Connect 313 is an example of an early, well-managed program that has benefited from the foresight of all involved. Joshua Edmonds, who was named Detroit’s director of digital inclusion in 2019—one of the first such positions in the country—was already both in place by the time COVID put new urgency into inclusion efforts and aiming to build an operation that prioritizes speed in matching digital resources to users as they became available. Edmonds has espoused the importance of other people being put in similar roles across the country. Appointing people with director-level power to form and manage relationships, with everyone from ISPs to health care providers, is a key part of building a network of partners and being able to interface with others in the same role at different levels of government.
In addition to a multifaceted approach that addresses different barriers to digital inclusion, part of making digital inclusion successful in the long term is building it into the fabric of society rather than running one-off advocacy campaigns or promotions. Creating permanent positions such as directors of digital inclusion, building lasting partnerships between existing members of the community, and aligning their practices to match inclusivity standards are all more long-lasting and potentially effective methods than trying to build new institutions from scratch.[32]
The Digital Literacy Landscape
A major part of digital inclusion—particularly that aimed at households unwilling to use the Internet—is effectuated through efforts to promote “digital literacy.” Many of these households, the thought process goes, would in fact be interested if they really understood the value of the Internet, or had a better understanding of how to use it. Becoming more digitally literate can similarly help alleviate existing security concerns. Promoting digital literacy also has value of its own as part of the broader goal of educating the population with necessary 21st century skills.
The United States has significant room for improvement on the digital literacy front—however you define it.
“Digital literacy” roughly refers to the ability to communicate and access information online, though the exact definition varies in different contexts and according to different sources. As far back as 2011, the American Library Association’s Digital Literacy Task Force defined it as “the ability to use information and communication technologies to find, evaluate, create, and communicate information, requiring both cognitive and technical skills.”[33] The National Digital Inclusion Alliance expanded on that definition to state that a person with digital literacy skills:
Possesses the variety of skills—technical and cognitive—required to find, understand, evaluate, create, and communicate digital information in a wide variety of formats;
Is able to use diverse technologies appropriately and effectively to retrieve information, interpret results, and judge the quality of that information;
Understands the relationship between technology, life-long learning, personal privacy, and stewardship of information;
Uses these skills and the appropriate technology to communicate and collaborate with peers, colleagues, family, and on occasion, the general public; and
Uses these skills to actively participate in civic society and contribute to a vibrant, informed, and engaged community.[34]
Studies offer varying evaluations of U.S. performance in digital literacy, but there are key points of consensus. First, digital literacy is strongly correlated with demographic factors such as income, educational attainment, age, disability, and socioeconomic status. Second, the United States has significant room for improvement on the digital literacy front—however you define it.
The Organization for Economic Cooperation and Development (OECD) Survey of Adult Skills, part of the Programme for the International Assessment of Adult Competencies (PIAAC), assesses populations’ skills necessary for participation in a modern-day economy.[35] The PIAAC’s most recent results were published in 2019 and assess digital literacy skills under the moniker “proficiency in problem solving in technology rich environments.”[36]
The test divides respondents into four groups, aside from the group that was unable to use a computer, failed the initial core skills assessment, or opted out of taking the online test.[37] Those four groups include a) below level 1, which includes basic, explicit tasks on a generic platform without any reasoning necessary; b) level 1, with simple use of familiar interfaces such as email; c) level 2, with more opaque objectives and more specific technology applications, including navigation across pages and applications; and d) level 3, which demands higher levels of familiarity with online software and the ability to problem-solve in online environments.[38] The most recent U.S. data (from 2017) finds 50 percent of U.S. respondents at only the most basic levels of proficiency (Level 1 or below), which at most requires basic knowledge of online platforms and the ability to use them in a very simple way.[39] Only 31 percent of respondents are at Level 2 or 3.[40] This is about on par with the OECD average of 30 percent, and barely above the prior U.S. results in 2012/2014 (29 percent).[41]
Digital literacy is strongly correlated with demographic factors such as income, educational attainment, age, disability, and socioeconomic status.
Elsewhere on the digital knowledge front, Pew Research Center put forth a 2019 survey on digital knowledge that includes 10 questions on cybersecurity topics such as two-factor authentication and private browsing.[42] The questions touched on topics that are an important part of functioning safely online, such as an understanding of what a phishing scam is. The median number of correct responses was 4, and response rates were again highly correlated with age and education level: 37 percent of respondents with bachelor’s degrees answered seven or more questions correctly, compared with 20 and 9 percent of those with some college or high school, respectively. Younger respondents performed better than did older adults in general.
More recently, EveryoneOn conducted a survey of low-income U.S. households, all with some form of online connectivity, that includes a self-assessment of respondents’ ability to complete online tasks such as finding reliable information, creating a resume, or applying for government services.[43] The 39 percent of respondents who reported confidence in their ability to complete five of the six activities were classified as having “high digital skills.”[44] In contrast, 36 percent of respondents reported confidence in only two or fewer activities and were classified as having “low digital skills.” Though factors such as educational attainment themselves likely influence somebody’s ability to be successful online, EveryoneOn found that the “digital skills” effect (the relationship between digital skills and comfort levels with new applications) was statistically significant even when accounting for socioeconomic factors such as education and income levels.[45] In other words, digital skills training holds a value distinct from that of general education, and could help those with lower levels of educational attainment become more comfortable online.
Finally, John Wiley & Sons, Inc, an American academic publishing company that focuses on scientific and technical subject areas, created a Digital Skills Gap Index (DSGI) in 2021 in response to calls from stakeholders in the Asia Pacific. The DSGI assesses and ranks 134 economies’ and territories’ levels of digital skills based on six pillars: digital skills institutions; digital responsiveness; government support; supply, demand, and competitiveness; data ethics and integrity; and research intensity.[46]
The United States ranks 26th, and barely moves up to 24th among the 50 highest-income economies.[47] It scores 6.3 out of 10 in digital skills institutions, which includes measurements of metrics such as enablement of teachers and faculty in data science and analytics (5.2) and availability of corporate digital staff training (5.4).[48] It also scores a 6.3 in digital responsiveness, including what appears to be the most direct measurement of digital skills—digital skills among population—which scores 8.5. Its ranking flags in responsiveness of national skills development systems, however, at 5.3, which is a problem and likely to become more so given the generally rapid rate of technological change and the need for skills to keep pace with advancements.[49] Another key element is the digital skills match/mismatch between employers’ needs and job seekers’ talents, where the United States also rates a 6.3. Finally, the United States ranks more poorly in government support; both the government’s understanding of the digital skills landscape and its commitment to closing the digital skills gap ranked 5.4.
Singapore ranks first, which the Index attributes to a few key strengths: its education systems, which are among the best in the world; its digital focus shown in the number of articles published on digital subjects; and its lifelong learning entitlement.[50]
Singapore has been particularly successful in navigating the digital transition due to its flexible and modernized reemployment system. The SkillsFuture Singapore (SSG) agency, launched in 2015, helps individuals hone their skills through every phase of their lives and aligns training with needs in the workforce.[51] As a part of the Singaporean governmental body that oversees education, SSG represents a continuous effort to upskill citizens from school to retirement rather than distinguishing between education and labor.[52] As part of this, citizens are given access to individualized platforms that assess their skill levels, match them with suitable career choices, identify mismatches between their skill sets and chosen careers, and even help them find courses to fill in those gaps.[53] On the labor market side, employers are encouraged to sign their employees up for skills courses, and Singaporeans are given credits to use toward skills development.[54] This also involves building a universal lexicon of skills terms to help match workers’ developing skills to openings in the workforce. Overall, this is the sort of overarching, highly individualized framework—directly embedded into Singapore’s educational culture—the United States should look to in order to successfully upskill its own population.
Digital literacy is not a new idea, so like the digital divide itself, it is unsettling that in many ways the landscape is still pocketed with holes. In fact, urgent calls for digital literacy training to become widespread were happening 10 years ago—and the need has only become more urgent since then.[55] A Brookings Institution report published in 2017 finds that the share of employment in particularly “digital” occupations had tripled over 15 years, and even the least digital jobs had become more reliant on at least some digital skills.[56] Digital skills gaps exist across all sectors and all industries.[57] The COVID-19 pandemic only put new urgency behind ongoing digitization and proved that access to basic resources and social institutions, in addition to the workforce, now requires some level of digital skills. At this point, people who are not digitally literate don’t merely lack a useful skill—they are being entirely excluded from growing parts of society.
How Digital Literacy Fits Within Digital Inclusion
The relationship between digital literacy and digital inclusion is complex and multifaceted. Unsurprisingly, gaps in one often follow gaps in another: For the most part, the same groups that are overrepresented in nonadoption statistics—historically marginalized groups such as lower-income households, people of color, and people with disabilities—also have disproportionately low digital literacy rates.[58] As in most societies, inequities in the United States tend to compound on one another, and the inability for more modern digital skills to permeate certain segments of society partially reflect longstanding structural inequities in access to high-quality K-12 education, training, and income levels, all of which render people more or less connected to the digital world.[59]
Digital skills also play a role in broadband adoption beyond the obvious. Of course, low digital skills render people less able to use and derive value from an Internet connection, and the spectrum of digital proficiency is probably directly related to interest in adopting. One hypothesis might be that low levels of digital literacy and adoption don’t cause each other but are both caused by other barriers such as lower levels of income. However, this correlation appears to exist even aside from barriers such as cost. When resources are limited (as they always are, though to a much greater extent for some households than for others), every ongoing cost becomes a trade-off, and those who derive more value from their Internet connection will often keep it regardless of the cost.
To the extent price plays a role, recall that people in some of these most vulnerable groups are also less likely to know about financial aid programs or trust community institutions for information about them, all of which likely compounds the problem.
The EveryoneOn report finds that, among the low-income households surveyed, digital skills were highly correlated with other indicators of willingness or even ability to purchase broadband. For example, respondents with high levels of digital skills were twice as likely as those with low digital skills to trust community anchor institutions such as public libraries or schools for information on broadband affordability programs.[60] Those with high levels of digital skills were also significantly more likely to say it would be easy to keep their Internet service without a discount. Again, these results maintain significance even when factors such as income are accounted for, which means that the presence of digital skills themselves is at least partially the cause of some of these differences rather than a reflection of other, structural differences.
To the extent price plays a role, recall that people in some of these most vulnerable groups are also less likely to know about financial aid programs or trust community institutions for information about them, both of which likely compound the problem. In fact, according to a survey commissioned by AT&T, as of 2021, the majority of people in AT&T’s footprint weren’t aware of the then-EBB, which has since transitioned into the ACP.[61] At that point, 55 percent of consumers were not aware of the EBB program; only 12 percent of respondents had heard of the program and applied, and 13 percent had heard of, and qualified for, the program but had not applied. Awareness rates varied by state, race, and age and, unsurprisingly, correlated with participation rates.
While the pandemic accelerated both digitization and the digital upskilling necessary to modernize the workforce, certain groups still saw less of an increase than did others. And the disparities there are not confined to the United States: A 2021 PricewaterhouseCoopers survey of the global workforce finds that, while 40 percent of the workers surveyed saw their digital skills improve through the pandemic’s lockdown period, and 80 percent were confident they could adapt to new technologies at work, these gains and opportunities were still stratified by factors such as ethnicity, gender, and educational attainment.[62]
Overall, there appears to be a subsection of the population that has less ability to use the Internet overall. Overwhelmingly, this group also has less interest in having a broadband connection, and relatedly, has less awareness of plans geared toward promoting it and making it more affordable for price-sensitive households. Most of these gaps tend to fall around groups that have been historically disadvantaged in many other ways. Advancing digital inclusion entails a concerted, interconnected effort to close every gap.
Best Practices for Digital Literacy
The relationship between digital literacy and digital inclusion is why attempts to bolster digital literacy and efforts to broaden digital inclusion so often go hand in hand. In fact, the former generally cannot be tackled without the latter. Advancing digital literacy works best in concert with other agendas such as getting people access to technology and building trust in low-cost plans. For these efforts to be successful, they must address the specific needs of individual communities. This interconnectivity and flexibility are at the core of every effort to advance digital inclusion; in fact, most of the broad recommendations outlined for digital inclusion describe best practices for digital literacy as well.
For example, the Benton Foundation houses recommendations for digital literacy training within the broader need for a widespread digital inclusion effort—one that also advances connection to low-cost broadband and devices and public access to computing centers, arguing that this multifaceted approach is necessary for getting households online.[63]
The need for multiple simultaneous approaches expands past the policy lens to encompass the actors involved. Benton also recommends a networked model of inclusion: In short, that looks like community institutions such as schools, health care providers, and libraries working together with local governments and ISPs to advance inclusion, which entails building strong relationships and disseminating information about low-cost or no-cost plans.
While all these various institutions can work together to build a digitally inclusive space, not all of them fulfill the same role. Schools, for example, are primed to get a family connected to the Internet for the first time by, for example, giving a student a tablet with its own 4G connection to take home. The likelihood of this introduction to technology being a long-term success in part hinges on what happens after that: A single brief training session for the parents of students, for example, might help that family get more use out of that connection. A public library, meanwhile, might be most helpful as a provider of general computer and Internet access outside the home, as well as being a trusted source of information about low-cost plans.[64]
Programs run through these institutions are also ripe for partnerships between community anchors and ISPs. In fact, plenty of the largest ISPs have already made moves to enter into these sorts of partnerships. AT&T and the Public Library Association, for example, have partnered to offer free, bilingual digital literacy workshops in dozens of libraries.[65] Comcast offers digital skills content through its Lift Zones program, which provides free Wi-Fi in public gathering spaces across the country to create a robust option for Internet access outside the home, and reports that 40 percent of users would not have had access without their local Lift Zone.[66]
Partnerships between ISPs and community institutions can also help alleviate key areas of concern for digital inclusion programs, including insufficient size and lack of funding. At the same time, it is important to try to design programs to be as self-sustaining as possible. They should also be framed around outcome-based evaluation that identifies the most effective programs and areas for improvement.[67] Successful practices address the myriad unique situations nonadopters might find themselves in—whether that may be low digital literacy, an insecure housing situation, a language barrier, or inability to afford a subscription—with solutions specifically targeted toward those problems.
The need for individualized treatment extends into the particulars of digital literacy best practices. In fact, a 2019 study on how underserved populations can best be digitally taught highlights the importance of accounting for both the “multidimensional nature of adult learning and the social and cultural contexts in which learning occurs.”[68] The former can refer to anything from providing instruction through various mediums—including drawings to accommodate visual learners and hands-on activities for those who learn by doing—to ensuring one-on-one time with the instructor by keeping class sizes small and having the instructor stay after class. This becomes particularly important for adult students with more limited time and less flexible schedules.
Just as the format of digital literacy lessons should be individualized to address specific needs, the content of those lessons should be targeted to students’ areas of concern. For example, the study identifies security and privacy concerns as a key impediment to adoption for the older adults in the study—and a commonly found reason for hesitation among older adults in general—which fade once addressed by the literacy classes. As the study notes, interest in the topics being covered is both an “effective motivator for learning” and a way to maximize the benefits of the class for the students involved.[69]
The study also notes the potential value of organizations partnering with academic institutions—and more broadly, digital literacy training should be undertaken in concert with ongoing, rigorous research to inform best practices and target the classes to the areas of most need.[70] This goes hand in hand with outcome-based evaluation that prioritizes literacy practices that show practical results—such as maximizing the number of people that effectively get online—and adjusts those that don’t.[71]
Some institutions are naturally suited for digital literacy efforts, particularly those in which the community already gathers for some form of education and has some level of preexisting trust. Libraries, for example, are uniquely suited for providing Internet connectivity and resources to community members.[72] Schools are also well equipped to hold digital literacy classes. In fact, 72 percent of K-12 public schools offer some form of digital literacy training to students already.[73] A quarter extend beyond that to offer digital literacy training to students’ families.[74] It is no coincidence that these institutions have been major hubs of analog literacy efforts in the past.
Overall, there is a wealth of knowledge on best practices, though there is certainly more to be learned and understood. Even with this preexisting base of knowledge, gaps in digital literacy remain for several reasons, many of which overlap with reasons for the remaining digital divide. First, many strong programs simply do not have enough funding to reach everybody who needs them. In fact, even the ACP is set to run out of funding in the near future. Second, there is a dearth of data on all fronts: on existing programs, on their strengths and weakness, on the specific needs of different communities, and even on digital literacy rates themselves. Some of these problems will ideally be addressed with forthcoming BEAD and Digital Equity Act funding, but the effectiveness of these solutions will hinge in large part on the collection of better data.
The Importance of Digital Navigators
At the other end of the spectrum of digital inclusion efforts is the digital navigator. Whereas digital literacy is about empowering individuals to handle themselves effectively online, the digital navigator exists to fill in the gaps where individual knowledge does not or cannot suffice and expert guidance is needed.
Digital navigators are trusted local individuals who guide people through the process of getting online, from applying to low-cost plans to learning how to use online resources.[75] They embody the spirit of many of the recommendations listed previously in that they are individuals that focus and target their assistance toward the needs of the individuals they assist. They also rely entirely on local communities gathering ultra-specific data about their needs (skills gaps, the number of offline households, and the specific barriers they are facing). Proponents of digital navigators see them as working within a framework that can be adjusted based on the needs of the community rather than simply following a comprehensive set of instructions: Generally, recommendations boil down to providing as much flexible, individualized instruction as possible and to cover a variety of inclusion topics such as access and literacy through multiple communication methods.[76]
Digital navigators exist in response to a very direct need. In fact, 40 percent of the respondents in the BCG Survey mentioned previously ranked “having someone walk [them] through the process [of getting online]” as one of the most important changes necessary to make them apply for a no-cost Internet plan.[77] One-on-one support, whether through a hotline, a dedicated organization, or even an ISP call center, can help ameliorate remaining areas of confusion or hesitation in the application process and provide direction for digital literacy services.[78]
Digital navigators are not a new idea, but their popularity has been ramping up over the past several years. A separate BCG report surveyed over 1,500 people that had at some point been helped by a program providing digital navigators. The response was highly positive: A majority of respondents (over 65%) reported access to the Internet or a digital device at home, and a vast majority (85%) said that they now use the Internet more often.[79] Rather than all fulfilling the same role, navigator programs range from distinct organizations to offshoots of institutions such as health centers and libraries—and they can assist with anything from device acquisition to digital literacy advancement to enrollment in a low-cost plan.[80]
The report groups common digital navigator models into four “archetypes”: intervention specialists (staff at community organizations that can provide basic information and support), digital-inclusion specialists (staff at organizations that are specifically dedicated to advancing digital equity and inclusion), social-change agents (staff such as social service workers that provide more holistic support to people, including getting them online), and functional-skill builders (staff that provide instruction for specific digital skills).[81] “Social change” agents are especially notable as an example of inclusion activities co-opting existing institutions, which are already specifically skilled at working with certain populations, and adding digital skills training to their repertoire rather than building from the ground up.
Of course, this list doesn’t demarcate where a digital navigator’s work starts and ends, but a key takeaway here is that there is room in the digital inclusion process for assistance in multiple areas, ideally targeted for key areas of concern at the local level. There is also room for existing institutions, such as social service agencies, to lean into digital inclusion rather than keeping institutions entirely separate. As digitization permeates all aspects of life, digital inclusion efforts should follow suit.
The Need for Better Data
Each of these approaches hinges on having good data about where the gaps are and what programs are successfully closing them. And in a few key areas, U.S. data on digital inclusion is in desperate need of improvement.
First, NTIA’s Internet Use Survey needs more clarity in its questions aimed toward nonadopters. As mentioned previously, there is some opacity in NTIA’s results on nonadopters. The group of respondents that cites “not interested” as their reason for nonadoption is particularly confusing from a policy perspective: On the face of it, this group would appear to be the hardest to get online, but there is a serious lack of clarity around what households actually mean when they say they are uninterested in purchasing broadband.
Examining the demographics of the respondents can give us a hint. As a whole, offline households tend to skew lower income; they are also more likely to be people of color and to have less educational attainment.[82] Among those offline groups, those who cite “not interested” as their main barrier to getting offline skew older and more white, while those for whom the main barrier is price are disproportionately people of color or ethnic minorities.[83] They are also more likely to have school-aged children at home—a demographic that, especially with the rise of tele-education, has a clear need for an Internet connection even if their parents don’t have a job that can be done online.
These demographic trends could be indicative of broader patterns: For example, some of these groups might be more likely to work blue-collar jobs that may be less likely to necessitate a home Internet connection. But as more government resources, societal institutions, and educational opportunities move online, we should see that need discrepancy fade. Moreover, the fact that these groups are largely those that have been historically, and are still today, discriminated against through various avenues suggests that the digital divide is more the latest manifestation of widespread societal inequalities than an organic representation of various groups’ need for the Internet.
Second, we need an ongoing effort to collect up-to-date, standardized digital literacy statistics. The most authoritative source on the state of digital literacy in the United States is probably OECD’s assessment, the last iteration of which includes data from 2017—indeed, many recently released studies rely on the 2012/2014 iteration of that same data. While the individualization of programs is integral to their success, more current, standardized data would better allow policymakers to identify problem areas and trends. A standardized repository of successful programs and the data proving those successes would also better enable states to imitate each other’s best practices.
Comparing NTIA’s Internet Use Survey With Pew’s
In the absence of one comprehensive survey that satisfactorily answers these questions, it can be instructive to compare NTIA’s survey results with those of similar surveys to note where they overlap. Pew Research Center, for example, conducts its own survey on both Internet use and reasons for non-use.[84] Its results are similar to NTIA’s in some areas and curiously divergent in others.
One key difference here is that Pew’s questionnaire doesn’t allow for a “not interested” response as a reason for nonadoption, so theoretically, respondents that might have chosen that answer if it were provided are pressed to think about the reason behind that lack of interest and find a way to fit their response into another bucket. While this is obviously not a precise method of analysis for a number of reasons—different samples and survey methodologies, among others—this type of comparison can give us a vague idea of what the “not interested” group might say if pressed.
Another significant difference between the surveys is that NTIA, as part of the CPS, is assessing members of households, while Pew’s universe of respondents is U.S. adults.[85] In addition, NTIA’s assessment is entirely technology agnostic; its only concern is whether some form of Internet use takes place within the home. Pew’s survey, meanwhile, distinguishes between smartphone-only users and those with a home broadband connection.
NTIA and Pew also give slightly different options on their surveys. NTIA data groups respondents into one of six reasons for nonadoption: price, availability elsewhere, no computer, unavailability of broadband, privacy or security concerns, or no interest. Pew also sorts respondents into one of six categories: price of a broadband subscription, other options for access outside the home, price of a computer, unavailable or unacceptably slow service, a smartphone is sufficient, or some other reason.
Two things to note at the outset are: Insofar as the response options are similar between the two surveys, Pew generally sees higher percentages of respondents choose each option than does NTIA; and although Pew has a catchall option called “some other reason,” it does not offer the precise equivalent of NTIA’s “not interested” option. The former divergence is likely almost a direct result of the latter: Because Pew doesn’t offer “not interested” as an option, respondents who would have chosen that in the NTIA survey are very likely pressed to think harder about the specific circumstances driving that lack of interest and to identify them instead.
Though Pew finds that cost is proportionately the largest reason for nonadoption, and NTIA finds that it lags in second (trailing the “not interested” option that Pew doesn’t offer), the two find similar response rates (20 and 18 percent respectively).[86] Because Pew excludes smartphone-only users and NTIA includes all technologies, one additional possibility here is that out of those who don’t adopt fixed broadband, price is the major reason, but when the lens expands to the universe of non-home Internet users regardless of technology, price is a secondary reason to lack of interest. Both surveys also offer a response along the lines of having availability elsewhere, but while NTIA groups only 2 percent of respondents into this category, Pew’s count significantly exceeds that at 9 percent.
After the top two reasons, the datasets diverge further from each other. NTIA finds that around 3 percent of respondents choose “no or an inadequate computer” as their reason for nonadoption, while Pew sorts 7 percent of respondents into a group that cites the cost of a computer as the major reason. Though the questions are different, they are essentially getting at the same idea, as those who are responding that a computer costs too much are almost certainly explaining their reasoning for not having a computer. In fact, in that sense, NTIA’s response is actually broader, as is captures everybody who doesn’t have a computer—and even those who simply don’t have an adequate computer—rather than Pew’s narrower categorization of only those who specifically don’t have a computer because it is too expensive.
Next, NTIA sorts 4 percent of respondents into a group that cites unavailability of broadband as the reason behind nonadoption. Pew’s similar question, meanwhile, captures 9 percent of respondents. Here, in addition to the lack of the “not interested” response and the differences in technologies, a more direct reason may be the cause of the discrepancy: The exact wording of Pew’s option cites either unavailable or unacceptably slow broadband as the reason behind nonadoption. Because of this, Pew may be accounting for those who have networks reaching their home, but that provide insufficient speeds (for reasons that can range from the quality of the network itself to consumer-side factors such as problems with the Wi-Fi or the router), while NTIA only allows for those with no infrastructure at all.
The final two reasons offered by each survey have too little in common to be reasonably compared. NTIA offers privacy or security concerns at 2.4 percent and, of course, “don’t need or not interested” at a whopping 57.5 percent. Pew, meanwhile, categorizes 19 percent of respondents as those who say their smartphone is good enough, and the remaining 22 percent as having “some other reason” for remaining offline.
Ultimately, the goal of digital inclusion efforts is to ensure that everybody choosing to remain offline is doing so out of a fully informed, genuine lack of interest rather than a reaction to some barrier.
There are too many differences between the two surveys to draw real conclusions from a comparison between them, but it does offer a rough starting point for a deeper analysis of NTIA’s “not interested” group. At the very least, it is clear that a survey can be equally instructive without lack of interest offered as a reason, so when pressed, respondents are capable of coming up with the specific, more actionable barrier that is causing that lack of interest.
NTIA has added questions to its survey in the past after seeking public input. Most recently, it began asking nonadopters at what price point they’d be willing to subscribe to a broadband connection. Follow-up questions aimed at the “not interested” group—for example, questions that get at what would have to change for the household to consider going online, or whether the lack of a connection has harmed respondents in some way—would go a long way toward differentiating between the truly uninterested and those still reacting to some form of barrier. Until then, as much data as there is about nonadopters, there is still a long way to go.
Conclusion
There will likely always be some people who choose to remain offline, especially in the near future as some older people remain content with a life without a need for the Internet. There is no one-size-fits all solution in any respect, and though policy focus on expanding infrastructure is often simpler, we have passed the point where building networks can close adoption gaps. Ultimately, the goal of digital inclusion efforts is to ensure that everybody choosing to remain offline is doing so out of a fully informed, genuine lack of interest rather than a reaction to some barrier. That will happen if we first work to fully understand the problem with up-to-date data and, second, target solutions to existing barriers.
While nobody should be forced online against their will, nor should we passively accept pockets of disconnectivity that coalesce around historically marginalized communities—even though it is exactly this marginalization that leads to their being least likely to adopt broadband for a variety of reasons, many of which are unrelated to the broadband marketplace itself. Working to achieve real digital inclusion is in large part about helping individuals overcome longstanding barriers so that new technologies can help overcome inequities rather than compound them.
About the Author
Jessica Dine is a research assistant for broadband policy at ITIF. She holds a B.A. in economics and philosophy from Grinnell College.
About ITIF
The Information Technology and Innovation Foundation (ITIF) is an independent 501(c)(3) nonprofit, nonpartisan research and educational institute that has been recognized repeatedly as the world’s leading think tank for science and technology policy. Its mission is to formulate, evaluate, and promote policy solutions that accelerate innovation and boost productivity to spur growth, opportunity, and progress. For more information, visit itif.org/about.
Endnotes
[1]. National Telecommunications and Information Administration (NTIA), NTIA Data Explorer: Internet Use Survey (Non-Use of the Internet at Home, updated October 2022), https://ntia.gov/other-publication/2022/digital-nation-data-explorer#sel=homeEverOnline&demo=&pc=prop&disp=chart.
[2]. “Broadband Equity, Access, and Deployment (BEAD) Program,” BroadbandUSA: National Telecommunications and Information Administration, accessed February 2023, https://broadbandusa.ntia.doc.gov/taxonomy/term/158/broadband-equity-access-and-deployment-bead-program.
[3]. Ibid.
[4]. FCC, “Fixed Broadband Deployment: Broadband 477 Map,” June 2021 (latest public release), https://broadband477map.fcc.gov/#/area-summary?version=jun2021&type=nation&geoid=0&tech=acfw&speed=25_3&vlat=13.65346978442038&vlon=-92.46758282698437&vzoom=2.1179846926762846.
[5]. Linda Hardesty, “FCC pushes broadband map forward, but time is running short,” Fierce Telecom, December 29, 2022, https://www.fiercetelecom.com/broadband/fcc-pushes-broadband-map-forward-time-running-short.
[6]. NTIA Data Explorer: Internet Use Survey (Non-Use of the Internet at Home, updated October 2022).
[7]. Ibid.
[8]. Ibid.
[9]. Jessica Dine and Joe Kane, “The State of US Broadband in 2022: Reassessing the Whole Picture” (ITIF, December 2022), https://itif.org/publications/2022/12/05/state-of-us-broadband-in-2022-reassessing-the-whole-picture/; Aswath Damodaran, “Operating and Net Margins by Industry,” 2022, Data: Archives, accessed February 2023, https://pages.stern.nyu.edu/~adamodar/.
[10]. 2020 Communications Marketplace Report, Appendix G: International Broadband Data Report Appendices (FCC, Washington, D.C.: December 2020), GN Docket No. 20-60, 48, https://www.fcc.gov/document/fcc-releases-2020-communications-marketplace-report; Oxford Economics, “Unpacking the cost of mobile broadband across countries” (New York, NY: November 2022), 9, https://www.oxfordeconomics.com/wp-content/uploads/2022/11/CTIA-Oxford_Economics_Report-Cost_of_Mobile_Broadband.pdf.
[11]. NTIA Data Explorer: Internet Use Survey (Non-Use of the Internet at Home, updated October 2022).
[12]. Tom Wheeler and Mignon Clyburn, “Broadband: A Lifeline for the 21st Century,” Federal Communications Commission (FCC), March 2016, https://www.fcc.gov/news-events/blog/2016/03/08/broadband-lifeline-21st-century; FCC, “Affordable Connectivity Program,” updated December 2022, https://www.fcc.gov/affordable-connectivity-program.
[13]. Metro by T-Mobile, accessed February 2023, https://www.metrobyt-mobile.com/?INTNAV=tNav:Metro; Access from AT&T, accessed February 2023, https://www.att.com/internet/access/; Verizon Home Internet, accessed February 2023, https://www.verizon.com/home/free-verizon-internet/.
[14]. Chris Goodchild et al., “Boosting Broadband Adoption and Remote K–12 Education in Low-Income Households,” Boston Consulting Group (BCG), May 2021, https://www.bcg.com/publications/2021/accelerating-broadband-adoption-for-remote-education-low-income-households.
[15]. Ibid.
[16]. Ibid.
[17]. BroadbandUSA: NTIA, “Digital Equity Act Programs,” accessed January 2023, https://broadbandusa.ntia.gov/taxonomy/term/143.
[18]. FCC, “Communications Equity and Diversity Council Meeting - February 2023,” online recording, https://www.fcc.gov/news-events/events/2023/02/communications-equity-and-diversity-council-meeting-february-2023.
[19]. “Washington Becomes First State to Pass Media Literacy Education Law in 2016,” Action 4 Media Education, accessed March 2023, https://action4mediaeducation.org/2016/03/30/media-literacy-is-law-in-washington-state/.
[20]. Connecticut Commission for Educational Technology, “Guidance on District Policy Revisions to Support Digital Learning,” accessed January 2023, https://portal.ct.gov/-/media/DAS/CTEdTech/meetings/2018/CET_DL_Policy_Recommendations.pdf?la=en.
[21]. “The ISTE Standards,” ISTE, accessed March 2023, https://www.iste.org/iste-standards.
[22]. Northstar Digital Literacy, accessed February 2023, https://www.digitalliteracyassessment.org/.
[23]. FCC, “Communications Equity and Diversity Council Meeting – February 2023.”
[24]. APDS: Changing Corrections for Good, “APDS And Amazon Web Services Announce Results Of The First Cloud Certification Program Available Inside D.C. Department Of Corrections,” press release, January 24, 2023, https://apds.works/apds-and-amazon-web-services-announce-results-of-the-first-cloud-certification-program-available-inside-d-c-department-of-corrections/.
[25]. APDS, “Our Impact,” accessed March 2023, https://apds.works/impact/.
[26]. FCC, “Communications Equity and Diversity Council Meeting – February 2023.”
[27]. Tech Goes Home, “Our Programs,” accessed March 2023, https://www.techgoeshome.org/.
[28]. Connect 313, “About Us,” accessed March 2023, https://connect313.org/about-us/.
[29]. Luke Londo, “Connect 313 Fund Announces Launch of 17 New Tech Hubs in Detroit,” Rocket Community Fund, June 27, 2022, https://www.rocketcommunityfund.org/2022/06/27/connect-313-fund-announces-launch-of-17-new-tech-hubs-in-detroit/.
[30]. Robert D. Atkinson and Jackie Whisman, “Podcast: Building Digitally Inclusive Communities, With Joshua Edmonds” (ITIF, October 2020), https://itif.org/publications/2020/10/12/podcast-building-digitally-inclusive-communities-joshua-edmonds/.
[31]. Biba Adams, “Detroit’s digital divide reminds us how far America has to go for internet equity” Distilled by Mozilla, May 2021, https://blog.mozilla.org/en/internet-culture/deep-dives/digital-divide-detroit-broadband-internet-access-2021/; Londo, “Connect 313 Announces 17 New Tech Hubs,” 2022.
[32]. Atkinson and Whisman, “Podcast: Building Digitally Inclusive Communities, With Joshua Edmonds” (ITIF, 2020).
[33]. American Library Association Institutional Repository, “What is Digital Literacy?” 2011, https://alair.ala.org/handle/11213/16260.
[34]. National Digital Inclusion Alliance (NDIA), Definitions, accessed January 2023, https://www.digitalinclusion.org/definitions/.
[35]. Organization for Economic Cooperation and Development (OECD), Programme for the International Assessment of Adult Competencies (PIAAC) international reports, OECD Skills Studies, https://www.oecd.org/skills/piaac/publications/.
[36]. OECD, Skills Matter: Additional Results from the Survey of Adult Skills, PIAAC international reports, OECD Skills Studies (Paris: OECD Publishing, 2019), https://www.oecd.org/skills/piaac/publications/Skills_Matter_Additonal_Results_from_the_Survey_of_Adult_Skills_ENG.pdf.
[37]. Ibid.
[38]. Ibid, 57.
[39]. Ibid, 56.
[40]. Ibid, 59.
[41]. Ibid.
[42]. Emily A. Vogels and Monica Anderson, “Americans and Digital Knowledge” (Pew Research Center, October 2019), https://www.pewresearch.org/internet/2019/10/09/americans-and-digital-knowledge/.
[43]. “DIGITAL SKILLS AND TRUST” (EveryoneON and John B. Horrigan, PhD, February 2022), https://static1.squarespace.com/static/5aa8af1fc3c16a54bcbb0415/t/61fc71248a56247e899c2a20/1643933997111/EveryoneOn_Report_2_DigitalSkills_and_Trust.pdf.
[44]. Ibid, 11.
[45]. Ibid, 12.
[46]. Wiley, “Digital Skills Gap Index (DGSI),” Methodology, accessed February 2023, https://dsgi.wiley.com/methodology/.
[47]. Wiley, “DSGI 2021,” accessed February 2023, https://dsgi.wiley.com/global-rankings/.
[48]. Wiley, “Economy/Location Profile,” accessed February 2023, https://dsgi.wiley.com/economy-location-profiles/.
[49]. Ibid.
[50]. Wiley, Digital Skills Gap Index 2021, accessed February 2023, https://dsgi.wiley.com/wp-content/uploads/2021/10/DSGI-whitepaper.pdf.
[51]. Robert D. Atkinson, “How to Reform Worker-Training and Adjustment Policies for an Era of Technological Change” (ITIF, February 2018), https://itif.org/publications/2018/02/20/technological-innovation-employment-and-workforce-adjustment-policies/.
[52]. Ibid.
[53]. Ibid.
[54]. Ibid.
[55]. Troy Hicks and Kristen Hawley Turner, “No Longer a Luxury: Digital Literacy Can't Wait,” The English Journal Vol. 102, No. 6 (July 2013), 58–65, https://www.jstor.org/stable/24484127?read-now=1#page_scan_tab_contents.
[56]. Mark Muro et al., “Digitalization and the American workforce” (Brookings Institution, November 2017), https://www.brookings.edu/research/digitalization-and-the-american-workforce/.
[57]. Amanda Bergson-Shilcock, “The New Landscape of Digital Literacy” (National Skills Coalition, May 2020), https://nationalskillscoalition.org/wp-content/uploads/2020/12/05-20-2020-NSC-New-Landscape-of-Digital-Literacy.pdf.
[58]. Amanda Bergson-Shilcock, Digital Skills Series, “Applying a racial equity lens to digital literacy: How workers of color are affected by digital skill gaps” (National Skills Coalition, April 2020), https://nationalskillscoalition.org/wp-content/uploads/2020/12/Digital-Skills-Racial-Equity-Final.pdf.
[59]. Ibid.
[60]. “DIGITAL SKILLS AND TRUST” (EveryoneON and Horrigan, February 2022).
[61]. Linda Hardesty, “AT&T survey finds most consumers aren’t aware of broadband subsidies,” Fierce Telecom, January 26, 2022, https://www.fiercetelecom.com/broadband/att-survey-finds-most-consumers-arent-aware-broadband-subsidies.
[62]. “Pandemic has accelerated digital upskilling, but key groups still miss out - PwC survey,” Cision Pr Newswire, PricewaterhouseCoopers (PwC), March 16, 2021, https://www.prnewswire.com/news-releases/pandemic-has-accelerated-digital-upskilling-but-key-groups-still-miss-out---pwc-survey-301247728.html.
[63]. Colin Rhinesmith, Ph.D., “Digital Inclusion and Meaningful Broadband Adoption Initiatives” (Benton Foundation, January 2016), https://www.benton.org/sites/default/files/broadbandinclusion.pdf.
[64]. Ibid.
[65]. Amy Phillips, “Free digital literacy training for Mass. Residents,” WWLP-22News, December 6, 2022, https://www.wwlp.com/news/massachusetts/free-digital-literacy-training-for-mass-residents/.
[66]. Comcast, “Lift Zones,” accessed January 2023, https://corporate.comcast.com/impact/digital-equity/lift-zones.
[67]. Rhinesmith, “Digital Inclusion and Meaningful Broadband Adoption Initiatives” (Benton, 2016).
[68]. Hyunjin Seo et al., “Evidence-based Digital Literacy Class for Low-income African-American Older Adults,” Journal of Applied Communication Research, 47(2), 130–152, 2, https://kuscholarworks.ku.edu/bitstream/handle/1808/31690/Hyunjin%20Seo_Evidence-based%20Digital%20Literacy%20Class%20for%20Underserved%20Populations_Journal%20of%20Applied%20Communication%20Research.pdf?sequence=1&isAllowed=y.
[69]. Ibid, 28.
[70]. Ibid.
[71]. Rhinesmith, “Digital Inclusion and Meaningful Broadband Adoption Initiatives” (Benton, 2016).
[72]. Sharon Strover et al., The digital inclusion role of rural libraries: social inequalities through space and place, Media, Culture & Society, Volume 42, Issue 2, June 2019, https://journals.sagepub.com/doi/abs/10.1177/0163443719853504.
[73]. “Too Few Candidates Applying for Teaching Jobs the Primary Hiring Challenge for More than Two-Thirds of Public Schools Entering the 2022-23 School Year,” National Center for Education Statistics, September 27, 2022, https://nces.ed.gov/whatsnew/press_releases/09_27_2022.asp.
[74]. Ibid.
[75]. The Digital Navigator Model: Adding Digital Equity to Our Social Safety Net, NDIA, accessed February 2023, https://www.digitalinclusion.org/digital-navigator-model/.
[76]. Ibid; “The Digital Navigator Playbook,” DigitalUS, accessed February 2023, https://digitalus.org/digital-navigator-playbook/.
[77]. Goodchild et al., “Boosting Broadband Adoption,” BCG, 2021.
[78]. Ibid.
[79]. Matt Kalmus et al., “A Human Approach to Closing the Digital Divide,” BCG, June 2022, https://www.bcg.com/publications/2022/how-to-close-digital-divide-with-human-approach.
[80]. Ibid.
[81]. Ibid.
[82]. NTIA, “Switched Off: Why Are One in Five U.S. Households Not Online?” accessed February 2023, https://ntia.gov/blog/2022/switched-why-are-one-five-us-households-not-online.
[83]. Ibid.
[84]. Andrew Perrin, “Mobile Technology and Home Broadband 2021” (Pew Research Center, June 2021), https://www.pewresearch.org/internet/2021/06/03/mobile-technology-and-home-broadband-2021/.
[85]. NTIA, “November 2019 CPS Computer and Internet Use Supplement,” accessed January 2023, https://www.ntia.gov/files/ntia/blogimages/november_2019_cps_supplement_-_final.pdf; Perrin, “Mobile Technology and Home Broadband 2021,” Topline Questionnaire (Pew, 2021).
[86]. Ibid; NTIA Data Explorer: Internet Use Survey (Non-Use of the Internet at Home, updated October 2022).
