
How the IT Sector Powers the US Economy
The information technology (IT) sector makes an outsized contribution to the U.S. economy as a leading exporter that creates high-paying jobs, including for non-college-educated workers, while producing highly innovative products and services that drive broad-based growth, counteract inflation, and improve people’s quality of life.
KEY TAKEAWAYS
Key Takeaways
Contents
Total Jobs, Including the Mulitplier 6
Good Jobs, Including for Non-College-Educated Workers 9
Use of IT by Other Industries 10
IT-Intensive Industries and Inflation. 10
Introduction
Industries vary in the relative contributions they make to national economies: Some pay their workers more than others do. Some raise their prices more slowly than others do—or even reduce their prices over time. Some export, which expands their production and shifts the overall economy toward greater competitiveness and productivity, enabling average workers to better afford imports. And some innovate more than others, thereby driving economic growth and improving people’s quality of life.[1] America’s IT industry has all these qualities: high pay, low price inflation for consumers, strong exports, and superior innovation. This report relies on the latest data available from the federal government to examine the key role and contributions of the IT industry in the U.S. economy. Appendix 1 describes the methodology.
The U.S. IT sector (which many refer to as the “tech sector”) includes industries such as computing, data storage and processing, IT components, information services, semiconductors, and software. The sector employed 5.9 million workers in 2020, accounting for 4.4 percent of U.S. private sector jobs.[2] These workers earned more than double the average U.S. wage.[3] Taking into account the multiplier effect, the industry supports 19 percent of all U.S. jobs.[4]
The IT sector also is an important source of well-paying jobs for non-college-educated Americans. The sector pays such workers approximately 50 percent more than do non-IT industries.[5]
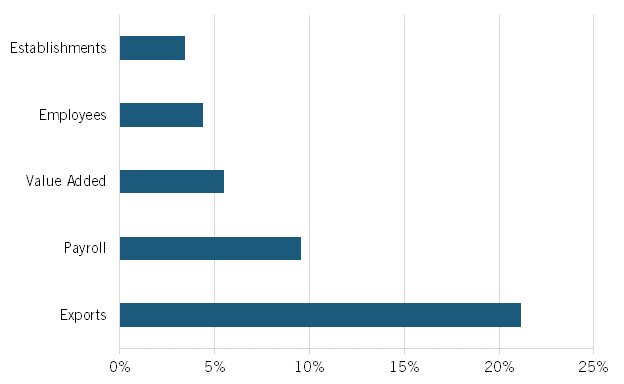
Importantly, the lion’s share of the sector is globally traded, meaning it exports products and services and competes with production from other countries. As a share of U.S. industries that compete in the global economy, the IT sector accounts for 28 percent of establishments, 22.4 percent of jobs, and 30.7 percent of payroll expenditures.[6] But given the ferocity of the global competition for leadership in the IT sector, the United States should take none of this for granted.
Finally, the IT sector is important not just because of its direct impact on the economy in terms of jobs and income, but also because of its indirect effect on organizations using IT to improve quality and productivity, whether they are for-profit companies, nonprofits, or governments. This is why there is a modest negative correlation between an industry’s use of IT and inflation over the last decade. In other words, industries that use more IT raise prices at half the rate than does the overall economy—and those savings are then passed onto American consumers.
More broadly, the nation’s most strategically important industries have three main characteristics—they are driven by advanced technologies, they are globally traded sectors, and they serve the dual purpose of contributing to both economic and national security—and even among the select group that meet those criteria, the IT sector is a standout for the United States, punching 35 percent above its weight in the global marketplace. That is, the U.S. IT sector represented nearly one-third of the global IT market in the most recent comparative data available from the OECD (32.1 percent), which was 35 percent higher than the U.S. share of the overall global economy.[7]
This is a telling measure of industry concentration known as location quotient (LQ), and as shown in figure 1, the trend line for the U.S. IT sector has been distinctly positive in recent decades: Its relative global market share went from 1.08x in 1995 (i.e., 8 percent higher than the size-adjusted average among 66 countries in the OECD’s dataset) to 1.35x in 2018 (or 35 percent above the relative average). In fact, if not for the IT sector’s contribution, America’s most strategically important advanced industries as a group would have receded precipitously in that period in the face of surging competition, particularly from China. The IT sector thus represents a core strength that U.S. policymakers should not take lightly.
Figure 1: U.S. performance in advanced industry sectors[8]
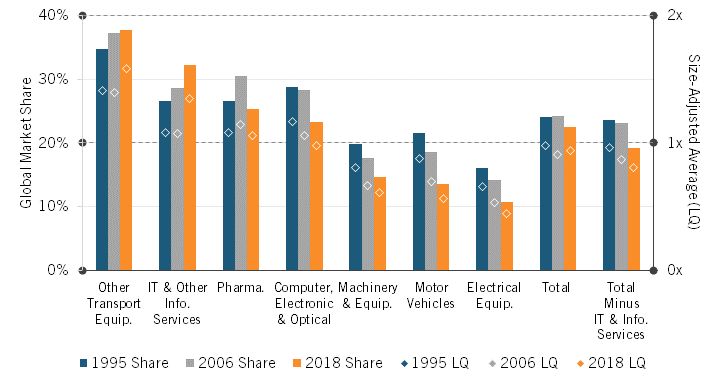
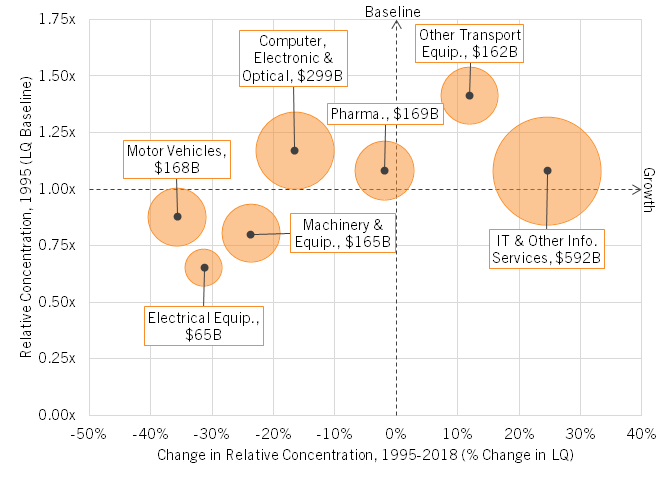
Figure 2 further underscores the IT sector’s growing importance in the U.S. economy. Among strategically important advanced industries, it has stood out in recent decades as a particularly high performer—important not just for its size, but also for its growth relative to the rest of the economy. In other words, the United States—still the world’s largest economy, and among the most diversified—is becoming increasingly specialized in IT.
Figure 2: Change in relative concentration of advanced industries in the U.S. economy, 1995–2018 (scaled to production output in 2018)[9]
IT in the U.S. Economy
In 2020, there were 275,859 IT industry establishments in the United States with a total annual payroll of $722 billion.[10]
Moreover, the sector is a source of well-paying jobs for Americans. In 2020, the average annual compensation per worker in the IT industry was $122,270, 117 percent more than the average U.S. private sector wage.[11] The Department of Commerce’s new report on the digital economy finds that from 2012 to 2020, the nominal compensation for digital economy workers grew at an average annual rate of 6.0 percent.[12] From 2019 to 2020, the average nominal compensation saw an even larger growth of 7.3 percent.[13] This report includes fewer industries than does the Commerce report. See appendix 2 for an explanation of the differences in methodology between the Department of Commerce and ITIF.
In 2020, the industry employed 5.9 million workers.[14] From 2017 to 2020, IT jobs grew more than twice as fast as total U.S. private sector jobs did (10.7 percent vs. 4.3 percent).[15] Jobs in IT hardware grew by 1.5 percent, in part because of faster productivity growth, while jobs in IT services and software grew by 12.4 percent.[16] Using a more expansive measure of the digital economy—which includes much of retail that uses e-commerce, telecommunication services, and some entertainment services—the Department of Commerce report shows the industry employed 7.8 million workers in 2020.[17]
Figure 3: IT industry’s share of the total U.S. economy[18]
Using the ITIF industry definition, in 2020, the IT sector accounted for 3.5 percent of all business establishments and 4.4 percent of private sector employees, meaning the average IT firm was about 27 percent larger than the average private sector firm.[19] However, because the IT industry pays so well, it accounted for 9.5 percent of all private sector wages.[20] (See figure 3).
As a measure of industry contribution to the economy, the most accurate measure is value added, the result of subtracting the cost of purchased inputs (e.g., raw materials, energy, etc.) from final sales. In 2020, the IT industry generated $1.2 trillion in domestic value added, approximately 5.5 percent of the U.S. economy.[21] Value added in the IT sector grew by $600 billion (109 percent) from 2010 to 2020, with data processing, Internet publishing, and other information services growing the fastest at 215.1 percent.[22] Overall, U.S. gross domestic product (GDP) grew 39 percent over the same period.[23]
The Department of Commerce found that the digital economy accounted for 10.2 percent ($2.14 trillion of value added) of U.S. GDP in 2020.[24] According to the Department, from 2012 to 2020, the digital economy’s average real (inflation-adjusted) annual growth in value added was 6.3 percent.[25] The Department’s data also highlights that the digital economy’s real value added grew 151.4 percent from 2005 to 2020.[26] (See figure 4.)
Figure 4: Commerce Department estimates of growth in real value added in the digital economy, 2005–2020[27]
Finally, while U.S. government data on exports is limited, export data was available for 11 of 22 IT industries.[28] These industries collectively exported $301 billion worth of IT goods in 2020.[29] Despite only making up 11 of the 112 total categories in exports, the IT industry contributed 21.2 percent to the economy’s goods exports in 2020.[30] Furthermore, the Bureau of Economic Analysis has estimated that the IT industry exported $83.9 billion worth of information and communications technology services in 2020.[31]
Total Jobs, Including the Mulitplier
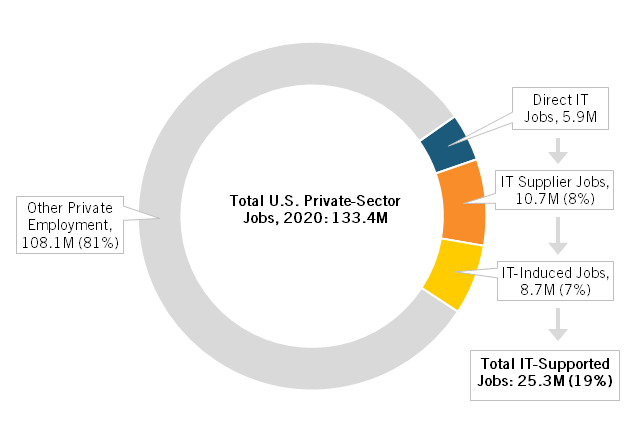
The impact of the IT sector on U.S. jobs and output goes far beyond just the sector. The IT sector purchases goods and services supplied by other industries to support its core activities, which in turn creates output and jobs. In addition, IT workers spend their earnings, which creates what are called “induced jobs.”
The sector employed 5.9 million workers in 2020.[32] When the multiplier effect—which accounts for the estimated number of supplier and induced jobs an industry contributes—is taken into consideration, the IT sector also supported an estimated 10.7 million domestic supplier jobs and 8.7 million induced jobs that year.[33] (See figure 5.) Overall, in 2020, the IT sector supported a total of 25.3 million jobs, or 19 percent of private sector employment.[34]
Figure 5: IT-supported jobs as a share of U.S. private sector employment, 2020[35]
Share of Traded Sectors
While comparisons with the overall economy are useful, it is important to compare the IT sector with other industries that are also globally traded. The reason is simple: The United States does not have to worry about losing its barbershop or dry-cleaning industries to foreign competition, as Americans can only patronize barbers or dry cleaners in the United States. But globally traded sectors, such as computer production, software publishing, and automobile production, can be lost to foreign competitors, in which case the number of good jobs is reduced, the trade deficit worsens, and the value of the dollar goes down.
Moreover, changes in traded sector output and jobs have multiplier effects on overall domestic output while changes in nontraded sectors do not. At the regional level, this is why mayors and governors welcome job creation from traded sectors such as IT hardware and software. These industries bring money to the local or state economy, and the companies and their workers spend that money locally, creating even more jobs. As such, traded sector growth provides multiplier effects nontraded sectors do not. Expanding output in nontraded sectors such as barber shops or hospitals generally does not lead to the net increases in indirect and induced jobs that expanding output in traded sectors lead to.
This is why the Bay Area Technology Council found, “For each job created in the local high-tech sector, approximately 4.4 jobs are created in the local non-tradable sector in the long run. These jobs could be for lawyers, dentists, schoolteachers, cooks, or retail clerks. In short, the income generated by high-tech industries spurs a high rate of economic activity that supports local jobs.”[36] The multiplier is high because the high levels of disposable income these workers have create jobs in other sectors, including nontraded jobs. Moreover, IT companies buy inputs, which also supports jobs.
As discussed in appendix 1, ITIF classified all private sector enterprises as either traded or nontraded.In 2020, the IT sector accounted for 22.4 percent of the traded sector’s employees and 28 percent of its establishments.[37] (See figure 6.) In addition, the IT industry accounted for almost one-quarter (24.4 percent) of U.S. traded sector value added in 2020.[38]
Figure 6: IT sector as a share of all U.S. traded sectors[39]
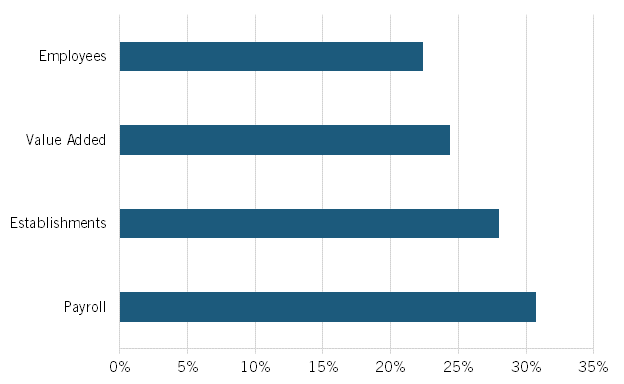
The IT industry accounted for almost one-quarter (24.4 percent) of the U.S. traded sector value added and 30.7 percent of the traded sector’s payroll.
Relative to other traded sectors, the IT sector offers higher wages, with average pay per employee 69 percent higher than the remaining traded sector’s pay per employee.[40] While it accounted for 22.4 percent of jobs, due to its high wages per employee, the sector accounted for 30.7 percent of the traded sector payroll.[41] In other words, the IT industry generates more national income per worker.[42]
Good Jobs, Including for Non-College-Educated Workers
The IT sector provides not only jobs but also good jobs, including for non-college-educated workers. For example, the software publishers industry pays the highest wages to non-college-educated workers of any industry.[43] While the software publishers industry employs a lower percentage of workers without college degrees—18.1 percent compared with 65 percent for all industries—these workers earn an average annual salary of $94,875, which is more than 2.5 times the group’s national average in 2019 ($35,915).[44] Moreover, the software publishers industry’s wages for non-college-educated workers are even greater than the average for all workers with at least a bachelor’s degree in the economy received in 2019 ($80,638).[45] In other words, an average non-college-educated worker in the software sector can potentially earn more than a college-educated worker in the overall economy. This is likely due partly to the fact that some workers in the industry have strong programming skills but no college degree and partly that there is an overall shortage of software workers, regardless of their level of education.
Non-college-educated workers in the IT sector can earn more than college-educated workers in the overall economy.
The IT industry employs a smaller share of workers with less than a college degree (35.6 percent) compared with all industries (64.6 percent).[46] However, the average wage for workers without a college degree in the IT industry is $53,023—50.1 percent more than the non-IT industry average of $35,320.[47] Moreover, the salary gap between IT industries and the rest of the economy is increasing: In 2008, salaries for non-college-educated workers were 49.9 percent larger in IT industries than in non-IT industries, compared with 50.1 percent in 2019.[48] Table 1 lists the seven high-tech IT industries that pay non-college workers at least 50 percent more than the non-college-educated national average salary of $35,915 in 2019.[49]
Table 1: Employment and wages of workers without college degrees in seven IT industries, 2019[50]
|
Industry Sector |
Average Wage |
Percentage Above Average |
Employment |
|
Software Publishers |
$94,875 |
164.2 |
23,721 |
|
Other Information Services (Except Libraries and Archives, Internet Publishing and Broadcasting, and Web Search Portals) |
$75,314 |
109.7 |
8,201 |
|
Computer Systems Design and Related Services |
$71,672 |
99.6 |
842,419 |
|
Internet Publishing and Broadcasting, and Web Search Portals |
$63,375 |
76.5 |
38,084 |
|
Computer and Peripheral Equipment |
$59,464 |
65.6 |
49,847 |
|
Navigation, Measuring, Electromedical, and Control Instruments |
$56,305 |
56.8 |
133,516 |
|
Data Processing, Hosting, and Related Services |
$56,032 |
56.0 |
65,421 |
Use of IT by Other Industries
Many industries across the U.S. and global economies utilize IT goods and services as key inputs in their production process. For example, thanks to IT agriculture has become more productive, using GPS-enabled farm equipment, soil sensors, and AI-powered analytics. According to the Bureau of Economic Analysis, the top 10 IT-intensive industries (industries that use the largest amount of IT intermediates as a share of their overall inputs) in the economy are:
▪ printed circuit assembly (electronic assembly) manufacturing;
▪ electronic computer manufacturing;
▪ electronic and precision equipment repair and maintenance;
▪ all other miscellaneous electrical equipment and component manufacturing;
▪ motor vehicle electrical and electronic equipment manufacturing;
▪ computer storage device manufacturing;
▪ semiconductor machinery manufacturing;
▪ audio and video equipment manufacturing;
▪ computer terminals and other computer peripheral equipment manufacturing; and
▪ federal general government (nondefense).[51]
These 10 IT-intensive industries, which make up 1.7 percent of the overall economy’s output, purchased approximately $40.4 billion in IT goods and services in 2019, with the industries making up about 10.2 percent of the economy’s use of IT intermediates in production.[52] They also spent the most on the following IT intermediates: semiconductor and related device manufacturing; other electronic computer manufacturing; audio and video equipment manufacturing; and computer systems design services.[53] As a result of the intensive use of these four IT intermediates by other industries, they collectively contributed 0.7 percent to the share of output in the economy.[54] Computer systems design services contributed the highest share of 0.4 percent to the economy’s total output in 2019.[55]
Furthermore, the IT industry contributed 0.35 percentage points to the economy’s value-added percentage growth (2.14 percent) in 2019 as either capital or physical assets used by other industries in their production process.[56] IT hardware and software contributed about 0.12 percentage points and 0.23 percentage points, respectively.[57]
IT-Intensive Industries and Inflation
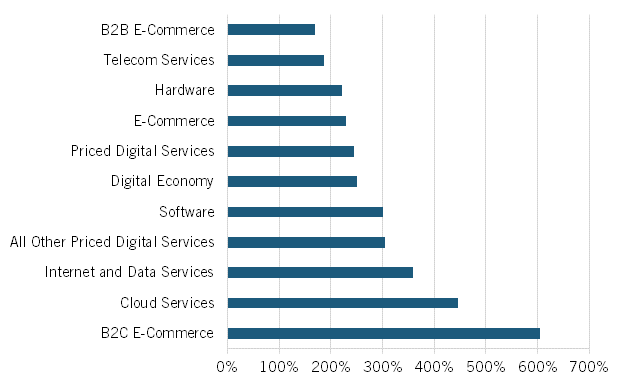
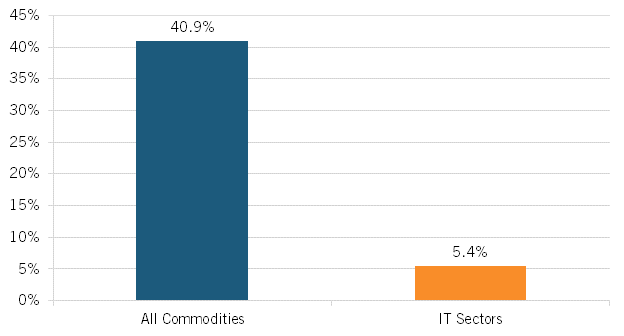
Because of its impact on improving quality and boosting efficiency, IT has long been deflationary. As an indication of the scale of that effect, consider that in 33 IT industries for which data is available, the average producer price index (PPI) rose 5.4 percent from 2012 to 2022, whereas the average PPI for all commodities rose 40.9 percent in the same period.[58] (See figure 7.) In other words, IT-based goods and services have been getting significantly cheaper compared with the rest of the economy.
Figure 7: Average 20-year increase in producer price index (PPI), 2012–2022
Not only have the prices of IT goods and services increased more slowly than inflation, but industries that use more IT as a share of their inputs tend to increase prices more slowly.
Not only have the prices of IT goods and services increased more slowly than inflation, but industries that use more IT as a share of their inputs tend to increase prices more slowly. The Bureau of Labor Statistics has data on the top 15 of 19 IT-intensive industries.[59] These 15 industries saw an average one-year percentage change in the January 2022 PPI of 5.5 percent, compared with a 1-year change in the overall final demand PPI of 10.1 percent.[60] The correlation between the total share of IT intermediates used by an industry and the 10-year change in PPI was -0.18 percent.[61] In other words, the more IT an industry used the lower its price increases were.
Conclusion
America’s IT sector stands out as one of the country’s most strategically important advanced industries, making outsized contributions to the broader U.S. economy in numerous ways. It is a job creator—not just in the IT sector itself, and not just for computer scientists and engineers, but also for non-college-educated workers and as a force multiplier for job creation throughout the economy. Critically, the IT sector is also globally competitive. It accounts for one-quarter of U.S. traded-sector value-added, and it commands 35 percent higher market share globally than the U.S. economy as a whole.
In the information-driven digital economy, the IT sector’s products and services are essential tools of production for companies and organizations in all other sectors of the economy, powering growth by spurring innovation and productivity. The sector also serves as a deflationary force, as the prices of IT goods and services have been getting significantly cheaper compared with the rest of the economy. Policymakers should take none of this for granted.
Appendix 1: Methodology
This study examines the IT sector, overall traded sectors (sectors that face global competition), and the overall U.S. economy. We defined the IT sector to include 48 six-digit NAICS code industries (See table 2.)
Table 2: IT industries for analysis
|
NAICS Code |
Industry |
|
334111 |
Electronic computer manufacturing |
|
334112 |
Computer storage device manufacturing |
|
334118 |
Computer terminal and other computer peripheral equipment manufacturing |
|
334210 |
Telephone apparatus manufacturing |
|
334220 |
Radio and television broadcasting and wireless communications equipment manufacturing |
|
334290 |
Other communications equipment manufacturing |
|
334310 |
Audio and video equipment manufacturing |
|
334412 |
Bare printed circuit board manufacturing |
|
334413 |
Semiconductor and related device manufacturing |
|
334416 |
Capacitor, resistor, coil, transformer, and other inductor manufacturing |
|
334417 |
Electronic connector manufacturing |
|
334418 |
Printed circuit assembly (electronic assembly) manufacturing |
|
334419 |
Other electronic component manufacturing |
|
334510 |
Electromedical and electrotherapeutic apparatus manufacturing |
|
334511 |
Search, detection, navigation, guidance, aeronautical, and nautical system and instrument manufacturing |
|
334512 |
Automatic environmental control manufacturing for residential, commercial, and appliance use |
|
334513 |
Instruments and related products manufacturing for measuring, displaying, and controlling industrial process variables |
|
334514 |
Totalizing fluid meter and counting device manufacturing |
|
334515 |
Instrument manufacturing for measuring and testing electricity and electrical systems |
|
334516 |
Analytical laboratory instrument manufacturing |
|
334519 |
Other measuring and controlling device manufacturing |
|
334613 |
Blank magnetic and optical recording media manufacturing |
|
334614 |
Software and other prerecorded compact disc, tape, and record reproducing |
|
454110 |
Electronic shopping and mail-order houses |
|
511210 |
Software publishers |
|
518210 |
Data processing, hosting, and related services |
|
519130 |
Internet publishing and broadcasting and web search portals |
|
519190 |
All other information services |
|
333242 |
Semiconductor machinery manufacturing |
|
333244 |
Printing machinery and equipment manufacturing |
|
333316 |
Photographic and photocopying equipment manufacturing |
|
335313 |
Switchgear and switchboard apparatus manufacturing |
|
335921 |
Fiber optic cable manufacturing |
|
335929 |
Other communication and energy wire manufacturing |
|
425110 |
Business to business electronic markets |
|
532210 |
Consumer electronics and appliances rental |
|
541511 |
Custom computer programming services |
|
541512 |
Computer systems design services |
|
541519 |
Other computer related services |
|
541715 |
Research and development in the physical, engineering, and life sciences (except nanotechnology and biotechnology) |
|
551114 |
Corporate, subsidiary, and regional managing offices |
|
541612 |
Human resources consulting services |
|
541690 |
Other scientific and technical consulting services |
|
541513 |
Computer facilities management services |
|
611420 |
Computer training |
|
811211 |
Consumer electronics repair and maintenance |
|
811212 |
Computer and office machine repair and maintenance |
|
811213 |
Communication equipment repair and maintenance |
ITIF selected 461 industries to represent the traded sector (those with significant exposure to global competition). This was a subjective exercise, as the federal government does not provide statistics at the six-digit NAICS level on exports or imports. These included most of agriculture, mining and manufacturing, and some services such as information services, engineering services, and market consulting services.
Annual payroll, employee count, and establishments count are the sums of the six-digit NAICS code categories in the IT sector, traded sector, or overall economy. About 4 percent—which is the share of IT employees in the economy—of “Human resources consulting services” and “Other scientific and technical consulting services” are included in the IT sector. Furthermore, “Corporate, subsidiary, and regional managing offices” is included in the IT sector using its share in the total economy to calculate its share in the sector. “Payroll per employee” is the sum of all annual payroll divided by employee count for the IT sector, traded sector, or overall economy. These estimates rely on data from the Census Bureau’s County Business Patterns survey for 2020 (the latest year of available data). The change in jobs in the IT industry from 2017 to 2020 relied on the Census Bureau’s Economic Census survey and County Business Patterns survey for 2017, and the County Business Patterns survey for 2020.
Value-added data was obtained from the Bureau of Economic Analysis’s Components of Value Added tables. “Value added” is defined as the gross output less its intermediate input. The aggregate value added of the IT sector and traded sector is the sum of the categories selected to belong to each sector. The categories selected are also subjective, as the Bureau of Economic Analysis does not have six-digit NAICS codes for value-added data. Value-added growth data was obtained from the Integrated Industry-Level Production Account’s Industry Level Production Account: Contributions to Aggregate Value Added Growth table from the Bureau of Economic Analysis.
Induced and supplier jobs created by the IT industry utilized multipliers obtained from the Economic Policy Institute’s Updated Employment Multipliers for the US economy. Induced and supplier job estimates are the result of multiplying employee counts in all IT industries (see table 2) obtained from the Census Bureau’s County Business Patterns survey for 2020 by the average of the IT industry multipliers. The category of multipliers does not use six-digit NAICS codes; however, they corresponded with the Bureau of Labor Statistics’ categories that utilize four-digit NAICS codes. As such, the multipliers selected have four-digit NAICS codes that correspond to the selected IT industries in table 2.
Export data was obtained from the Census Bureau’s USA Trade Online database. The goods export contribution of the IT sector and the traded sector is the sum of the four-digit NAICS industries selected to belong to each sector. The services exports of information and communications technology were obtained from the Bureau of Economic Analysis’s Table 3.1. U.S. Trade in ICT and Potentially ICT-Enabled Services by Type of Service.
Educational attainment and its corresponding wage data were obtained from the Census Bureau’s American Community Survey 1-Year Estimates – Public Use Microdata Sample 2019 and American Community Survey 1-Year Estimates – Public Use Microdata Sample 2008.
IT-intensive industries (industries that used the largest shares of IT intermediates as a share of their overall inputs) were obtained from the Bureau of Economic Analysis’s Use Table, Before Definition, Producers’ Value, 2012 table. The rankings of IT-intensive industries were obtained by summing the total IT intermediates each industry used and then dividing the result by the total intermediate the industry used. The inflation data utilized to calculate the 1-year and 10-year percentage change in the PPI were obtained from the Bureau of Labor Statistics’ Producer Price Index.
Appendix 2: Differences Between This ITIF Report and the Commerce Department’s Digital Economy Report
The estimates in the Department of Commerce’s Digital Economy report and data varies from this report’s estimates due to differences in methodology. The Digital Economy report uses older NAICS codes from 2007 and 2012 when selecting industries that belonged to the digital economy. In the ITIF report, only 2017 NAICS codes were used when selecting industries that belonged to the IT sector. As a result of this difference, exact comparisons between the Digital Economy report and this report’s estimates are challenging. Moreover, direct comparisons between the two reports are not possible, as the ITIF report relies only on six-digit NAICS codes when selecting IT industries while the Digital Economy report uses three-, five-, and six-digit NAICS codes in its selection of industries that belong to the digital economy. Because the Digital Economy report uses three-, five-, and six-digit NAICS codes in its selection of digital economy industries, its estimates tend to be larger than those of ITIF that use only six-digit NAICS codes. The comparison between the two reports is also hindered as the Digital Economy report uses external sources to isolate digital activities by industries that produce digital and nondigital products. ITIF does not have access to the share that was included for these industries. As such, the estimates between the two reports cannot be compared. Lastly, the differences in estimates between the two reports can also be attributed to the different data sources used. The Digital Economy report primarily used the supply-use table to obtain its estimates, whereas the ITIF report used Bureau of Economic Analysis, Census, and Bureau of Labor Statistics data to obtain its estimates.
Acknowledgment
This report was made possible in part by generous support from the Information Technology Industry Council. The Information Technology and Innovation Foundation (ITIF) maintains complete editorial independence in all its work. All opinions, findings, and recommendations are ITIF’s and do not necessarily reflect the views of its supporters. Any errors and omissions are the author’s alone.
About the Author
Robert D. Atkinson (@RobAtkinsonITIF) is the founder and president of ITIF. Atkinson’s books include Big Is Beautiful: Debunking the Myth of Small Business (MIT, 2018), Innovation Economics: The Race for Global Advantage (Yale, 2012), Supply-Side Follies: Why Conservative Economics Fails, Liberal Economics Falters, and Innovation Economics Is the Answer (Rowman Littlefield, 2007), and The Past and Future of America’s Economy: Long Waves of Innovation That Power Cycles of Growth (Edward Elgar, 2005). Atkinson holds a Ph.D. in city and regional planning from the University of North Carolina, Chapel Hill.
About ITIF
The Information Technology and Innovation Foundation (ITIF) is an independent, nonprofit, nonpartisan research and educational institute focusing on the intersection of technological innovation and public policy. Recognized by its peers in the think tank community as the global center of excellence for science and technology policy, ITIF’s mission is to formulate and promote policy solutions that accelerate innovation and boost productivity to spur growth, opportunity, and progress.
For more information, visit us at www.itif.org.
Endnotes
[1]. Robert D. Atkinson and Daniel Castro, “Digital Quality of Life: Understanding the Benefits of the IT Revolution” (ITIF, October 2008), https://itif.org/publications/2008/10/01/digital-quality-life-understanding-benefits-it-revolution/.
[2]. US Census Bureau, County Business Patterns Survey 2020 (establishment, payroll, and employee estimates, six-digit NAICS industries estimates), accessed April 28, 2022, https://data.census.gov/cedsci/table?g=0100000US&d=ECNSVY%20Business%20Patterns%20County%20Business%20Patterns&n=N0600.00&tid=CBP2020.CB2000CBP.
[3]. Ibid.
[4]. Ibid.; Economic Policy Institute, Updated employment multipliers for the U.S. economy (Table A2), accessed April 5, 2022, http://go.epi.org/jobmultiplierdata.
[5]. US Census Bureau, American Community Survey 1-year Estimates Public Use Microdata Sample 2019 (educational attainment, wage, and industries estimates), accessed April 28, 2022, https://data.census.gov/mdat/#/.
[6]. US Census Bureau, County Business Patterns Survey 2020 (establishment, payroll, and employee estimates, six-digit NAICS industries estimates).
[7]. Robert D. Atkinson, “The Hamilton Index: Assessing National Performance in the Competition for Advanced Industries” (ITIF, June 2022), https://itif.org/publications/2022/06/08/the-hamilton-index-assessing-national-performance-in-the-competition-for-advanced-industries/.
[8]. Atkinson, “The Hamilton Index.”
[9]. Ibid.
[10]. US Census Bureau, County Business Patterns Survey 2020, op. cit.
[11]. Ibid.
[12]. Tina Highfill and Christopher Surfield, New and revised Statistics of the U.S. Digital Economy, 2005–2020 (Washington DC, Bureau of Economic Analysis, May 2022), 8, https://www.bea.gov/system/files/2022-05/New%20and%20Revised%20Statistics%20of%20the%20U.S.%20Digital%20Economy%202005-2020.pdf.
[13]. Ibid.
[14]. US Census Bureau, County Business Patterns Survey 2020 (establishment, payroll, and employee estimates, 6-digit NAICS industries estimates).
[15]. Ibid.; US Census Bureau, Economic Census Survey 2017 (establishment, payroll, and employee estimates, six-digit NAICS industries estimates), accessed March 18, 2022, https://data.census.gov/cedsci/table?n=N0600.00&tid=ECNBASIC2017.EC1700BASIC; US Census Bureau, County Business Patterns 2017 (educational services six-digit NAICS establishment, payroll, and employee estimates), accessed March 18, 2022, https://data.census.gov/cedsci/table?n=N0600.61&tid=CBP2017.CB1700CBP&nkd=EMPSZES~001,LFO~001; US Census Bureau, County Business Patterns 2017 (agriculture, forestry, fishing and hunting six-digit NAICS establishment, payroll, and employee estimates), accessed March 18, 2022, https://data.census.gov/cedsci/table?n=N0600.11&tid=CBP2017.CB1700CBP&nkd=EMPSZES~001,LFO~001. Author’s analysis: The 2017 employment data for all industries uses a combination of the 2017 Economic Census survey and the 2017 County Business Patterns survey.
[16]. Ibid. Author’s analysis: The following six-digit NAICS industries in table 2 were considered software and services: software and other prerecorded compact disc, tape, and record reproducing; business to business electronic markets; electronic shopping and mail-order houses; software publishers; data processing, hosting, and related services; internet publishing and broadcasting and web search portals; all other information services; consumer electronics and appliances rental; custom computer programming services; computer systems design services; other computer related services; human resources consulting services; other scientific and technical consulting services; research and development in the physical, engineering, and life sciences (except nanotechnology and biotechnology); corporate subsidiary, and regional managing offices, computer facilities management services; computer training; consumer electronics repair and maintenance; computer and office machine repair and maintenance; and communication equipment repair and maintenance. All other industries not listed were considered hardware.
[17]. Tina Highfill and Christopher Surfield, New and revised Statistics of the U.S. Digital Economy, 2005–2020, 8.
[18]. US Census Bureau, County Business Patterns Survey 2020 (establishment, payroll, and employee estimates, six-digit NAICS industries estimates); US Census Bureau, USA Trade Online data (export estimates for four-digit NAICS industries), accessed March 18, 2022, https://usatrade.census.gov; Bureau of Bureau of Economic Analysis, Value Added by Industry data (U. Value Added by Industry; accessed March 18, 2022), https://apps.bea.gov/iTable/iTable.cfm?isuri=1&reqid=151&step=1.
[19]. US Census Bureau, County Business Patterns Survey 2020 (establishment, payroll, and employee estimates, six-digit NAICS industries estimates).
[20]. Ibid.
[21]. Bureau of Economic Analysis, Value Added by Industry data (U. Value Added by Industry). Author’s analysis: The value added data does not use six-digit NAICS codes, which made it challenging to objectively compare the IT industries in table 2 to the value added data. The following categories in the value added data were subjectively selected to represent the IT industries’ value added: computer and electronic products; data processing, internet publishing, and other information services; nonstore retailers; and software publishers.
[22]. Ibid.
[23]. Ibid.
[24]. Tina Highfill and Christopher Surfield, New and revised Statistics of the U.S. Digital Economy, 2005-2020, 1.
[25]. Tina Highfill and Christopher Surfield, New and revised Statistics of the U.S. Digital Economy, 2005-2020, 7.
[26]. US Bureau of Economic Analysis, New Digital Economy Estimates, 2005–2020.
[27]. Ibid.; Bureau of Economic Analysis, Value Added by Industry data (U. Real Value Added by Industry), accessed May 10, 2022, https://apps.bea.gov/iTable/iTable.cfm?isuri=1&reqid=151&step=1.
[28]. US Census Bureau, USA Trade Online data (export estimates for four-digit NAICS industries. Author’s analysis: There are only 22 IT industries instead of the 48 industries in table 2 when four-digit NAICS codes are used instead of six-digit NAICS codes. The 11 four-digit NAICS IT industries available in the export data include the following: industrial machinery; commercial and service industry machinery; computer equipment; communications equipment; audio and video equipment; semiconductor and other electronic components; navigational/measuring/ medical/control instrument; magnetic and optical media; electrical equipment; electrical equipment and components, nesoi; and software, nesoi. The following IT industries in table 2 were not included in the export data: electronic shopping and mail-order houses; data processing, hosting, and related services; internet publishing and broadcasting and web search portals; all other information services; business to business electronic market; consumer electronics and appliances rental; custom computer programming services; computer systems design services; other computer related services; research and development in the physical, engineering, and life sciences (except nanotechnology and biotechnology); corporate subsidiary, and regional managing offices; human resources consulting services; computer facilities management services; computer training; consumer electronics repair and maintenance; computer and office machine repair and maintenance; and communication equipment repair and maintenance.
[29]. Ibid.
[30]. Ibid.
[31]. Bureau of Economic Analysis, International Transactions, International Services, and International Investment Position Tables (Table 3.1. U.S. Trade in ICT and Potentially ICT-Enabled Services by Type of Service), accessed May 9, 2022, https://apps.bea.gov/iTable/iTable.cfm?reqid=62&step=9&isuri=1&6210=4#reqid=62&step=9&isuri=1&6210=4.
[32]. US Census Bureau, County Business Patterns Survey 2020 (establishment, payroll, and employee estimates, six-digit NAICS industries estimates).
[33]. Ibid.; Economic Policy Institute, Updated employment multipliers for the U.S. economy (Table A2), accessed April 5, 2022, http://go.epi.org/jobmultiplierdata.
[34]. Ibid.
[35]. Ibid.
[36]. Bay Area Council Economic Institute, “Local Multipliers in the High-Technology Sector” (BACEI, April 2022), http://www.bayareaeconomy.org/files/pdf/BACEI_TechMultiplier_April2022b.pdf.
[37]. US Census Bureau, County Business Patterns Survey 2020 (establishment, payroll, and employee estimates, six-digit NAICS industries estimates).
[38]. Bureau of Economic Analysis, Value Added by Industry data (U. Value Added by Industry).
[39]. Ibid.
[40]. US Census Bureau, County Business Patterns Survey 2020 (establishment, payroll, and employee estimates, six-digit NAICS industries estimates).
[41]. Ibid.
[42]. Ibid.
[43]. US Census Bureau, American Community Survey 1-year Estimates Public Use Microdata Sample 2019 (educational attainment, wage, and industries estimates), accessed April 28, 2022, https://data.census.gov/mdat/#/.
[44]. Ibid.
[45]. Ibid.
[46]. Ibid.
[47]. Ibid.
[48]. Ibid.; US Census Bureau, American Community Survey 1-year Estimates Public Use Microdata Sample 2008 (educational attainment, wage, and industries estimates), accessed April 26, 2022, https://data.census.gov/mdat/#/.
[49]. US Census Bureau, American Community Survey 1-year Estimates Public Use Microdata Sample 2019 (educational attainment, wage, and industries estimates), accessed April 28, 2022, https://data.census.gov/mdat/#/.
[50]. Ibid.
[51]. US Bureau of Economic Analysis, The Use of Commodities by Industry, Before Redefinitions (Producers’ Prices) – Detail (Use Table, Before Redefinition, Producers’ Value, 2012 table), accessed March 26, 2022, https://apps.bea.gov/iTable/iTable.cfm?isuri=1&reqid=151&step=1.
[52]. Ibid.
[53]. Ibid.
[54]. Ibid.
[55]. Ibid.
[56]. US Bureau of Economic Analysis, Integrated Industry-Level Production Account (KLEMS) (Industry-level Production Account: Contributions to Aggregate Value Added Growth), accessed April 5, 2022, https://www.bea.gov/data/special-topics/integrated-industry-level-production-account-klems. Author’s analysis: The KLEMS data is calculated using a Tornqvist index. The growth rates are in log growth.
[57]. Ibid.
[58]. US Bureau of Labor Statistics, PPI Detailed Report Data for June 2012 (producer price index, Table 5 for IT Industries and Table 6 for All Commodities), accessed August 16, 2022, https://www.bls.gov/ppi/detailed-report/ppi-detailed-report-june-2012.pdf; US Bureau of Labor Statistics, PPI Detailed Report Data for June 2012 (producer price index, Table 11 for IT Industries and Table 9 for All Commodities), accessed August 16, 2022, https://www.bls.gov/ppi/detailed-report/ppi-detailed-report-june-2022.pdf; US Bureau of Economic Analysis, The Use of Commodities by Industry, After Redefinitions (Producers’ Prices) – Detail (Use Table, After Redefinition, Producers’ Value, 2012 table), accessed August 16, 2022, https://apps.bea.gov/iTable/iTable.cfm?isuri=1&reqid=151&step=1.
Author’s analysis: Data is available for the following 33 IT industries: electronic computer manufacturing; computer storage device manufacturing; computer terminal and other computer peripheral equipment manufacturing; telephone apparatus manufacturing; radio and television broadcasting and wireless communications equipment manufacturing; other communications equipment manufacturing; audio and video equipment manufacturing; bare printed circuit board manufacturing; semiconductor and related device manufacturing; capacitor, resistor, coil, transformer and other inductor manufacturing; electronic connector manufacturing; printed circuit assembly (electronic assembly) manufacturing; other electronic component manufacturing; electromedical and electrotherapeutic apparatus manufacturing; search, detection, navigation, guidance, aeronautical, and nautical system and instrument manufacturing; automatic environmental control manufacturing for residential, commercial, and appliance use; instruments and related products manufacturing for measuring, displaying, and controlling industrial process variables; totalizing fluid meter and counting device manufacturing; instrument manufacturing for measuring and testing electricity and electrical systems; analytical laboratory instrument manufacturing; other measuring and controlling device manufacturing; blank magnetic and optical recording media manufacturing; software and other prerecorded compact disc, tape, and record reproducing; electronic shopping and mail-order houses; software publishers; data processing, hosting, and related services; internet publishing and broadcasting and web search portals; semiconductor machinery manufacturing; printing machinery and equipment manufacturing; photographic and photocopying equipment manufacturing; switchgear and switchboard apparatus manufacturing; fiber optic cable manufacturing; and other communication and energy wire manufacturing.
The PPI for the 33 IT industries is weighted using their output as a share of the 33 IT industries’ total output. Output data for each IT industry came from the BEA’s Use of Commodities by Industry, After Redefinitions (Producers’ Prices)-Detail table.
[59]. U.S. Bureau of Labor Statistics, Producer Price Index – PPI Industry Data (producer price index estimates for industries), accessed April 1, 2022, https://data.bls.gov/PDQWeb/pc. Author’s analysis: The Bureau of Labor Statistics only has data for the following top 19 IT-intensive industries: printed circuit assembly (electronic assembly) manufacturing; electronic computer manufacturing; all other miscellaneous electrical equipment and component manufacturing; motor vehicle electrical and electronic equipment; computer storage device manufacturing; semiconductor machinery manufacturing; irradiation apparatus manufacturing; audio and video equipment manufacturing; computer terminal and other computer peripheral equipment manufacturing; internet publishing and broadcasting and web search portals; electromedical and electrotherapeutic apparatus; other electronic component manufacturing; software publishers; telephone apparatus manufacturing; and photographic and photocopying equipment manufacturing.
[60]. US Bureau of Labor Statistics, Producer Price Index – PPI Commodities Data (producer price index estimates for final demand of all commodities), accessed April 27, 2022, https://data.bls.gov/cgi-bin/surveymost?wp.; US Bureau of Labor Statistics, Producer Price Index – PPI Industry Data (producer price index estimates for industries), accessed April 1, 2022, https://data.bls.gov/PDQWeb/wp.
[61]. Ibid.; US Bureau of Economic Analysis, The Use of Commodities by Industry, Before Redefinitions (Producers’ Prices) – Detail (Use Table, Before Redefinition, Producers’ Value, 2012 table), accessed March 26, 2022, https://apps.bea.gov/iTable/iTable.cfm?isuri=1&reqid=151&step=1.
