Source: USA Trade, “HS District-level Data,” HS codes 27–96, accessed September 12, 2022; Bureau of Economic Analysis, “National Data: Gross Domestic Product,” Table 1.1.5, accessed September 12, 2022.
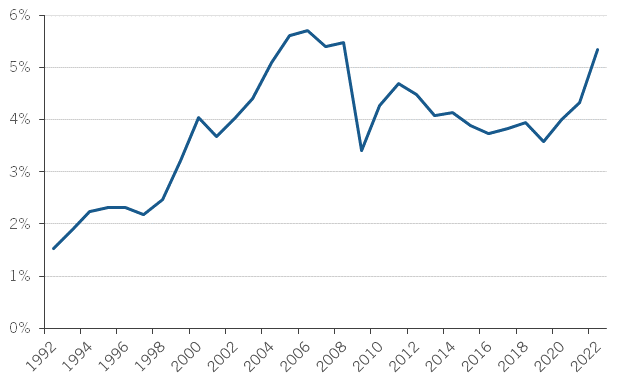
Commentary: After falling from its peak of 5.7 percent in 2006 to 3.6 percent in 2019, the United States’ manufacturing trade deficit as a share of its GDP has risen to 5.3 percent in 2022 through June, its highest level since 2008 (5.5 percent). Manufacturing goods are defined here as those falling under Harmonized System codes 27–96 and therefore exclude manufactured food, beverage, and tobacco products. This comes despite manufacturing exports as a share of GDP reaching its highest level since at least 1992 at 8.4 percent. Nevertheless, manufacturing imports rose faster and account for 13.7 percent of GDP through June of this year.
Manufacturing trade deficit (minus food, beverage, and tobacco manufacturing) as a share of GDP, 1992–2022