
The 2017 State New Economy Index
The State New Economy Index uses 25 indicators to measure the extent to which state economies are knowledge-based, globalized, entrepreneurial, IT-driven, and innovation-oriented.
Different geographies and jurisdictions play different roles in the global economy. Some specialize in what economists call “seedbed” functions—generating new products and firms, often through cutting-edge innovation. Others specialize in corporate functions by offering attractive environments for company headquarters or other management activities. Still others specialize in more routine production functions for goods or services, handling aspects of the work that involve less innovation and have lower skill requirements. Finally, some regions specialize in resource production tied to geographical endowments, such as minerals, arable land, or lumber.
Regardless of the particular focus of a regional or state economy, however, a defining trend of this era is the degree to which all have become more reliant on innovation as new technologies have become critical drivers of productivity and competitiveness. This is abundantly clear from both traditional economic data, such as high-tech export activity, and newer metrics, such as broadband deployment. All regions have technological or innovation-driven activity occurring locally, either because long-established industries such as agriculture, mining, manufacturing, and professional services are rapidly evolving into tech-enabled industries, or because new developments such as cloud computing and ubiquitous access to broadband Internet service allow innovators to create new, IT-enabled enterprises in virtually any connected small town or rural area they may choose.
Yet policy discussions about America’s innovation-driven, high-tech economy too often spotlight just a few iconic places, such as the Route 128 tech corridor around Boston, Massachusetts; Research Triangle Park between Raleigh, Durham, and Chapel Hill, North Carolina; Austin, Texas; Seattle, Washington; and, of course, California’s always white-hot Silicon Valley. This was the case when the first edition of this report came out almost 20 years ago, and it remains true for the most part today. It has always been too myopic a view of how innovation is distributed across the country, and it is increasingly out of step with reality, because many other metropolitan areas and regions—from Denver to Salt Lake City to Minneapolis and St. Paul—are becoming innovative hot spots, too.
An unfortunate result of this myopia has been that policy debates about innovation and economic development have come to be seen as the province of only the few states and regions that are recognizably tech-heavy, while others are typecast to focus on their traditional bread and butter. This needs to change, not only because the premise is incorrect, but also because the states’ and regions’ competitive positions in the U.S. and global economies hinge on developing broad-based understandings and support for modernizing policy frameworks to spur innovation and growth.
To be well positioned to take advantage of technological innovation and thrive amid the ebbs and flows of the global economy, states need to be firmly grounded in what we and others have called “New Economy” success factors. This report assembles an index of 25 indicators across five economic categories to assess states’ fundamental capacities to successfully navigate an economy driven by technological innovation. It measures the degree to which state economies are knowledge-based, globalized, entrepreneurial, IT-driven, and innovation-based. The report then discusses some overarching strategic issues facing states, examines the role of large and small businesses in driving growth, and finally discusses a number of innovative models around the nation to spur workforce training and technology commercialization.
The Index
The purpose of the State New Economy Index is to measure states’ economic structure. Unlike other reports that assess state economic performance or state economic policies, this study focuses more narrowly on a simple question: To what degree does the structure of the 50 state economies match the ideal structure of the innovation-driven New Economy? For example, we know that a defining characteristic of the New Economy is that it is global. Therefore, the Index uses a number of variables to measure state economies’ degrees of global integration.
This edition of the Index builds on seven prior editions, which were published in 1999, 2002, 2007, 2008, 2010, 2012, and 2014. It now uses 25 indicators, which are divided into five categories that best capture what is important about the New Economy:
- Knowledge jobs: Indicators measure employment of IT professionals outside the IT industry; jobs held by managers, professionals, and technicians; the educational attainment of the entire workforce; immigration of knowledge workers; migration of domestic knowledge workers; worker productivity in the manufacturing sector; and employment in high-wage traded services.
- Globalization: Indicators measure foreign direct investment; export orientation of manufacturing and services; and the share of each state’s output that goes to high-tech goods and services exports.
- Economic dynamism: Indicators measure the degree of business churn (i.e., the percentage of new business start-ups and failures); the number of fast-growing firms (businesses listed in the Inc. 5000 index); the number and value of initial public stock offerings (IPOs) by companies; and the number of individual inventor patents granted.
- The digital economy: Indicators measure Internet and computer use by farmers; the degree to which state governments use information technologies to deliver services; adoption rates and speed of broadband telecommunications; and use of information technology in the health care system.
- Innovation capacity: Indicators measure the number of jobs in high-tech industries such as electronics manufacturing, telecommunications, and biomedical industries; the number of scientists and engineers in the workforce; the number of patents granted; industry investment in research and development; non-industry investment in research and development; movement toward a clean energy economy; and venture capital investment.
Download the 2017 Master Table (PDF).
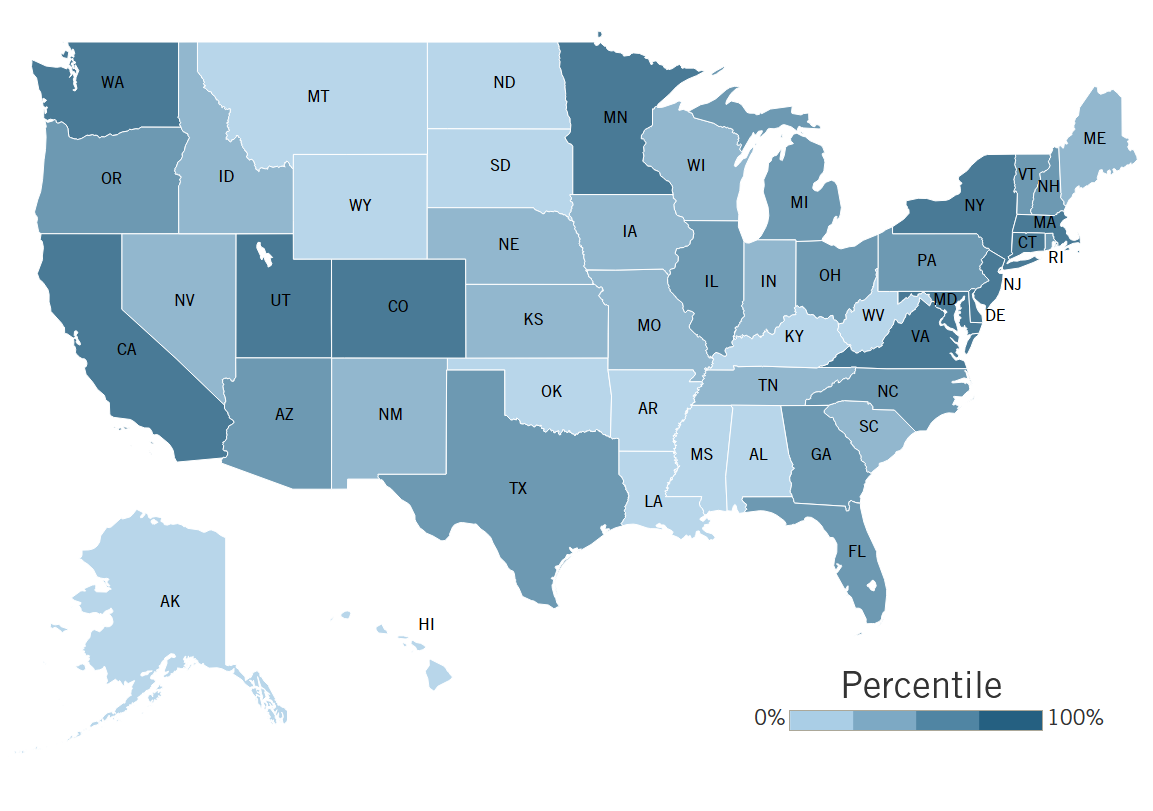
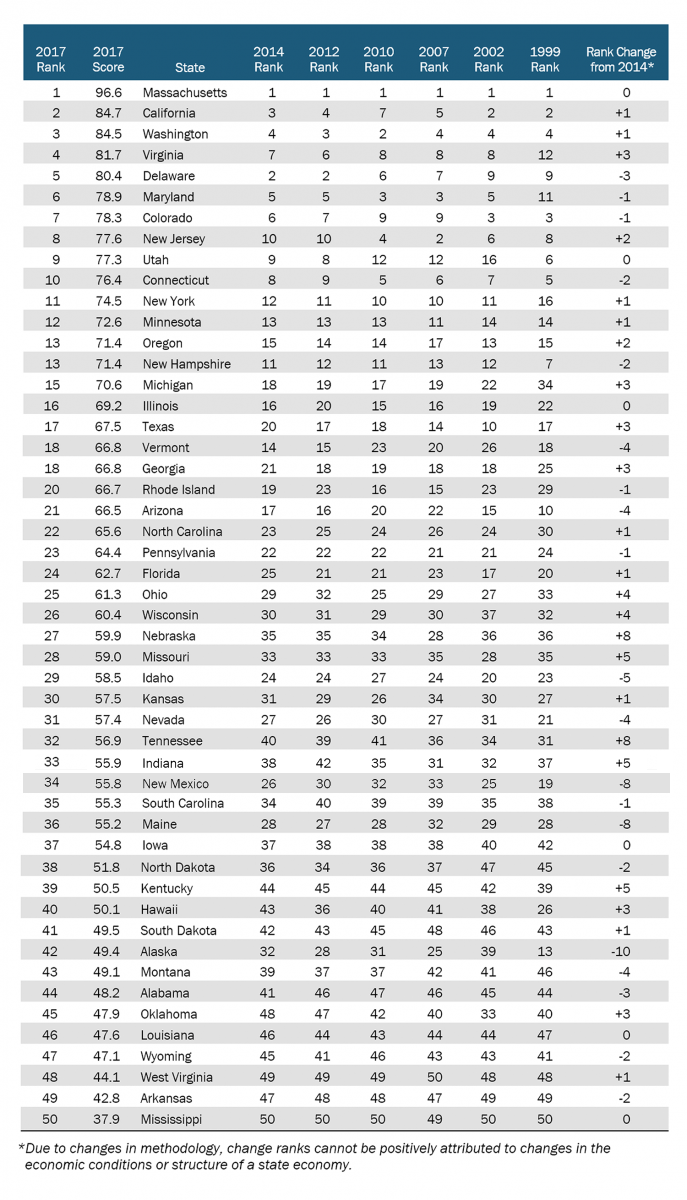
Overall Scores
Editors’ Recommendations
June 11, 2014
The 2014 State New Economy Index
December 6, 2012
The 2012 State New Economy Index
November 18, 2010
