
High-Tech Nation: How Technological Innovation Shapes America’s 435 Congressional Districts
America’s innovation-driven, high-tech economy isn’t concentrated around a few hubs like Silicon Valley; it is widely diffused—and every state and congressional district has a stake in its success.
Introduction
For years, policy discussions about America’s innovation-driven, high-tech economy have focused on just a few iconic places, such as the Route 128 tech corridor around Boston, Massachusetts; Research Triangle Park in Raleigh, Durham, and Chapel Hill, North Carolina; Austin, Texas; Seattle, Washington; and, of course, California’s white-hot Silicon Valley. This has always been too myopic a view of how innovation is distributed across the country, because many other metropolitan areas and regions—from Phoenix to Salt Lake City to Philadelphia—are innovative hot spots, too, and many more areas are developing tech capabilities. An unfortunate result of this myopia has been that policy debates about how to bolster the country’s innovative capacity have often been seen as the province of only the few members of Congress who represent districts or states that are recognizably tech-heavy, while many members from other districts focus on other issues. This needs to change, not only because the premise is incorrect, but also because the country’s competitive position in the global economy hinges on developing a broad-based, bipartisan, bicameral understanding and support for federal policies to spur innovation and growth.
A defining trend of the last decade is the degree to which technology—information technology, in particular—has become a critical driver of productivity and competitiveness for the whole economy, not just the tech sector itself. This is abundantly clear throughout the United States, as revealed in both traditional economic data, such as high-tech export activity, and in newer metrics, such as broadband deployment. Indeed, all districts have some kind of technology and innovation-driven activity occurring locally, either because long-established industries such as agriculture, mining, manufacturing, and professional services are rapidly evolving into tech-enabled industries, or because new developments such as cloud computing and ubiquitous access to broadband Internet service allow innovators to create new, IT-enabled enterprises in any small town or rural area they may choose, not just in Silicon Valley or Boston.
The purpose of this report is to shed light on just how widely diffused the country’s innovation-driven, high-tech economy really is, so members of Congress and other policymakers can find common cause in advancing an agenda that builds up the shared foundations of national strength in a globally integrated marketplace.
Among other things, these shared foundations include:
- A highly educated and skilled workforce, for which there must be better STEM education in high schools and colleges, along with policies that encourage high-skilled immigration;
- Robust research and development, which demands expanded federal investments in scientific and engineering research, along with corporate tax reforms that include key incentives such as an expanded R&D tax credit and an “innovation box”;
- Digital-age infrastructure, including not just wireline and wireless broadband, but also hybrid digital infrastructure that incorporates sensors and other information technologies to boost productivity by speeding the flow of people, products, services, and information; and
- Globally competitive high-tech industries, which need all of those things, plus the right regulatory and trade policies so companies can grow and access global markets.
The report draws on 20 indicators of the innovation economy to paint statistical portraits of all 435 U.S. congressional districts, 50 states, plus the District of Columbia. The indicators include measures of innovative vitality in four main areas:
- Exports of high-tech goods and services, including manufacturing, IT services, and royalty and license services;
- Workforce education and skills, including the numbers of workers in high-tech sectors and STEM occupations, and the number of highly educated immigrants;
- Innovative ideas, including patent-related activity and public funding for R&D; and
- Digital infrastructure, including the share of households with access to broadband Internet services and the number of broadband providers in each district.
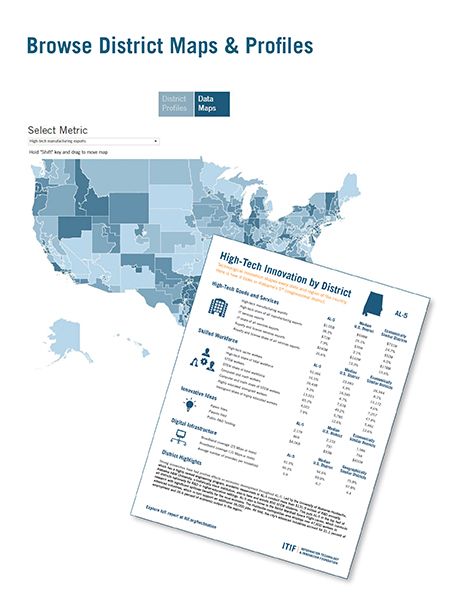
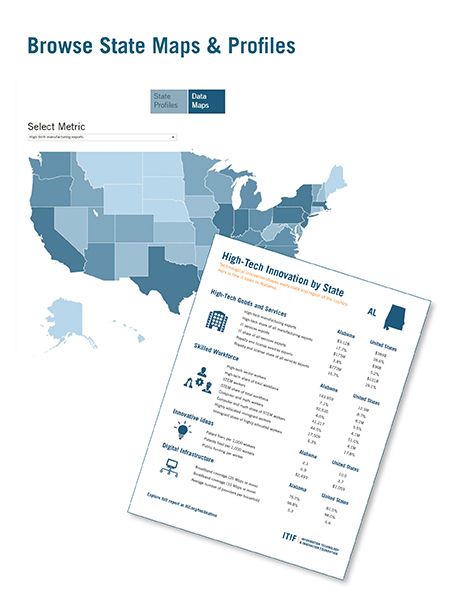
In addition to an overview report that ranks the top 50 congressional districts and all 50 states on each of these indicators, this report includes interactive features to browse the data in depth. Browse the congressional district maps to view and download individual district profiles with complete statistics and other highlights, and browse the state maps to view and download statewide totals.
What the Data Reveal About the Innovation-Driven, High-Tech Economy
The data in this report underscore how technological innovation shapes the entire U.S. economy—including every congressional district, in every part of the country. For example, the high-tech sector employs nearly 30,000 people per congressional district, on average, totaling just under 13 million people nationwide. There is not a district in the country that is not home to at least a few dozen tinkerers and innovators who have filed patent applications in recent years—and three-quarters of all districts have had 1,000 or more of these patent filers. Meanwhile, more than half of all congressional districts received at least $50 million in federal research funding in the last two fiscal years. And in more than half of all congressional districts, every single household has access to broadband Internet service with speeds in excess of 10 Mbps. (Indeed, there are no congressional districts in which fewer than 80 percent of households have access to that level of broadband Internet service.)
Digging further into the data, there are a number of telling relationships between indicators. The first is that there is little correlation between strength in exporting high-tech manufactured products and strength in exporting either IT services (where the correlation coefficient is 0.15, which is close to nonexistent on a scale of negative one to one) or intellectual property-based services (where it is 0.31), though there is a moderate correlation between the latter two categories (0.55). In other words, a congressional district can very easily be strong in one area, but not necessarily in the others. This underscores the significance of the trend in which technological innovation—through IT and other means—is transforming every sector of the economy, and must continue to do so for the country to build its competitive edge. In short, the U.S. economy is extremely diverse, and different regions may specialize in different products and services, but all industries have an opportunity to capitalize on technological innovation to increase their productivity and competitiveness, thereby increasing their employees’ wages and Americans’ standards of living.
A second noteworthy pattern is that there is a very strong correlation (0.74) between high-tech employment and IT service exports. On the one hand, this is not surprising, because high-tech employment encompasses the IT services sector. But the correlation is nonetheless significant because it underscores how high-skill, high-wage jobs depend on access to global markets. There is a similarly strong correlation (0.72) between the number of highly skilled immigrants in a district and the value of its IT service exports. Likewise, there are strong correlations at the district level between highly skilled immigration and employment in computer and math occupations (0.74), in the broader category of STEM occupations (0.73), and in the overlapping universe of high-tech occupations (0.65). This highlights the valuable role that highly educated and skilled immigrants play in America’s innovation ecosystem, and it explains why talent has become one of the world’s most sought-after commodities.
Finally, there is a strong correlation at the district level between the number of workers in STEM occupations and the number in high-tech occupations (0.70)—and there are clear connections between federal R&D funding and both of those indicators (correlations of 0.52 and 0.54, respectively). Meanwhile, there are consistent correlations between the number of people filing patent applications in a given congressional district and most other measures of strength in the innovation-driven, high-tech economy, including IT service exports (0.61), intellectual property-based service exports (0.55), and STEM jobs as a share of total employment (0.65). These connections illustrate the essential, catalytic role that public and private investments in research and development play in creating knowledge, sparking innovation, and driving growth economy-wide.
Implications for Policymakers
The nation—every state and congressional district—has a stake in continuing to strengthen the underlying foundations of the innovation-driven high-tech economy, because that is the surest way to boost productivity and competitiveness, and thereby raise people’s standards of living. But putting innovation, productivity, and competitiveness in the center of the national economic agenda requires that policymakers look beyond the confines of traditional partisan ideology—including the left’s “demand-side” focus on getting money into middle-class pockets and the right’s “supply-side” focus on increasing the supply of capital—and instead embrace a strategy that is grounded in several essentials:
- A highly educated and skilled workforce;
- Robust public investment in research and development;
- World-class digital-age infrastructure;
- “Smart government” policies, including how agencies procure and implement technology in their own operations, and how government spurs adoption of emerging information technologies more broadly (e.g., Internet of Things, smart cities, etc.);
- Tax and regulatory policies that encourage firms to invest in technology; and
- Strong connections to the global marketplace, but through a rules-based, carefully enforced trading system.
