


The Great Revealing: Taking Competition in America and Europe Seriously

With its provocative claim that America now has less economic competition than the EU, Thomas Philippon’s book The Great Reversal has become a bible for neo-Brandeisians. But reports of the death of competition in America are highly exaggerated: While U.S. antitrust remains effective, EU competition policy has failed to stimulate innovation, productivity, or growth.
KEY TAKEAWAYS
Key Takeaways
Contents
Market Concentration and Profit Myths 3
Firms in Concentrated Industries Don’t Underinvest 8
More-Concentrated Industries Are More Productive. 9
Concentration Is Not Eroding Labor’s Share of Income. 11
Faulty Analysis of Airlines and Broadband. 14
Competition in Europe and the United States 23
The Harms of Big-Is-Bad European Antitrust 27
Introduction
The argument that formerly intense competition in the United States has decreased while competition in the European Union has risen is the primary thesis that underpins Thomas Philippon’s 2017 book, The Great Reversal: How America Gave Up on Free Markets. Philippon painted a grim picture of the U.S. economy, stating that “concentration is high in many industries, leaders are entrenched, and their profit rates are excessive.”[1]
His book has received significant attention in U.S. policy circles, largely because it reinforced a political narrative for neo-Brandeisians: If America were now the economy with too much concentration, not Europe, the way would be open for dramatic changes in law and enforcement. Elite universities such as Berkeley and the University College of London invited Philippon to speak about the death of American competition.[2] The Great Reversal has generated hundreds of academic citations and countless reviews in major newspapers such as the Wall Street Journal and the New York Times.[3] Antitrust scholar Jan Eeckhout called the book “a remarkable piece
of research that draws our attention to a timely and relevant issue: the rise of market power.”
Even the Biden administration cited the book in its 2021 Executive Order on Promoting Competition in the American Economy with a bold, and wrong, claim: “Higher prices and lower wages caused by lack of competition are now estimated to cost the median American household $5,000 per year.”[4]
Philippon’s research is fraught with flaws, such as wrongly defined markets, poor assessments of profits, and cherry-picked examples. After making the necessary adjustments to his analysis, we find no evidence of increased profitability or concentration.
In place of an unsubstantiated “Great Reversal,” this report suggests that the U.S. economy remains competitive. And while there is limited data on EU concentration ratios, at least one study finds that manufacturing concentration ratios in the major EU economies have increased—not decreased, as Philippon would have the reader believe.[5] Labor productivity is growing faster in the United States than in Europe, and there is no significant difference in markups between the two regions.
Rather, overly aggressive antitrust enforcement, as seen in the EU (and promoted by neo-Brandeisians in the United States such as Federal Trade Commission (FTC) Chair Lina Khan), fragments markets at the expense of needed scale. Because firm size is positively associated with investment and productivity, “big-is-bad” antitrust harms EU workers and makes European industries less globally competitive. Instead of adopting the failed European approach to antitrust, American policymakers should study the economics of each antitrust issue according to the total welfare standard (e.g., does it boost overall economic growth?). If enforcers properly weigh the costs and benefits of enforcement actions, they can protect consumers and help grow the economy.
Market Concentration and Profit Myths
Philippon made two core claims: Concentration has increased more in the United States than in Europe and concentration has resulted in higher U.S. business profits. Neither is supported by the data.
Concentration Is Not Up
In The Great Reversal, Philippon assessed changes in the market share of the top eight firms in an industry (CR8). He found that “the increase [in CR8] is large, from 15 percent to 25 percent.”[6] He added that the “rise in concentration is well documented,” blaming “economic rents and barriers to competition.”[7] In other words, he says the rise in concentration harms consumers.
FTC leadership and White House officials echoed his claims. President Biden’s 2021 executive order assumes that “corporate consolidation has been accelerating” and that in over “75 percent of U.S. industries, a smaller number of large companies now control more of the business than they did twenty years ago.”[8] FTC chair Lina Khan alleged that the United States faces a “sweeping market power problem” because of lax antitrust enforcement.[9]
The key problem in this analysis is it relies on misleading market concentration measurements. Philippon used 3-digit North American Industry Classification System (NAICS) codes to assess concentration. These NAICS codes break down the economy into just over 70 industries.[10] They combine unrelated companies under a single umbrella and consider them competitors. “Agricultural products” (NAICS code 111), for instance, is a single industry in 3-digit NAICS even though it combines unrelated industries such as apples (NAICS code 111331), tobacco (NAICS code 111910), and cotton (NAICS code 111910).[11] But firms only gain market power when there are few substitutes for their products, so measuring market power requires well-defined industries. The 3-digit NAICS codes are not that.
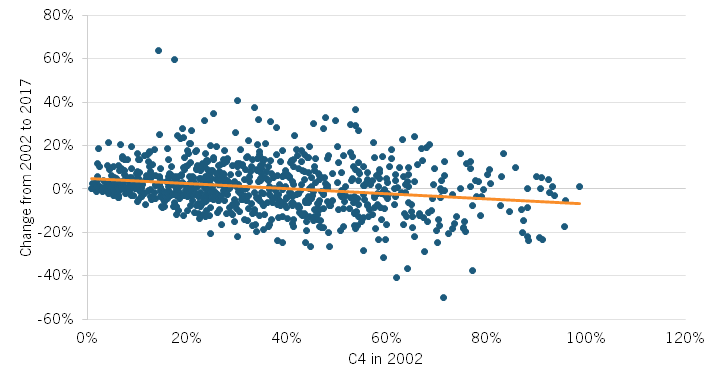
NAICS’s 6-digit codes are the most finely grained U.S. government industry classifications. The Census Bureau divides the economy into 1,057 industries in this classification. Using 6-digit NAICS codes and Census data, the Information Technology and Innovation Foundation (ITIF) found that the average C4 ratio (the share of sales captured by the top four firms in an industry) increased by just 1 percentage point from 2002 to 2017, from 34.3 percent to 35.3 percent.[12] Only 4 percent of U.S. industries were highly concentrated in 2017, with the share of industries with low concentration growing by around 25 percent from 2002 to 2017. In addition, as shown in figure 1, the more concentrated an industry was in 2002, the higher the likelihood it became less concentrated by 2017. The fact that the concentration has not been growing overall is a major blow to the foundational tenet of Philippon’s theory.
Only 4 percent of U.S. industries were highly concentrated in 2017, with the share of industries with low concentration growing by around 25 percent from 2002 to 2017.
Figure 1: Relationship between C4 ratio in 2002 and percentage-point change by 2017[13]
Recent studies also confirm that concentration is not rising at the local level, which is the most relevant for many industries, including restaurants and retail shopping. Kevin Rinz of the U.S. Census Bureau used the federal government’s Longitudinal Business Database and W-2 Forms to measure labor market concentration within 4-digit NAICS industries in separate commuting zones. From 1976 to 2005, local industrial concentration steadily declined by approximately 25 percent. [14] These lower concentration levels were tied to higher incomes and decreased inequality. After 2005, the local concentration, as assessed by the Herfindahl-Hirschman Index, grew marginally but remained far lower than its 1976 level.
In sum, the most recent statistics indicate that concentration has not increased nationally or locally. Although Philippon attributed numerous problems in the U.S. economy to a general increase in market power, these explanations are invalid if market concentration hasn’t actually risen.[15]
Regarding the EU, granular concentration data is not accessible. With what evidence we do have, it seems that concentration has been slightly increasing in narrowly defined product markets. Researchers from the Center for Economic and Policy Research conducted a comprehensive study of concentration levels in 20,000 EU markets. They found that “concentration has increased over time on average [in the EU].”[16] The report finds that “average concentration is particularly high in narrowly-defined national markets” and that concentration has more steeply increased in EU-wide markets.[17] In other words, when researchers use proper market definitions, they show that Europe is not seeing a significant decline in market concentration over time, as Philippon claims. While European antitrust deters many efficient combinations, it is not actually driving down average market concentration, as Philippon claimed.
Profits Are Not Up
Philippon then argued that profits are increasing due to the supposed rise in concentration, which he initially misidentified. He looked at broad national data and found, “Over the past two decades … profits have outpaced economic growth, and the after-tax profit share has increased to around 10 percent [of GDP].”[18]
Using data from the National Income and Product Accounts, he presented statistics showing that between 1997 and 1999 and 2013–2015, the operating profit rate (income minus depreciation as a percentage of the amount of capital at the beginning of the year) in the United States increased by 3 percentage points to 16 percent.[19]
However, this method has room for improvement. For example, after-tax profits do not control for changes in tax policy, such as the recent reduction in U.S. corporate tax rates in response to foreign government tax cuts. Philippon also included both foreign and domestic profits in his calculation, even though an increase in the foreign profits of U.S. firms is irrelevant to the state of domestic competition. Rather, foreign profits indicate that U.S. firms are globally competitive and should be welcomed and not scorned.
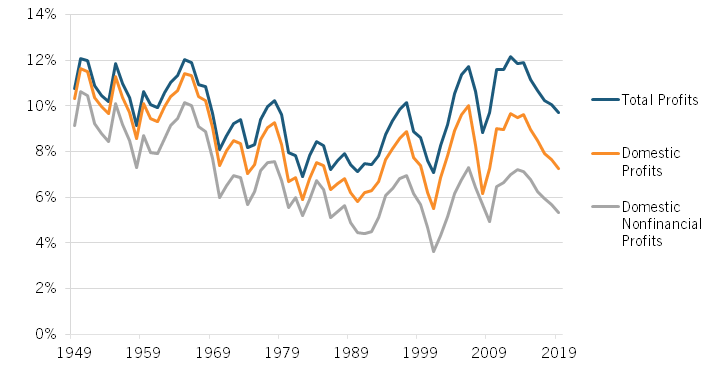
Conducting an analysis based on Bureau of Economic Analysis (BEA) data, ITIF found that domestic profits are now significantly lower as a share of GDP than in the 1950s and the 1960s, a period of very aggressive antitrust enforcement.[20] Although total profits appear to be trending slightly higher since the 1980s, domestic profits have increased less than total profits.
Excluding the financial sector also significantly mitigated this increase. The financial sector’s profit growth resulted mainly from increased value-added and new practices (interest differentials and noninterest income).[21] Since this rise in profits is mostly unrelated to concentration and much more related to the over-financialization of the U.S. economy, we exclude this sector. Figure 2 shows that from 1990 to 2019, domestic nonfinancial profits increased by only 0.8 percentage points, from 4.5 percent of GDP to 5.3 percent, which was hardly a national crisis.
Figure 2: Corporate profits as a percentage of GDP before tax and after inventory and capital consumption adjustments[22]
There are also reasons to believe we overestimated even this profit increase. Specifically, if a greater proportion of business capital takes the form of intangible assets, such as software, brands, intellectual property, and research, and if this capital is undervalued because of its intangible nature, then measured profits should be rising because costs including depreciation are underestimated, not because companies are abusing market power.
We also found no evidence that profits are significantly higher in the United States than in the EU. Figure 3 compares the U.S. and EU net profit margins using publicly available datasets from NYU professor Aswath Damodaran.[23] Profit margins followed similar trajectories in both regions. The profitability of EU firms has also slowly converged with that of U.S. firms over time. While U.S. net profit margins are slightly higher, the margins of both regions hover within 1 and 4 percentage points of each other. As of 2022, the overall net profit margin in the U.S. was 8.89 percent, whereas it was 8.41 percent in Western Europe. Such a small difference of less than 1 percentage point could result from various factors other than market power, including the share of high-value-added, innovative industries. If the United States truly had a significant monopoly problem, as Philippon alerted, we would expect significantly higher profit rates in the United States than in Western Europe.
Figure 3: Total net profits as a percentage of total revenues[24]
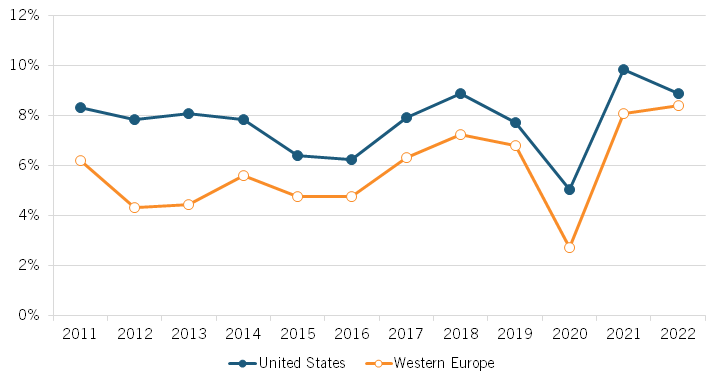
As of 2022, the overall net profit margin in the U.S. was 8.89 percent, whereas it was 8.41 percent in Western Europe.
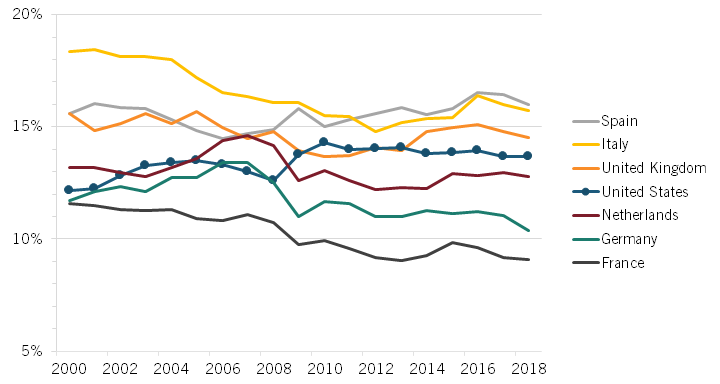
There is further evidence that the profitability of European and American companies is similar. The Organization for Economic Cooperation and Development (OECD) publishes data on profits and gross output.[25] Using this data, we calculated net operating surplus and mixed income
as a share of gross output for a sample of the largest Western European economies and the United States.
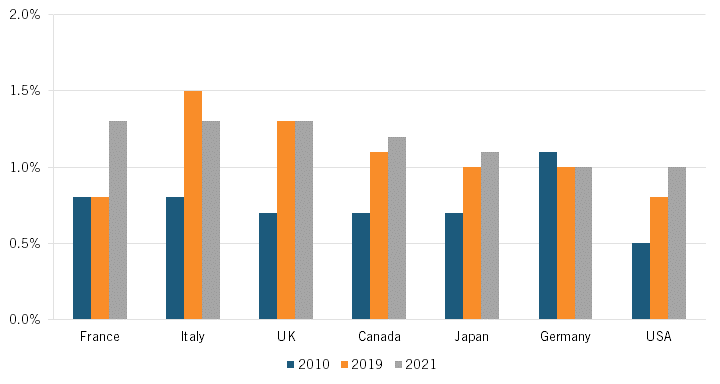
According to figure 4, values for all countries in the sample have fluctuated over time between about 9 and 19 percent. In 2018, the last year for which we have data on all countries, the United States had a value of 13.68 percent, placing it below the United Kingdom, Italy, and Spain and above the Netherlands, Belgium, Germany, and France. Once again, if the United States had a significant market power crisis compared with Europe, no European country should have higher profits as a share of output than the United States.
Figure 4: Net operating surplus and mixed income as a share of gross output, 2000–2018[26]
Firms in Concentrated Industries Don’t Underinvest
Philippon found that firms in more-concentrated industries invest less than they should based on Tobin’s Q, the ratio of a firm’s market value to the replacement cost of its physical assets.[27] In addition to once again using imprecise 3-digit NAICS codes as a concentration measure, Philippon looked exclusively at physical capital and largely dismissed investment in intangibles.
This approach is inconsistent with today’s economy. Many industries rely, sometimes almost exclusively, on intangible assets (patents, designs, software, and trade secrets) to generate revenue. Consequently, Philippon’s failure to account for these assets makes his measurements of firm investment meaningless.
In fact, evidence suggests that larger firms, including those with more market power, tend to invest more than their smaller competitors. A recent study concludes that the intensity of intangible investment is highest for the largest and fastest-growing firms in an industry, presumably because this investment is tied to firms’ productivity and competitiveness.[28] The study’s authors concluded that accounting for intangibles fills at least a part of the investment gap Philippon observed.
Case studies of the hospital industry prove that investment and market concentration are in
fact positively related. Hospitals in concentrated markets increased investment by 6.4 percent ($2.7 million) more in response to tax incentives than those in less concentrated markets.[29]
We show the relationship between business revenue and research and development (R&D) expenditure in figure 5. The correlation between firm revenue and R&D intensity of 318 American companies among the top 1,000 global R&D spenders in 2018 was -0.059. This means large businesses invested as much as smaller ones, relative to their size. Data on a sample of Internet companies (routinely condemned as monopolies) shows that firms invested more as their revenue grew.[30] For this sample, the correlation between firm revenue and R&D intensity was 0.31.
Figure 5: Relationship between Internet firm revenue and R&D intensity, 2015–2021[31]
More-Concentrated Industries Are More Productive
Philippon found a negative relationship between concentration and changes in productivity, noting that “between 2000 and 2015, we find a negative (but somewhat noisy) relationship between changes in concentration and changes in productivity.”[32] Thus, he can rebut any argument that concentration is needed because it boosts productivity through factors such as economies of scale.
The key problem is he used the essentially meaningless market categories from the EU KLEMS (K-capital, L-labor, E-energy, M-materials, and S-purchased services) database. This database divides an economy into just 34 categories, making it even less specific than 3-digit NAICS codes. If concentration rises in one of these too-general industries, it might just mean one sub-industry is becoming more important. In other words, these classifications produce meaningless changes in concentration and unreliable conclusions regarding the broader economy.
ITIF used Census data at the 6-digit NAICS code level to study the true relationship between concentration and productivity.[33] These 6-digit NAICS codes divide the economy into 1,012 categories, 29 times as many as the EU KLEMS.[34] We obtained the C4 market shares by industry from the 2002 and 2017 economic censuses. Among these 1,012 industries, 59 have labor productivity data available through the St. Louis Fed.[35]
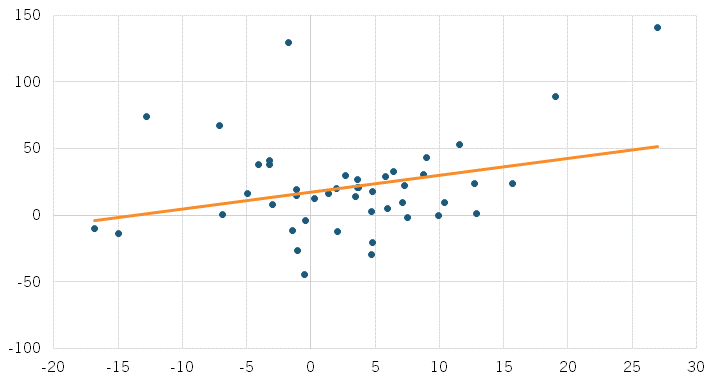
Figure 6 plots concentration and labor productivity in these industries. The changes from 2002–2017 in CR4 concentration and labor productivity had a correlation of 0.28. In other words, sectors that grew more concentrated also became more productive. This is consistent with the concept of economies of scale; as firms scale up, they become more productive.
Figure 6: Percentage point change in CR4 concentration (horizontal) and change in labor productivity (dollars per hour worked, vertical) 2002–2017[36]
Other researchers have found similar trends. A recent study on publicly traded firms finds that Total Factor Productivity (how much output can be produced from a certain number of inputs) has been positively linked to market concentration since the 2000s.[37] Researchers have also found that market leaders grow their patent stocks significantly more than their competitors, leading to higher productivity gains.
From 2002 to 2017, sectors that grew more concentrated also became more productive.
Examples show that business size and productivity go hand in hand. Firms such as Nvidia, Orchard, and Walmart all gained market share throughout the 2000s because they provided new products and efficient supply chains. Punishing these companies with breakups would deprive consumers of their products, depress productivity growth, and send the wrong signal to future innovators.
Concentration Is Not Eroding Labor’s Share of Income
As we have shown, Philippon blamed nearly every problem facing the U.S. economy on market concentration. One particularly dubious claim is that concentration has led to a decrease in workers’ share of income. Philippon remarked, “Over the past fifteen years, labor has lost 5 percentage points in its share of value added in the US.”[38] Blaming this decline broadly on “market power in the market for goods and services (monopoly) or in the market for labor (monopsony),” he estimated that “the lack of competition has deprived American workers of $1.5 trillion of income.”[39]
Philippon is hardly alone in contending that inadequate antitrust enforcement has reduced worker pay. Many leading economists and policymakers share Philippon’s viewpoint; even the Biden administration has blamed stagnant wage growth on lax antitrust.[40] This is a powerful argument because it proposes a simple solution (antitrust) to the complex and crucial issue of slow wage growth.
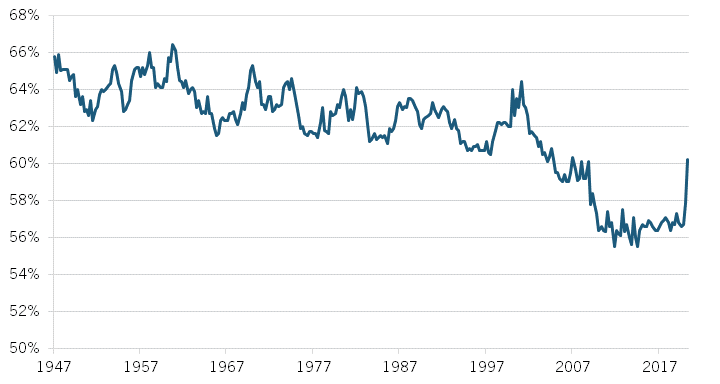
In The Great Reversal, Philippon pointed out that labor’s share within the U.S. nonfarm business sector fell by more than 8 percentage points, from just over 66 percent in 2001 to under 58 percent by 2012—although it has remained steady since 2010, rising back to almost 60 percent by 2020 (see figure 7).[41] He attributed this decline to monopolization, but we found that market power has had only a small impact on the fall of labor’s income share.
Figure 7: Wage share of output in the non-farm business sector (1947–2020)[42]
The first problem with this diagnosis is, as ITIF has shown, concentration has remained stable nationally. Recent studies also find that local labor market concentration dropped sharply between 1976 and 2014, raising the wages of many American workers.[43] Although some markets are concentrated, the problem has generally been improving. And not all increases in labor market concentration depress wages; if concentration increases in an unconcentrated market, wages often remain stable.[44]
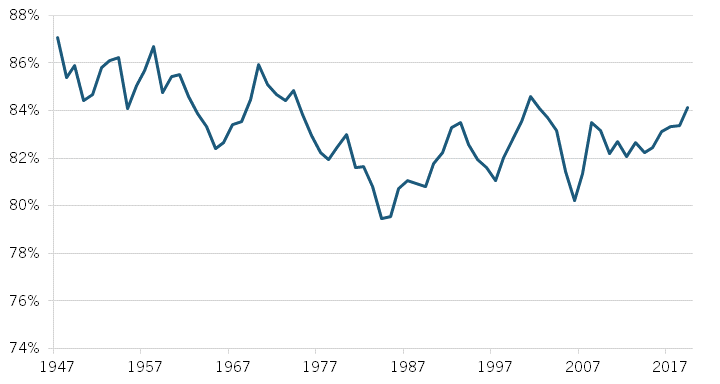
There are also reasons to believe that the decline in labor’s share of income might not be as pronounced as it seems. Specifically, BEA divides national income into several categories, including employee compensation, proprietors’ income, rental income, and corporate profit. Rental income includes homeowners’ imputed values from living in their homes. Proprietorship consists of the wages of small business owners. Neither of these represents corporate profits. When we include rental income and proprietorship in our calculation of labor’s share of income, the decline is significantly offset. As figure 8 shows, we found that labor’s share of income fell by just 1.5 percentage points from 1998 (when labor share began its steep fall in the Bureau of Labor Statistics calculations) to 2019.
Figure 8: Total employee compensation, rental income, and proprietors’ income as a share of net domestic income (1947–2019)[45]
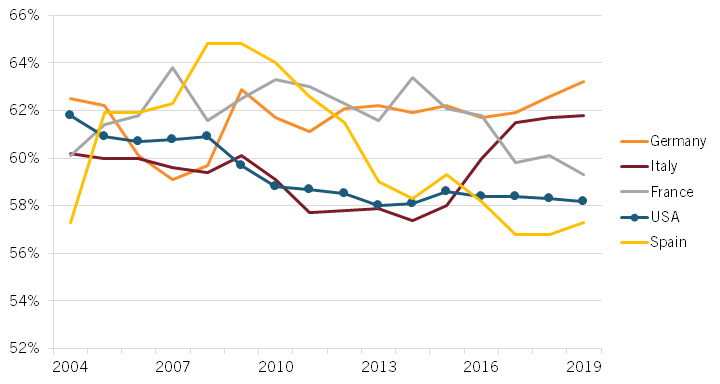
Despite the claims made by Philippon about the negative impact of lax antitrust on wage growth in the United States, figure 9 reveals that Europe’s performance in terms of labor’s share of GDP has not been all that different from that of the United States. The values for all countries in the sample have fluctuated over time, but the United States has not experienced a significant decline compared with the four largest EU countries. In fact, the values for all countries in the sample remained between 10 percentage points of each other for the entire sample period. If lax antitrust harmed U.S. wage growth, as Philippon said it does, we would expect to see a large and growing gap between the United States and the EU. Instead, we found a similar labor share of GDP in both regions. This further proves that lax antitrust is not eroding wages in the United States relative to Europe.
Figure 9: Labor’s share of GDP 2004–2019[46]
Faulty Analysis of Airlines and Broadband
Philippon used the airline and broadband industries as examples of lower competition in the United States leading to higher prices than in Europe. By comparing prices in the United States and Europe apples to apples, he dismissed the differences in costs, products, and subsidies.
Airlines
Philippon’s portrayal of the American airline industry as a monopolized sector is misleading, stating that “the case of US airlines is a rather straightforward example of weak antitrust with negative consequences for consumers.”[47] He framed the European airline industry as a competitive alternative: “[I]n Europe, where safety regulations are just as tight … we do not see higher concentration or higher prices.”[48]
But competition has not truly declined in the U.S. airline industry. While concentration increased at the national level following the mergers of Delta-Northwest (2008), United-Continental (2010), Southwest-AirTran (2011), and American-US Airways (2014), the average number of airlines operating each route remained stable. A Government Accountability Office (GAO) report finds that, from 2007 through 2012, the average number of effective competitors (defined as airlines with more than a 5 percent market share) ranged from 4.3 to 4.5 in the markets with the most passengers. [49] In other words, competition at the route level did not decline after the merger wave. Instead, mergers created larger networks and new connections in certain markets, benefiting consumers. In fact, data on the American-U.S. Airways merger shows that the combination led to lower prices (due to economies of scale) and fewer cancellations.[50]
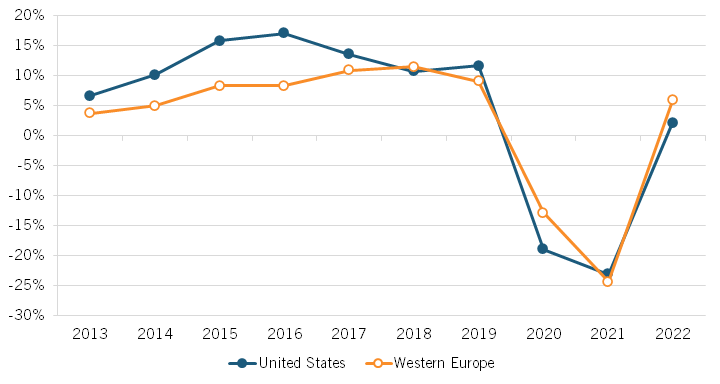
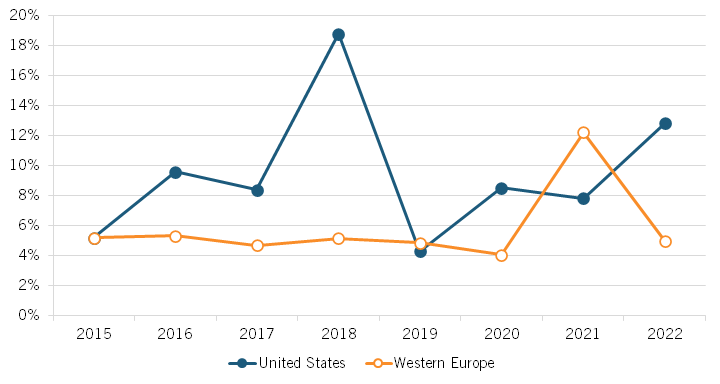
U.S. and European airlines have also been earning similar profit rates, despite what The Great Reversal says. Philippon looked at profit rates between 1995 and 2015 and noted that American carriers were earning a higher net profit rate than European ones since 2008, the start of the American merger wave.[51] ITIF extended his analysis to more recent years usingpublicly available datasets by NYU professor Aswath Damodaran.[52] While Philippon’s pre-2015 findings hold, figures 10 and 11 show that profit rates have since converged. This holds true for net profits and pretax profits (to control for corporate profit taxation). In 2022, European carriers had an even higher net margin (1.98 percent) than did American carriers (-1.71 percent). It appears that the pre-2015 divergence in profitability was transitory.
Figure 10: Air transportation industry: net margins United States vs. Western Europe, 2013–2022[53]
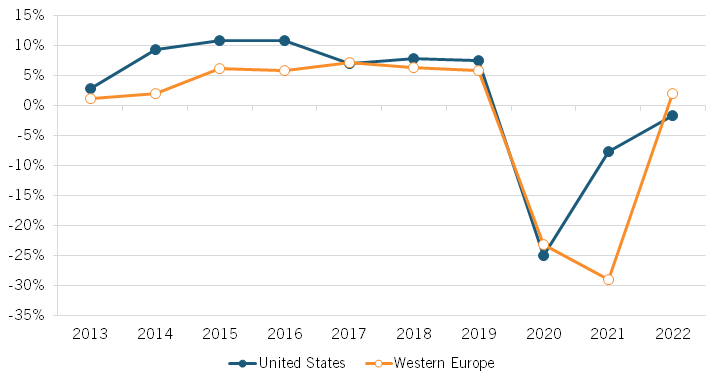
Figure 11: Air transportation industry: pretax operating margins United States vs. Western Europe, 2013–2022[54]
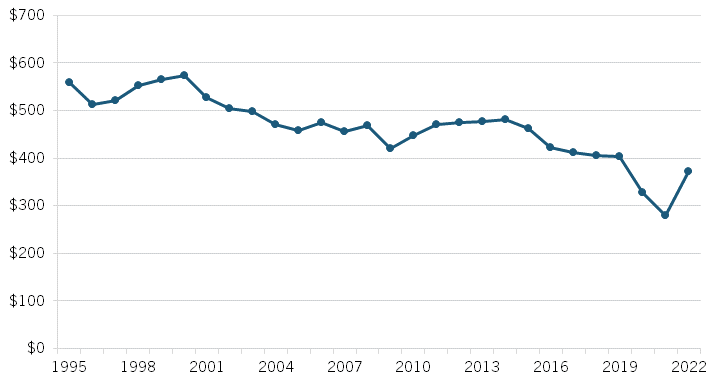
All other metrics suggest that the U.S. airline industry remains competitive. In 2019, the year before the COVID-19 pandemic, airline profits amounted to 7.5 percent compared with about 11 percent for the S&P 500.[55] Figure 12 shows that inflation-adjusted airfares also trended downward even before pandemic disruptions.[56] By 2021, the inflation-adjusted average airfare was half its 1995 price. Below-average profits and falling prices are the opposite of what we expect from monopolized industries.
Figure 13: Average inflation-adjusted U.S. airfare 1995–2022 (in 2022 dollars)[57]
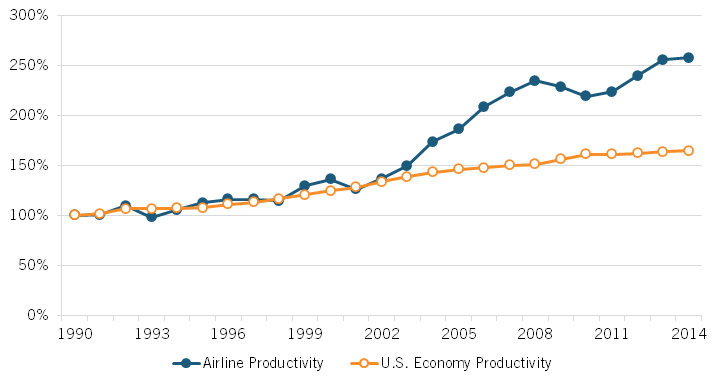
Airlines have also spent massively on capital expenditures to modernize their operations.[58] Consequently, productivity growth in the airline industry significantly outpaced the rest of the economy from 1990 to 2014. Figure 13 shows the increase in airlines’ productivity.
Figure 14: Airline productivity vs. business productivity 1990–2014 (indexed; 1990 = 100 percent)[59]
In contrast, European airlines have had lower capital expenditures than have their North American counterparts. In Q4 2020, they invested only 4 percent of their revenue compared with 16.1 percent for North American airlines.[60] The European airline industry has also seen recent failures (e.g., Air Berlin, FlyBMI, Primera Air, Wow Air, and Thomas Cook) as smaller carriers fail to compete with larger ones.[61] Airline industry experts Bjoern Maul and Bruce Spear have highlighted the importance of European airline consolidation.
More than anything, the necessity for European consolidation lies in the current limited ability of even the biggest airlines to participate in the significant opportunities artificial intelligence and predictive analytics afford to improve the customer experience, reduce maintenance costs, and boost operational reliability and safety. Adoption of these digital advances would allow airlines to offer the kind of hyperpersonal, customized environments that consumers are experiencing in retail, entertainment, and communications. But these solutions require substantial investment—something that’s difficult for most European carriers, given their current finances.[62]
Philippon misrepresented the U.S. airline industry as monopolized and stagnant, when all signs suggest otherwise. While the consolidation of air carriers has increased at the national level, route concentration is stable, profits are below average, prices are falling, productivity greatly outpaces the rest of the U.S. economy, and airlines are investing massively.
Broadband
Philippon’s exposé of the U.S. broadband industry is similarly reductive and deceptive. “In most advanced economies,” Philippon stated, “consumers pay around $35 per month for broadband internet connections. In the US, they pay almost double.”[63] He noted that household broadband adoption is lower in the United States than in most other OECD countries. He slammed the U.S. broadband industry as “a laggard, overcharging households for a rather basic service.”[64]
But comparing prices between countries without accounting for the cost of living does not reflect affordability. When controlling for living costs, we found that the United States performs similarly to other high-income countries. According to data from International Telecommunication Union (ITU), U.S. fixed broadband prices constituted 1 percent of gross national income per capita in 2021. Figure 14 shows that they ranked 10th among high-income OECD countries in the most recent iteration of ITU data as of 2021. This suggests that broadband is affordable in the United States.
Figure 15: G7 fixed broadband basket prices as a share of per capita income, ITU[65]
 The other problem with international price comparisons is they overlook cost differences. And in the case of broadband, costs are so entirely different between Europe and the United States that price comparisons are meaningless. A recent ITIF report details broadband cost differences between U.S. and EU firms.[66] Table 1 summarizes the findings.
Table 1: U.S. versus EU broadband provider cost comparisons (billions)[67]
|
Type of Cost |
U.S. Costs |
Equivalent Costs Under Europe’s Structure |
Nominal U.S. Differentials |
U.S. Differentials Percentage |
|
Labor |
$36.3 |
$31.5 |
$4.8 |
15% |
|
Capex |
$80.0 |
$64.0 |
$16.0 |
25% |
|
Spectrum |
$105.2 |
$54.5 |
$50.7 |
93% |
|
Advertising |
$15.6 |
$7.6 |
$8.0 |
105% |
|
Taxation |
$20.2 |
$11.9 |
$8.3 |
70% |
|
(Subsidies) |
($2.5) |
($3.0) |
$0.5 |
(17%) |
|
Total |
$254.8 |
$166.5 |
$88.3 |
53% |
U.S. broadband providers bear 53 percent higher costs than do Europeans for labor, capital investments in network infrastructure, spectrum licenses, advertising, and taxes (minus subsidies). Telecom worker wages are higher in the U.S. than in Europe, while U.S. capital expenditures exceed EU investments per household. Moreover, the EU taxes telecom firms at a lower rate and provides higher subsidies than does the United States. In every category, U.S. providers face proportionately higher costs. Thus, it should be no surprise that U.S. prices are higher than European ones.
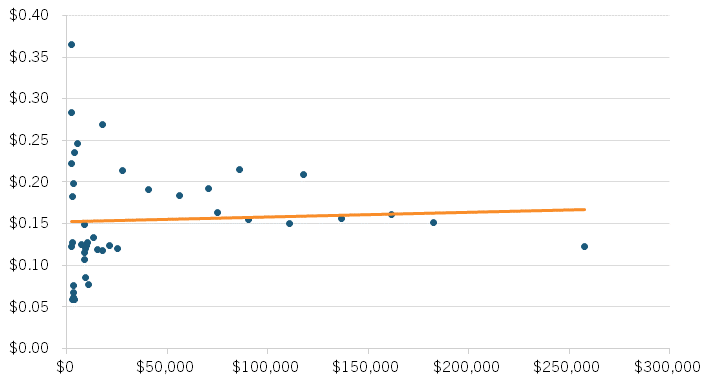
If U.S. broadband providers charged excessive markups, their profit margins should be significantly higher than the EU margins. Figure 15 shows that the net profit margins of European and American wireless telecom have been similar since 2013. By 2022, the net margin for European wireless providers (7.14 percent) was even higher than that of American wireless providers (2.54 percent). As for fixed broadband services, figure 16 shows that the net margins have fluctuated since 2012. In some years, European firms had a higher net margin; in other years, American firms did. This suggests that American providers do not have more market power than do their European equivalents.
Figure 16: Net margins of wireless telecom in the United States and Western Europe, 2015–2022[68]
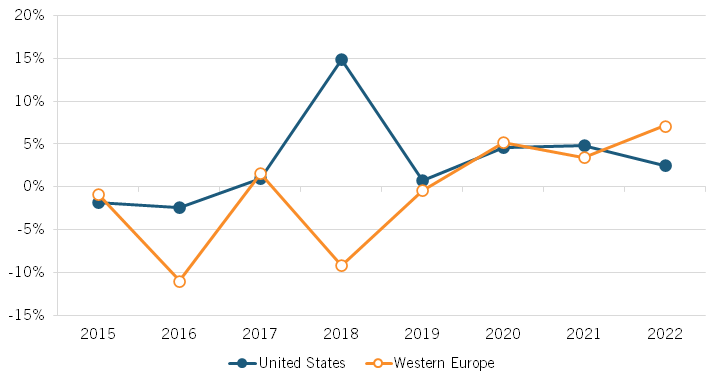
Figure 17: Net margins of telecom services in the United States and Western Europe, 2015–2022[69]
Regarding broadband adoption, it’s true that Europe outperforms the United States in the share of households with broadband connectivity.[70] But the lack of broadband adoption does not result from a lack of access. As of June 2019, U.S. fixed deployment, excluding satellite and benchmarked at 30 Mbps download speeds or higher to match the EU’s definition of high-speed broadband, reached 94 percent of households.[71] For comparison, deployment statistics for the 26 EU countries examined in a 2019 Federal Communications Commission (FCC) report averaged out to 84 percent of households.[72]
The two regions’ broadband deployment differences result from differing capital expenditures. A recently released study finds that U.S. providers lead the EU in infrastructure investments by more than three times per household, which equates to about $700 per home every year.[73] The investment differential is likely largely due to less cherry-picking by U.S. providers, which have tried to connect a larger share of more remote and, therefore, more expensive populations.[74] Indeed, less-densely populated areas require more capital investment per subscriber than more densely populated ones do because the same amount of infrastructure brings in fewer revenues as the number of new customers within a location decreases.[75] So, as we have shown, investment and deployment are stronger in the United States than in Europe and cannot explain the lags in American broadband adoption.
According to a National Telecommunications and Information Administration (NTIA) survey, slow adoption in the United States mainly results from consumer preferences.[76] Of non-Internet-using households, a majority (57.5 percent) cited “no need/not interested” as the main reason they were not online in 2021. The existence of other options for Internet access outside the home, unavailable or too-slow service, and the cost of a computer are among the most common reasons for the lack of a subscription.[77]
In general, Philippon's assertion that U.S. broadband providers are price-gouging monopolists is not supported by the data. If policymakers want to increase broadband adoption, they can take efforts to make it cheaper; however, as we have demonstrated, there is no reason to suppose that profits are excessive or that deployment is bad in the United States in comparison with Europe. Both of these assertions are unfounded. In fact, empirical data supports the notion that the European market is already saturated. A surplus of small broadband providers may be hampering efficiency and investment in the industry.[78]
Competition in Europe and the United States
In addition to his case studies of airlines and broadband, Philippon contended that the United States has higher markups, identical productivity growth, and worse antitrust enforcement than does Europe. No piece of evidence can support any of these statements.
Markups
Philippon erroneously found “direct evidence that prices have increased more in the US than in the EU for the same goods and services.”[79] He blamed this difference in markups on America’s monopoly crisis.
The only problem is Philippon incorrectly defined “markup” as the price of a product minus its labor costs.[80] By doing so, he ignored all the other inputs (e.g., capital) firms use to produce goods and services. These nonlabor inputs must be included as costs. Since he excluded them, his measurement of markups is meaningless, and his conclusion that markups are rising in the United States relative to Europe is invalid.
A recent European Central Bank (ECB) study with proper cost metrics disproves that markups are higher in the United States. Unlike Philippon’s analysis, the study includes capital costs in its estimation of markups. ECB compared American and European markups in a sample of industries and concluded that “markups are on average not that different in the Euro area than in the US.”[81]
Further evidence shows that concentration is not the culprit behind price inflation. Data on the 2021 inflation surge confirms that concentration does not cause inflation. Two studies conducted by ITIF find no relationship between C4 concentration and price inflation in 2021 and 2022.[82]
According to these findings, the likelihood of price increases in concentrated businesses is equivalent to that of price increases in industries with less concentration. Taken together, our findings suggest that Philippon has an incorrect understanding of market concentration’s effects on prices in the United States.
Markups are, on average, not significantly different in the Euro area and in the U.S.
Productivity
Comparing GDP per capita statistics, Philippon stated that “the US and Europe are growing at approximately the same rate.”[83] This is misleading because per capita growth does not accurately measure innovation and productivity growth. Changes in the number of hours worked can quickly increase GDP per capita without changing productivity. Therefore, labor productivity is a better measure of growth.
Another problem is Philippon compared U.S. productivity growth to the EU, even though several EU countries are ex-Soviet bloc countries. Labor productivity has rapidly increased in these countries because they implemented existing technologies and lifted regulatory barriers to productivity. Therefore, we must compare the United States to Western European countries that have had access to similar technologies and free market economies since World War II.
Figure 17 shows that labor productivity growth has been significantly higher in the United States than in Europe since 1995. Between 1995 and 2007, the founding nations of the European Union, the EU-15, saw their productivity growth fall to just 1.4 percent while U.S. productivity growth rose to 2.6 percent. Today, U.S. workers are 15 percent more productive than EU-15 workers. This amounts to over $11 more output per hour worked.
Figure 18: EU-15 and U.S. labor productivity trends, 1995–2022 (GDP per hour worked, purchasing power parity)[84]
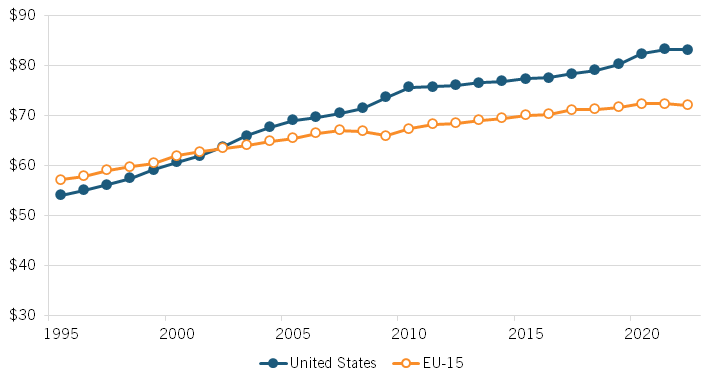
This effect is mainly attributable to Europe’s failure to invest in information and communications technologies (ICT), which drives labor productivity. [85] From 2013 to 2015, nearly 30 percent of U.S. productivity growth came from ICT capital, a much greater share than in European nations, which ranged from 7 to 23 percent. And the picture will likely worsen for Europe in the coming years, as ICT investment in the EU-15 lagged behind the U.S. rate in 2016 by 35 percent.
Because productivity and innovation go hand in hand, differences in innovation can also explain Europe’s lackluster productivity performance. Although it is challenging to quantify innovation, the United States tends to outperform Europe on available metrics. The World Intellectual Property’s 2022 Global Innovation Index evaluates innovation levels across 132 economies by focusing on human capital, institutions, technology, creative output, and business sophistication criteria.[86] Figure 18 shows that the United States came second globally and that no EU country ranked higher than the United States.
Figure 19: The world’s most innovative countries (100=most innovative)[87]
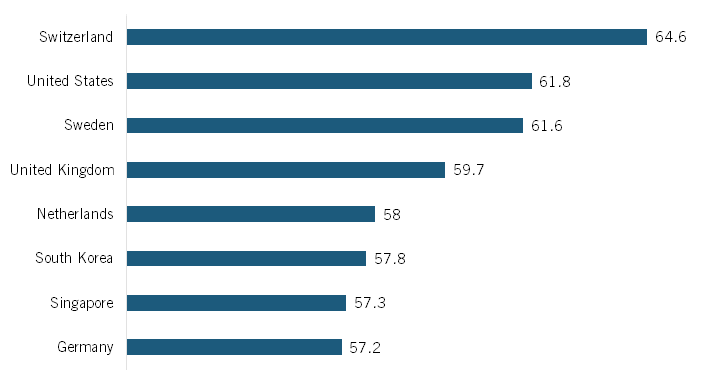
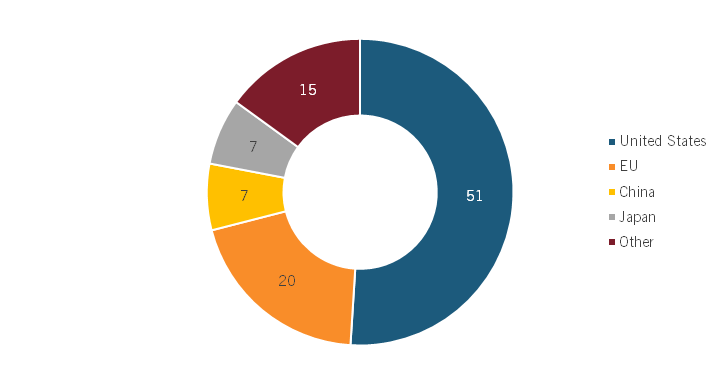
Figure 19 shows that even though the EU had a significantly larger population in 2018, the United States had a much higher share of the world’s top 100 innovative companies.[88] In other words, the United States should not look to Europe as a model for innovation.
Figure 20: The world’s top 100 innovative companies by country in 2018[89]
Antitrust Policy
Europe can partly blame its poor productivity growth on its stringent big-is-bad antitrust enforcement. Philippon stated that “weak antitrust” is to blame for poor economic performance in the United States. Yet, as we have shown, the United States is growing faster than and outperforming Europe in innovation.[90] The opposite is therefore true: Europe’s big-is-bad antitrust enforcement harms workers and industries.
Scale and Innovation
To innovate, firms incur high fixed costs through investments in new technologies and research. Small firms with low profit margins cannot make such investments. Although larger firms have a greater market share, the constant pressure to reinvest revenue and keep up with the pace of innovation prevents them from earning high profits.[91]
In highly innovative industries, greater firm size and concentration lower industry-wide costs.[92] A European study shows that larger high-tech firms could increase technological knowledge better than smaller ones.[93] In these cases, size does not lead to excessive profit margins.
The economist William Baumol summarized the evidence on firm size and innovation:
Oligopolistic competition among large, high-tech, business firms, with innovation as a prime competitive weapon, ensures continued innovative activities and, very plausibly, their growth. In this market form, in which a few giant firms dominate a particular market, innovation has replaced price as the name of the game in a number of important industries.[94]
When economies of scale or network effects are large, firms must be sufficiently large to be efficient. If there were 50 car manufacturers in every country, the market would be considerably less efficient than it is now. This is especially true with global competition because companies lose out to more-efficient foreign rivals.[95] Philippon failed to consider that, in innovative markets, firms need market power to recoup their large R&D investments.
The Harms of Big-Is-Bad European Antitrust
The Great Reversal concludes, “EU competition policy has become stronger than US competition policy, and EU citizens are better off for it.”[96] In reality, the EU is anything but a model for sound antitrust policy.
Margarethe Vestager, head of the EU’s competition agency, recently vetoed a merger of two leading European firms: rail companies Alstom and Siemens. The two companies agreed to merge their rail assets to create a combined firm that would have had a greater ability to compete against the world-leading Chinese state-owned rail company, Chinese Railway Construction Corporation (CRCC). But Vestager rejected the merger, declaring, “We can’t build those champions by undermining competition.”[97] In other words, Vestager says that the EU will prevent any firm from merging if the combination has the slightest risk of harming EU consumers, even if such a stance massively hurts EU workers in the long run. As local industries fail to compete with low-cost foreign substitutes, political pressure will mount on EU policymakers to turn to protectionism.
Because size is tied to higher productivity, rail is one of many European industries that need consolidation. Researchers have highlighted other European industries, such as banking, airlines, and technology, that would benefit from consolidation.[98] However, if European antitrust authorities continue to work on the principle that big is bad, these industries will struggle to compete with foreign rivals. The EU will continue to be less attractive to innovative companies, which will result in a wider productivity gap with the United States.
The adoption of antitrust policies similar to those in Europe would have devastating effects on the economy of the United States. According to U.S. firm data, the four largest firms in any industry have an average of 37 percent higher productivity and 17 percent higher wages for production workers.[99] If the United States had the same firm-size distribution as Europe (which has more small firms), then the average annual household income in the United States would be $5,200 lower. To summarize, adopting a firm-size structure in the United States that is comparable to that of Europe would be detrimental to the economy rather than favorable.
Conclusion
Antitrust populists have long argued that the United States should aspire to Europe’s small business structure. While advocates for a more European approach to antitrust assert that their proposals would improve economic conditions in the United States, economic evidence suggests otherwise.
American productivity has long been superior to that of Western European countries, and the gap between the two is widening rather than narrowing. And that productivity gap may be due to America’s tolerance for big corporations. As we have shown, increased market concentration is associated with increased levels of productivity, investment, and innovation.
This report debunks the assumption that U.S. antitrust enforcement has been lax or that revising antitrust legislation will in some way solve all the problems facing the U.S. economy. Markups are comparable in Europe and the United States, disproving the idea that the United States is experiencing a monopoly problem.
A strategy similar to that of the EU carries with it the possibility of stifling innovation and reducing productivity. If efficient networks and superior goods are penalized rather than rewarded, economic growth will slow. When enforcers politicize antitrust, as in the EU, it ceases to be a useful instrument for addressing actual economic harms to consumers.
Conducting a thorough economic assessment of the market in question is the one and only way to determine whether the degree of concentration in a market has reached a point where it is potentially harmful. Therefore, antitrust enforcers need to carefully analyze the merits of each case. A theory that arbitrarily discriminates against large enterprises, such as the one championed by the European Commission, is detrimental to the interests of consumers and to the advancement of innovation that drives economic development.
Acknowledgments
The authors would like to thank Rob Atkinson and Jessica Dine for their helpful contributions.
About the Authors
Hadi Houalla is a research assistant for antitrust policy at ITIF. He holds a B.A. in economics and statistics from the University of Virginia.
Dr. Aurelien Portuese (@aurelienportues) was co-director of The Schumpeter Project on Competition Policy at ITIF. He focuses on the interactions of competition and innovation. Portuese holds a Ph.D. in law and economics from the University of Paris II (Sorbonne), an M.Sc. in political economy from the London School of Economics, and an LL.M. from the University of Hamburg. Portuese’s latest book, Algorithmic Antitrust, was published in 2022 by Springer.
About ITIF
The Information Technology and Innovation Foundation (ITIF) is an independent 501(c)(3) nonprofit, nonpartisan research and educational institute that has been recognized repeatedly as the world’s leading think tank for science and technology policy. Its mission is to formulate, evaluate, and promote policy solutions that accelerate innovation and boost productivity to spur growth, opportunity, and progress. For more information, visit itif.org/about.
Endnotes
[1]. Thomas Philippon, The Great Reversal: How America Gave Up on Free Markets, (Belkamp Press, 2019), 291-292.
[2]. “America: Land of the (not so free) markets: A talk with Thomas Philippon,” University College of London, accessed March 28, 2023, https://www.ucl.ac.uk/bartlett/public-purpose/america-land-not-so-free-markets-talk-thomas-philippon; “Dean’s Speaker Series,” Berkeley Haas, accessed March 28, 2023, https://haas.berkeley.edu/about/speaker-series/deans-speaker-series/.
[3]. Arthur Herman, “‘The Great Reversal’ Review: When Bigger Is Not Better,” The Wall Street Journal, November 6, 2019, https://www.wsj.com/articles/the-great-reversal-review-when-bigger-is-not-better-11573084540.
[4]. President Joe Biden, “FACT SHEET: Executive Order on Promoting Competition in the American Economy,” The White House, July 9, 2021, https://www.whitehouse.gov/briefing-room/statements-releases/2021/07/09/fact-sheet-executive-order-on-promoting-competition-in-the-american-economy/.
[5]. Philippon, The Great Reversal, 105.
[6]. Ibid, 46.
[7]. Ibid, 48.
[8]. President Joe Biden, “Executive Order on Promoting Competition in the American Economy,” The White House, July 9, 2021, https://www.whitehouse.gov/briefing-room/presidential-actions/2021/07/09/executive-order-on-promoting-competition-in-the-american-economy/.
[9]. Lina Khan, “The Ideological Roots of America’s Market Power Problem,” The Yale Law Journal, June 4, 2018, accessed on May 24, 2021, https://www.yalelawjournal.org/forum/the-ideological-roots-of-americas-market-power-problem.
[10]. Executive Office of the President Office of Management and Budget, “North American Industry Classification System,” https://www.naics.com/wp-content/uploads/2022/07/2017_NAICS_Manual.pdf, 27.
[11]. “Commodity Description Lookup,” U.S. International Trade Commission, accessed March 28, 2023, https://dataweb.usitc.gov/classification/commodity-description/NAIC/3.
[12]. Robert Atkinson and Filipe Lage de Sousa, “No, Monopoly Has Not Grown” (ITIF, June 7, 2021), /publications/2021/06/07/no-monopoly-has-not-grown.
[13]. Ibid.
[14]. Kevin Rinz, “Labor Market Concentration, Earnings Inequality, and Earnings Mobility” (Center for Administrative Records Research and Applications, US. Census Bureau, Working Paper 2018, September 10, 2018), https://www.census.gov/library/working-papers/2018/adrm/carra-wp-2018-10.html.
[15]. Gábor Koltay and Szabolcs Lorincz, “Competition Policy Brief” (Brussels: European Commission, November 2021), https://competition-policy.ec.europa.eu/system/files/2021-12/Competition%20Policy%20Brief%202-2021_Industry%20concentration%20and%20competition%20policy.pdf; Pauline Affeldt et al., “Market Concentration in Europe: Evidence from Antitrust Markets” (DIW Berlin Discussion Paper, January 2021), https://papers.ssrn.com/sol3/papers.cfm?abstract_id=3775524.
[16]. Pauline Affeldt et al., “Market Concentration in Europe: Evidence from Antitrust Markets” (DIW Berlin Discussion Paper, January 2021), https://papers.ssrn.com/sol3/papers.cfm?abstract_id=3775524.
[17]. Ibid.
[18]. Philippon, The Great Reversal, 54.
[19]. Ibid, 106.
[20]. Bureau of Economic Analysis, National Income and Product Accounts, Table 616, Corporate Profits by Industry. Reported figures are adjusted with the GDP price deflator, https://apps.bea.gov/iTable/iTable.cfm?reqid=19&step=3&isuri=1&nipa_table_list=53&categories=survey.
[21]. Costas Lapavitsas and Ivan Mendieta-Muñoz, “Explaining the Historic Rise in Financial Profits in the US. Economy” (working paper), 2017, https://ideas.repec.org/p/soa/wpaper/205.html; https://bpi.com/five-important-facts-about-the-competitiveness-of-the-u-s-banking-industry/.
[22]. Bureau of Economic Analysis, National Income and Product Accounts, Table 616, Corporate Profits by Industry. Reported figures are adjusted with the GDP price deflator, https://apps.bea.gov/iTable/iTable.cfm?reqid=19&step=3&isuri=1&nipa_table_list=53&categories=survey.
[23]. Aswath Damodaran, “Effective tax rate by Industry,” http://people.stern.nyu.edu/adamodar/.
[24]. Ibid.
[25]. OECD, STAN Database (Net operating surplus and mixed income, Gross Output; accessed April 20, 2022), https://stats.oecd.org/Index.aspx?DataSetCode=STANI4_2020#.
[26]. Ibid.
[27]. Philippon, The Great Reversal, 71.
[28]. Nicolas Crouzet and Janice Ceberly, “Understanding Weak Capital Investment: The Role of Market Concentration and Intangibles” (National Bureau of Economic Reports Working Paper 25869), May 2019, https://www.nber.org/papers/w25869.
[29]. Elena Patel and Nathan Seegert, “Does Market Power Encourage or Discourage Investment? Evidence from the Hospital Market,” http://nathanseegert.com/papers/PatelSeegert_CompetitionInvestment.pdf.
[30]. “Research and development expenditure of leading internet companies from 2014 to 2021”, STATISTA, https://www.statista.com/statistics/270854/research-and-development-expenditure-of-leading-internet-companies/.
[31]. Ibid.
[32]. Philippon, The Great Reversal, 76.
[33]. Julie Carlson, “That NAICS Code Does Not Mean What You Think It Means” (ITIF, September 2022) https://itif.org/publications/2022/09/25/that-naics-code-does-not-mean-what-you-think-it-means/.
[34]. “Get to know your NAICS code,” Fedbizaccess, accessed March 28, 2023, https://fedbizaccess.com/know-your-naics-code/#:~:text=In%20total%2C%20there%20are%201%2C012,a%20the%20six%2Ddigit%20number.
[35]. Federal Reserve Bank of St. Louis, Productivity & Costs (Labor Productivity Data by Industry; accessed March 28, 2023), https://fred.stlouisfed.org/categories/2.
[36]. Ibid.
[37]. Jane Olmstead-Rumsey, “Market Concentration and the Productivity Slowdown” (working paper, December 2020) https://cpb-us-e1.wpmucdn.com/sites.northwestern.edu/dist/c/5134/files/2020/12/jmp_draft.pdf.
[38]. Philippon, The Great Reversal, 108.
[39]. Ibid, 293.
[40]. President Joe Biden, “FACT SHEET: Executive Order on Promoting Competition in the American Economy,” The White House, July 9, 2021, https://www.whitehouse.gov/briefing-room/statements-releases/2021/07/09/fact-sheet-executive-order-on-promoting-competition-in-the-american-economy/.
[41]. Philippon, The Great Reversal, 109.
[42]. US. Bureau of Labor Statistics, https://www.bls.gov/lpc/special_requests/msp_dataset.zip.
[43]. David Berger, Kyle Herkenhoff, and Simon Mongey, “Labor Market Power,” IZA Institute of Labor Economics, Discussion Paper Series No12276, April 2019, http://ftp.iza.org/dp12276.pdf; Anna Stansbury and Lawrence Summers, “The Declining Worker Power Hypothesis: An Explanation for the Recent Evolution of the American Economy” (National Bureau of Economic Research Working Paper No27193, May 2020), https://www.nber.org/papers/w27193; Kevin Rinz, “Labor Market Concentration, Earnings Inequality, and Earnings Mobility,” Center for Administrative Records Research and Applications, US. Census Bureau Working Paper 2018-10, September 2018, https://www.richmondfed.org/publications/research/working_papers/2018/wp_18-15r.
[44]. Elena Prager and Matt Schmitt, “Employer Consolidation and Wages: Evidence from Hospitals,” American Economic Review 111, no2 (2021): 410, https://doi.org/10.1257/aer.20190690.
[45]. U.S. Bureau of Economic Analysis, National Income and Product Accounts, Table 1.10, https://apps.bea.gov/iTable/iTable.cfm?reqid=19&step=2#reqid=19&step=2&isuri=1&1921=survey. Net domestic income is equal to gross domestic income minus consumption of capital and taxes on production and imports. These calculations include all of proprietor’s income. However, Elsby et al. showed that almost all of this category should be attributed to labor income. Michael W.L. Elsby, Bart Hobijn, and Aysegul Sahin, “The Decline of the U.S. Labor Share.”
[46]. Our World in Data, “Labor share of gross domestic product, 2004 to 2019,” accessed March 28, 2023, https://ourworldindata.org/grapher/labor-share-of-gdp?tab=chart&time=earliest..2019&country=USA~FRA~ESP~DEU~ITA.
[47]. Philippon, The Great Reversal, 39.
[48]. Ibid.
[49]. Government Accountability Office (GAO), “The Average Number of Competitors in Markets Serving the Majority of Passengers Has Changed Little in Recent Years, but Stakeholders Voice Concerns about Competition” (Washington DC: GAO, 2014), https://www.gao.gov/products/gao-14-515.
[50]. Somnath Das, “Effect of Merger on Market Price and Product Quality: American and US Airways,” Rev Ind Organ 55, 339–374 (2019), https://doi.org/10.1007/s11151-019-09717-2.
[51]. Philippon, The Great Reversal, 138.
[52]. Aswath Damodaran, “Effective tax rate by Industry,” http://people.stern.nyu.edu/adamodar/.
[53]. Ibid.
[54]. Ibid.
[55]. Bureau of Transportation Statistics (BTS), “2019 Annual and 4th Quarter U.S. Airline Financial Data” (Washington DC: BTS, May 2020), https://www.bts.gov/newsroom/2019-annual-and-4th-quarter-us-airline-financial-data, “S&P500 Operating Margin,” GuruFocus, accessed March 28, 2023, https://www.gurufocus.com/economic_indicators/4226/sp-500-operating-margin.
[56]. Bureau of Transportation Statistics (BTS), “2019 Annual and 4th Quarter U.S. Airline Financial Data” (Washington DC: BTS; accessed March 28, 2023), https://www.bts.gov/content/annual-us-domestic-average-itinerary-fare-current-and-constant-dollars.
[57]. Ibid.
[58]. Robert Atkinson, “Airline Monopoly Fears Are Bunk” (ITIF, February, 2019), https://itif.org/publications/2019/02/14/airline-monopoly-fears-are-bunk/.
[59]. U.S. Bureau of Labor Statistics (BLS), “Economic productivity in the air transportation industry: multifactor and labor productivity trends, 1990–2014” (Washington DC: BLS; March, 2017), https://www.bls.gov/opub/mlr/2017/article/economic-productivity-in-the-air-transportation-industry.htm.
[60]. International Air Transportation Association (IATA), “Airlines Financial Monitor” (Montreal: IATA; June 2021), https://www.iata.org/en/iata-repository/publications/economic-reports/airlines-financial-monitor---june-2021/.
[61]. “Factbox: European airline collapses since 2017,” Reuters, January 14, 2020, https://www.reuters.com/article/us-europe-airlines-collapse-factbox/factbox-european-airline-collapses-since-2017-idUSKBN1ZD1I3.
[62]. Oliver Wyman, “For European Airlines, Consolidation Has Become Both Necessary And Inevitable,” Forbes, October 30, 2018, https://www.forbes.com/sites/oliverwyman/2018/10/30/for-european-airlines-consolidation-has-become-both-necessary-and-inevitable/?sh=2ba117942ce5.
[63]. Philippon, The Great Reversal, 5.
[64]. Ibid, 6.
[65]. “POLICY BRIEF - THE AFFORDABILITY OF ICT SERVICES 2021” (International Telecommunication Union, March 2022), 4, https://www.itu.int/en/ITU-D/Statistics/Pages/ICTprices/default.aspx.
[66]. Jessica Dine and Robert Atkinson, “Apples vs. Oranges: Why Providing Broadband in the United States Costs More Than in Europe” (ITIF, July 2022), https://itif.org/publications/2022/07/11/apples-vs-oranges-why-providing-broadband-in-the-united-states-costs-more-than-in-europe/.
[67]. Jessica Dine and Robert Atkinson, “Apples vs. Oranges: Why Providing Broadband in the United States Costs More Than in Europe” (ITIF, July 2022), https://itif.org/publications/2022/07/11/apples-vs-oranges-why-providing-broadband-in-the-united-states-costs-more-than-in-europe/.
[68]. Aswath Damodaran, “Effective tax rate by Industry,” http://people.stern.nyu.edu/adamodar/.
[69]. Ibid.
[70]. OECD, “Share of households with broadband connections” (Paris: OECD; accessed March 28, 2023), https://goingdigital.oecd.org/en/indicator/13.
[71]. 2020 Communications Marketplace Report, Appendix G: International Broadband Data Report Appendices (Washington DC: FCC, December 2020), GN Docket No. 20-60, 87, https://www.fcc.gov/document/fcc-releases-2020-communications-marketplace-report.
[72]. Jessica Dine and Joe Kane, “The State of US Broadband in 2022: Reassessing the Whole Picture” (ITIF, December 2022), https://itif.org/publications/2022/12/05/state-of-us-broadband-in-2022-reassessing-the-whole-picture/.
[73]. BTR Staff, “Study: U.S. leads Europe in broadband deployment, adoption,” Broadband Technology Report, April 2021, https://www.broadbandtechreport.com/in-the-home/article/14201886/study-us-leads-europe-in-broadband-deployment-adoption.
[74]. Jessica Dine and Robert Atkinson, “Apples vs. Oranges: Why Providing Broadband in the United States Costs More Than in Europe” (ITIF, July 2022), https://itif.org/publications/2022/07/11/apples-vs-oranges-why-providing-broadband-in-the-united-states-costs-more-than-in-europe/.
[75]. Michael Mandel and Elliott Long, “The State of U.S. and European Broadband Prices and Deployment” (Progressive Policy Institute, August 2021), https://www.progressivepolicy.org/wp-content/uploads/2021/08/PPI_The-State-of-U.S.-and-European-Broadnband-Prices-and-Deployment_V5.pdf.
[76]. National Telecommunications and Information Administration, NTIA Data Explorer: Internet Use Survey (Non-Use of the Internet at Home, updated October 2022), https://www.ntia.doc.gov/data/explorer.
[77]. Jessica Dine and Joe Kane, “The State of US Broadband in 2022: Reassessing the Whole Picture” (ITIF, December 2022), https://itif.org/publications/2022/12/05/state-of-us-broadband-in-2022-reassessing-the-whole-picture/.
[78]. Leila Abboud and Harro Ten Wolde, “Divide between U.S. and European Telecoms Widens,” Reuters, February 24, 2013, https://www.reuters.com/article/us-mobile-world-valuation/divide-between-european-and-u-s-telcos-widens-idUSBRE91N08L20130224.
[79]. Philippon, The Great Reversal, 121.
[80]. Ibid, 120.
[81]. Rebekka Christopoulou and Philip Vermeulen, “MARKUPS IN THE EURO AREA
AND THE US OVER THE PERIOD 1981-2004,” European Central Bank (WORKING PAPER SERIES NO 856, January 2008), 21, https://www.ecb.europa.eu/pub/pdf/scpwps/ecbwp856.pdf.
[82]. Julie Carlson and Hadi Houalla, “Everything Old Is New Again: The Misleading Narrative About Concentration and Inflation” (ITIF, June 2022), https://itif.org/publications/2022/06/17/the-misleading-narrative-about-concentration-and-inflation/; Robert Atkinson and Luke Dascoli, “No, Corporate Concentration Is Not Driving Inflation. Here’s the Data” (ITIF, January 2022), https://itif.org/publications/2022/01/14/no-corporate-concentration-not-driving-inflation-heres-data/.
[83]. Philippon, The Great Reversal, 100.
[84]. “Total Economy Database,” The Conference Board, accessed March 28, 2023, https://www.conference-board.org/data/economydatabase/total-economy-database-productivity.
[85]. “US versus European Productivity Growth and the ICT Boom” (NBER, September, 2020), https://www.nber.org/digest/sep20/us-versus-european-productivity-growth-and-ict-boom.
[86]. World Intellectual Property Organization (WIPO), “Global Innovation Index 2022” (WIPO, 2022), https://www.wipo.int/edocs/pubdocs/en/wipo-pub-2000-2022-en-main-report-global-innovation-index-2022-15th-edition.pdf.
[87]. World Intellectual Property Organization (WIPO), “Global Innovation Index 2022” (2022), https://www.wipo.int/edocs/pubdocs/en/wipo-pub-2000-2022-en-main-report-global-innovation-index-2022-15th-edition.pdf; Katherine Bucholz, “The World’s Most Innovative Countries,” STATISTA, October, 2022, https://www.statista.com/chart/18804/rankings-of-the-global-innovation-index/.
[88]. Forbes, “The World’s Most Innovative Companies,” accessed March 28, 2023, https://www.forbes.com/innovative-companies/list/.
[89]. Ibid.
[90]. Philippon, The Great Reversal, 205.
[91]. Joe Kennedy, “Monopoly Myths: Is Concentration Leading to Higher Markups?” (ITIF, June, 2020), https://itif.org/publications/2020/06/01/monopoly-myths-concentration-leading-higher-markups/.
[92]. Robert Atkinson and Michael Lind, Big is Beautiful: Debunking the Myth of Small Business (MIT 2018), 210.
[93]. Sandro Montresor and Antonio Vezzani, “The Production Function of Top R&D Investors: Accounting for Size and Sector Heterogeneity with Quantile Estimations,” Research Policy, vol44(2) (2015), https://econpapers.repec.org/article/eeerespol/v_3a44_3ay_3a2015_3ai_3a2_3ap_3a381-393.htm.
[94]. William Baumol, The Free Market Innovation Machine (Princeton, NJ, Princeton University Press, 2002), 196.
[95]. Atkinson and Lind, Big is Beautiful, 206–218.
[96]. Philippon, The Great Reversal, 289.
[97]. Aoife White, “Vestager Talks Tough on Deals After Siemens-Alstom Meeting,” Bloomberg Law, January 9, 2019, https://news.bloomberglaw.com/antitrust/vestager-talks-tough-on-deals-after-siemens-alstom-meeting-1-2.
[98]. Bruce Spear and Khalid Usman, “When Consolidation Makes Sense,” Oliver Wyman, accessed March 28, 2023, https://www.oliverwyman.com/our-expertise/insights/2018/sep/oliver-wyman-transport-and-logistics-2018/when-consolidation-makes-sense.html, Danièle Nouy, “Too much of a good thing? The need for consolidation in the European banking sector” (Speech at the VIII Financial Forum, Madrid, September 27, 2017), https://www.bankingsupervision.europa.eu/press/speeches/date/2017/html/ssm.sp170927.en.html.
[99]. Edward Miller, “The Extent of Economies of Scale: The Effects of Firm Size on Labor Productivity and Wage Rates,” Southern Economic Journal 44, no. 3 (January 1978): 470–487.
Editors’ Recommendations
June 7, 2021
No, Monopoly Has Not Grown
September 25, 2022
That NAICS Code Does Not Mean What You Think It Means
February 14, 2019
Airline Monopoly Fears Are Bunk
July 11, 2022
Apples vs. Oranges: Why Providing Broadband in the United States Costs More Than in Europe
December 5, 2022
