


No, Market Leaders Are Not Driving Declines in Innovation and Economic Dynamism
A report by the Economic Innovation Group (EIG) concludes that declining knowledge diffusion is the underlying cause of declining business dynamism. However, its theoretical model is based on flawed assumptions, while its mathematical model has methodological issues.
KEY TAKEAWAYS
Key Takeaways
EIG Report’s Theoretical Model And Its Issues 3
Claims About Declining Business Dynamism. 5
Claims About Widening Productivity Gap and Churn of Top Firms (Claims 7 and 12) 5
A Widening Productivity Gap Can Be Beneficial 5
Market Power Because of a Widening Productivity Gap Can Be Beneficial 6
Innovation Is Not Declining Because of a Widening Productivity Gap. 6
Incorrectly Explaining Business Dynamism Trends With Market Power From Widening Productivity Gap 7
Labor Share and Market Concentration (Claims 5 and 6) 10
Productivity Growth (Claim 1) 11
Young Firm Activity and Young Firms’ Share of Employment (Claim 8) 12
Decline in SMEs’ Share of Workers (Claim 11) 13
Dispersion of Firm Growth Rates (Claim 10) 14
Claims about the Inventor Landscape. 14
Methodological Issues Linking Knowledge Diffusion and Business Dynamism. 15
Concentration in Patents and Reassignments 16
The Role of Non-patenting Entities 17
Introduction
In the last decade or so, a growing chorus of advocates has championed the cause of small business, arguing that small firms are the wellspring of innovation and most other economic goods that benefit society. Yet, advocates assert small firms often find themselves oppressed, if not obliterated, by big corporations. It’s an appealing narrative, but one that is fundamentally flawed: The reality is a healthy national innovation system relies on firms of all sizes.[1]
Contributing to this narrative is a report by EIG, which asserts that, by “hoarding patents and innovative resources, established market leaders have been entrenching their position in markets, contributing to a decline in overall innovativeness and dynamism of the economy.”[2] The authors use data on patent concentration and patent litigation to contend that poor knowledge diffusion between leader and laggard firms is the starting point for a series of economic outcomes that show a decline in business dynamism.
However, the report has two major methodological problems:
1. Its theoretical model linking a series of 12 “facts” that supposedly show declining business dynamism assumes that market power and lower rates of innovation, specifically due to a widening productivity gap, are the root causes of detrimental economic trends.
2. Its mathematical model linking knowledge diffusion to declining business dynamism has methodological issues. For instance, the models only show correlation rather than causation.
Due to the flaws in both the theoretical and mathematical model, EIG’s results linking knowledge diffusion to declining business dynamism are, at best, questionable.
This report 1) explains the EIG report’s theoretical model and its flaws, 2) provides evidence of the flaws in the theoretical model, and 3) elaborates on the methodological issues with the report’s mathematical model.
EIG Report’s Theoretical Model And Its Issues
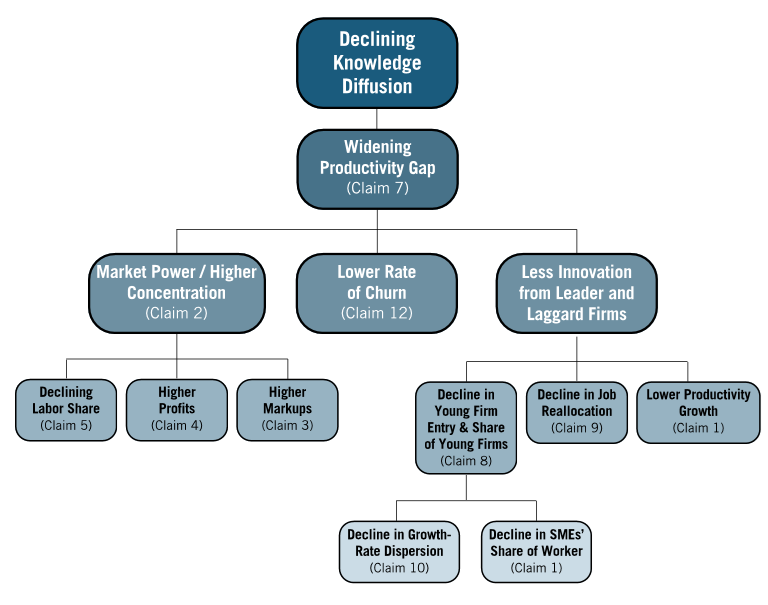
The EIG report’s model linking knowledge diffusion to a series of trends on business dynamism is as follows. First, it argues that poor knowledge diffusion is causing a widening productivity gap between leader and laggard firms. Next, it attributes three trends to the widening productivity gap: 1) a rise in market power, 2) a lower likelihood that a laggard firm will replace a top firm (lower rate of churn), and 3) a reduction in innovation to the widening productivity gap. Then, it attributes six other trends to these three previous trends: declining labor share of output, higher profits, higher markups, a decline in young firm entry and the share of young firms in the economy, a decline in job reallocation, and lower productivity growth. Finally, it attributes two more trends to the decline in young firm entry and the share of young firms in the economy: a decline in growth-rate dispersion and a decline in small and medium-sized enterprises’ (SMEs’) share of workers. (See figure 1.)
Figure 1: EIG report's model linking knowledge diffusion to trends in business dynamism
However, this model is problematic for many reasons. First, it asserts that market concentration has increased. As the Information Technology and Innovation Foundation (ITIF) has shown, using the most recent U.S. Census data, this is not the case. Second, market power is not related to labor share of income.[3] Third, it asserts that profits and markups have increased, which is incorrect.[4] Fourth, it claims that there is a relationship between firm entry and market power, which again has been shown to be incorrect. Fifth, it assumes that a widening productivity gap has led to less innovation, but in fact, one measure of innovation—corporate research and development (R&D)—has increased as a share of gross domestic product (GDP) over the period analyzed.[5]
In addition, it asserts that a widening productivity gap is by definition detrimental to the economy. But this gap can be beneficial to the economy if it’s due to the greater efficiency of leader firms rather than anticompetitive effects. As such, the three trends, due to market power, are unlikely to be detrimental to the economy. But more importantly, these trends likely have other explanations because the evidence linking them to market power is weak. Moreover, the widening productivity gap is also unlikely to lower the rate of innovation because leader and laggard firms have other incentives to innovate than the only two mentioned in the EIG report: laggard firms innovate to become leaders and leaders innovate to remain the dominant firm. As such, a lower innovation rate, specifically due to a widening productivity gap, is not the cause of the remaining five trends. Indeed, economic evidence either does not support this claim or suggests that these trends have other explanations.
More importantly, the larger implication of the flaws in the theoretical model is that the majority of these trends showing declining business dynamism cannot be linked back to poor knowledge diffusion. As such, the EIG report’s claim that poor knowledge diffusion due to IP protection, such as patents, is causing declining business dynamism and hurting the economy is inaccurate.
Claims About Declining Business Dynamism
Claims About Widening Productivity Gap and Churn of Top Firms (Claims 7 and 12)
The EIG report asserts that the productivity gap between leader and laggard firms has increased, enabling greater market power and less innovation. The implication of this assertion is that the widening productivity gap is detrimental to society and the economy. However, this widening productivity gap does not necessarily signal harm. This is because 1) leader firms are becoming more productive because of innovative products and processes, 2) leader firms’ market power can benefit the economy because it incentivizes innovation, and 3) leader and laggard firms are still innovating despite the productivity gap.
A Widening Productivity Gap Can Be Beneficial
Only an Algernon view of the world in which everyone is equal by dragging down the higher performers would not want leading firms to be productive. Rather than tying down the leaders through Gulliver-like restrictions or neo-Brandeisian breakups, the goal should be to either boost the productivity of the laggards or see them go out of business and have the market share taken by more productive firms. Yet, the EIG report advocates for the Algernon view of the world when it suggests that a widening productivity gap between laggard and leader firms is detrimental to society.
However, the widening productivity gap between leader and laggard firms may not be detrimental to the economy if the driver is superior performance of leader firms and not anticompetitive conduct. Is EIG really suggesting we’d be better off if the leading firms had lower productivity? Leader firms are outperforming the remaining firms in their industry because they tend to be more innovative. This is partly because leader firms are investing heavily in intangible capital, including software, R&D, and IP. Indeed, an Organization for Economic Cooperation and Development (OECD) study concluded that a combination of intangible assets enables firms to develop better business models, boosting leader firms’ productivity growth compared to laggard firms.[6] Further corroborating this finding, another OECD study also finds that a 10 percentage point increase in intangible investments is associated with a 1.5 percentage point increase in the productivity distribution between firms in the 90th and 10th percentiles.[7] In other words, leader firms are more productive than laggards because of investments in innovation. This could be partly why a Center for Economic and Policy Research study finds that labor productivity for global frontier firms in the manufacturing sector rose 2.8 percent compared with laggards’ 0.6 percent from 2001 to 2013.[8]
Moreover, leader firms’ higher productivity growth from innovation is also why laggard firms are less likely to replace them as the top firms—addressing EIG’s claim #12 that the lower rate of churn for top firms is detrimental to society. As such, this widening productivity gap should not be viewed as an economic ill but one that is bringing greater welfare to society in the form of more innovation and higher productivity.
Market Power Because of a Widening Productivity Gap Can Be Beneficial
As a result of their higher productivity from innovation, leader firms are bound to gain some market power when consumers choose their lower prices and better products over those of laggard firms. However, this market power should not be of concern because leader firms fairly obtained it. Indeed, this is why an ITIF report asserts that “the ‘superstar’ firms are winning, not because they have market power, but because they are more productive and more efficient, and have lower costs.”[9] Moreover, this temporary market power for leader firms will only encourage them to innovate more. As such, in a study by Crozet and Eberly, the authors found that an increase in concentration is correlated with a rise in intangibles, such as R&D.[10] Further corroborating this, the Obama administration’s Council of Economic Advisors argued that when firms are allowed to exercise legitimate acquired market power they are incentivized to conduct more R&D and introduce new products.[11] In other words, the widening productivity gap may result in greater market power for leader firms, but this legitimately acquired power will benefit the economy with greater innovation.
In fact, the surprising trend is not that the leaders have gained market share; rather, it’s that they have not gained more. As ITIF has shown using the most recent U.S. Census data, the most concentrated industries got less concentrated from 2002 to 2017. It’s the persistence of less-productive “zombie” firms that should be most concerning.[12]
Innovation Is Not Declining Because of a Widening Productivity Gap
Finally, the EIG report speculates that the widening productivity gap will disincentivize both leader and laggard firms from innovating. It claims that laggards will reduce innovation when they perceive the barrier to catching up to them as being too high. As a result, leaders will also reduce innovation because they perceive that their dominant position is stable. However, this theory has two problems. First, this speculation is based on the assumption that laggards will not try to catch up to leaders because of a perceived high barrier. But laggards do try to catch up to leaders despite the barriers. Indeed, Claeys and colleagues found in a recent study of 60,000 Spanish firms that “laggard firms do try to catch up [to leaders] by investing more in new technologies, in spite of starting at lower productivity levels,” meaning that laggard firms have the means and incentive to catch up to leaders.[13] Second, the EIG speculation is problematic because it assumes that laggards only innovate to catch up to and become leaders without considering that laggards may innovate in order to sell out to leaders. As such, a study by Cabral finds that “technology transfer leads to an increase in the innovation rate … the prospect of selling to a ‘giant’ increases the payoff from innovation by a fringe firm. And a further increase in the size of the ‘giant’ further increases the expected benefit for a fringe firm to innovate.”[14] In other words, laggards do not reduce their innovation when they perceive that catching up to them is too challenging because they have the means to close the gap and incentives other than catching up to innovate at a high level.
As a result, leader firms will also not reduce their innovation because their dominant position is not a stable one. Indeed, this is why an economic working paper by Marcos concludes that “for some industries, the New Economy has meant businesses face a pressure to innovate as a key for (survival and) success; this is clear in high technology industries but also in the Internet-based economy.”[15] Moreover, leader firms also have to continue innovating at high levels because consumers demand products with different qualities and prices. In other words, leader firms are incentivized to innovate in order to satisfy consumers and prevent the loss of market share to competing laggard firms.[16] Additionally, if the leader firms are in traded sectors, they will have an even stronger incentive to continue innovating at a high level. This is because they face global competition. A study by Smith notes that “growing literature suggests that the pressure of entering global markets where [firms] will be exposed to additional competitive forces induces firms to develop their technological capabilities.”[17] Moreover, Smith found that growing foreign R&D intensity in export markets increases the pressure on domestic firms to innovate in order to remain competitive.[18] In other words, leader firms will not reduce their innovation because they face competition from domestic laggard firms, pressure from consumers, and competition from foreign firms. As such, the widening productivity gap is not detrimental to the economy because both laggards and leaders have incentives, other than to be the top firm, to innovate at a high level.
Incorrectly Explaining Business Dynamism Trends With Market Power From Widening Productivity Gap
The EIG report contends that the widening productivity gap between leaders and laggards caused by poor knowledge diffusion has resulted in market power, as seen with growing concentration levels. As a result of this market power, leader firms will charge higher markups, keep a higher share of profit, and pay lower wages. However, the evidence of market power is weak because the evidence for rising concentration is weak. (It should be noted that even if evidence suggests that market power does exist, it is likely beneficial, as previously mentioned.) Similarly, the evidence that market power has resulted in higher markups and profits and a declining labor share of output is also weak. As such, the EIG report’s theory that market power, or concentration, has risen and is causing higher markups and profits while reducing labor’s share is questionable.
Concentration (Claim 2)
The EIG report claims that market concentration, a signal of market power, has risen. However, this claim is questionable because the conclusion hinges on flawed studies that did not analyze concentration data at the detailed 6-digit North American Industry Classification System (NAICS) industry level. In the first two studies the EIG report cited, the authors, Autor et al., concluded that multiple sectors showed concentration had risen after analyzing Census data at the 4-digit NAICS level.[19] In the third study cited, Grullon et al. analyzed concentration at the 3-digit NAICS level.[20] However, these studies do not accurately depict economic concentration levels because 3- and 4-digit NAICS subsector and sector industries include multiple industries that do not compete with each other.[21] For example, it would be challenging to argue that a couch in Furniture and Home Furnishing Retailers (NAICS: 4491) is a substitute for a blender in Electronic and Appliance Retailers (NAICS: 4492). This is why an ITIF report asserts that “to be meaningful, concentration must refer to a specific market … markets should be defined as specifically as possible.”[22] And this is why the U.S. Census reports concentration at the more detailed 6-digit level.
Indeed, when 6-digit NAICS industries are analyzed, concentration has not risen as significantly as some studies claim. According to an ITIF analysis, from 2002 to 2017, the average C4 ratio, or the market share of the four largest firms in an industry, only rose 1 percentage point from 34.3 percent to 35.3 percent.[23] Meanwhile, the C8 ratio increase was even lower, rising only 0.6 percentage points from 44.1 to 44.7 percent.[24] More importantly, the study finds that only 35 of 851 industries are considered “highly concentrated,” meaning only in rare cases does a rise in concentration equate to market power.[25] And the most concentrated industries in 2002 became less concentrated by 2017.[26] As such, contrary to the EIG report, market concentration, a signal of market power, has not risen significantly. Thus, it cannot reasonably be the cause for higher markups, higher profits, and a decline in labor share.
Markups (Claim 3)
The EIG report’s claim suggesting that the average markups have increased partly because of market power is also inaccurate. This is because of three reasons: 1) concentration only rose slightly from 2002 to 2017, 2) markups are challenging to measure, and 3) nonfinancial profit rates have not increased significantly. The report implies that higher markups are partly due to market power when it notes that the rise in markups has occurred “concurrently” with the rise in concentration.[27] However, as ITIF has found from Census data, concentration only rose about 1 percentage point from 2002 to 2017.[28] As such, if firms are indeed increasing their markups, market power, as measured by concentration, is not the reason for it. Indeed, further corroborating that market power is not the cause of higher markups, a study by De Loecker et al. finds that small firms with less market power tend to have higher markups across all sectors.[29]
Further discrediting the claim that market power is causing higher markups, recent studies have also suggested that markups have not risen significantly. Indeed, when firms increase their markups, their profits are expected to rise because their revenues are now higher compared with their costs. However, when examining domestic profits as a share of GDP from 1990 to 2019, an ITIF report finds that these profits only increased by 1.4 percentage points from 5.8 percent to 7.2 percent.[30] Moreover, when excluding the financial sector, an outlier in the data, the increase was only 0.8 percentage points, rising from 4.5 percent to 5.3 percent.[31] As such, since corporate profits have not increased significantly, it is challenging to argue that markups have also risen. Indeed, this is why Robert Atkinson and Michael Lind have argued that “if markups increased almost four times … surely the rate of corporate profits would have gone up more than a few percent.”[32]
Finally, most studies cannot conclude with certainty that market power is causing markups because most studies cannot accurately measure marginal costs—a key component to accurately measuring markups. This is because marginal costs contain intangible capital, such as R&D spending, that are often challenging to measure at the firm level.[33] Moreover, marginal costs vary depending on firm size, but many studies will typically assume they are increasing as a firm’s size increases, despite the fact that larger firms can benefit from scale efficiencies.[34] Indeed, this is why economist Chad Syverson has asserted that “markups are difficult to measure directly. They require information not just on price but on hard-to-observe marginal costs.”[35] As a result, studies concluding rising markups, such as the one by De Loecker et al. that the EIG report cited, are questionable. For instance, the De Loecker et al. study does not accurately calculate marginal costs and, as such, uses another less-accurate measure to conclude that markups nearly tripled from 1980 to 2016.[36] Thus, the challenges of measuring markups mean the conclusion that market power is causing higher markups is questionable. Indeed, this is why an ITIF study concludes that “in many industries, the rise in aggregate markups likely reflects an increase in competition rather than an increase in market power. Market share is shifting toward more productive, more innovative firms, as it always has, and this is a trend we should welcome.”[37]
Profits (Claim 4)
The claim implying that the profit share of GDP has increased partly because of market power is also inaccurate. This is because 1) changes in concentration and profitability are negatively correlated when outliers are removed, 2) corporate profits are challenging to measure, and 3) evidence suggests that domestic profit shares are not rising significantly.
The EIG report implies that a rise in profit shares is related to a rise in concentration, or market power, when it concludes that the two have occurred concurrently. However, an ITIF study finds that this implied positive relationship is not an accurate depiction of the association between concentration and profit shares. This is because the positive relationship between the two is likely dependent on outliers in the data. Indeed, ITIF’s analysis of industry concentration and profits for 39 industries (the only industries for which data on profits and concentration were available) finds that the correlation between change in concentration and profit shares reverses from a positive coefficient of 0.67 to a negative one of -0.19 when the airline industry, an outlier in the data, is removed.[38] In other words, the more concentrated an industry became, the more its profits declined. As such, the EIG report is incorrect in concluding that market power, as measured by concentration, is the reason for rising profit shares. Indeed, further discrediting its conclusion, the ITIF report also notes that the profit rate for firms with over $250 million in sales was 7.7 percent, while it was 8 percent for those with sales of less than $1 million, meaning small firms with less market power had higher profit rates.[39]
Moreover, the challenges in accurately measuring profits also bring into question the link between market power and profit shares. In its conclusion about profit shares declining, the EIG report cites a study by Gauti Eggertson et al. that concludes profit shares increased from about 3 percent to 17 percent from 1985 to 2015.[40] However, this study has a problem. It uses “pure profits” as its measure, but this measure requires an accurate estimate of capital. Yet, it doesn’t because capital costs are not reported in accounting tables. As a result, capital costs must be estimated—a challenging feat because capital costs vary between firms and intangible capital is difficult to account for. As such, the study’s conclusion about declining profit shares is, at best, an estimate. And without an accurate measure of profit shares, the link between market power and concentration would be challenging to conclude.
Further challenging the link between market power and profit shares, studies conclude that profit shares have not risen significantly and, in some cases, have even declined. For instance, while the EIG report notes that profit shares have increased significantly—rising 5 percent to 20 percent from 1980 to 2020—other studies show that the increases are generally small despite domestic profits trending upward since the 1980s.[41] Indeed, an ITIF report concludes that nonfinancial domestic profits only rose from 4.5 percent to 5.3 percent of GDP from 1990 to 2019, a 0.8 percentage point increase compared with the EIG report’s conclusion of 15 percent.[42] Even when expanding the analysis to domestic profits in all industries, the domestic profits as a share of GDP only rose 1.4 percentage points.[43] But more importantly, this increase in profit share peaked in 2014 and has since declined 4.2 percentage points, indicating that this trend of increases is self-correcting.[44] Moreover, when examining profit share of GDP from 1950 to 2019, the domestic nonfinancial profits declined from about 10 percent to 5 percent.[45] As such, a rise in market power cannot be reasonably linked to a rise in profit shares because profit shares have declined in recent years.
Labor Share and Market Concentration (Claims 5 and 6)
The claim that the labor share of output has declined partly because of rising market power is inaccurate. Although labor share of output has declined, the primary contributor to this decline is not market power but 1) an increase in rental income, 2) a mismeasurement of self-employment income, and 3) greater competitive pressure from imports.
The EIG report implies that the decline in the labor share of output is partly due to market power when it notes that the labor share of output declines concurrently with an increase in profit share, which it had previously implied is related to market concentration. However, as previously stated, the correlation between changes in profit share and change in concentration is negative when the airline industry is removed from the data.[46] As such, if the labor share declines and profit shares rise concurrently in an industry, it would mean that the industry is only becoming less concentrated. In other words, labor share is not the result of market power because the negative relationship between change in profits and change in concentration implies that declining labor share is occurring in industries that are becoming less concentrated—and thus, have less market power.
Yet, to bolster this claim, the EIG report also explicitly asserts that the rise in concentration is positively associated with a decline in labor share. However, regardless of whether the relationship between labor share and concentration—or market power—is positive or negative, none of these are causal relationships. Indeed, an ITIF report notes that models measuring the relationship between concentration and labor’s share often “only show correlation. The causal relationships may run both ways and involve many more variables.”[47] As such, the causal relationship between market power and labor share is challenging to conclude.
Further bringing into question the link between labor’s share and market power, studies show that other factors have significant influence over changes in the labor share of output. For instance, a factor that contributes to the decline in labor’s share of output is an increase in rental income. Bureau of Labor Statistics (BLS) data shows that labor’s share declined from about 63 percent to 57 percent from 1947 to 2020.[48] However, an ITIF report examining a breakdown of the national accounts finds that a large share of the decline in labor share was due to an increase in rental income rather than market power. Indeed, it finds that from 1998 to 2019, rental income accounted for the largest increase in gross domestic income, while profits—which some have used as a signal for market power—only grew 0.4 percentage points.[49] Further corroborating this, a Brookings study also finds that rental, interest, and depreciation increased the most—3.9 percentage points—from 1948 to 2013.[50] As such, the decline in labor share is more likely to be attributed to the rise in rental income (which includes the value of homes owned by Americans because of imputed rent) than market power.
The mismeasurement of self-employment income and the rise in competition in imports are also contributors to the decline in labor’s share. The Brookings study argues that BLS‘s conclusion that labor’s share declined 6.4 percentage points from 1948 to 2013 is overstated because BLS assumed that both payroll employees and the self-employed have equal hourly compensation.[51] As a result, if BLS used a different measure, the change in labor’s share would only have declined by 3.6 to 4.7 percentage points.[52] Moreover, the study also argues that a share of the decline in labor’s share is also attributed to industries facing competitive pressures from imports. It concludes that industries with the highest rise in import exposure also have the largest declines in payroll share.[53] Indeed, it states that “increases in the import exposure of U.S. businesses account for 3.3 percentage point of 3.9 percentage point decline in the U.S. payroll share over the past quarter century.”[54] In other words, the decline in labor share is more likely to be attributed to factors other than market power. This is why an ITIF report argues that “antitrust policy is not causing the drop in labor share, so changing it is not the solution … Stringent antitrust policy would do little to raise the labor share of income.”[55]
Incorrectly Explaining Business Dynamism Trends With Lower Innovation From a Widening Productivity Gap
The EIG report contends that the widening productivity gap between leaders and laggards caused by poor knowledge diffusion has resulted in lower rates of innovation by leader and laggard firms. As a result of this lower rate of innovation, the entry and share of young firms in the economy, job reallocation, and productivity growth have declined. Moreover, due to this lower rate of innovation causing young firm entry and the share of young firms to decline, the growth dispersion rate and the share of workers at SMEs have also declined.
However, a decline in innovation rate, specifically due to a widening productivity gap, is not the likely reason for these economic trends because leader and laggard firms have other incentives to keep their innovation rate high. Indeed, the evidence linking a reduced innovation rate by leader and laggard firms to these economic trends is weak. This is because few studies examine the impact of factors influencing firm-level behavior on these economic trends. Moreover, broader economic evidence also does not support these linkages.
Productivity Growth (Claim 1)
The EIG report’s claim that productivity has fallen—except for a temporary growth from the mid-1990s and mid-2000s—is an accurate depiction of the economy. However, its explanation that the cause of this decline is less innovation, specifically due to a widening productivity gap, from leader and laggard firms is wrong.
Indeed, as mentioned, laggards are still incentivized to innovate in order to either catch up or sell out to leaders while leaders are also incentivized to innovate to prevent the loss of market shares to innovating laggards or foreign competition. As a result, the low productivity growth might be due to any number of other reasons, but not less innovation caused by a widening productivity gap. For example, Brynjolfsson and colleagues argue that the low productivity growth is likely due to the most pervasive technologies, such as general purpose technologies, taking time to reach their full economic potential since they require complementary tangible and intangible investments.[56] Or as Robert Gordon has argued, declining productivity comes from less-powerful technologies.[57] And the fact that every OECD nation has seen productivity declines, even though their changes in concentration levels differ, suggests concentration is not the cause in the United States.[58] Moreover, it highlights that others have attributed low productivity growth to mismeasurement issues and technology not meeting their envisioned expectations.[59] In other words, studies generally conclude that low productivity growth is because of changes in the economy or measurement errors rather than factors influencing firm-level behavior. This is why few studies have concluded that a widening productivity gap is driving firm-level decisions on innovation and, in turn, affecting overall productivity growth. As such, the evidence linking lower innovation, specifically from a productivity gap, is weak.
Job Reallocation (Claim 9)
The EIG report claims that job reallocation has slowed is an accurate depiction of the economy. However, attributing this slowdown to lower innovation, specifically due to a widening productivity gap, is wrong. This is because 1) both laggard and leader firms still have an incentive to innovate at high levels despite the productivity gap—as previously explained—and 2) studies generally conclude that industry-wide changes, rather than firm-level behavior, are the causes for declining job reallocation.
As mentioned, the productivity gap is not causing leader and laggard firms to reduce their rate of innovation because they have other incentives to innovate. As a result, declining innovation, specifically from the productivity gap, is not the reason for declining job reallocation in the United States. Indeed, Alonso-Borrego and Collado argued this when they noted that “there is not much empirical evidence about the effect of innovation on job creation and destruction. One of the main reasons for the scarcity … is the lack of appropriate data due to the difficulties of obtaining adequate observed measures of technological innovation at the microeconomic level.”[60] In other words, it is challenging to conclude that innovation—let alone, changes in firm-level innovation, specifically due to a productivity gap—is the cause for declining job reallocation.
Indeed, most researchers have concluded that a series of industry-wide changes can explain the job reallocation slowdown, while few have gone further to explain the slowdown with factors influencing firm-level decisions on innovation. For instance, economists have concluded that difficulties in employment adjustment margins, changes in firm age, changes in firm size, and globalization are some of the causes for declining reallocation. For example, Decker et al. attribute the declining reallocation to labor adjustment costs (e.g., unlawful discharge regulations or occupational licensing) that reduce the incentive for firms to destroy jobs when their productivity drops.[61] Meanwhile, another study by Hyatt and Spletzer attributes the declining reallocation to shifts in firm size and age. Their study concludes that the shift toward larger firms accounts for 10 percent and 13 percent of the decline in job creation and destruction, respectively.[62] Moreover, they found that firm age can explain 19 percent and 14 percent, respectively, of job creation and destruction.[63] Further corroborating this finding, Decker et al. concluded that the shifting age of firms accounts for 26 percent of the decline in job reallocation while the shift in firm size accounts for 10 percent.[64] Finally, a study by Kurz and Seses finds that both firms exporting and those exporting and importing have less employment volatility, meaning that the decline in job reallocation could be due to the United States shifting its employment dynamics abroad.[65] As a result, the EIG report’s conclusion that declining innovation, specifically from a widening productivity gap, can explain job reallocation is, at best, an unconfirmed guess.
Young Firm Activity and Young Firms’ Share of Employment (Claim 8)
The EIG report claims that firm entry rate and the share of young firms in the economy have declined is an accurate depiction of the economy. However, its explanation that less innovation from laggard firms, specifically due to a widening productivity gap, is causing these declines is questionable. As mentioned, laggard firms have other incentives to enter the market and innovate than catching up to leader firms (e.g., innovating to be acquired by leader firms). As such, lower innovation on the part of laggard firms, specifically due to a widening productivity gap, is not the primary reason for a decline in the share of young firms and their entry.
Indeed, if less innovation from laggards, specifically due to a widening productivity gap, really did reduce entry and the share of young firms, then start-ups in the high-tech sector should have declined more than those in low-tech sectors. This is because high-tech sectors have greater levels of innovation, meaning the productivity gap should be wider and harder to close. Corroborating this, a Brookings study notes that “industries with particularly scalable technologies like computer programming … there has been greater divergence between the top and bottom frontier firms.”[66] As such, laggards in these sectors would be even less inclined to innovate, and thus, entry should be expected to decline more than that of low-tech sectors.
However, while low-tech sectors have declined, those in high-tech sectors have not. Disaggregating data to the sector level, studies reveal that most of the decline in young firms comes from the retail sector, which has relatively lower levels of innovation than do high-tech sectors. In an analysis of U.S. start-ups, an ITIF report finds that retail start-ups declined by 140,985 from 1977 to 2016.[67] As a result, including this sector would mean that the total number of U.S. start-ups only grew by 7,229 during this period.[68] However, excluding it, the total U.S. start-ups grew by 148,214.[69] Further corroborating this, a study by Decker et al. concludes that the reason the retail sector saw the largest decline in business dynamism since the 1970s is partly due to the changing composition of business types away from “mom and pop” single-unit establishments to large, national firms.[70]
Moreover, studies have also revealed that the young firms in high-tech sectors have not declined—except for a brief period post-2000 due to the dot-com bust—but instead have risen in recent decades. Coinciding with the decline in retail start-ups, the Decker et al. study finds that the information sector, which includes multiple high-tech industries, saw a rise in young business activity during the 1980s and 1990s.[71] Although they found that young firms in this sector did decline in the post-2000 period, this decline was partly because of the dot-com bubble burst when a vast proportion of Internet-based companies went bankrupt.[72] As such, the decline was not permanent. Indeed, an ITIF report finds that technology-based start-ups—defined as those with STEM (science, technology, engineering, and math) workers twice the national average or those with high R&D intensity—increased steadily from 116,000 in 2007 to 171,000 in 2016.[73] Thus, the types of start-ups that have grown and declined do not support the EIG report’s claim that laggard firms’ reduction in innovation, specifically due to a productivity gap, is the cause for the decline in the entry and share of young firms in the economy.
Decline in SMEs’ Share of Workers (Claim 11)
Accordingly, as the decline in the entry and share of young firms is not because of laggard firms reducing their level of innovation, specifically due to a widening productivity, the decline in the share of workers employed by SMEs also cannot be this reason. This is because the EIG report’s model implies that decline in the entry and share of young firms is the cause for decline in the share of workers employed by SMEs. As such, disproving the link between the decline in entry and share of young firms to innovation levels of laggard firms means that the link between any subsequent economic trends tied to the decline in entry and share of young firms and that of laggard firms’ innovation level, specifically due to a widening productivity gap, is also invalid. Moreover, the data clearly shows that, on average, small firms are less productive than large ones, so a shift away from small-firm employment is a benefit to economic growth.[74]
Dispersion of Firm Growth Rates (Claim 10)
The EIG report also implies that the declining growth rate dispersion results from a decline in young firms. As with Claim 11, since the link between the decline in entry and share of young firms to innovation levels of laggard firms has been disproved, the link between innovation levels of laggard firms, specifically due to a widening productivity gap, and the dispersion of firm growth rate is also invalid.
On a related note, the EIG report does elaborate on this claim to argue that the decline in the dispersion of firm growth rate is due to the decline in young firm activity in the high-growth, high-tech sector.[75] However, an ITIF report shows that young firms, or start-ups, have not declined when the retail sector has been removed but instead have risen by 148,214.[76] Meanwhile, another ITIF report finds that tech-based start-ups rose 47 percent from 2007 to 2016.[77] Further corroborating this increase, a study by Stern finds that 5 percent of start-ups are those with significant innovation and growth potential and that these start-ups have grown over the last decade.[78] As such, the decline in the dispersion of firm growth rates is not due to a decline in young, high-growth firms. Indeed, this is why Decker et al. asserted that they “don’t have a good explanation for the decline in dispersion and skewness we observe in the high-tech sector.”[79]
Claims about the Inventor Landscape
The EIG report also provides a section examining the innovation landscape of the U.S. economy in order to further support its general argument that poor knowledge diffusion is causing declining business dynamism. In that section, it argues that four trends are occurring in the U.S. innovation landscape:
1. The share of inventors in the total workforce as well as the ratio of private R&D to GDP have increased.
2. The share of inventors employed by young firms has declined.
3. Inventors in young firms produce more impactful patents.
4. Entrepreneurship by inventors, who tend to found faster-growing start-ups, has dropped.
However, these trends are, at best, questionable because they are based on a single study by Akcigit and Goldschlag that has two methodological issues: 1) it uses a base year of 2000 and 2) uses patents to measure innovation.[80]
The first problem of the Akcigit and Goldschlag study is that the authors used 2000 as their base year when examining how the allocation of inventors to young and incumbent firms have changed in the last decades. This is problematic because 2000 was the year the dot-com bubble peaked and burst, meaning that a large number of Internet-based firms peaked and subsequently went bankrupt. Indeed, the NASDAQ-Composite Index that focuses on technology companies shows this when it peaked at 5,408.6 in March 2000, only to subsequently decline 60 percent by 2002.[81] In other words, many venture-backed Internet start-up companies also peaked in 2000 and subsequently went bankrupt in the following years. For instance, Webvan.com, a late-1990s startup company selling groceries, saw its stock plummet from $30 to $0.06 a share, only to go bankrupt in 2001.[82] As such, using 2000 as a base year for any analysis regarding young firms or their relevant components (i.e., employment of inventors at young firms or entrepreneurship by inventors) is methodologically biased because it will overestimate these changes since it includes the impact of an unusual economic event.
Despite its rarity, this shakeout and decline in the number of tech start-ups is not only normal, but healthy. The history of the U.S. economy has been characterized by this “boom and bust” cycle of start-ups. When a new general purpose technology appears on the scene, there is a Schumpeterian “swarm” of new entrants trying out different combinations of business models and technologies. However, over time, most of these new entrants will perish while only the most successful ones survive to become the prevailing dominant firms. Indeed, this is why Robert Atkinson and Michael Lind wrote that “as the techno-economic paradigm matures, the few firms that survive the savage Darwinian competition tend to prevail, and in many cases they stay on top for decades or generations.”[83] They highlighted that these types of cycles have occurred throughout history, such as with the automobile industry, which left the economy with three large automobile manufacturers: Chrysler, Ford, and General Motors. More recently, the decline in the number of start-ups during the dot-com bust is this type of cycle occurring in the information technology industry, leaving the economy with Google, Apple, Microsoft, and Facebook.
The second problem with this study is that it uses patents to measure the impact of an inventor’s innovation. This is problematic because patents are more likely to only capture product innovation while failing to capture the extent of process innovation. A study by Knott and Vieregger examining R&D productivity and firm size explains that patents “miss a good deal of large firm innovation. This is because process and incremental innovation (the two forms favored by large firms) … are less likely to be patented.”[84] Further corroborating this, Acs and Audretsch similarly asserted that studies testing the Schumpeterian hypothesis that firm size is related to innovative activity are flawed because they use patents or other proxies to measure innovation despite the fact that not all inventions are patented.[85] Indeed, another study using patents as a measure also notes that “patents capture a small subset of corporate innovation occurring in industries.”[86] In other words, patents fail to capture the true impact of an inventor’s process innovation because they cannot accurately capture all forms of innovative activity in the economy. As such, since patents cannot accurately capture process innovation, they also cannot accurately capture the existing innovation it is based on and the future innovation that uses it as a basis. Thus, the Akcigit and Goldschlag study fails to capture the true impact of innovation from inventors at incumbent and young firms because patents cannot accurately capture all forms of innovative activity.
The methodological issues in the Akcigit and Goldschlag study mean that the four trends on the U.S. innovation landscape presented by the EIG report are, at best, questionable.
Methodological Issues Linking Knowledge Diffusion and Business Dynamism
The second set of trends the authors focused on pertains to trends in patenting. First, they looked at increasing concentration in patent reassignment. They then turned to a supposed rise in patent litigation and the role that non-patenting entities (NPEs) play in such litigation. While the data the authors used is not in and of itself incorrect, their claims seem to either lack nuance of the issue at play or suffer from methodological flaws.
Concentration in Patents and Reassignments
The authors began by citing trends in patent application and reassignment as major contributors to declining dynamism. They noted that there has been an increase in the concentration of patent reassignment among top firms. They argued that this, in turn, is contributing to a decline in the diffusion of technology and associated knowledge. However, the study fails to provide any evidence of causation, merely correlation. Furthermore, the concerns over patent concentration piggyback off the incorrect assertion that concentration has dramatically risen. But as this rebuttal already argues, concentration has only increased slightly and has declined among the most concentrated sectors. Certainly, knowledge transfer among tech leaders has not led to declining dynamism in our high-tech sectors. For example, Intel has sold many of its patents to Apple, and Motorola sold many of its patents to Google. Reassignment is a means for allowing top innovators to build off the developments of other innovators.
Furthermore, the sole focus on patent reassignment discounts the fact that reassignment is only one of several different methods of technology and knowledge transfer.[87] In practice, licensing has also been a means of knowledge diffusion in recent decades. Indeed, there’s a whole industry of patent-holding companies that aim to license patents to competing firms. This gets to another talking point regarding NPEs.
The authors also attempted to further bolster their argument by pointing to a rise in self-citations and trends in claim lengths. However, even the data they cited does not point to a dramatic rise in self-citations. The data from the United States Patent Office (USPTO) they use showed that, while the share of self-citations was about 31 percent in 1980, it rose to about 37 percent in 2010.[88] Interestingly, they didn’t seem to track those citations since 2010. Additionally, their own calculations suggested that the average claim length was not higher in 2010 than it was in 1980; rather, it gradually decreased from the year 1980 to about 2000 before increasing between 2000 and 2010 back to the average length it had circa 1985.[89] In short, neither of these trends seem to help with the argument that patent concentration is becoming more problematic than ever.
Patent Litigation
The second trend the authors focused on is the supposed rise in patent lawsuits since 2010. As with the claims of increasing concentration, claims of IP litigation run amok have also become quite popular in the last few years. To their credit, they rightly pointed out that much of this has to do with the America Invents Act (AIA) of 2011, which changed the nature of patent litigation. Under the reforms of the AIA, joinder lawsuits, which involve “joining” multiple defendants in a single suit, became much more difficult. As such, rather than one lawsuit covering multiple defendants, plaintiffs now opt to file separate suits for each defendant. Certainly, this would lead to an upward trend in the number of lawsuits. However, as Gupta and Kappos found in an analysis from CSIS, after taking account of this legislative change, the absolute number of patent lawsuits only increased by a very small amount.[90]
To be sure, the absolute number of lawsuits is in and of itself a serious methodological flaw. Furthermore, it is wrong to assume that more lawsuits are necessarily a bad thing. The increase in lawsuits is, to a certain extent, an expected consequence of the fact that there has been a substantial rise in the number of patents overall. This is mainly due to the rise in patents in the information and communications technology sector since the dawn of the information age.[91] So in a certain sense, the rise in the number of lawsuits is a sign that there’s more, rather than less, innovation than ever. As such, one should always measure these sorts of trends on a normalized (i.e., percentage or per-capita) basis. To their credit, the authors did talk about the trend in per capita terms in one part of their paper. Interestingly, though, they did not apply the reforms of the AIA into their calculations for their per-capita-adjusted analysis. Here, the evidence does not support the paper’s assertion. The same study by Gupta and Kappos finds that lawsuits as a proportion of all patents seems to have fallen since 2010 to a low point around 2018–2020, after taking account of the AIA’s reforms.[92]
The Role of Non-patenting Entities
The paper then shifts to discussing the role NPEs play in the rise in litigation. The increase in NPE activity is largely driven by the rise of patent-assertion entities (PAEs), also pejoratively referred to as “patent trolls.” While there’s no doubt that there may be individual PAEs that are overly litigious, the study makes the flaw of lumping all PAEs under a single label. In fact, the PAE industry is made up of multiple types of firms, each with a different business model. For instance, a 2016 study from the Federal Trade Commission finds that most of the PAE industry does not fit the “patent troll” caricature. The study divides PAEs into Portfolio PAEs and Litigation PAEs. Firms of the former type are those that focus on licensing out of patents, akin to a traditional conception of a patent holding company. Firms in the latter type are those that more closely fit the “patent troll” caricature. The study finds that Litigation PAEs constitute 96 percent of all lawsuits. However, they only make up about 20 percent of all PAE revenue.[93] By contrast, relatively few lawsuits come from the Portfolio PAEs which make up 80 percent of the industry’s revenue. That same study also looks at the issue of patent quality when judging by the number of citations. Overall, the study does not find evidence of lower quality among Portfolio PAEs. Another similar study from the European Commission identifies six types of PAEs, each with its own distinct business model. Some are in the business of litigation; others are in the business of merely selling licenses on behalf of patenting firms.[94] This suggests that, while there are certainly individual PAEs that may act as opportunistic actors, it’s inaccurate to claim that they necessarily represent the industry at large. Instead, analysts should take a more nuanced look at the industry in order to better understand specifically which firms are bringing the majority of cases.
Conclusion
A cottage industry has emerged in the last decade to try to provide an empirical underpinning for the “smallist,” neo-Brandeisian movement that holds that small firms are good while big firms are bad. Virtually all of it has been systematically rebutted, but like weeds, it just keeps sprouting up, as we see with the EIG report.
This is not to say that the United States (and all OECD nations) does not need more innovation. It does. Nor is it to say that all-sized firms are not important in that process. They are. But rather than approach innovation from a zero-sum view that requires attacking large, higher-efficiency firms, small-firm innovation proponents should focus their advocacy on policies to help new innovators: policies such as reforming the Small Business Innovation Research (SBIR) program, preserving the Bayh-Dole program, expanding the refundable R&D tax credit for start-ups, expanding regional technology hubs in the Heartland, spurring universities to do a better job of commercializing technology, and much more.[95] Let’s celebrate all sized innovators: small, medium, and big.
Acknowledgments
The authors would like to thank Robert D. Atkinson for his guidance on this report. Any errors or omissions are the authors’ responsibility alone.
About the Authors
Trelysa Long is a policy analyst for antitrust policy with ITIF’s Schumpeter Project on Competition Policy. She was previously an economic policy intern with the U.S. Chamber of Commerce. She earned her bachelor’s degree in economics and political science from the University of California, Irvine.
Ian Tufts is a policy analyst at ITIF. His research focuses on the economic implications of innovation and technology policy. He holds a Master of Science in applied economics from The George Washington University and a Bachelor of Science in economics from George Mason University.
About ITIF
The Information Technology and Innovation Foundation (ITIF) is an independent 501(c)(3) nonprofit, nonpartisan research and educational institute that has been recognized repeatedly as the world’s leading think tank for science and technology policy. Its mission is to formulate, evaluate, and promote policy solutions that accelerate innovation and boost productivity to spur growth, opportunity, and progress. For more information, visit itif.org/about.
Endnotes
[1]. Robert Atkinson and Michael Lind, Big is Beautiful: Debunking the Myth of Small Business (Massachusetts: MIT press, 2019).
[2]. Ufuk Akcigit, Sina Ates, and Craig Chikis, “Trend in U.S. Business Dynamism and the Innovation Landscape” (Economic Innovation Group, 2023), https://eig.org/innovation-patent-trends/.
[3]. Joe Kennedy, “Monopoly Myths: Is Concentration Eroding Labor’s Share of National Income?” (ITIF, October 2020), https://itif.org/publications/2020/10/13/monopoly-myths-concentration-eroding-labors-share-national-income/.
[4]. Ibid; Joe Kennedy, “Monopoly Myths: Is Concentration Leading to Higher Profits?” (ITIF, May 2020), https://itif.org/publications/2020/05/18/monopoly-myths-concentration-leading-higher-profits/.
[5]. “Research and Development: U.S. Trends and International Comparison” (Washington D.C.: National Science Foundation, April 2022), https://ncses.nsf.gov/pubs/nsb20225/recent-trends-in-u-s-r-d-performance.
[6]. Matej Bajgar, Chiara Criscuolo, and Jonathan Timmis, “Supersize Me: Intangibles and Industry Concentration” (Organization for Economic Cooperation and Development, DSTI/CHE (2019) September 13, 2019).
[7]. Chiara Criscuolo et al., “New Evidence on Intangibles, Diffusion and Productivity” (Organization for Economic Cooperation and Development, Directorate for Science, Technology and Innovation, Committee on Industry, Innovation and Entrepreneurship, DSTI/CIIE/WPIA(2020)6, September 2020).
[8]. Chiara Criscuolo, Peter GAL, and Dan Andrews, “The best vs the rest: The global productivity slowdown hides an increasing performance gap across firms” (Center for Economic Policy Research, March 2017), https://cepr.org/voxeu/columns/best-vs-rest-global-productivity-slowdown-hides-increasing-performance-gap-across.
[9]. Joe Kennedy, “Monopoly Myths: Is Concentration Eroding Labor’s Share of National Income?”
[10]. Nicolas Cruzet and Janice Eberly, “Understanding Weak Capital Investment: The Role of Market Concentration and Intangibles” (paper published by the Kellogg Scholl of Management at Northwestern University, 2019), https://www.kellogg.northwestern.edu/faculty/crouzet/html/papers/IntangiblesInvestmentConcentration_published.pdf.
[11]. “Benefits of Competition and Indicators of Market Power,” Council of Economic Advisers Issue Brief, May 2016, https://obamawhitehouse.archives.gov/sites/default/files/page/files/20160502_competition_issue_brief_updated_cea.pdf.
[12]. Muge Adalet McGowan, Dan Andrews, and Valentine Millot, “The Walking Dead? Zombie Firms and Productivity Performance in OECD Countries” (OECD Economic Department Working Paper No. 1372, January 2017), https://www.oecd-ilibrary.org/docserver/180d80ad-en.pdf?expires=1709558963&id=id&accname=guest&checksum=75EC9A5A703B3E37E208585A2E4902A4.
[13]. Peter Claeys, Juan Jung, and Gonzalo Gomez-Bengoechea, “Laggards v Leaders: productivity and innovation Catchup” (INFER Working Paper Series, 2024), https://infer-research.eu/wp-content/uploads/2024/01/WP2024.01.pdf.
[14]. Luis Cabral, “Standing on the Shoulder of Dwarfs: Dominant Firms and Innovation Incentives” (working paper, August 2018), http://luiscabral.net/economics/workingpapers/innovation%202018%2008.pdf.
[15]. Francisco Marcos, “Innovation by Dominant Firms in the Market: Damned If You Don’t…But Damned If You Do?” (working paper IE Law School, June 2016), https://cee.ie.edu/wp-content/uploads/sites/568/2022/10/AJ8-232-I.pdf.
[16]. Ibid.
[17]. Sheryl Winston Smith, “Follow me to the innovation frontier? Leaders, laggards, and the differential effects of imports and exports on technological innovation,” Journal of International Business Studies 25, no. 3 (2014), https://www.jstor.org/stable/pdf/43653713.pdf.
[18]. Ibid.
[19]. David Autor et al., “The Fall of the Labor Share and the Rise of Superstar Firms,” The Quarterly Journal of Economics, Volume 135, no. 2 (2020), https://academic.oup.com/qje/article/135/2/645/5721266#201515535; David Autor et al., “Concentrating on the Fall of the Labor Share,” American Economic Review: Papers & Proceedings 107, no. 5 (2017), https://doi.org/10.1257/aer.p20171102.
[20]. Gustavo Grullo, Yelena Larkin, and Roni Michaely, “Are U.S. Industries Becoming More Concentrated?” (working paper, August 2017), https://mendoza.nd.edu/wp-content/uploads/2019/01/2017_fall_seminar_series_gustavo_grullon_paper.pdf.
[21]. Trelysa Long, “Unmasking Methodological Flaws in the Research Linking Concentration and Inflation” (ITIF, January 5, 2024), https://itif.org/publications/2024/01/05/unmasking-methodological-flaws-in-the-research-linking-concentration-and-inflation/.
[22]. Joe Kennedy, “Monopoly Myths: Are Markets Becoming More Concentrated?” (ITIF, June 2020), https://itif.org/publications/2020/06/29/monopoly-myths-are-markets-becoming-more-concentrated/.
[23]. Robert Atkinson and Filipe Lage de Sousa, “No, Monopoly Has Not Grown” (ITIF, June 2021), https://itif.org/publications/2021/06/07/no-monopoly-has-not-grown/.
[24]. Ibid.
[25]. Ibid.
[26]. Ibid.
[27]. Akcigit, Ates, and Chikis, “Trend in U.S. Business Dynamism and the Innovation Landscape.”
[28]. Atkinson and Lage de Sousa, “No, Monopoly Has Not Grown.”
[29]. Jan De Loecker and Jan Eeckhout, “The Rise of market Power and the Macroeconomic Implications” (working paper from NBER, August 2017), https://www.nber.org/system/files/working_papers/w23687/w23687.pdf.
[30]. Kennedy, “Monopoly Myths: Is Concentration Leading to Higher Profits?”
[31]. Ibid.
[32]. Atkinson and Lind, Big is Beautiful: Debunking the Myth of Small Business.
[33]. Kennedy, “Monopoly Myths: is Concentration Leading to Higher Markups” (ITIF, June 2020), https://www2.itif.org/2020-monopoly-myths-markups.pdf.
[34]. Ibid.
[35]. Chad Syverson, “Macroeconomics and Market Power: Context, Implications, and Open Questions,” Journal of Economic Perspectives 33, no.3 (2019): 31–32, https://www.aeaweb.org/articles?id=10.1257/jep.33.3.23.
[36]. Kennedy, “Monopoly Myths: is Concentration Leading to Higher Markups.”
[37]. Ibid.
[38]. Ibid.
[39]. Ibid.
[40]. Gauti Eggertsson, Jacob Robbins, and Ella Getz Wold, “Kaldor and Piketty’s Facts: the Rise of Monopoly Power in the United States” (NBER working paper, February 2018), https://www.nber.org/system/files/working_papers/w24287/w24287.pdf.
[41]. Akcigit, Ates, and Chikis, “Trend in U.S. Business Dynamism and the Innovation Landscape.”
[42]. Ibid.; Kennedy, “Monopoly Myths: Is Concentration Leading to Higher Profits?”
[43]. Ibid.
[44]. Ibid.
[45]. Ibid.
[46]. Ibid.
[47]. Kennedy, “Monopoly Myths: Is Concentration Eroding Labor’s Share of National Income?”
[48]. Ibid.
[49]. Ibid.
[50]. Michael Elsby, Bart Hobijn, and Aysegul Sahin, “The Decline in the U.S. Labor Share” (Brookings Institute, Fall 2013), https://www.brookings.edu/wp-content/uploads/2016/07/2013b_elsby_labor_share.pdf.
[51]. Ibid.
[52]. Ibid.
[53]. Ibid.
[54]. Ibid.
[55]. Kennedy, “Monopoly Myths: Is Concentration Eroding Labor’s Share of National Income?”
[56]. Erik Brynjolfsson, Seth Benzell, and Daniel Rock, “How to solve the puzzle of missing productivity growth” (Brookings Institute, May 2021), https://www.brookings.edu/articles/how-to-solve-the-puzzle-of-missing-productivity-growth/.
[57]. “Prophet of Pessimism,” International Monetary Fund, June 2017, https://www.imf.org/external/pubs/ft/fandd/2017/06/people.htm.
[58]. Organization of Economic Cooperation and Development, The Future of Productivity (Paris: 2015), https://www.oecd-ilibrary.org/economics/the-future-of-productivity_9789264248533-en.
[59]. Brynjolfsson, Benzell, and Rock, “How to solve the puzzle of missing productivity growth.”
[60]. Cesar Alonso-Borrego and Dolores Collado, “Innovation and Job Creation and Destruction: Evidence from Spain,” Recherches Economiques De Louvain 68 (2002), https://www.cairn.info/revue-recherches-economiques-de-louvain-2002-1-page-148.htm.
[61]. Ryan Decker et al., “Declining Business Dynamism: What We Know and the Way Forward,” American Economic Review 106, no. 5 (2016), https://www.jstor.org/stable/pdf/43861015.pdf.
[62]. Henry Hyatt and James Spletzer, “The recent decline in employment dynamics,” IZA Journal of Labor Economics 2, no. 5 (2013), https://izajole.springeropen.com/articles/10.1186/2193-8997-2-5#ref-CR29.
[63]. Ibid.
[64]. Ryan Decker et al., “The Secular Decline in Business Dynamism in the U.S.” (working paper, June 2014), https://econweb.umd.edu/~haltiwan/DHJM_6_2_2014.pdf.
[65]. Christopher Kurz and Mine Senses, “Importing, Exporting and Firm-Level Employment Volatility” (working paper from the Federal Reserve Board in Washington D.C., 2013), https://www.federalreserve.gov/pubs/feds/2013/201344/201344pap.pdf.
[66]. Dan Andrews, Chiara Criscuolo, and Peter GAL, “The global productivity slowdown, technology divergence, and public policy: A firm level perspective” (Brookings Institute, September 2016), https://www.brookings.edu/articles/the-global-productivity-slowdown-technology-divergence/.
[67]. Robert Atkinson and Caleb Foote, “Monopoly Myths: Is Concentration Leading to Fewer Start-Ups?” (ITIF, August 2020), https://itif.org/publications/2020/08/03/monopoly-myths-concentration-leading-fewer-start-ups/.
[68]. Ibid.
[69]. Ibid.
[70]. Decker et al., “The Secular Decline in Business Dynamism in the U.S.”
[71]. Ibid.
[72]. “The Late 1990s Dot-Com Bubble Implodes in 2000,” Goldman Sachs, https://www.goldmansachs.com/our-firm/history/moments/2000-dot-com-bubble.html.
[73]. J. John Wu and Robert Atkinson, “How Technology-based Start-ups Support U.S. Economic Growth” (ITIF, November 2017), https://www2.itif.org/2017-technology-based-start-ups.pdf.
[74]. Atkinson and Lind, Big is Beautiful: Debunking the Myth of Small Business.
[75]. Akcigit, Ates, and Chikis, “Trend in U.S. Business Dynamism and the Innovation Landscape.”
[76]. Atkinson and Foote, “Monopoly Myths: is Concentration Leading to Fewer Start-Ups?”
[77]. Wu and Atkinson, “How Technology-based Start-ups Support U.S. Economic Growth.”
[78]. Ibid.
[79]. Ryan Decker et al., “Where has all the skewness gone? The Decline in High-growth (young) firms in the U.S.” (NBER working paper, December 2015), https://www.nber.org/system/files/working_papers/w21776/w21776.pdf.
[80]. Ufuk Akcigit and Nathan Goldschlag, “Where has all the ‘creative talent’ gone? Employment Dynamics of U.S. Inventors” (working paper from the Becker Friedman Institute, March 2023), https://bfi.uchicago.edu/wp-content/uploads/2023/03/BFI_WP_2023-32.pdf.
[81]. Robert Atkinson et al., “The Internet Economy 25 Years After .Com” (ITIF, March 2010), https://www2.itif.org/2010-25-years.pdf.
[82]. Ibid.
[83]. Atkinson and Lind, Big is Beautiful: Debunking the Myth of Small Business.
[84]. Anne Marie Knott, “Reconciling the Firm Size and Innovation Puzzle” (paper from Center for Economic Studies, April 2018), https://www2.census.gov/ces/wp/2016/CES-WP-16-20RR.pdf.
[85]. Zoltan Acs and David Audretsch, “Innovation, Market Structure, and Firm Size,” The Review of Economics and Statistics 69, no. 4 (1987), https://www.jstor.org/stable/1935950.
[86]. Maria Priestley, T. J. Sluckin, and Thanassis Tiropais, “Innovation on the web: the end of the S-curve,” Digital Technology, Culture and Society 4, no. 4 (2020), https://www.tandfonline.com/doi/full/10.1080/24701475.2020.1747261.
[87] . “Technology Transfer Agreements,” World Intellectual Property Organization (WIPO), accessed February 25, 2024, https://www.wipo.int/technology-transfer/en/agreements.html.
[88]. Ibid., 1.
[89]. Ibid., 1.
[90]. Kirti Gupta and David J. Kappos, “For ‘Patent Wars’ Alarmists, Time to Make Peace with the Empirical Data” (CSIS, November 2021), https://www.csis.org/analysis/patent-wars-alarmists-time-make-peace-empirical-data.
[91]. WIPO, IP Statistics Data Center (5 - Patent grants by technology, Total count by filing office, 1980, 2022), accessed February 25, 2024, https://www3.wipo.int/ipstats/ips-search/patent.
[92]. Ibid., 76.
[93]. U.S. Federal Trade Commission (FTC), Patent Assertion Entity Activity: An FTC Study (Washington, DC: FTC, 2016), https://www.ftc.gov/system/files/documents/reports/patent-assertion-entity-activity-ftc-study/p131203_patent_assertion_entity_activity_an_ftc_study_0.pdf.
[94]. European Commission, “Patent assertion entities in Europe: Their impact on innovation and knowledge transfer in ICT markets” (Brussels: European Commission, 2016), https://op.europa.eu/en/publication-detail/-/publication/18fbdb72-9a87-11e6-9bca-01aa75ed71a1/language-en.
[95]. Atkinson and Lind, Big is Beautiful: Debunking the Myth of Small Business; Joe Kennedy and Robet Atkinson, “Why Expanding the R&D Tax Credit is Key to Successful Corporate Tax Reform” (ITIF, July 2017), https://www2.itif.org/2017-rd-tax-credit.pdf.; Robert Atkinson, Mark Muro, and Jacob Whiton, “The Case for Growth Centers: How to Spread Tech Innovation Across America” (ITIF and Brookings, December 2019), https://www2.itif.org/2019-growth-centers.pdf.
