


Comparing Canadian and U.S. R&D Leaders in Advanced Sectors

R&D-intensive companies are key to national growth and competitiveness. Canada lags far behind the United States and the rest of the world in R&D-intensive firms. The Canadian government should consider reforming and expanding its SR&ED tax incentive.
KEY TAKEAWAYS
Key Takeaways
Contents
Appendix 1: Industry Sector Groups. 29
Introduction
Advanced, traded sectors are critical to national innovation and competitiveness.[1] A key indicator of strength in those sectors is the amount firms invest in research and development (R&D) to produce new innovations. Canada has long lagged behind the United States in business R&D, even when adjusting for gross domestic product (GDP). This report assesses where the two countries stand in their advanced sectors’ private R&D spending.[2]
Using the EU R&D 2,500 Scoreboard, which covers 90 percent of the world’s private-sector R&D spending, the report compares U.S. and Canadian-headquartered firms’ R&D spending in three groups of economic sectors.[3] First, we examine nine strategically important advanced, traded sectors. Second, we compare U.S. and Canadian firms across all nonadvanced traded sectors. Finally, we examine nontraded sectors. There are, however, three caveats about this dataset: The companies’ locations are categorized by their headquarters rather than where R&D investments occurred, the R&D spending is in nominal dollars, and main business activities classify company sectors. (See appendix 2 for details.)
Canadian firms in advanced sectors spent five times less than the global average on R&D in 2021.
Each section of the report examines U.S. and Canadian private-sector R&D from firms in those sectors on a size-adjusted basis—first relative to the size of their respective economies, then as proportions of global R&D in each sector or group of sectors, and finally using an industrial concentration ratio known as a location quotient (LQ), which is R&D as a share of a country’s national economy versus the global average.
Our report finds that Canadian firms in advanced sectors spent five times less than the global average on R&D in 2021. As a result, Canadian firms’ R&D spending lagged behind the global average in all advanced sectors even when adjusting for GDP. Similarly, U.S. firms lagged behind the global average in four advanced sectors. However, U.S. firms’ size-adjusted spending in all advanced sectors was still higher than Canadian firms’. Although U.S. firms’ spending was higher, their spending had either declined or remained stagnant in seven advanced sectors, compared with five for Canadian firms.
Examining Advanced Sectors
The following subsections compare the United States and Canada’s private business R&D spending from firms in nine advanced sectors: aerospace and defense, electronic and electrical equipment, general industrials, industrial engineering, pharmaceutical and biotechnology, software and computer services, technology and hardware equipment, alternative energy, and automobiles and parts. It is important to note that the sample of firms only includes the top 2,500 R&D spenders globally. (Refer to appendix 2 for details about Amazon’s addition to the 2021 data.)
In 2021, 660 U.S. and 22 Canadian firms made the EU R&D 2,500 Scoreboard in these nine sectors.[4] So while U.S. GDP was approximately 11 times greater than Canada’s, the number of firms on the R&D list was 30 times higher.[5] (See table 1.)
Table 1: Number of firms in nine advanced trade sectors, 2021[6]
|
Sector |
United States |
Canada |
Rest of the World |
Total |
|
Pharmaceuticals and Biotechnology |
263 |
6 |
209 |
478 |
|
Software and Computer Services |
197 |
6 |
134 |
337 |
|
Technology Hardware and Equipment |
71 |
3 |
133 |
207 |
|
Electronic and Electrical Equipment |
41 |
2 |
206 |
249 |
|
Automobiles and Parts |
28 |
2 |
118 |
148 |
|
Aerospace and Defense |
15 |
2 |
27 |
44 |
|
Industrial Engineering |
28 |
1 |
138 |
167 |
|
General Industrials |
15 |
0 |
49 |
64 |
|
Alternative Energy |
2 |
0 |
6 |
8 |
|
Total |
660 |
22 |
1,020 |
1,702 |
The average U.S. firm invested $802 million in R&D, 0.06 standard deviations above the average firm’s R&D spending of $656 million in the sectors globally.[7] In comparison, the average Canadian firm invested $234 million in R&D, 0.18 standard deviations below the average firm.[8]
U.S. firms’ size-adjusted R&D spending was higher than Canada’s in all nine industries.
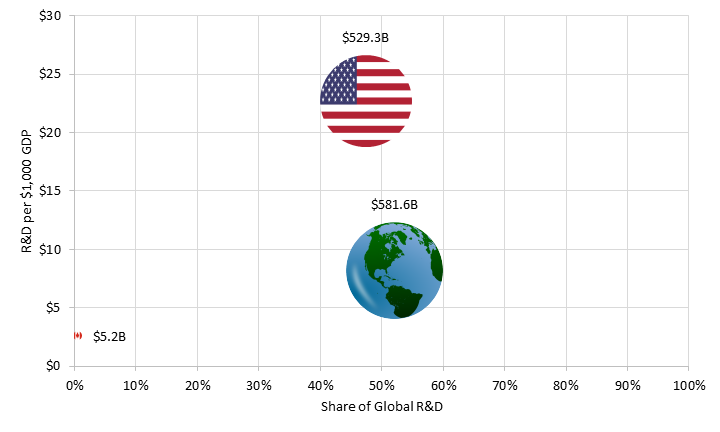
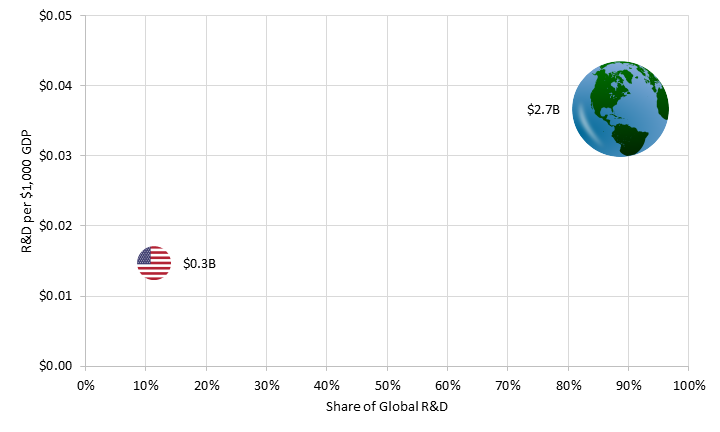
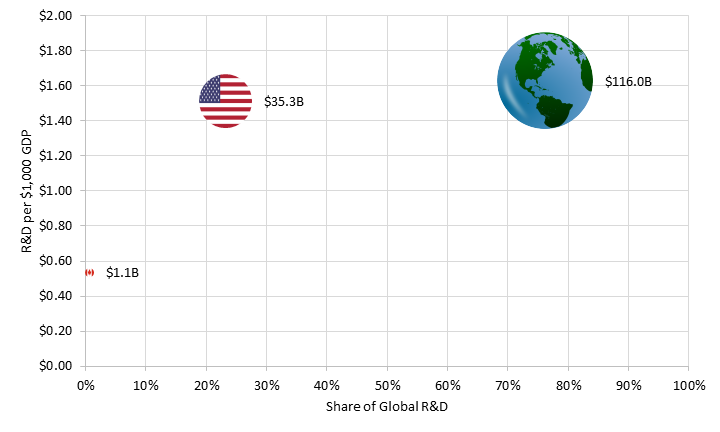
Collectively, U.S. firms in these sectors invest more in R&D than do Canadian firms. In 2021, U.S. firms spent almost 103 times more than Canadian firms: $529 billion on R&D, while Canadian firms spent $5.2 billion, despite U.S. GDP being just 11.7 times greater than Canada’s.[9] As a result, U.S. firms’ global R&D share was 47.4 percent compared with Canadian firms’ 0.5 percent.[10] (See figure 1.) This is compared with the rest of the world’s 52.1 percent.[11] Even when controlling for GDP, U.S. firms still spent more than Canadian firms. For every $1,000 of GDP, U.S. firms in these nine sectors spent $22.70 on private R&D, while Canadian firms invested $2.59.[12] The rest of the world’s firms spent $8.17.[13]
Figure 1: R&D spending by U.S. and Canadian firms (including Amazon) in all advanced sectors, 2021[14]
U.S. firms’ size-adjusted R&D spending was larger than Canadian firms’ in 2021. The size-adjusted R&D spending compares U.S. and Canadian firms’ R&D spending as a share of the respective countries’ GDPs to the global average R&D spending as a share of the world’s GDP. This results in an industry concentration ratio known as an LQ, which we express as a multiple. For example, if a country has twice the global average corporate R&D in a given sector, then its LQ in that sector is 2. The LQ is important in this analysis because it compares the performance of firms in each country with the global average after adjusting for the size of each country’s economy. By that measure, U.S. firms’ size-adjusted R&D spending was higher than Canada’s in all nine industries. (See table 2.)
Table 2: Business R&D relative to the global average in nine advanced sectors, 2021[15]
|
U.S. Firms LQ |
Canadian Firms LQ |
|
|
Aerospace and Defense |
1.79x |
0.45x |
|
Software and Computer Services |
3.14x |
0.41x |
|
Automobiles and Parts |
0.67x |
0.27x |
|
Pharmaceuticals and Biotechnology |
2.18x |
0.18x |
|
Technology Hardware and Equipment |
2.20x |
0.09x |
|
Industrial Engineering |
0.84x |
0.09x |
|
Electronic and Electrical Equipment |
0.50x |
0.06x |
|
General Industrials |
1.13x |
0.00x |
|
Alternative Energy |
0.47x |
0.00x |
|
All Advanced Industries |
1.96x |
0.22x |
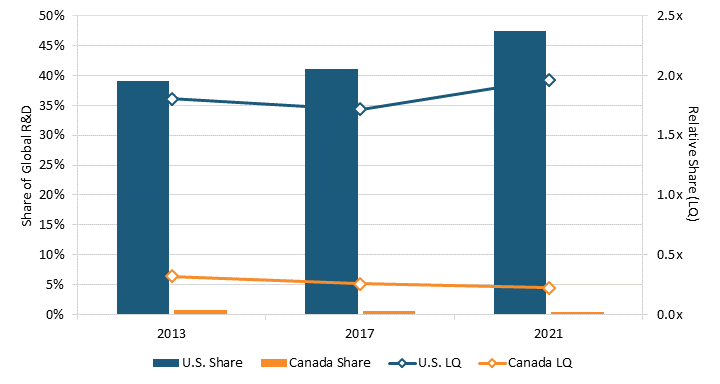
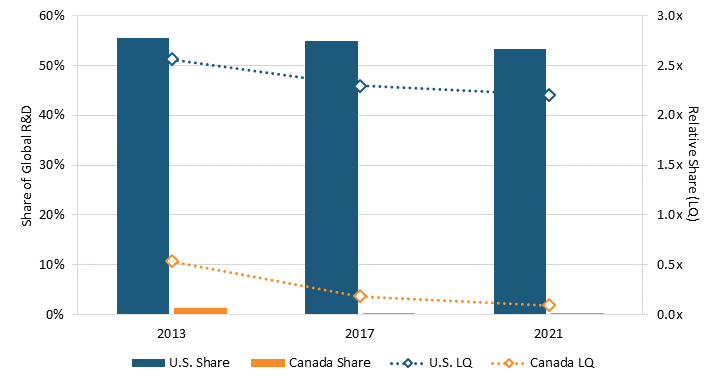
From 2013 to 2021, U.S. firms’ R&D share of these nine global sectors rose from 39.1 percent to 47.4 percent.[16] In comparison, Canadian firms’ R&D share fell from 0.8 percent to 0.05 percent.[17] Moreover, U.S. firms’ size-adjusted R&D spending rose from 80 percent to almost 100 percent above the global average(1.80 to 1.96).[18] In comparison, Canadian firms’ size-adjusted spending declined from 68 percent below the global average to 78 percent below the global average (0.32 to 0.22).[19] (See figure 2.) Although U.S. firms’ size-adjusted spending declined in seven of nine advanced sectors, their overall location quotient in those sectors rose in part because of the large increases in spending in the software and computer services sector and, to some extent, in the pharmaceutical and biotechnology sector.
Figure 2: Projected R&D spending by U.S. and Canadian firms in all advanced sectors[20]
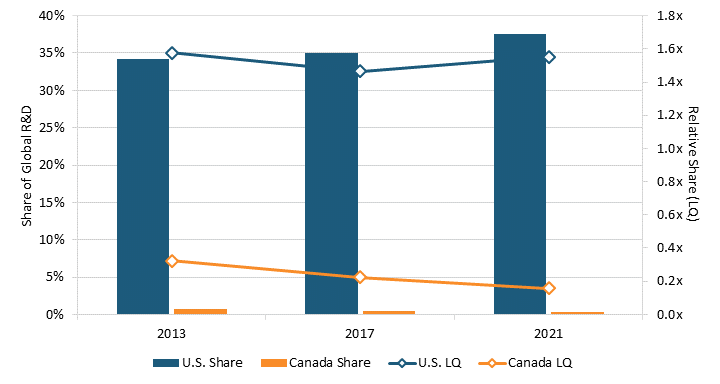
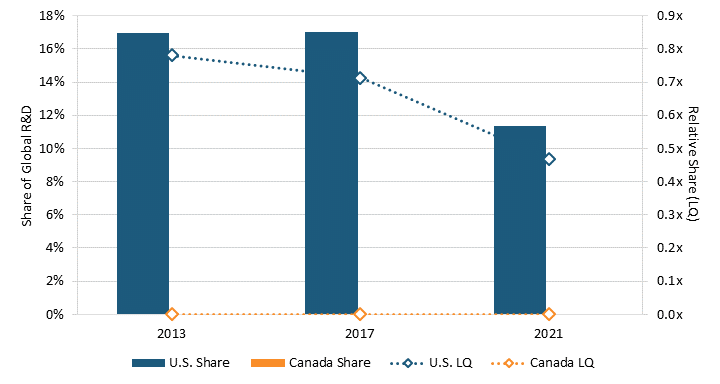
Both the United States and Canada rely on firms in the software and services sector to maintain their growth in size-adjusted R&D spending for advanced sectors. From 2013 to 2021, excluding software and computer services, U.S. firms’ R&D spending slipped from 57 percent above the global average (1.57) to 55 percent above average (1.55).[21] Similarly, Canadian firms’ R&D spending in advanced industries without the software sector fell from 32 percent to 16 percent of the global average (0.32 to 0.16).[22] (See figure 3.)
Figure 3: Projected R&D spending by U.S. and Canadian firms in all advanced sectors, excluding software and computer services[23]
Aerospace and Defense
The aerospace and defense sector includes manufacturers, assemblers, and distributors of aircraft parts, aircrafts, and communication satellites used in both commercial and private air transport.[24] The sector also includes producers of military aircraft, radar equipment, and weapons used in the defense industry.[25]
In 2021, 15 U.S. firms in this sector made the EU R&D 2,500 list, including Raytheon Technologies, Boeing, and Lockheed Martin.[26] Two Canadian firms, CAE and Bombardier, made the list.[27] In 2021, the average U.S. firm in the sector spent $626 million on R&D, a 0.17 standard deviation above the average firm’s R&D spending of $495 million in the aerospace and defense sector globally.[28] In comparison, the average Canadian firm in the sector spent $100 million, a 0.52 standard deviation below the average firm’s globally.[29]
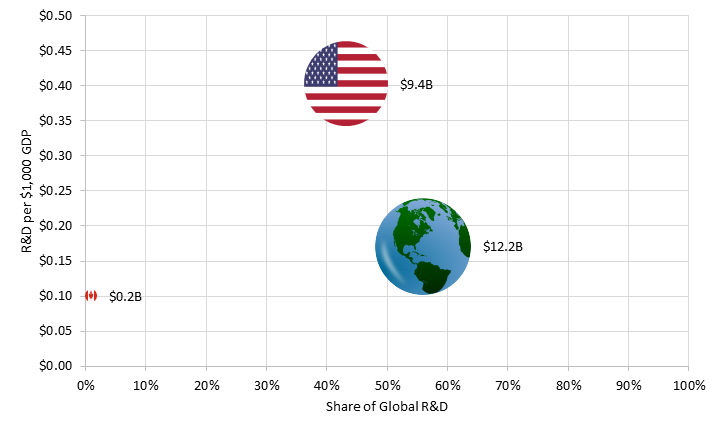
U.S. firms spent about 47 times more on R&D than did Canadian firms: $9.4 billion compared with $200 million.[30] When controlling for GDP, U.S. firms spent four times more than Canadian firms ($0.40 on R&D for every $1,000 of GDP compared with $0.10 for Canadian firms).[31] As a result, U.S. firms’ R&D spending made up 43.2 percent of the global sector’s R&D spending compared with 0.9 percent for Canadian firms.[32] This is compared with the rest of the world’s 55.9 percent and R&D spending of $0.17 for every $1,000.[33] (See figure 4.)
U.S. firms spent about 47 times more on aerospace and defense R&D in 2021 than did Canadian firms.
Figure 4: R&D spending by U.S. and Canadian firms in the aerospace and defense sector, 2021[34]
U.S. firms consistently had a higher global share of R&D spending. From 2013 to 2021, U.S. firms’ share of global R&D rose from 35 percent to 43 percent.[35] Canadian firms’ shares declined from 8.1 percent to 0.9 percent.[36]
U.S. firms’ size-adjusted R&D spending was 60 percent higher than the global average (1.6) in 2013, rising to 80 percent above the global average (1.8) in 2021.[37] In comparison, Canadian firms’ R&D spending was 240 percent higher than the global average (3.4) in 2013 and fell to 60 percent below the global average (0.4) in 2021.[38] (See figure 5.)
Figure 5: U.S. and Canadian firms’ shares of global R&D in the aerospace and defense sectors[39]
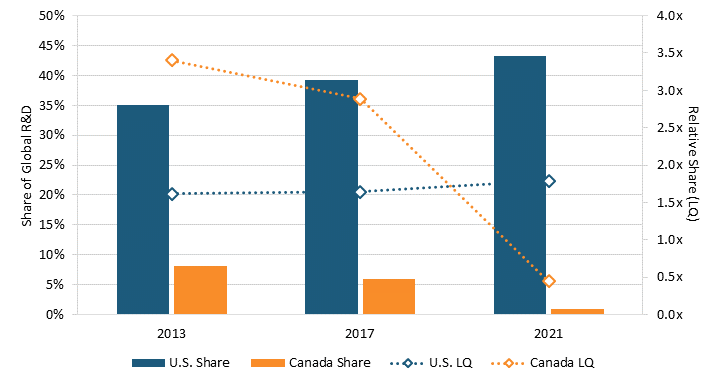
U.S. firms’ size-adjusted R&D spending on aerospace and defense was 80 percent above the global average in 2021, while Canadian firms’ R&D spending was 60 percent below the global average.
Electronic and Electrical Equipment
The electronic and electrical equipment sector includes makers and distributors of electrical parts for radios and other consumer electronics, including cables and transistors.[40] The sector also includes companies providing mechanical and electronic security; filtration systems; products used in the measurement of electric, gas, and water; pollution control equipment; and electrical devices and components marketed to businesses.[41]
In 2021, 41 U.S. firms made the EU R&D 2,500 list, including Danaher, Keysight Technologies, and Northrop Grumman, while 2 Canadian firms, Ballard Power Systems and Canadian Solar, made the list.[42] (Refer to appendix 2 for sector classification.) The average U.S. firm spent $300 million on R&D, while the average Canadian firm spent $65 million.[43] This is compared with the global average firm’s $408 million.[44]
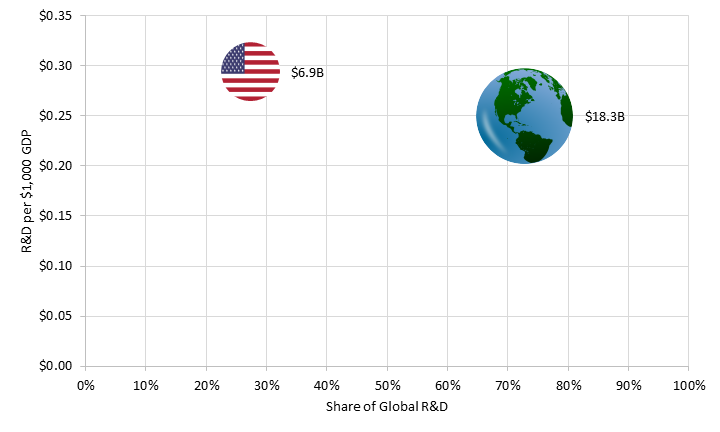
In 2021, U.S. firms spent $12.3 billion on R&D, almost 94 times more than Canadian firms’ $131 million.[45] As a result, Canadian firms’ R&D share of the global sector was 0.1 percent, while U.S. firms’ share was 12.1 percent.[46] Adjusting for GDP, Canadian firms also spent less than U.S. firms. For every $1,000 of GDP, Canadian firms spent $0.07 on R&D compared with $0.53 for U.S. firms.[47] This is compared with the rest of the world’s R&D share of 87.8 percent and spending of $1.25 for every $1,000.[48] (See figure 6.)
In 2021, U.S. firms spent almost 94 times more than Canadian firms on R&D in electronic and electrical equipment.
Figure 6: R&D spending by U.S. and Canadian firms in the electronic and electrical equipment sector, 2021[49]
From 2013 to 2021, U.S. firms’ share of R&D spending in the global sector stayed at about 12 percent.[50] In comparison, Canadian firms’ nonexistent share rose to 0.1 percent in the same period.[51] (See figure 7.)
Moreover, compared with the global average, U.S. firms’ size-adjusted R&D investments worsened from 2013 to 2021, when U.S. R&D spending decreased from 60 percent to 50 percent of the global average (0.6 to 0.5).[52] In comparison, Canadian firms’ R&D spending increased from 0 percent to 10 percent of the global average (0.0 to 0.1).[53]
Figure 7: U.S. and Canadian firms’ shares of global R&D in the electronic and electrical equipment sectors[54]
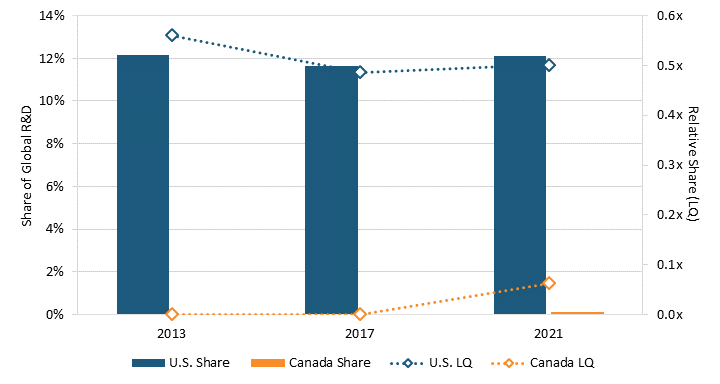
U.S. firms’ size-adjusted R&D investments in electronic and electrical equipment worsened to 50 percent of the global average in 2021, while Canadian firms’ R&D spending increased to 10 percent of the global average.
General Industrials
The general industrials sector includes companies “engaged in three or more industrial business activities, none of which is the dominant business line.”[55] Moreover, the sector also includes companies that manufacture, distribute, and/or produce paint, material coatings, resin, plastic products, chemicals used in plastic, structural glass and other glass products, and packaging products.[56]
In 2021, 15 U.S. firms made the EU R&D 2,500 list, including General Electric, Honeywell, and 3M.[57] No Canadian firms made the list.[58] In 2021, the average U.S. firm spent $457 million on R&D.[59] In comparison, no Canadian firms invested in R&D.[60] The average firm in the global sector spent $393 million.[61]
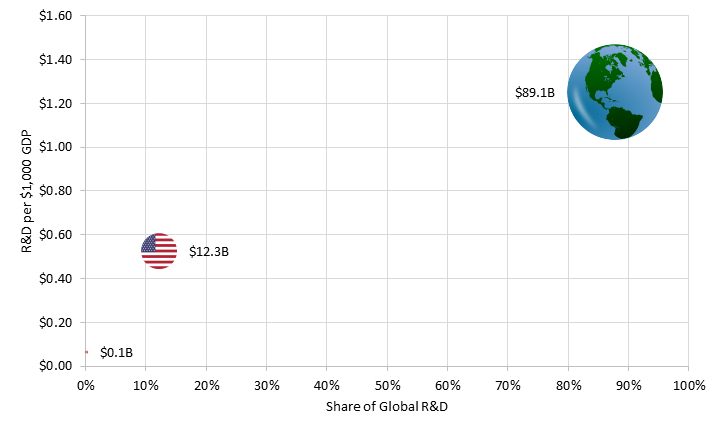
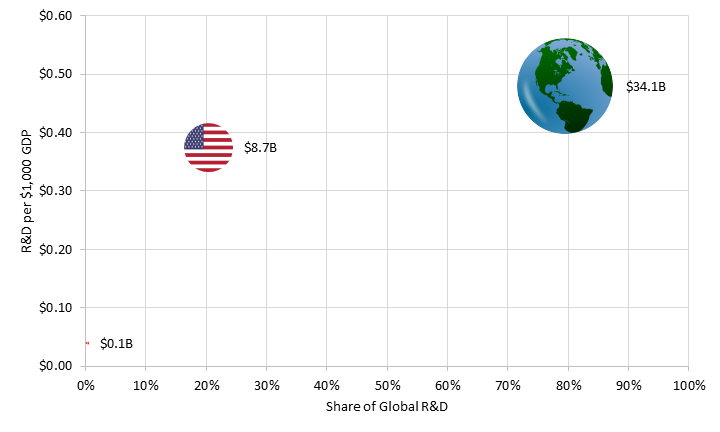
U.S. firms in the general industrials sector spent more on R&D than did Canadian firms. In 2021, U.S. firms spent $6.9 billion on R&D, while Canadian firms did not invest.[62] As a result, U.S. firms’ R&D spending made up 27.3 percent of the global sector’s while Canadian firms’ share was nonexistent.[63] Adjusting for GDP, U.S. firms also spent more than Canadian firms did on R&D. For every $1,000 of GDP, U.S. firms spent $0.19 on R&D compared with Canadian firms’ nonexistent spending.[64] This is compared with the rest of the world’s R&D share of 72.7 percent and spending of $0.25 for every $1,000.[65] (See figure 8.)
U.S. firms spent $6.9 billion on R&D in general industrials in 2021, while Canadian firms did not invest.
Figure 8: R&D spending by U.S. and Canadian firms in the general industrials sector, 2021[66]
U.S. firms’ R&D share of investment has been declining while Canadian firms’ remains stagnant. From 2013 to 2021, U.S. firms’ share of global R&D declined from 37.5 percent to 27.3 percent, while Canadian firms’ share remained nonexistent.[67] (See figure 9.)
U.S. firms’ size-adjusted R&D investments compared with the global average have declined since 2013, while Canadian firms’ did not rise. From 2013 to 2021, U.S. firms’ R&D spending declined from 170 percent of the global average to 110 percent (1.7 to 1.1).[68] Yet, Canadian firms’ size-adjusted spending change is not much better. In the same period, Canadian firms’ size-adjusted investments remained nonexistent compared with the global average.[69] (See figure 9.) This is worrisome because it means U.S. and Canadian firms are focusing less on competitiveness than are firms in other nations.
Figure 9: U.S. and Canadian firms’ shares of global R&D in the general industrials sector[70]
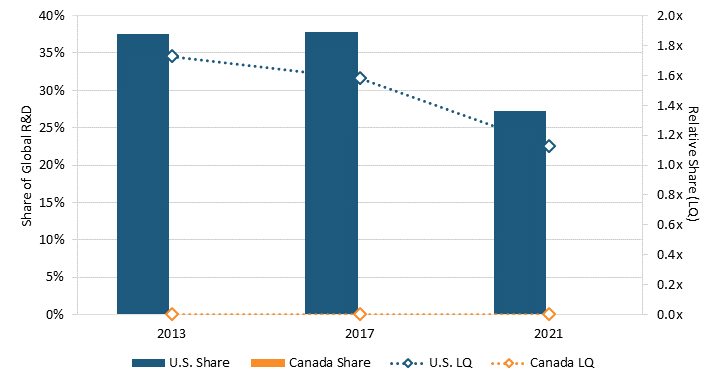
U.S. firms’ size-adjusted R&D investments have declined versus the global average since 2013.
Industrial Engineering
The industrial engineering sector includes “companies that design, develop, manufacture, sell, and support general industrial machines and parts;” manufacture farming equipment; manufacture large construction and port industrial equipment; manufacture and distribute energy output devices (such as diesel engines); manufacture equipment for heavy industries; and manufacture and market specific types or groups of industrial machines and parts.[71]
In 2021, 28 U.S. firms, including Caterpillar, Deere, and Cummins, made the EU R&D 2,500 list.[72] One Canadian firm, Novanta, made the list.[73] The average U.S. firm spent $312 million on R&D, a 0.15 standard deviation above the average firm in the sector globally.[74] In comparison, the average Canadian firm spent $79 million on R&D, a 0.49 standard deviation below the average firm globally.[75] This is compared with the average global firm’s R&D spending of $257 million.[76]
In 2021, U.S. firms spent $8.7 billion on R&D, while Canadian firms spent $79 million.[77] As a result, Canadian firms’ R&D share of the global sector was 0.2 percent compared with U.S. firms’ 20.3 percent.[78] While U.S. firms spent $0.37 for every $1,000, Canadian firms spent $0.04.[79] This is compared with the rest of the world’s R&D share of 79.5 percent and spending of $0.48 for every $1,000.[80] (See figure 10.)
U.S. firms spent $8.7 billion on industrial engineering R&D in 2021, while Canadian firms spent $79 million.
Figure 10: R&D spending by U.S. and Canadian firms in the industrial engineering sector, 2021[81]
Both U.S. and Canadian firms’ share of the industrial engineering sector’s R&D spending declined from 2013 to 2021. In 2013, U.S. firms made up 24.8 percent of the global sector’s R&D spending; yet, their share fell to 20.3 percent by 2021.[82] Similarly, Canadian firms made up 0.4 percent in 2013.[83] However, their share declined to 0.2 percent by 2021.[84]
Compared with the global sector’s average, U.S. firms’ size-adjusted investments in R&D also declined. From 2013 to 2021, U.S. firms’ R&D spending fell from 110 percent to 80 percent of the sector’s global average (1.1 to 0.8), meaning they now perform below the global average in R&D investments.[85] Similarly, Canadian firms’ spending fell from just 20 percent to 10 percent of the sector’s global average (0.2x to 0.1).[86] (See figure 11.) The U.S. and Canadian firms’ declining R&D investment share of GDP hurt both nations’ innovation and competitiveness.
Figure 11: U.S. and Canadian firms’ shares of global R&D in industrial engineering[87]
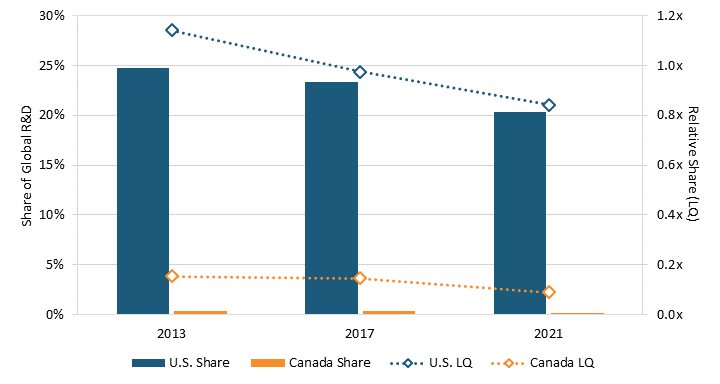
U.S. firms’ size-adjusted investments in industrial engineering R&D declined to 80 percent of the sector’s global average in 2021. Canadian firms’ spending fell to 10 percent of the global average.
Pharmaceutical and Biotechnology
The pharmaceutical and biotechnology sector includes “companies engaged in research into and development of biological substances for the purposes of drug discovery and diagnostic development, and which derive the majority of their revenue from either the sale or licensing of these drugs and diagnostic tools.”[88] It also includes manufacturers of prescription and over-the-counter drugs and companies that cultivate and distribute cannabis, or both.[89]
In 2021, 263 U.S. firms, including Johnson & Johnson, Pfizer, and Bristol-Myers Squibb, made the EU R&D 2,500 list.[90] Six Canadian firms, including Bausch Health Companies, Zymeworks, and Xenon Pharmaceuticals, also made the list.[91] The average U.S. firm spent $523 million on R&D, a 0.01 standard deviation below average globally.[92] In comparison, the average Canadian firm spent $161 million, 0.22 standard deviations below the average firm globally.[93] This is compared with the average firm’s R&D spending of $548 million globally.[94] In other words, both the average U.S. and Canadian firm spent less than the average firm on R&D globally.
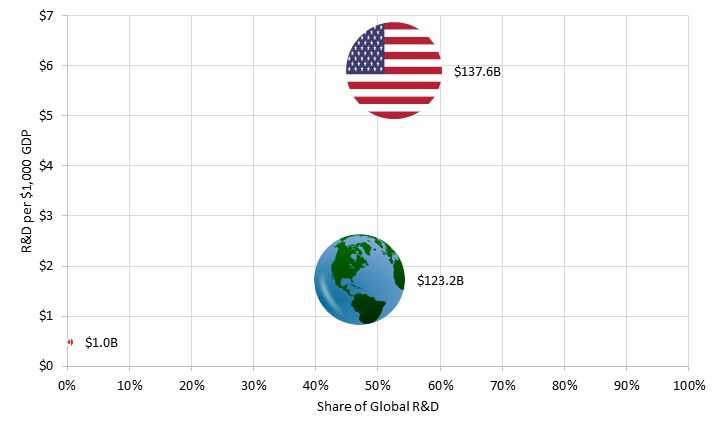
U.S. firms spent significantly more than Canadian firms on R&D. In 2021, U.S. firms spent $138 billion on R&D while Canadian firms only spent $966 million.[95] As a result, U.S. firms’ R&D share of the global sector was 52.6 percent, almost 143 times that of Canadian firms’ 0.4 percent.[96] Controlling for GDP, U.S. firms still spent more. In 2021, U.S. firms spent $5.90 for every $1,000 of GDP.[97] In comparison, Canadian firms only spent $0.49.[98] This is compared with the rest of the world’s R&D share of 47.1 percent and spending of $1.73 for every $1,000.[99] (See figure 12.)
Figure 12: R&D spending by U.S. and Canadian firms in the pharmaceutical and biotechnology sector, 2021[100]
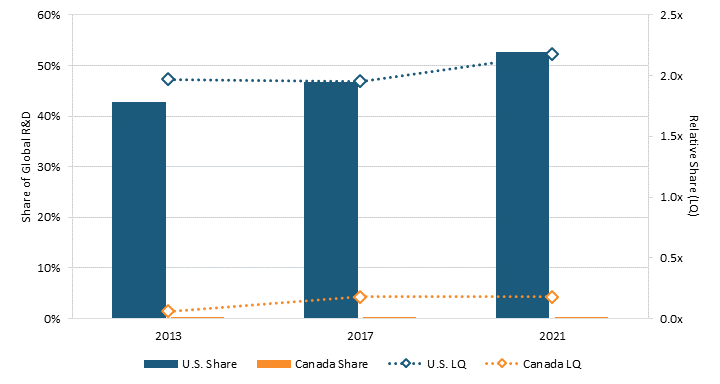
U.S. firms consistently spent more on R&D than did Canadian firms in the last decade. From 2013 to 2021, U.S. firms’ R&D share of the global sector rose from 42.8 percent to 52.6 percent, meaning the majority of R&D spending came from U.S. companies.[101] In comparison, Canadian firms’ R&D share started at 0.1 percent in 2013 and rose to only 0.4 percent by 2021.[102]
Canadian firms in the pharmaceutical and biotechnology sector are not investing as much in R&D in relation to the size of their country’s GDP.
In the last decade, U.S. firms also performed better than the average global R&D share of GDP, while Canadian firms performed poorly. In 2013 and 2017, U.S. firms’ size-adjusted R&D spending was 200 percent of the global average (2.0).[103] And by 2021, that had risen to 220 percent of the global average (2.2).[104] In comparison, Canadian firms’ R&D spending was 10 percent (0.1) of the global average in 2013 and only 20 percent (0.2) in 2017.[105] By 2021, that remained 20 percent of the global average (0.2).[106] (See figure 13.)
Figure 13: U.S. and Canadian firms’ shares of global R&D in pharmaceuticals and biotechnology[107]
Software and Computer Services
The software and computer services sector includes “companies that provide consulting or integration services to other businesses relating to information technology … [including] providers of computer-system design, systems integration, network and systems operations, cloud computing, distributed ledger technology (DLT) consulting and integration, data management and storage, repair services and technical support.”[108] The sector also includes “publishers and distributors of computer software” and companies that generate revenue from virtual products using digital platforms.[109]
In 2021, 197 U.S. firms, including Alphabet, Meta, and Microsoft, made the EU R&D 2,500 list.[110] (See appendix 2 for details on the addition of Amazon.) Six Canadian firms, including Shopify, Constellation Software, and Open Text, also made the list.[111] In 2021, the average U.S. firm spent $1.1 billion on R&D, a 0.7 standard deviation above average globally.[112] In comparison, the average Canadian firm spent $411 million on R&D, 0.12 standard deviations below the average firm globally.[113] This is compared with the average firm’s R&D spending of $857 million globally.[114]
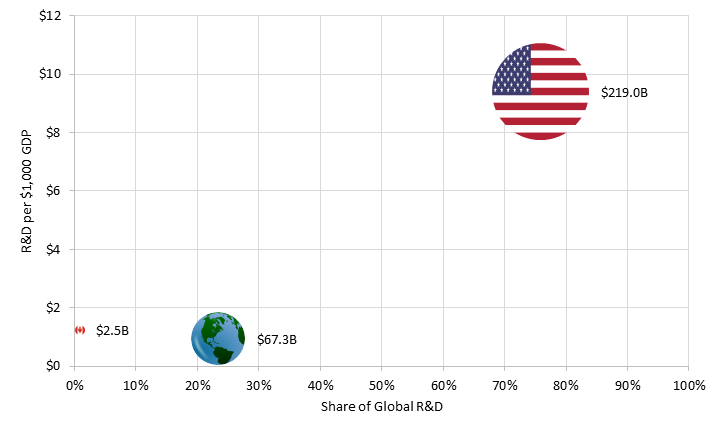
U.S. firms collectively spent more than Canadian firms on R&D. In 2021, U.S. firms spent $219 billion on R&D, making up 75.8 percent of the sector’s global R&D spending.[115] In comparison, Canadian firms spent $2.5 billion, making up 0.9 percent of the global R&D spending.[116] When controlling for GDP, U.S. firms spent about four times more than Canadian firms.[117] For every $1,000 of GDP, U.S. firms spent $9.39, while Canadian firms spent only $1.24.[118] This is compared with the rest of the world’s R&D share of 23.3 percent and spending of $0.95 for every $1,000.[119] (See figure 14.)
Figure 14: R&D spending by U.S. and Canadian firms in software and computer services, 2021[120]
U.S. firms consistently spent more than Canadian firms on R&D. In 2013, U.S. firms’ R&D share of the global sector was 75 percent compared with Canadian firms’ 0.7 percent.[121] And in 2021, that remained about the same (75.8 percent) but was still significantly higher than Canadian firms’ 0.9 percent.[122]
In the last decade, U.S. firms in the sector also performed better than the average global R&D share of GDP, while Canadian firms performed poorly. In 2013, U.S. firms’ size-adjusted R&D spending was 350 percent of the average global (3.5), while Canadian firms’ was 30 percent of the global average (0.3).[123] By 2021, U.S. firms’ R&D spending had declined to 310 percent of the global average (3.1), while Canadian firms’ rose to 40 percent (0.4).[124] (See figure 15.) Despite U.S. firms dedicating more spending to R&D than did Canadian firms, U.S. firms’ size-adjusted spending compared with the global sector’s declined, while Canadian firms’ rose.
Figure 15: U.S. and Canadian firms’ shares of global R&D in software and computer services[125]
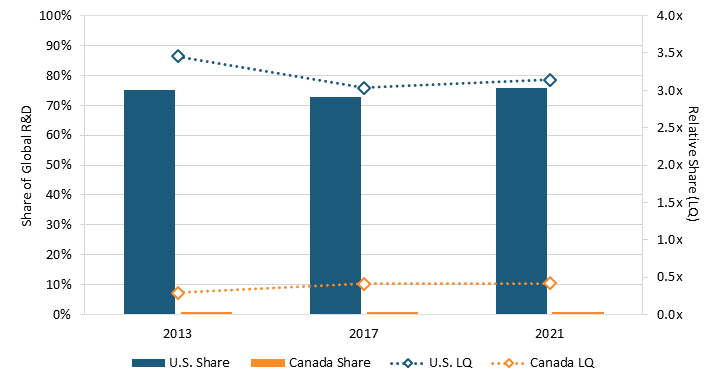
In the last decade, U.S. firms in the software and computer services sector performed better than the average global R&D share of GDP, while Canadian firms performed poorly.
Technology and Hardware Equipment
The technology and hardware equipment sector includes semiconductor and other chip producers and distributors; “companies involved in the application of high technology parts to finished products” (e.g., printed circuit boards); semiconductors, photonics, and wafers creation equipment manufacturers; computer, servers, and other computer hardware manufacturers and distributors; and electronic office equipment manufacturers and distributors.[126]
In 2021, 71 U.S. firms, including Apple, Intel, and Qualcomm, made the EU R&D 2,500 list.[127] Three Canadian firms, including Blackberry, CGI, and Sierra Wireless, also made the list.[128] In 2021, the average U.S. firm spent $1.5 billion on R&D, a 0.19 standard deviation above the average firm in the sector globally.[129] In comparison, the average Canadian firm in the sector spent $126 million, a 0.30 standard deviation below the average firm globally.[130] This is compared with the average firm’s R&D spending of $976 million.[131]
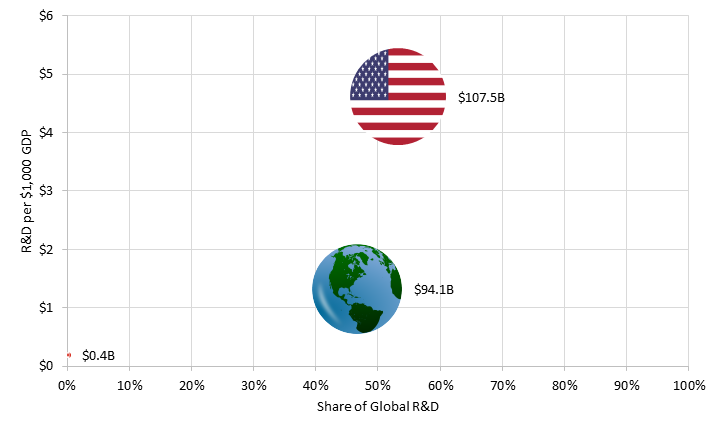
U.S. firms spent more than Canadian firms on R&D. In 2021, U.S. firms spent $108 billion, while Canadian firms only spent $377 million.[132] As a result, U.S. firms’ R&D made up 53.2 percent of the global sector compared with Canadian firms’ 0.2 percent.[133] Controlling for GDP, U.S. firms outspent Canadian firms by 24 times.[134] U.S. firms spent $4.61 for every $1,000 of GDP, while Canadian firms spent $0.19.[135] This is compared with the rest of the world’s R&D share of 46.6 percent and spending of $1.32 for every $1,000.[136] (See figure 16.)
Figure 16: R&D spending by U.S. and Canadian firms in the technology hardware and equipment sector, 2021[137]
In the last decade, U.S. firms also consistently spent more than Canadian firms on R&D. In 2013, U.S. firms’ R&D share of the global industry was 55.6 percent compared with Canadian firms’ 1.3 percent.[138] From 2013 to 2017, U.S. firms’ R&D spending saw a minor decline to 54.9 percent of the global sector.[139] Yet, in the same period, Canadian firms’ share declined despite its already small share, falling to 0.4 percent of the global sector.[140] And from 2017 to 2021, U.S. firms’ R&D share of the global sector again saw a small decline to 53.2 percent, while Canadian firms’ also fell further to 0.2 percent.[141] (See figure 17.)
U.S. firms also performed better than the average global R&D share of GDP, while Canadian firms performed poorly. In 2013, U.S. firms’ size-adjusted R&D spending was 260 percent of the global sector’s (2.6), while Canadian firms’ was 50 percent (0.5).[142] By 2017, U.S. firms’ size-adjusted R&D spending had declined to 230 percent of the global sector’s (2.3), while Canadian firms’ had fallen to 20 percent (0.2).[143] In 2021, U.S. firms’ spending declined to 220 percent of the global sector (2.2), while Canadian firms’ fell to 10 percent (0.1).[144] (See figure 17.) U.S. firms are performing better than the global average, yet U.S. and Canadian firms’ growth in R&D investment is not keeping up with the global average.
Figure 17: U.S. and Canadian firms’ shares of global R&D in technology hardware and equipment[145]
U.S. firms in the technology and hardware equipment sector performed better than the average global R&D share of GDP, while Canadian firms performed poorly.
Alternative Energy
The alternative energy sector includes “companies that produce alternative fuels such as ethanol, methanol, hydrogen and bio-fuels that are mainly used to power vehicles, and companies that are involved in the production of vehicle fuel cells and/or the development of alternative fueling infrastructure.”[146] Moreover, the sector also includes “companies that develop or manufacture renewable energy equipment utilizing sources such as solar, wind, tidal, geothermal, hydro and waves.”[147]
In 2021, two U.S. firms in this sector made the EU R&D 2,500 list: Solaredge Technologies and First Solar.[148] No Canadian firm made the list.[149] That same year, the average U.S. firm spent $171 million on R&D, a 0.39 standard deviation below the average firm’s R&D spending of $378 million in the sector globally.[150] In comparison, the average Canadian firm did not invest in R&D.[151]
Collectively, U.S. firms in the alternative energy sector spent more on R&D than Canadian firms, since Canadian firms did not invest in R&D. In 2021, U.S. firms spent $343 million.[152] As a result, U.S. firms’ R&D share of the global sector was 11.3 percent.[153] Adjusting for GDP, U.S. firms spent $0.01 for every $1,000 of GDP.[154] This is compared with the rest of the world’s R&D share of 88.7 percent and spending of $0.04 for every $1,000.[155] (See figure 18.)
U.S. firms in the alternative energy sector spent more on R&D than Canadian firms, since Canadian firms did not invest in R&D.
Figure 18: R&D spending by U.S. and Canadian firms in the alternative energy sector, 2021[156]
U.S. firms consistently spent more than Canadian firms on R&D since Canadian firms did not invest in R&D. In 2013, U.S. firms’ R&D share of the global sector was 17 percent compared with Canadian firms’ nonexistent share.[157] By 2021, U.S. firms’ share had declined to 11.3 percent, yet Canadian firms’ share was still nonexistent.[158] Despite U.S. firms spending more than Canadian firms, they are losing global R&D shares to other nations.
In the last decade, both U.S. and Canadian firms performed worse than the average global R&D share of GDP. In 2013, U.S. firms’ size-adjusted R&D spending was 80 percent of the average global spending in the sector (0.8), while Canadian firms’ was nonexistent (0.0).[159] By 2021, U.S. firms’ spending declined to 50 percent of the global average (0.5), while Canadian firms’ was still nonexistent (0.0).[160] (See figure 19.) In other words, both U.S. and Canadian firms failed to reach the sector’s average global size-adjusted R&D spending.
Figure 19: U.S. and Canadian firms’ shares of global R&D in alternative energy[161]
Automobiles and Parts
The automobiles and parts sector includes manufacturers and distributors of automobile, truck, and motorcycle tires; makers of cars, SUVs, and light trucks; and manufacturers and distributors of parts for motorcycles and other automobiles, such as engines.[162] The sector also includes “companies that provide assistance to individual vehicle owners.”[163]
In 2021, 28 U.S. firms made the EU R&D 2,500 list, including General Motors, Ford Motor Company, and Tesla.[164] Two Canadian firms also made the list, including Magna and BRP.[165] In 2021, the average U.S. firm spent $985 million on R&D, a 0.06 standard deviation below the average firm’s R&D spending of $1.1 billion in the sector globally.[166] In comparison, the average Canadian firm spent $466 million, a 0.27 standard deviation below the average firm’s.[167]
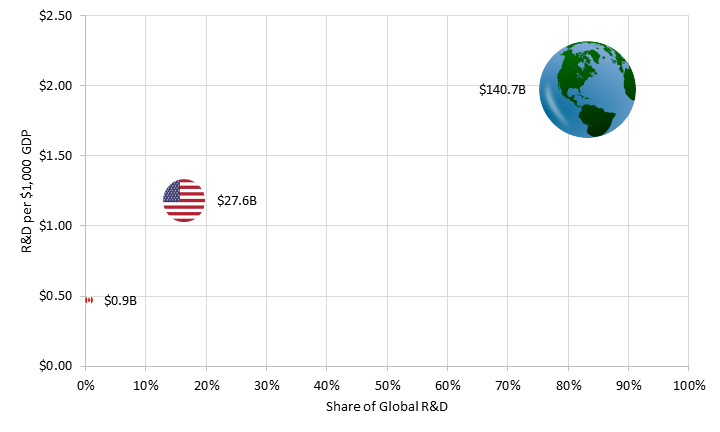
Collectively, U.S. firms spent more on R&D than did Canadian firms. In 2021, U.S. firms spent $27.6 billion, almost 30 times more than Canadian firms’ $933 million.[168] As a result, U.S. firms’ R&D share of the global sector was 16.3 percent compared with Canadian firms’ 0.6 percent.[169] Adjusting for GDP, U.S. firms still spent 2.5 times more than Canadian firms.[170] For every $1,000 of GDP, U.S. firms spent $1.18 compared with Canadian firms’ $0.47.[171] This is compared with the rest of the world’s R&D share of 83.2 percent and spending of $1.98 for every $1,000.[172] (See figure 20.)
In 2021, U.S. firms spent almost 30 times more than Canadian firms on R&D in automobiles and parts.
Figure 20: R&D spending by U.S. and Canadian firms in the automobile and parts sector, 2021[173]
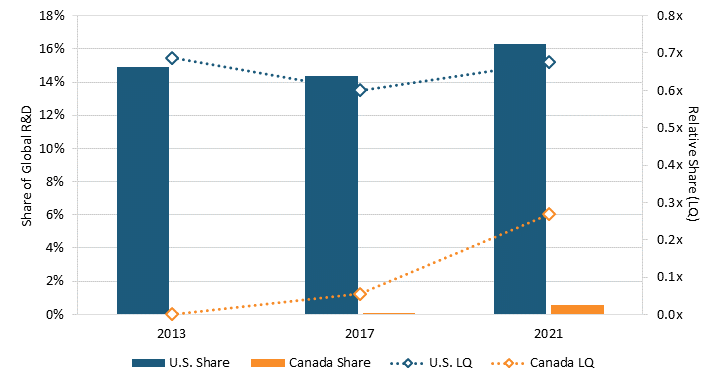
U.S. firms consistently spent more on R&D than did Canadian firms in the last decade. From 2013 to 2021, U.S. firms’ R&D share of the global sector rose slightly from 14.9 percent to 16.3 percent.[174] In comparison, Canadian firms’ started at 0 percent in 2013 and rose to 0.3 percent in 2021.[175]
In the last decade, both U.S. and Canadian firms performed worse than the average global R&D share of GDP. In 2013, U.S. firms’ size-adjusted R&D spending was 70 percent of the average global R&D spending in the sector (0.7), while Canadian firms’ was 0 percent (0.0).[176] However, while U.S. firms’ spending has remained consistent, Canadian firms’ has increased. In 2021, U.S. firms’ spending remained at 70 percent of the global average (0.7), while Canadian firms’ rose to 30 percent (0.3).[177] (See figure 21.) In other words, Canadian firms are catching up to U.S. firms in R&D investment, but both have yet to reach the sector’s average global size-adjusted R&D spending.
In the last decade, both U.S. and Canadian firms performed worse than the average global R&D share of GDP for R&D in automobiles and parts.
Figure 21: U.S. and Canadian firms’ shares of global R&D in the automobile and parts sector[178]
All Other Sectors
The following sections compare the R&D spending of U.S. and Canadian firms in all nonadvanced traded sectors and nontraded sectors.
Nonadvanced Traded Sectors
Nonadvanced traded sectors include all traded sectors that are not one of the advanced sectors (see appendix 1: industry sector groups for a list of sectors). These sectors include producers of leisure goods, chemicals, and food, along with oil and gas producers.
In 2021, 65 U.S. firms and 2 Canadian firms made the EU R&D 2,500 list.[179] The average U.S. firm spent $294 million on R&D, 0.02 standard deviations below the average firm in the sectors globally.[180] In comparison, the average Canadian firm spent $97 million, a 0.39 standard deviation below the average firm.[181] This is compared with the average firm’s spending of $304 million globally.[182] Both the average U.S. and Canadian firm did not invest as much as the average firm globally.
Collectively, U.S. firms invest more in R&D than Canadian firms because of the higher number of U.S. firms. In 2021, Canadian firms invested $194 million, while U.S. firms invested $19 billion.[183] As a result, Canadian firms’ share of the global sectors was 0.2 percent, while U.S. firms’ share was 16 percent.[184] U.S. firms still spent more when controlling for GDP. For every $1,000 of GDP, U.S. firms spent $0.82, while Canadian firms spent $0.10.[185] This is compared with the rest of the world’s R&D share of 83.9 percent and spending of $1.41 for every $1,000.[186] (See figure 22.)
Figure 22: R&D spending by U.S. and Canadian firms in all non-advanced traded sectors, 2021[187]

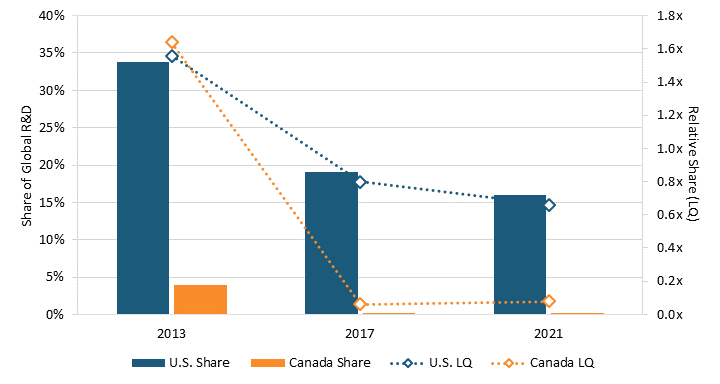
U.S. firms in non-advanced traded sectors spent more than Canadian firms on R&D in the last decade. In 2013, U.S. firms’ R&D share of the global nonadvanced traded sectors was 33.8 percent compared with Canadian firms’ 3.9 percent.[188] By 2021, U.S. firms’ share of the global sectors declined to 16 percent, yet it was still higher than Canadian firms’ 0.2 percent.[189]
When controlling for GDP, U.S. and Canadian firms’ R&D spending started at 160 percent of the global average (1.6) in 2013; yet, by 2021, both had declined to below the global average.[190] In 2021, U.S. firms’ R&D spending was 70 percent of the global average (0.7), while Canadian firms’ spending was 10 percent (0.1).[191] (See figure 23.) In other words, Canadian firms’ size-adjusted R&D spending declined more significantly than U.S. firms, yet both declined since 2013.
Figure 23: U.S. and Canadian firms’ shares of global R&D in all non-advanced traded sectors[192]
Nontraded Sectors
Nontraded sectors include general merchandise stores, life insurance providers, and financial services (see appendix 1: industry sector groups for a list of sectors).
The average Canadian firm spent more on R&D for nontraded sectors. In 2021, 98 U.S. firms and 4 Canadian firms made the EU R&D 2,500 list.[193] The average U.S. firm in nontraded sectors spent $360 million on R&D, a 0.02 standard deviation below the average firm in the sectors globally.[194] In comparison, the average Canadian firm spent $266 million, a 0.15 standard deviation below the average firm.[195] This is compared with the average firm’s R&D spending of $376 million.[196]
Canadian firms spent less on R&D than did U.S. firms. In 2021, Canadian firms spent $1.1 billion on R&D, while U.S. firms spent $35 billion.[197] As a result, Canadian firms’ R&D share of the global sector was 0.7 percent, while U.S. firms’ was 23.2 percent.[198] When controlling for GDP, Canadian firms still spent almost three times more than U.S. firms.[199] For every $1,000, Canadian firms spent $0.54, while U.S. firms spent $1.51.[200] This is compared with the rest of the world’s R&D share of 76.1 percent and spending of $1.63 for every $1,000.[201] (See figure 24.) U.S. firms’ R&D share exceeds Canadian firms,’ thereby promoting greater innovation. Yet, this is not worrisome for Canadian firms, since nontraded sectors do not compete globally.
Figure 24: R&D spending by U.S. and Canadian firms in all non-traded sectors, 2021[202]
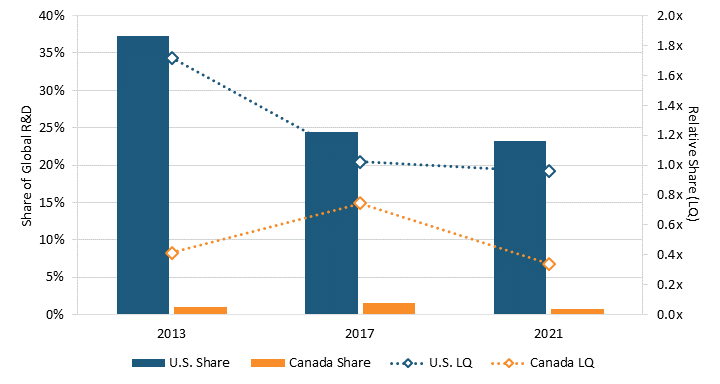
U.S. firms consistently spent more than Canadian firms on R&D. In 2013, U.S. firms’ R&D share of the global sectors was 37.3 percent compared with Canadian firms’ 1.0 percent.[203] By 2021, U.S. firms’ share had declined to 23.2 percent yet was still higher than Canadian firms’ 0.7 percent.[204]
Even when controlling for GDP, U.S. firms’ size-adjusted R&D spending was still higher than Canadian firms.’ In 2013, U.S. firms’ size-adjusted R&D spending was 170 percent of the global average in nontraded sectors (1.7) compared with Canadian firms’ 40 percent.[205] By 2021, U.S. firms spent the same as the global average (1.0) compared with Canadian firms’ 30 percent (0.3).[206] (See figure 25.) Despite U.S. firms’ consistently higher size-adjusted R&D spending, both U.S. and Canadian firms’ growth is slowing compared to the global average. However, U.S. and Canadian firms are not significantly affected because nontraded sectors do not compete in the global economy.
Figure 25: U.S. and Canadian firms’ shares of global R&D in all non-traded sectors[207]
Policy Recommendations
Scientific and engineering research is key to innovation success for firms and economies. This generated knowledge is translated into innovation, including novel products and processes. More importantly, business research resulting in knowledge is a crucial driver of global competitiveness for a nation because manufacturing industries and many service industries rely on R&D for competitive success.[208] Nations can take an array of steps to support R&D-intensive firms, such as supporting advanced STEM education and government funding of research, particularly those involving partnerships with industry.
This report focuses on just one recommendation: improving each nation’s R&D tax credits. The Canadian R&D tax subsidy rate of 19.1 percent is slightly above the median for Organization for Economic Cooperation and Development (OECD) and BRIC countries (Brazil, Russia, India, and China), while the U.S. rate of 9.5 percent is far below. [209] The U.S. Congress should at least double the rate of the Alternative Simplified Credit (ASC) from 14 percent to 28 percent. And the Canadian government should consider replacing the current SR&ED tax credit with one more akin to the U.S. ASC.[210] This would involve limiting the credit to only expenditures above 50 percent of base period spending while at the same time at least doubling the SR&ED rate. This would give companies a greater incentive at the margin to invest in R&D.
Additionally, Congress should restore full expensing of R&D costs. The Accelerate Long-Term Investment Growth Now (ALIGN) Act (S. 1166 and H.R. 2558) and the American Innovation and Jobs Act (S. 749) do this. The ALIGN Act would allow businesses to deduct the cost of new investments in the year they are purchased, thereby incentivizing the private sector to invest in equipment for R&D.[211] The American Innovation and Job Act would “allow companies investing in R&D … [to] either deduct their research expenses or claim the R&D tax credit.”[212] The option to deduct research expenses or claim R&D tax credits would incentivize both small and large businesses to invest in R&D. Passing both of these bills should be the first step toward developing a national innovation system that promotes global competitiveness in key advanced sectors. Most state and provincial governments should also boost their R&D tax credits.[213]
Conclusion
R&D, especially in advanced traded sectors, is a critical driver of a nation’s competitiveness in the global economy. As a result, investment in R&D is vital to achieving and then maintaining or global competitiveness. Yet, the size-adjusted R&D of Canadian firms in all nine advanced sectors still lags behind the global average. Although U.S. firms also lag behind the global average in four advanced sectors, Canadian firms’ size-adjusted R&D spending is much more behind than U.S. firms’. Thus, Canadian firms’ R&D spending falls behind U.S. firms’ in all nine advanced sectors.
Moreover, Canadian firms’ size-adjusted R&D spending did not reach the global average in any of the nine advanced sectors from 2013 to 2021. However, Canadian firms did see an increase in size-adjusted spending over this period in four of the nine advanced sectors. Therefore, the Canadian government should reform tax provisions so that the size-adjusted R&D spending of firms in all advanced sectors can grow or continue to grow.
Appendix 1: Industry Sector Groups
|
Category |
Sectors |
|
|
Advanced Traded Sectors |
▪ Software and Computer Services ▪ Technology Hardware and Equipment ▪ Electronic and Electrical Equipment ▪ Pharmaceuticals and Biotechnology ▪ Automobiles and Parts |
▪ Aerospace and Defense ▪ General Industrials ▪ Industrial Engineering ▪ Alternative Energy |
|
Nonadvanced Traded Sectors |
▪Personal and Household Goods ▪Leisure Goods ▪Chemicals ▪Oil and Gas Producers ▪Food Producers ▪Household Goods and Home Construction ▪Industrial Metals and Mining |
▪Personal Goods ▪Beverages ▪Tobacco ▪Mining ▪Forestry and Paper ▪Toys |
|
Nontraded Sectors |
▪ Fixed Line Telecommunications ▪ Construction and Materials ▪ Health Care Equipment and Services ▪ General Retailers ▪ Banks ▪ Media ▪ Financial Services ▪ Support Services ▪ Electricity ▪ Real Estate Investment and Services ▪ Telecommunications |
▪ Mobile Telecommunications ▪ Support Services ▪ Oil Equipment, Services, and Distribution ▪ Food and Drug Retailers ▪ Gas, Water, and Multiutilities ▪ Nonlife Insurance ▪ Life Insurance ▪ Nonequity Investment Instruments ▪ Equity Investment Instruments |
Appendix 2
Key Differences Between EU R&D 2,500 Scoreboard and Business Enterprise R&D Expenditure Estimates
The EU R&D 2,500 Scoreboard differs from business enterprise R&D expenditures due to different methodologies and data sources. The Scoreboard collects data on company-funded R&D expenditures from audited financial records, regardless of where the R&D occurred. In comparison, the business R&D expenditure estimates consider a sample of all large companies and a representative sample of smaller companies to estimate a country’s total business R&D expenditures. Moreover, the business R&D expenditure estimates refer to R&D financed by a business sector in a given territorial unit, whereas the Scoreboard does not. As a result, the EU R&D 2,500 Scoreboard report notes that “the Scoreboard R&D figures are comparable to BES-R&D [or business R&D expenditures} data at only the global level.”[214] Even then, the estimates are not a complete match due to the different sources and methodologies of data collection.
Location of R&D Activity
The Scoreboard lists companies based on the location of their headquarters rather than the location of R&D activities or investments. As a result, the aggregate R&D spending of a country reflects the amount headquartered firms in that country spent globally rather than domestically. For example, the $5 billion Country A spent on the automobile sector reflects the aggregate amount Country A’s firms spent on R&D globally, and not just the R&D investment in Country A.
Nominal Dollar Figures
The Scoreboard collects R&D spending data from companies’ financial records annually. As a result, companies’ R&D spending is in nominal dollars and not adjusted for changes in currency values. If the value of the dollar strengthens compared with other nations, then U.S. aggregate R&D spending will appear larger than if the dollar value remained constant.
Sector Classification
The EU R&D 2,500 Scoreboard classifies each company using the International Classification Benchmark based on the main sector in which it conducts its business. As a result, the Scoreboard is not a comprehensive estimate of R&D spending invested in a sector but rather an estimate of firms’ (whose main business activity is in that sector) investments in R&D. The estimates in some sectors may therefore be lower than expected since R&D investments by companies whose main activity is not in the sector are not included. Moreover, it is not guaranteed that the R&D investment by a company within a sector is going to R&D for that sector. For example, a company in the retail sector could invest in R&D for new products and also for software, in which case the R&D investment for both the product and software would be included only in the retail sector.
Addition of Amazon to the 2021 EU R&D Scoreboard
Our report adds Amazon to the 2021 EU R&D 2,500 Scoreboard’s list of firms. Although the 2013 and 2017 EU R&D 2,500 Scoreboards include Amazon in their listing, the 2021 Scoreboard does not, despite its significant spending on R&D. One of the reasons may be because Amazon groups its R&D under “technology and content” in its financial records. As a result, Amazon’s R&D spending for 2021 was estimated using its 2021 SEC 10K filing and Statista’s estimates of Amazon’s video and music content budget. The 10K filing notes that Amazon spent $56 billion on “technology and content” in 2021, and Statista found that Amazon spent $13 billion on video and music content.[215] As a result, R&D spending is estimated to be $43 billion, which was added to the 2021 Scoreboard.[216]
About the Authors
Trelysa Long is a research assistant for antitrust policy with ITIF’s Schumpeter Project on Competition Policy. She was previously an economic policy intern with the U.S. Chamber of Commerce. Long earned her bachelor’s degree in economics and political science from the University of California, Irvine.
Dr. Robert D. Atkinson (@RobAtkinsonITIF) is the founder and president of ITIF. His books include Big Is Beautiful: Debunking the Myth of Small Business (MIT, 2018), Innovation Economics: The Race for Global Advantage (Yale, 2012), Supply-Side Follies: Why Conservative Economics Fails, Liberal Economics Falters, and Innovation Economics Is the Answer (Rowman Littlefield, 2007), and The Past and Future of America’s Economy: Long Waves of Innovation That Power Cycles of Growth (Edward Elgar, 2005). He holds a Ph.D. in city and regional planning from the University of North Carolina, Chapel Hill.
About ITIF
The Information Technology and Innovation Foundation (ITIF) is an independent 501(c)(3) nonprofit, nonpartisan research and educational institute that has been recognized repeatedly as the world’s leading think tank for science and technology policy. Its mission is to formulate, evaluate, and promote policy solutions that accelerate innovation and boost productivity to spur growth, opportunity, and progress. For more information, visit itif.org/about.
Endnotes
[1]. Alex Muresianu, “Public and Private R&D Are Complements, Not Substitutes,” Tax Foundation, May 16, 2022, https://taxfoundation.org/private-rd-public-rd-investment/.
[2]. Robert Atkinson, “American needs to sort out its industrial policy confusion,” The Hill, April 15, 2023, https://thehill.com/opinion/technology/3952425-america-needs-to-sort-out-its-industrial-policy-confusion/.; Robert Atkinson, “The Hamilton Index: Assessing National Performance in the Competition for Advanced Industries” (ITIF, June 8, 2022), https://itif.org/publications/2022/06/08/the-hamilton-index-assessing-national-performance-in-the-competition-for-advanced-industries/.
[3]. European Union, EU R&D Scoreboard: The 2014 EU Industrial R&D Investment Scoreboard (Luxembourg: EU, 2014), https://publications.jrc.ec.europa.eu/repository/bitstream/JRC92506/ipts%20jrc%2092506%20%28online%29.pdf; European Union, EU R&D Scoreboard: The 2018 EU industrial R&D Investment Scoreboard (Luxembourg: EU, 2018); European Union, “2021 EU Industrial R&D Investment Scoreboard, European Union, press release, December 17, 2021, https://ec.europa.eu/commission/presscorner/detail/en/IP_21_6599.; The Scoreboard does not specify where each firm located its R&D activities. Therefore, R&D spending by U.S. and Canadian firms is not solely for R&D activities taking place within the United States or Canada.
[4]. European Commission, EU Industrial R&D Investment Scoreboard (World 2500) (R&D spending for top 2,500 companies for 2021/22, accessed April 20, 2023), https://iri.jrc.ec.europa.eu/data.; Macrotrends, Amazon Research and Development Expenses 2010-2023 (R&D spending in 2021, accessed June 14, 2023), https://www.macrotrends.net/stocks/charts/AMZN/amazon/research-development-expenses.
[5]. European Commission, EU Industrial R&D Investment Scoreboard 2021/22, op. cit.; The World Bank, World Development Indicators (GDP, current US dollars, accessed April 20, 2023), https://databank.worldbank.org/source/world-development-indicators.; International Monetary Fund, Representative Exchange Rate for Selected Currencies for January 2021 (exchange rate for euros to US dollars, accessed April 20, 2023), https://www.imf.org/external/np/fin/data/rms_mth.aspx?SelectDate=2021-01-31&reportType=REP.; Macrotrends, Amazon Research and Development Expenses 2010-2023, op. cit.
[6]. European Commission, EU Industrial R&D Investment Scoreboard 2021/22, op. cit.; Macrotrends, Amazon Research and Development Expenses 2010-2023, op. cit.
[7]. European Commission, EU Industrial R&D Investment Scoreboard 2021/22, op. cit.; International Monetary Fund, Representative Exchange Rate for Selected Currencies for January 2021 op. cit.; Macrotrends, Amazon Research and Development Expenses 2010-2023, op. cit.
[8]. Ibid.
[9]. European Commission, EU Industrial R&D Investment Scoreboard 2021/22, op. cit.; International Monetary Fund, Representative Exchange Rate for Selected Currencies for January 2021 op. cit.; Macrotrends, Amazon Research and Development Expenses 2010-2023, op. cit.; The World Bank, World Development Indicators, op. cit.
[10]. European Commission, EU Industrial R&D Investment Scoreboard 2021/22, op. cit.; International Monetary Fund, Representative Exchange Rate for Selected Currencies for January 2021 op. cit.; Macrotrends, Amazon Research and Development Expenses 2010-2023, op. cit.;
[11]. Ibid.
[12]. European Commission, EU Industrial R&D Investment Scoreboard 2021/22, op. cit.; International Monetary Fund, Representative Exchange Rate for Selected Currencies for January 2021 op. cit.; Macrotrends, Amazon Research and Development Expenses 2010-2023, op. cit.; The World Bank, World Development Indicators, op. cit.
[13]. Ibid.
[14]. Ibid.
[15]. Ibid.
[16]. European Commission, EU Industrial R&D Investment Scoreboard (World 2500) (R&D spending for top 2500 companies for 2013/14, 2017/18, 2021/22, accessed April 20, 2023), https://iri.jrc.ec.europa.eu/data.; International Monetary Fund, Representative Exchange Rate for Selected Currencies for January 2013, 2017, and 2021 (exchange rate for euros to US dollars, accessed April 20, 2023), https://www.imf.org/external/np/fin/data/rms_mth.aspx?SelectDate=2021-01-31&reportType=REP.; Macrotrends, Amazon Research and Development Expenses 2010-2023, op. cit.
[17]. Ibid.
[18]. European Commission, EU Industrial R&D Investment Scoreboard (World 2500) (R&D spending for top 2500 companies for 2013/14, 2017/18, 2021/22, accessed April 20, 2023), https://iri.jrc.ec.europa.eu/data.; The World Bank, World Development Indicators, op. cit.; International Monetary Fund, Representative Exchange Rate for Selected Currencies for January 2013, 2017, and 2021, op. cit.; Macrotrends, Amazon Research and Development Expenses 2010-2023, op. cit.
[19]. Ibid.
[20]. Ibid.
[21]. Ibid.
[22]. Ibid.
[23]. Ibid.
[24]. FTSE Russell, Industry Classification Benchmark (ICB) Structure & Definitions (ICB classification and sector descriptions, accessed June 30, 2023), https://www.ftserussell.com/data/industry-classification-benchmark-icb.
[25]. Ibid.
[26]. European Commission, EU Industrial R&D Investment Scoreboard 2021/22, op cit.
[27]. Ibid.
[28]. European Commission, EU Industrial R&D Investment Scoreboard 2021/22, op cit.; Monetary Fund, Representative Exchange Rate for Selected Currencies for January 2021, op. cit.
[29]. Ibid.
[30]. Ibid.
[31]. European Commission, EU Industrial R&D Investment Scoreboard 2021/22, op cit.; The World Bank, World Development Indicators, op cit.; International Monetary Fund, Representative Exchange Rate for Selected Currencies for January 2021, op. cit.
[32]. Ibid.
[33]. Ibid.
[34]. Ibid.
[35]. European Commission, EU Industrial R&D Investment Scoreboard 2013/14, 2017/18, 2021/22, op. cit.
[36]. Ibid.
[37]. European Commission, EU Industrial R&D Investment Scoreboard 2013/14, 2017/18, 2021/22, op. cit.; The World Bank, World Development Indicators, op. cit.; International Monetary Fund, Representative Exchange Rate for Selected Currencies for January 2013, 2017, and 2021, op. cit.
[38]. Ibid.
[39]. Ibid.
[40]. FTSE Russell, Industry Classification Benchmark (ICB) Structure & Definitions, op. cit.
[41]. Ibid.
[42]. European Commission, EU Industrial R&D Investment Scoreboard 2021/22, op cit.
[43]. European Commission, EU Industrial R&D Investment Scoreboard 2021/22, op cit.; International Monetary Fund, Representative Exchange Rate for Selected Currencies for January 2021, op. cit.
[44]. Ibid.
[45]. Ibid.
[46]. Ibid.
[47]. European Commission, EU Industrial R&D Investment Scoreboard 2021/22, op cit.; The World Bank, World Development Indicators, op cit.; International Monetary Fund, Representative Exchange Rate for Selected Currencies for January 2021, op. cit.
[48]. Ibid.
[49]. Ibid.
[50]. European Commission, EU Industrial R&D Investment Scoreboard 2013/14, 2017/18, 2021/22, op. cit.
[51]. Ibid.
[52]. European Commission, EU Industrial R&D Investment Scoreboard 2013/14, 2017/18, 2021/22, op. cit.; The World Bank, World Development Indicators, op. cit.; International Monetary Fund, Representative Exchange Rate for Selected Currencies for January 2013, 2017, and 2021, op. cit.
[53]. Ibid.
[54]. Ibid.
[55]. FTSE Russell, Industry Classification Benchmark (ICB) Structure & Definitions, op. cit.
[56]. Ibid.
[57]. European Commission, EU Industrial R&D Investment Scoreboard 2021/22, op cit.
[58]. Ibid.
[59]. European Commission, EU Industrial R&D Investment Scoreboard 2021/22, op cit.; International Monetary Fund, Representative Exchange Rate for Selected Currencies for January 2021, op. cit.
[60]. Ibid.
[61]. Ibid.
[62]. Ibid.
[63]. Ibid.
[64]. European Commission, EU Industrial R&D Investment Scoreboard 2021/22, op cit.; The World Bank, World Development Indicators, op cit.; International Monetary Fund, Representative Exchange Rate for Selected Currencies for January 2021, op. cit.
[65]. Ibid.
[66]. Ibid.
[67]. European Commission, EU Industrial R&D Investment Scoreboard 2013/14, 2017/18, 2021/22, op. cit.
[68]. European Commission, EU Industrial R&D Investment Scoreboard 2013/14, 2017/18, 2021/22, op. cit.; The World Bank, World Development Indicators, op. cit.; International Monetary Fund, Representative Exchange Rate for Selected Currencies for January 2013, 2017, and 2021, op. cit.
[69]. Ibid.
[70]. Ibid.
[71]. FTSE Russell, Industry Classification Benchmark (ICB) Structure & Definitions, op. cit.
[72]. European Commission, EU Industrial R&D Investment Scoreboard 2021/22, op cit.
[73]. Ibid.
[74]. European Commission, EU Industrial R&D Investment Scoreboard 2021/22, op cit.; International Monetary Fund, Representative Exchange Rate for Selected Currencies for January 2021, op. cit.
[75]. Ibid.
[76]. Ibid.
[77]. Ibid.
[78]. Ibid.
[79]. European Commission, EU Industrial R&D Investment Scoreboard 2021/22, op cit.; The World Bank, World Development Indicators, op cit.; International Monetary Fund, Representative Exchange Rate for Selected Currencies for January 2021, op. cit.
[80]. Ibid.
[81]. Ibid.
[82]. European Commission, EU Industrial R&D Investment Scoreboard 2013/14, 2017/18, 2021/22, op. cit.
[83]. Ibid.
[84]. Ibid.
[85]. European Commission, EU Industrial R&D Investment Scoreboard 2013/14, 2017/18, 2021/22, op. cit.; The World Bank, World Development Indicators, op. cit.; International Monetary Fund, Representative Exchange Rate for Selected Currencies for January 2013, 2017, and 2021, op. cit.
[86]. Ibid.
[87]. Ibid.
[88]. FTSE Russell, Industry Classification Benchmark (ICB) Structure & Definitions, op. cit.
[89]. Ibid.
[90]. European Commission, EU Industrial R&D Investment Scoreboard 2021/22, op cit.
[91]. Ibid.
[92]. European Commission, EU Industrial R&D Investment Scoreboard 2021/22, op cit.; International Monetary Fund, Representative Exchange Rate for Selected Currencies for January 2021, op. cit.
[93]. Ibid.
[94]. Ibid.
[95]. Ibid.
[96]. Ibid.
[97]. European Commission, EU Industrial R&D Investment Scoreboard 2021/22, op cit.; The World Bank, World Development Indicators, op cit.; International Monetary Fund, Representative Exchange Rate for Selected Currencies for January 2021, op. cit.
[98]. Ibid.
[99]. Ibid.
[100]. Ibid.
[101]. European Commission, EU Industrial R&D Investment Scoreboard 2013/14, 2017/18, 2021/22, op. cit.
[102]. Ibid.
[103]. European Commission, EU Industrial R&D Investment Scoreboard 2013/14, 2017/18, 2021/22, op. cit.; The World Bank, World Development Indicators, op. cit.; International Monetary Fund, Representative Exchange Rate for Selected Currencies for January 2013, 2017, and 2021, op. cit.
[104]. Ibid.
[105]. Ibid.
[106]. Ibid.
[107]. Ibid.
[108]. FTSE Russell, Industry Classification Benchmark (ICB) Structure & Definitions, op. cit.
[109]. Ibid.
[110]. European Commission, EU Industrial R&D Investment Scoreboard 2021/22, op cit.; Macrotrends, Amazon Research and Development Expenses 2010-2023, op. cit.
[111]. Ibid.
[112]. European Commission, EU Industrial R&D Investment Scoreboard 2021/22, op cit.; International Monetary Fund, Representative Exchange Rate for Selected Currencies for January 2021, op. cit.; Macrotrends, Amazon Research and Development Expenses 2010-2023, op. cit.
[113]. Ibid.
[114]. Ibid.
[115]. Ibid.
[116]. Ibid.
[117]. European Commission, EU Industrial R&D Investment Scoreboard 2021/22, op cit.; The World Bank, World Development Indicators, op cit.; International Monetary Fund, Representative Exchange Rate for Selected Currencies for January 2021, op. cit.; Macrotrends, Amazon Research and Development Expenses 2010-2023, op. cit.
[118]. Ibid.
[119]. Ibid.
[120]. Ibid.
[121]. European Commission, EU Industrial R&D Investment Scoreboard 2013/14, 2017/18, 2021/22, op. cit.; International Monetary Fund, Representative Exchange Rate for Selected Currencies for January 2013, 2017, and 2021, op. cit.; Macrotrends, Amazon Research and Development Expenses 2010-2023, op. cit.
[122]. Ibid.
[123]. European Commission, EU Industrial R&D Investment Scoreboard 2013/14, 2017/18, 2021/22, op. cit.; The World Bank, World Development Indicators, op cit.; International Monetary Fund, Representative Exchange Rate for Selected Currencies for January 2013, 2017, and 2021, op. cit.; Macrotrends, Amazon Research and Development Expenses 2010-2023, op. cit.
[124]. Ibid.
[125]. Ibid.
[126]. FTSE Russell, Industry Classification Benchmark (ICB) Structure & Definitions, op. cit.
[127]. European Commission, EU Industrial R&D Investment Scoreboard 2021/22, op cit.
[128]. Ibid.
[129]. European Commission, EU Industrial R&D Investment Scoreboard 2021/22, op cit.; International Monetary Fund, Representative Exchange Rate for Selected Currencies for January 2021, op. cit.
[130]. Ibid.
[131]. Ibid.
[132]. Ibid.
[133]. Ibid.
[134]. European Commission, EU Industrial R&D Investment Scoreboard 2021/22, op cit.; The World Bank, World Development Indicators, op cit.; International Monetary Fund, Representative Exchange Rate for Selected Currencies for January 2021, op. cit.;
[135]. Ibid.
[136]. Ibid.
[137]. Ibid.
[138]. European Commission, EU Industrial R&D Investment Scoreboard 2013/14, 2017/18, 2021/22, op. cit.
[139]. Ibid.
[140]. Ibid.
[141]. Ibid.
[142]. European Commission, EU Industrial R&D Investment Scoreboard 2013/14, 2017/18, 2021/22, op. cit.; The World Bank, World Development Indicators, op cit.; International Monetary Fund, Representative Exchange Rate for Selected Currencies for January 2013, 2017, and 2021, op. cit.
[143]. Ibid.
[144]. Ibid.
[145]. Ibid.
[146]. FTSE Russell, Industry Classification Benchmark (ICB) Structure & Definitions, op. cit.
[147]. Ibid.
[148]. European Commission, EU Industrial R&D Investment Scoreboard 2021/22, op cit.
[149]. Ibid.
[150]. European Commission, EU Industrial R&D Investment Scoreboard 2021/22, op cit.; International Monetary Fund, Representative Exchange Rate for Selected Currencies for January 2021, op. cit.;
[151]. Ibid.
[152]. Ibid.
[153]. Ibid.
[154]. European Commission, EU Industrial R&D Investment Scoreboard 2021/22, op cit.; The World Bank, World Development Indicators, op cit.; International Monetary Fund, Representative Exchange Rate for Selected Currencies for January 2021, op. cit.;
[155]. Ibid.
[156]. Ibid.
[157]. European Commission, EU Industrial R&D Investment Scoreboard 2013/14, 2017/18, 2021/22, op. cit.
[158]. Ibid.
[159]. European Commission, EU Industrial R&D Investment Scoreboard 2013/14, 2017/18, 2021/22, op. cit.; The World Bank, World Development Indicators, op cit.; International Monetary Fund, Representative Exchange Rate for Selected Currencies for January 2013, 2017, and 2021, op. cit.
[160]. Ibid.
[161]. Ibid.
[162]. FTSE Russell, Industry Classification Benchmark (ICB) Structure & Definitions, op. cit.
[163]. Ibid.
[164]. European Commission, EU Industrial R&D Investment Scoreboard 2021/22, op cit.
[165]. Ibid.
[166]. European Commission, EU Industrial R&D Investment Scoreboard 2021/22, op cit.; International Monetary Fund, Representative Exchange Rate for Selected Currencies for January 2021, op. cit.;
[167]. Ibid.
[168]. Ibid.
[169]. Ibid.
[170]. European Commission, EU Industrial R&D Investment Scoreboard 2021/22, op cit.; The World Bank, World Development Indicators, op cit.; International Monetary Fund, Representative Exchange Rate for Selected Currencies for January 2021, op. cit.
[171]. Ibid.
[172]. Ibid.
[173]. Ibid.
[174]. European Commission, EU Industrial R&D Investment Scoreboard 2013/14, 2017/18, 2021/22, op. cit.
[175]. Ibid.
[176]. European Commission, EU Industrial R&D Investment Scoreboard 2013/14, 2017/18, 2021/22, op. cit.; The World Bank, World Development Indicators, op cit.; International Monetary Fund, Representative Exchange Rate for Selected Currencies for January 2013, 2017, and 2021, op. cit.
[177]. Ibid.
[178]. Ibid.
[179]. European Commission, EU Industrial R&D Investment Scoreboard 2021/22, op cit.
[180]. European Commission, EU Industrial R&D Investment Scoreboard 2021/22, op cit.; International Monetary Fund, Representative Exchange Rate for Selected Currencies for January 2021, op. cit.
[181]. Ibid.
[182]. Ibid.
[183]. Ibid.
[184]. Ibid.
[185]. European Commission, EU Industrial R&D Investment Scoreboard 2021/22, op cit.; The World Bank, World Development Indicators, op cit.; International Monetary Fund, Representative Exchange Rate for Selected Currencies for January 2021, op. cit.
[186]. Ibid.
[187]. Ibid.
[188]. European Commission, EU Industrial R&D Investment Scoreboard 2013/14, 2017/18, 2021/22, op. cit.
[189]. Ibid.
[190]. European Commission, EU Industrial R&D Investment Scoreboard 2013/14, 2017/18, 2021/22, op. cit.; The World Bank, World Development Indicators, op cit.; International Monetary Fund, Representative Exchange Rate for Selected Currencies for January 2013, 2017, and 2021, op. cit.
[191]. Ibid.
[192]. Ibid.
[193]. European Commission, EU Industrial R&D Investment Scoreboard 2021/22, op cit.
[194]. European Commission, EU Industrial R&D Investment Scoreboard 2021/22, op cit.; International Monetary Fund, Representative Exchange Rate for Selected Currencies for January 2021, op. cit.
[195]. Ibid.
[196]. Ibid.
[197]. Ibid.
[198]. Ibid.
[199]. European Commission, EU Industrial R&D Investment Scoreboard 2021/22, op cit.; The World Bank, World Development Indicators, op cit.; International Monetary Fund, Representative Exchange Rate for Selected Currencies for January 2021, op. cit.
[200]. Ibid.
[201]. Ibid.
[202]. Ibid.
[203]. European Commission, EU Industrial R&D Investment Scoreboard 2013/14, 2017/18, 2021/22, op. cit.
[204]. Ibid.
[205]. European Commission, EU Industrial R&D Investment Scoreboard 2013/14, 2017/18, 2021/22, op. cit.; The World Bank, World Development Indicators, op cit.; International Monetary Fund, Representative Exchange Rate for Selected Currencies for January 2013, 2017, and 2021, op. cit.
[206]. Ibid.
[207]. Ibid.
[208]. Michael E. Porter and Jan W. Rivkin, “The Looming Challenge to U.S. Competitiveness,” Harvard Business Review, March 2012, https://hbr.org/2012/03/the-looming-challenge-to-us-competitiveness.
[209]. John Lester and Jacek Warda, “Enhanced Tax Incentives for R&D Would Make Americans Richer” (ITIF, September 2020), https://www2.itif.org/2020-enhanced-tax-incentives-rd.pdf.
[210]. Government of Canada, “What are SR&ED tax incentives,” website, https://www.canada.ca/en/revenue-agency/services/scientific-research-experimental-development-tax-incentive-program/what-are-sred-tax-incentives.html.
[211]. Jodey Arrington, “Rep. Arrington introduces ALIGN Act,” press release, March 30, 2023, https://arrington.house.gov/news/documentsingle.aspx?DocumentID=962.
[212]. Maggie Hassan and Todd Young, “The American Innovation and Jobs Act,” https://www.hassan.senate.gov/imo/media/doc/Hassan-Young_American_Innovation_and_Jobs_Act_One-Pager.pdf.
[213]. Robert Atkinson, “Industry Funding of University Research: Which States Lead?” (ITIF, January 2018), https://www2.itif.org/2018-industry-funding-university-research.pdf.
[214]. European Commission, The 2021 EU Industrial R&D Investment Scoreboard, 2021, https://op.europa.eu/en/publication-detail/-/publication/02ab5f6a-c9bd-11ec-b6f4-01aa75ed71a1/language-en/format-PDF/source-257925010.
[215]. Statista, “Video and music content budget of Amazon worldwide from 2013 to 2023,” February 8, 2023, https://www-statista-com.ezproxylocal.library.nova.edu/statistics/738421/amazon-video-content-budget/.; Amazon, United States Securities and Exchange Commission Amazon.com 10K (annual filing), https://ir.aboutamazon.com/sec-filings/sec-filings-details/default.aspx?FilingId=15530776.
[216]. Ibid.
