


Latin American Subnational Innovation Competitiveness Index
For policymakers to bolster the global competitiveness of their nations and regions, they first must know where they stand. This report benchmarks the 182 regions of Brazil, Chile, Colombia, Mexico, Peru, and the United States using 13 commonly available indicators of strength in the knowledge economy, in globalization, and in innovation capacity.
KEY TAKEAWAYS
Key Takeaways
Introduction
Despite Latin America accounting for only 8 percent of the global population and 6.5 percent of global economic output, the region possesses several characteristics that will be influential in the coming decades.[1] Notably, Latin America’s role in global critical mineral reserves is remarkable. The region is responsible for 40 percent of the world’s copper production and 35 percent of lithium production, among others.[2] As the rapid expansion of green technology and the green transition relies on these critical minerals, the region stands to gain significant economic and political advantages by ensuring a reliable supply of these minerals to the global economy, thereby elevating its role in the process.[3] The countries examined in this study—Brazil, Chile, Colombia, Mexico, Peru—represent 35 percent of the region’s population and 40 percent of its economic output, and thus greatly shape the economic reality of the region.[4]
Despite being a vitally important region in the global economy, Latin America lags behind the more-developed parts of the world in terms of economic development. Most countries in the region face the risk of getting trapped in the middle-income category and struggle to advance into high-income economies. As the Information Technology and Innovation Foundation (ITIF) highlighted in a previous publication, in today’s interconnected world, the ability to maintain economic strength and international significance depends greatly on promoting innovation and embracing technological progress, which are essential to achieve growth in per-capita gross domestic product (GDP).[5] Therefore, such countries must develop their own innovation strategies to avoid the middle-income trap.
The significance of an innovation strategy for a country cannot be overstated. In the 21st century, a country’s sustained development and economic growth depend on its ability to develop and transfer knowledge and technology, enhance productivity, and foster resilience. Numerous crucial elements shape a country’s innovation ecosystem, including the quality of education and academic institutions, the level of public and private investments dedicated to research and development (R&D) and innovation, the presence of highly skilled R&D professionals, the economy’s vibrancy, and the entrepreneurial spirit. However, while more developed countries, such as the the United States, typically invest about 3 percent of GDP in R&D activities, Latin America only invests a mere 0.67 percent of GDP.[6] This low level of investment is also reflected in the fact that Latin America contributes only 2.75 percent of the world’s scientific publications on innovation, despite its more-sizeable economic and population representation.[7]
While more developed countries, such as the the United States, typically invest about 3 percent of GDP in R&D activities, Latin America only invests a mere 0.67 percent of GDP.
The Global Innovation Index (GII) is a prominent tool that provides comprehensive assessments of innovation performance on a global and regional scale. The GII offers a multidimensional perspective on innovation, evaluating factors such as R&D investments, human capital, and business sophistication, which collectively contribute to a country’s innovation capacity.[8] In line with the GII, ITIF has contributed significantly to the discourse on innovation competitiveness through its series of insightful subnational innovation competitiveness reports, which provide nuanced insights into the intricate relationships between innovation, economic development, and regional competitiveness, offering valuable perspectives for policymakers, businesses, and researchers alike. For instance, ITIF’s “State New Economy Index” report series delves into the role of innovation in driving U.S. state-level economic growth and highlights the transformation of industries through technological advancements.[9] The “North American Subnational Innovation Competitiveness (NASICI)” report delves into innovation dynamics within the North American region, emphasizing the significance of local ecosystems in enhancing competitiveness. Furthermore, the Global Trade and Innovation Policy Alliance’s (GTIPA) 2022 “Transatlantic Subnational Innovation Competitiveness (TASICI)” report examines the innovation landscapes in Europe (Germany and Italy) and North America (Canada and the United States), shedding light on the interplay between subnational entities and cross-border collaboration.[10]
However, the literature has so far lacked an analysis of innovation capacity and performance specific to the Latin American region. It is certain that the region’s innovation and economic development will have a significant impact on the global economy. Whether countries in the region can evolve and renew themselves will have consequences, as failure to do so will also carry implications. This study aims to showcase the continent’s subnational innovation capabilities, opportunities, and potential future direction through examining the innovation capacity of regions in five influential Latin American countries: Brazil, Chile, Colombia, Mexico, and Peru. The results are compared to U.S. states.
The Index
The Latin American Subnational Innovation Competitiveness Index (“LASICI”) captures the innovation performance of 182 regions across 6 countries and 2 continents: Peru (24 departments), Brazil (27 regions), Chile (16 regions), Mexico (32 states), Colombia (33 departments), and the United States (50 states). In this report, we refer to states and departments as regions to simplify the comparative analysis.
This report consists of 13 indicators representing the relevant determinants of a successful innovation ecosystem, grouped into three categories:
▪ Knowledge-Based Workforce: Indicators measure the educational attainment of the workforce; immigration of knowledge workers; employment in professional, technical, and scientific (PTS) activities; and manufacturing sector productivity.
▪ Globalization: Indicators measure high-tech exports and inward FDI.
▪ Innovation Capacity: Indicators measure a region’s share of households subscribing to broadband Internet, expenditures on R&D, the number of R&D personnel, the creation of new businesses, patent output, the extent of progress toward decarbonization, and VC investment.
The most important category of the LASICI is innovation capacity, which accounts for 56 percent of the index’s weight, while the knowledge economy indicators account for 31 percent of the index’s weight, and the globalization indicators account for the remaining 13 percent.
Results
Ranking List
Table 1: Overall and component performance of regions in LASICI
|
Overall Rank |
Overall Score |
Knowledge |
Globalization |
Innovation |
|||||
|
Country |
Regions |
Score |
Rank |
Score |
Rank |
Score |
Rank |
||
|
1 |
USA |
Massachusetts |
95.3 |
94.9 |
1 |
62.4 |
15 |
95.5 |
1 |
|
2 |
USA |
California |
90.1 |
87.2 |
5 |
56.2 |
20 |
93.1 |
2 |
|
3 |
USA |
Washington |
81.2 |
75.0 |
9 |
35.8 |
40 |
89.7 |
3 |
|
4 |
USA |
Maryland |
73.3 |
88.7 |
3 |
22.7 |
88 |
69.3 |
6 |
|
5 |
USA |
Oregon |
70.3 |
64.0 |
17 |
78.0 |
11 |
72.0 |
4 |
|
6 |
USA |
New Jersey |
70.1 |
88.0 |
4 |
31.1 |
58 |
62.9 |
10 |
|
7 |
USA |
Michigan |
66.6 |
62.7 |
21 |
48.9 |
24 |
71.4 |
5 |
|
8 |
USA |
Connecticut |
66.4 |
76.9 |
6 |
44.0 |
27 |
62.2 |
12 |
|
9 |
USA |
Delaware |
66.0 |
68.6 |
12 |
43.4 |
30 |
67.2 |
8 |
|
10 |
USA |
New Hampshire |
64.7 |
58.4 |
25 |
80.4 |
9 |
65.9 |
9 |
|
11 |
USA |
Minnesota |
63.4 |
66.9 |
14 |
52.7 |
22 |
62.6 |
11 |
|
12 |
USA |
New Mexico |
61.9 |
56.9 |
29 |
49.4 |
23 |
67.4 |
7 |
|
13 |
USA |
Colorado |
61.0 |
74.5 |
10 |
34.9 |
42 |
56.2 |
15 |
|
14 |
USA |
Illinois |
60.1 |
73.3 |
11 |
66.7 |
13 |
50.4 |
20 |
|
15 |
USA |
Texas |
59.9 |
75.5 |
8 |
84.9 |
4 |
45.7 |
25 |
|
16 |
USA |
Virginia |
58.6 |
90.2 |
2 |
30.6 |
60 |
42.3 |
28 |
|
17 |
USA |
Utah |
58.6 |
63.5 |
18 |
43.6 |
29 |
58.3 |
13 |
|
18 |
USA |
New York |
58.1 |
75.6 |
7 |
31.2 |
57 |
51.3 |
19 |
|
19 |
USA |
North Carolina |
55.2 |
66.1 |
15 |
31.8 |
52 |
52.7 |
16 |
|
20 |
USA |
Pennsylvania |
54.7 |
65.0 |
16 |
35.5 |
41 |
52.1 |
18 |
|
21 |
USA |
Arizona |
53.3 |
60.3 |
22 |
60.3 |
16 |
48.9 |
23 |
|
22 |
USA |
Idaho |
52.6 |
47.9 |
44 |
57.1 |
18 |
56.6 |
14 |
|
23 |
USA |
Wisconsin |
51.7 |
50.4 |
38 |
64.5 |
14 |
52.2 |
17 |
|
24 |
USA |
Ohio |
50.8 |
58.1 |
26 |
42.0 |
33 |
49.2 |
22 |
|
25 |
USA |
Indiana |
48.9 |
51.3 |
36 |
43.7 |
28 |
50.3 |
21 |
|
26 |
USA |
Rhode Island |
48.5 |
59.1 |
23 |
29.4 |
64 |
46.6 |
24 |
|
27 |
USA |
Missouri |
46.2 |
56.9 |
30 |
38.8 |
36 |
42.7 |
26 |
|
28 |
USA |
Kansas |
45.0 |
58.9 |
24 |
32.1 |
50 |
40.5 |
29 |
|
29 |
USA |
Georgia |
44.9 |
62.8 |
20 |
34.5 |
43 |
37.3 |
30 |
|
30 |
USA |
Florida |
44.7 |
67.2 |
13 |
42.5 |
32 |
32.6 |
36 |
|
31 |
USA |
Iowa |
42.9 |
47.5 |
46 |
45.1 |
25 |
42.6 |
27 |
|
32 |
USA |
Tennessee |
41.6 |
53.5 |
34 |
56.1 |
21 |
34.5 |
32 |
|
33 |
USA |
Vermont |
41.2 |
48.9 |
42 |
82.4 |
6 |
32.8 |
34 |
|
34 |
USA |
Nebraska |
38.3 |
55.5 |
31 |
29.4 |
63 |
32.0 |
38 |
|
35 |
USA |
South Carolina |
37.8 |
50.0 |
39 |
42.8 |
31 |
32.7 |
35 |
|
36 |
USA |
Wyoming |
37.6 |
57.4 |
28 |
12.6 |
168 |
32.2 |
37 |
|
37 |
USA |
Nevada |
37.3 |
54.6 |
32 |
37.6 |
39 |
29.7 |
41 |
|
38 |
USA |
North Dakota |
37.0 |
46.4 |
48 |
38.3 |
37 |
34.5 |
33 |
|
39 |
USA |
Alabama |
36.3 |
47.7 |
45 |
18.5 |
113 |
35.7 |
31 |
|
40 |
USA |
Maine |
36.1 |
50.4 |
37 |
38.0 |
38 |
30.4 |
39 |
|
41 |
USA |
Kentucky |
36.0 |
46.2 |
49 |
56.4 |
19 |
30.0 |
40 |
|
42 |
USA |
Louisiana |
34.5 |
63.2 |
19 |
15.3 |
152 |
22.6 |
57 |
|
43 |
USA |
Oklahoma |
33.1 |
47.1 |
47 |
32.9 |
47 |
28.4 |
43 |
|
44 |
USA |
Montana |
32.6 |
49.4 |
41 |
13.4 |
164 |
29.1 |
42 |
|
45 |
USA |
Hawaii |
31.0 |
52.6 |
35 |
7.2 |
179 |
25.3 |
49 |
|
46 |
USA |
Arkansas |
29.5 |
44.6 |
50 |
24.1 |
81 |
25.5 |
47 |
|
47 |
USA |
South Dakota |
28.3 |
39.2 |
55 |
27.4 |
74 |
26.7 |
46 |
|
48 |
Mexico |
Mexico City |
28.2 |
58.0 |
27 |
21.8 |
90 |
14.6 |
104 |
|
49 |
Brazil |
São Paulo |
27.9 |
19.9 |
133 |
95.2 |
1 |
28.0 |
44 |
|
50 |
USA |
West Virginia |
27.1 |
43.8 |
52 |
28.8 |
68 |
21.3 |
65 |
|
51 |
Peru |
Lima |
27.0 |
54.0 |
33 |
25.1 |
79 |
14.8 |
101 |
|
52 |
USA |
Mississippi |
26.7 |
34.0 |
67 |
44.8 |
26 |
24.7 |
53 |
|
53 |
USA |
Alaska |
26.5 |
44.1 |
51 |
13.5 |
163 |
22.5 |
58 |
|
54 |
Colombia |
Bogotá |
23.7 |
35.2 |
65 |
17.2 |
120 |
23.3 |
55 |
|
55 |
Peru |
Arequipa |
23.7 |
48.9 |
43 |
28.6 |
70 |
12.2 |
131 |
|
56 |
Mexico |
Nuevo León |
23.5 |
49.6 |
40 |
19.5 |
109 |
12.9 |
120 |
|
57 |
Brazil |
Rio de Janeiro |
23.1 |
17.8 |
143 |
79.6 |
10 |
24.0 |
54 |
|
58 |
Brazil |
Paraná |
23.0 |
14.3 |
152 |
85.9 |
3 |
25.2 |
50 |
|
59 |
Brazil |
Minas Gerais |
21.9 |
15.2 |
150 |
83.9 |
5 |
23.0 |
56 |
|
60 |
Chile |
Santiago |
21.8 |
33.7 |
69 |
19.8 |
93 |
20.7 |
70 |
|
61 |
Brazil |
Santa Catarina |
21.4 |
16.8 |
146 |
41.3 |
35 |
27.9 |
45 |
|
62 |
Brazil |
Rio Grande do Sul |
20.6 |
14.5 |
151 |
59.1 |
17 |
25.3 |
48 |
|
63 |
Mexico |
Querétaro |
20.3 |
41.9 |
53 |
21.2 |
91 |
12.3 |
129 |
|
64 |
Brazil |
Espírito Santo |
20.2 |
13.0 |
156 |
81.7 |
7 |
22.0 |
61 |
|
65 |
Colombia |
Antioquia |
20.1 |
29.7 |
84 |
17.7 |
117 |
20.9 |
68 |
|
66 |
Colombia |
Vaupés |
19.6 |
23.3 |
115 |
15.5 |
143 |
24.8 |
52 |
|
67 |
Peru |
Ica |
19.0 |
40.8 |
54 |
41.8 |
34 |
7.7 |
174 |
|
68 |
Mexico |
Sonora |
18.9 |
35.9 |
61 |
12.4 |
170 |
15.5 |
98 |
|
69 |
Brazil |
Distrito Federal |
18.8 |
23.2 |
117 |
7.0 |
180 |
24.9 |
51 |
|
70 |
Colombia |
Santander |
18.7 |
27.2 |
96 |
16.6 |
125 |
20.4 |
72 |
|
71 |
Colombia |
Atlántico |
18.3 |
27.7 |
92 |
17.4 |
118 |
19.2 |
78 |
|
72 |
Mexico |
Coahuila |
18.3 |
38.0 |
56 |
18.9 |
112 |
12.0 |
133 |
|
73 |
Colombia |
Amazonas |
18.3 |
31.3 |
76 |
15.5 |
143 |
17.1 |
86 |
|
74 |
Colombia |
Caldas |
18.1 |
26.9 |
98 |
16.3 |
126 |
19.7 |
77 |
|
75 |
Mexico |
Quintana Roo |
18.1 |
33.7 |
68 |
19.0 |
111 |
14.6 |
105 |
|
76 |
Peru |
Moquegua |
18.0 |
36.9 |
58 |
27.3 |
75 |
10.9 |
143 |
|
77 |
Chile |
Los Ríos |
17.6 |
24.1 |
106 |
19.8 |
93 |
20.2 |
75 |
|
78 |
Mexico |
Aguascalientes |
17.6 |
35.5 |
63 |
17.0 |
122 |
12.8 |
122 |
|
79 |
Colombia |
Cundinamarca |
17.4 |
28.2 |
88 |
16.2 |
127 |
17.6 |
84 |
|
80 |
Colombia |
San Andrés y Providencia |
17.3 |
31.3 |
76 |
18.2 |
116 |
15.1 |
99 |
|
81 |
Brazil |
Pernambuco |
17.3 |
10.6 |
166 |
66.7 |
12 |
21.1 |
67 |
|
82 |
Colombia |
Quindío |
17.1 |
23.6 |
110 |
15.5 |
135 |
20.3 |
73 |
|
83 |
Chile |
Antofagasta |
17.0 |
30.5 |
80 |
19.8 |
93 |
14.9 |
100 |
|
84 |
Chile |
Tarapacá |
17.0 |
32.3 |
71 |
19.8 |
93 |
13.6 |
110 |
|
85 |
Colombia |
Norte de Santander |
17.0 |
28.4 |
87 |
15.9 |
130 |
16.8 |
89 |
|
86 |
Colombia |
Risaralda |
16.9 |
27.1 |
97 |
16.0 |
129 |
17.6 |
85 |
|
87 |
Mexico |
Jalisco |
16.9 |
35.5 |
62 |
14.5 |
158 |
12.1 |
132 |
|
88 |
Mexico |
Baja California |
16.6 |
32.3 |
72 |
17.1 |
121 |
13.3 |
115 |
|
89 |
Chile |
Magallanes |
16.5 |
28.0 |
90 |
19.8 |
93 |
15.7 |
97 |
|
90 |
Chile |
Ñuble |
16.5 |
24.2 |
104 |
19.8 |
93 |
18.2 |
80 |
|
91 |
Mexico |
Chihuahua |
16.0 |
32.7 |
70 |
19.3 |
110 |
11.7 |
139 |
|
92 |
Colombia |
Valle del Cauca |
15.9 |
23.4 |
112 |
16.9 |
124 |
18.1 |
81 |
|
93 |
Peru |
Tumbes |
15.8 |
35.9 |
59 |
31.4 |
54 |
7.3 |
178 |
|
94 |
Colombia |
Boyacá |
15.8 |
20.9 |
129 |
15.5 |
140 |
20.0 |
76 |
|
95 |
Peru |
Lambayeque |
15.8 |
34.6 |
66 |
26.8 |
76 |
8.9 |
162 |
|
96 |
Peru |
Tacna |
15.8 |
35.9 |
60 |
25.4 |
78 |
8.2 |
168 |
|
97 |
Peru |
La Libertad |
15.7 |
37.0 |
57 |
23.2 |
86 |
7.7 |
175 |
|
98 |
Colombia |
Guainía |
15.5 |
31.3 |
76 |
15.5 |
143 |
12.5 |
125 |
|
99 |
Colombia |
Casanare |
15.2 |
31.3 |
76 |
16.2 |
128 |
11.8 |
137 |
|
100 |
Brazil |
Ceará |
15.0 |
13.7 |
154 |
29.7 |
61 |
21.2 |
66 |
|
101 |
Colombia |
Meta |
14.9 |
23.0 |
119 |
15.5 |
143 |
17.0 |
87 |
|
102 |
Mexico |
Baja California Sur |
14.9 |
27.6 |
93 |
24.1 |
80 |
12.5 |
126 |
|
103 |
Peru |
Cusco |
14.8 |
27.9 |
91 |
26.3 |
77 |
11.9 |
135 |
|
104 |
Chile |
Valparaíso |
14.8 |
23.4 |
114 |
19.8 |
93 |
16.0 |
93 |
|
105 |
Peru |
Áncash |
14.8 |
35.5 |
64 |
20.2 |
92 |
7.6 |
176 |
|
106 |
Peru |
Junín |
14.6 |
29.8 |
82 |
22.6 |
89 |
10.9 |
144 |
|
107 |
Mexico |
Morelos |
14.6 |
28.5 |
86 |
23.5 |
85 |
11.6 |
140 |
|
108 |
Colombia |
Guaviare |
14.6 |
31.3 |
76 |
15.5 |
143 |
10.9 |
142 |
|
109 |
Colombia |
Putumayo |
14.5 |
31.3 |
76 |
15.5 |
143 |
10.8 |
146 |
|
110 |
Chile |
Arica y Parinacota |
14.5 |
21.5 |
127 |
19.8 |
93 |
16.6 |
90 |
|
111 |
Brazil |
Goiás |
14.4 |
10.8 |
165 |
32.8 |
48 |
21.6 |
63 |
|
112 |
Colombia |
Arauca |
14.4 |
31.3 |
76 |
15.6 |
133 |
10.5 |
149 |
|
113 |
Mexico |
Mexico |
14.2 |
30.1 |
81 |
17.3 |
119 |
10.7 |
147 |
|
114 |
Chile |
Bío-Bío |
14.1 |
23.4 |
113 |
19.8 |
93 |
14.8 |
102 |
|
115 |
Brazil |
Mato Grosso do Sul |
13.9 |
11.7 |
160 |
28.8 |
69 |
20.8 |
69 |
|
116 |
Mexico |
Colima |
13.7 |
26.5 |
99 |
10.8 |
175 |
13.5 |
113 |
|
117 |
Brazil |
Amazonas |
13.7 |
7.6 |
173 |
93.3 |
2 |
12.8 |
121 |
|
118 |
Colombia |
Cesar |
13.5 |
19.7 |
137 |
15.5 |
136 |
16.9 |
88 |
|
119 |
Mexico |
Tamaulipas |
13.5 |
27.6 |
94 |
22.7 |
87 |
10.4 |
150 |
|
120 |
Chile |
Aysen |
13.5 |
22.2 |
124 |
19.8 |
93 |
14.6 |
106 |
|
121 |
Colombia |
Magdalena |
13.4 |
18.3 |
141 |
15.8 |
131 |
17.7 |
83 |
|
122 |
Peru |
Ayacucho |
13.4 |
28.2 |
89 |
32.4 |
49 |
8.3 |
167 |
|
123 |
Colombia |
Bolívar |
13.3 |
20.5 |
131 |
17.0 |
123 |
15.9 |
95 |
|
124 |
Brazil |
Maranhão |
13.2 |
5.1 |
182 |
80.7 |
8 |
15.9 |
96 |
|
125 |
Chile |
Los Lagos |
13.2 |
23.0 |
120 |
19.8 |
93 |
13.5 |
111 |
|
126 |
Chile |
Maule |
13.2 |
23.7 |
109 |
19.8 |
93 |
13.0 |
118 |
|
127 |
Mexico |
Yucatán |
13.1 |
27.3 |
95 |
11.8 |
173 |
11.7 |
138 |
|
128 |
Mexico |
San Luis Potosí |
13.1 |
28.5 |
85 |
18.2 |
115 |
9.8 |
158 |
|
129 |
Brazil |
Sergipe |
12.8 |
7.4 |
174 |
29.0 |
67 |
22.0 |
60 |
|
130 |
Mexico |
Sinaloa |
12.7 |
26.0 |
100 |
12.0 |
171 |
11.8 |
136 |
|
131 |
Mexico |
Puebla |
12.5 |
24.4 |
103 |
23.8 |
84 |
10.8 |
145 |
|
132 |
Brazil |
Bahia |
12.5 |
8.1 |
172 |
33.4 |
45 |
20.2 |
74 |
|
133 |
Peru |
Loreto |
12.0 |
29.7 |
83 |
14.5 |
157 |
7.8 |
173 |
|
134 |
Colombia |
Tolima |
12.0 |
17.0 |
145 |
15.5 |
138 |
16.2 |
92 |
|
135 |
Colombia |
Huila |
11.9 |
16.5 |
147 |
15.5 |
141 |
16.5 |
91 |
|
136 |
Brazil |
Paraíba |
11.9 |
6.8 |
177 |
18.4 |
114 |
22.5 |
59 |
|
137 |
Mexico |
Guanajuato |
11.8 |
25.8 |
101 |
13.6 |
162 |
10.2 |
155 |
|
138 |
Chile |
Araucanía |
11.7 |
19.8 |
136 |
19.8 |
93 |
13.2 |
116 |
|
139 |
Peru |
Piura |
11.7 |
24.6 |
102 |
31.5 |
53 |
7.9 |
171 |
|
140 |
Chile |
O’Higgins |
11.5 |
19.9 |
135 |
19.8 |
93 |
12.8 |
124 |
|
141 |
Peru |
San Martín |
11.4 |
23.5 |
111 |
29.4 |
65 |
8.6 |
164 |
|
142 |
Peru |
Huánuco |
11.2 |
22.2 |
123 |
31.4 |
56 |
8.9 |
161 |
|
143 |
Mexico |
Tabasco |
11.2 |
24.0 |
108 |
14.5 |
156 |
10.3 |
154 |
|
144 |
Brazil |
Rio Grande do Norte |
11.2 |
7.3 |
175 |
14.3 |
160 |
21.7 |
62 |
|
145 |
Chile |
Coquimbo |
11.1 |
19.5 |
138 |
19.8 |
93 |
12.4 |
128 |
|
146 |
Peru |
Ucayali |
11.1 |
23.2 |
118 |
28.1 |
71 |
8.5 |
165 |
|
147 |
Peru |
Amazonas |
11.0 |
21.4 |
128 |
33.3 |
46 |
8.8 |
163 |
|
148 |
Brazil |
Mato Grosso |
11.0 |
12.0 |
159 |
28.0 |
73 |
15.9 |
94 |
|
149 |
Peru |
Apurímac |
10.8 |
20.8 |
130 |
28.0 |
72 |
9.6 |
159 |
|
150 |
Mexico |
Zacatecas |
10.7 |
18.1 |
142 |
29.3 |
66 |
11.1 |
141 |
|
151 |
Mexico |
Veracruz |
10.6 |
22.9 |
121 |
15.0 |
154 |
10.1 |
156 |
|
152 |
Peru |
Puno |
10.5 |
24.1 |
107 |
31.9 |
51 |
6.2 |
180 |
|
153 |
Colombia |
Cauca |
10.4 |
15.3 |
149 |
15.5 |
137 |
14.7 |
103 |
|
154 |
Brazil |
Piauí |
10.3 |
6.0 |
178 |
31.4 |
55 |
18.3 |
79 |
|
155 |
Mexico |
Durango |
10.2 |
21.8 |
125 |
12.9 |
167 |
10.4 |
153 |
|
156 |
Peru |
Cajamarca |
10.1 |
21.8 |
126 |
34.0 |
44 |
6.8 |
179 |
|
157 |
Mexico |
Hidalgo |
10.0 |
24.2 |
105 |
13.3 |
165 |
8.4 |
166 |
|
158 |
Mexico |
Tlaxcala |
9.9 |
18.5 |
140 |
24.0 |
82 |
10.4 |
152 |
|
159 |
Mexico |
Campeche |
9.8 |
22.8 |
122 |
10.6 |
176 |
9.5 |
160 |
|
160 |
Brazil |
Amapá |
9.8 |
5.2 |
181 |
14.8 |
155 |
20.6 |
71 |
|
161 |
Brazil |
Alagoas |
9.7 |
5.4 |
180 |
9.0 |
178 |
21.3 |
64 |
|
162 |
Chile |
Atacama |
9.5 |
19.1 |
139 |
19.8 |
93 |
10.0 |
157 |
|
163 |
Peru |
Madre de Dios |
9.2 |
19.9 |
134 |
29.5 |
62 |
7.3 |
177 |
|
164 |
Brazil |
Tocantins |
9.1 |
8.2 |
171 |
11.6 |
174 |
17.9 |
82 |
|
165 |
Colombia |
Sucre |
8.8 |
12.6 |
157 |
15.5 |
142 |
13.8 |
109 |
|
166 |
Mexico |
Nayarit |
8.8 |
17.4 |
144 |
15.1 |
153 |
10.6 |
148 |
|
167 |
Colombia |
Córdoba |
8.5 |
11.1 |
163 |
15.5 |
143 |
14.4 |
108 |
|
168 |
Colombia |
Nariño |
8.2 |
10.2 |
167 |
15.7 |
132 |
14.4 |
107 |
|
169 |
Colombia |
Caquetá |
8.1 |
11.5 |
161 |
15.5 |
143 |
13.4 |
114 |
|
170 |
Peru |
Pasco |
8.0 |
20.4 |
132 |
23.8 |
83 |
5.9 |
181 |
|
171 |
Colombia |
La Guajira |
7.9 |
10.9 |
164 |
15.6 |
134 |
13.5 |
112 |
|
172 |
Mexico |
Michoacán de Ocampo |
7.9 |
16.2 |
148 |
12.0 |
172 |
10.4 |
151 |
|
173 |
Peru |
Huancavelica |
7.7 |
9.1 |
168 |
31.0 |
59 |
11.9 |
134 |
|
174 |
Colombia |
Vichada |
7.5 |
23.3 |
116 |
15.5 |
139 |
4.5 |
182 |
|
175 |
Colombia |
Chocó |
7.3 |
11.3 |
162 |
15.5 |
143 |
12.2 |
130 |
|
176 |
Brazil |
Rondônia |
6.5 |
8.9 |
169 |
12.4 |
169 |
13.1 |
117 |
|
177 |
Brazil |
Pará |
5.7 |
7.3 |
176 |
14.5 |
159 |
12.4 |
127 |
|
178 |
Brazil |
Acre |
5.4 |
8.4 |
170 |
4.8 |
182 |
12.8 |
123 |
|
179 |
Mexico |
Oaxaca |
5.4 |
14.2 |
153 |
10.0 |
177 |
7.9 |
170 |
|
180 |
Mexico |
Chiapas |
5.3 |
13.2 |
155 |
13.2 |
166 |
8.0 |
169 |
|
181 |
Mexico |
Guerrero |
4.9 |
12.1 |
158 |
14.0 |
161 |
7.8 |
172 |
|
182 |
Brazil |
Roraima |
4.7 |
5.9 |
179 |
6.1 |
181 |
13.0 |
119 |
Index Scores
Overall
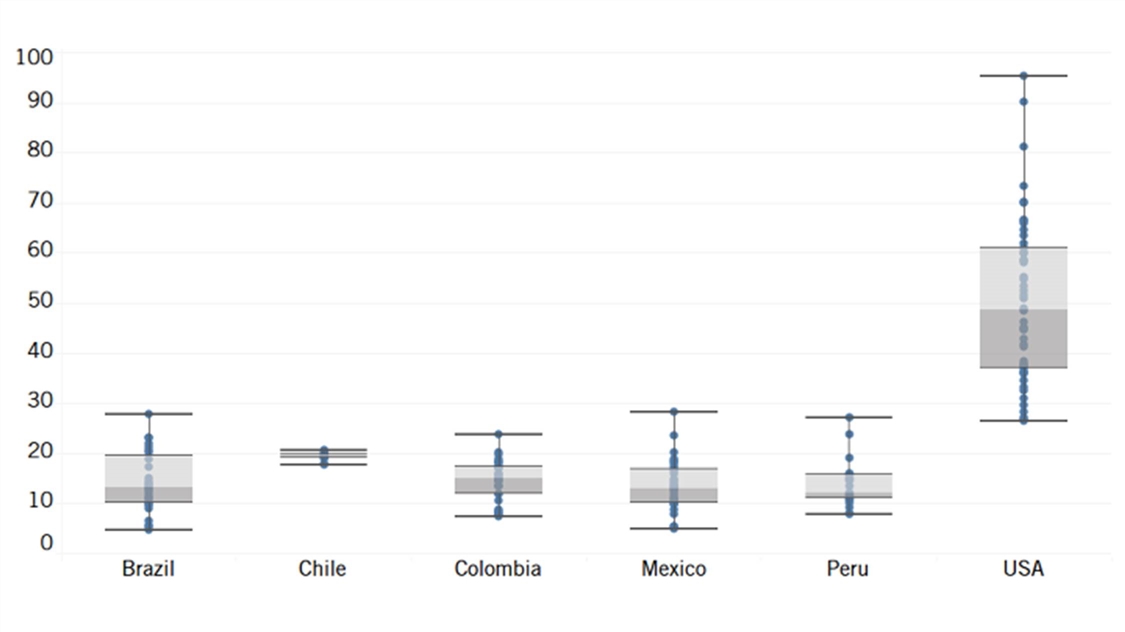
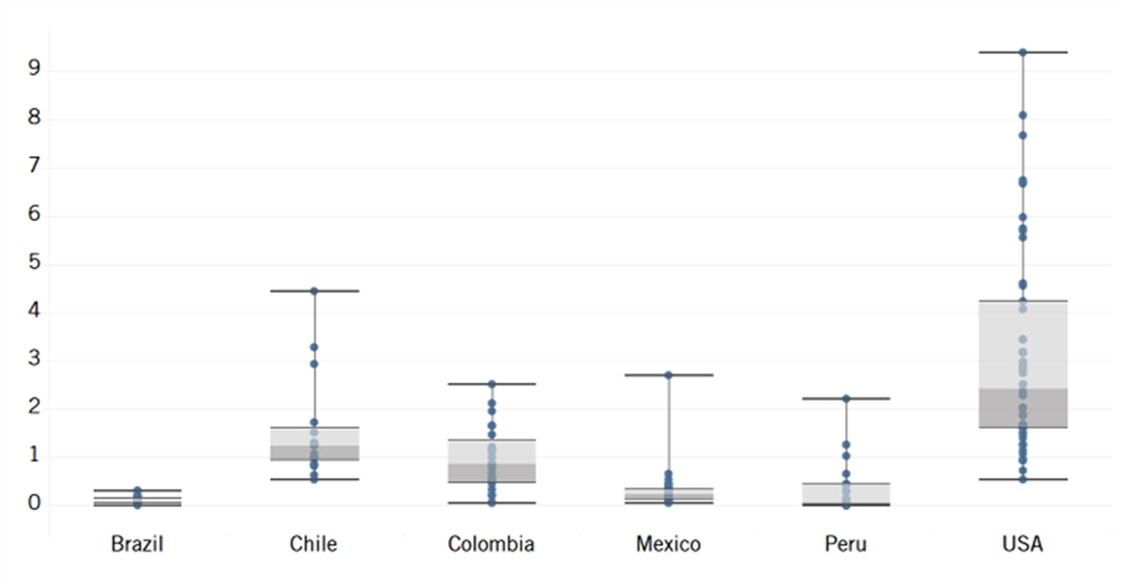
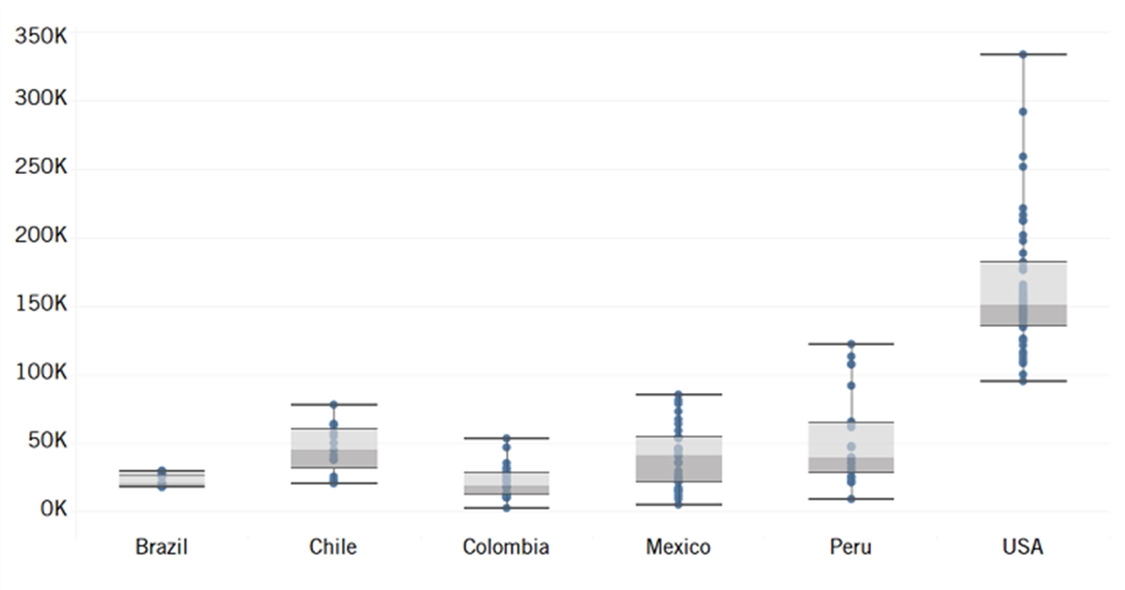
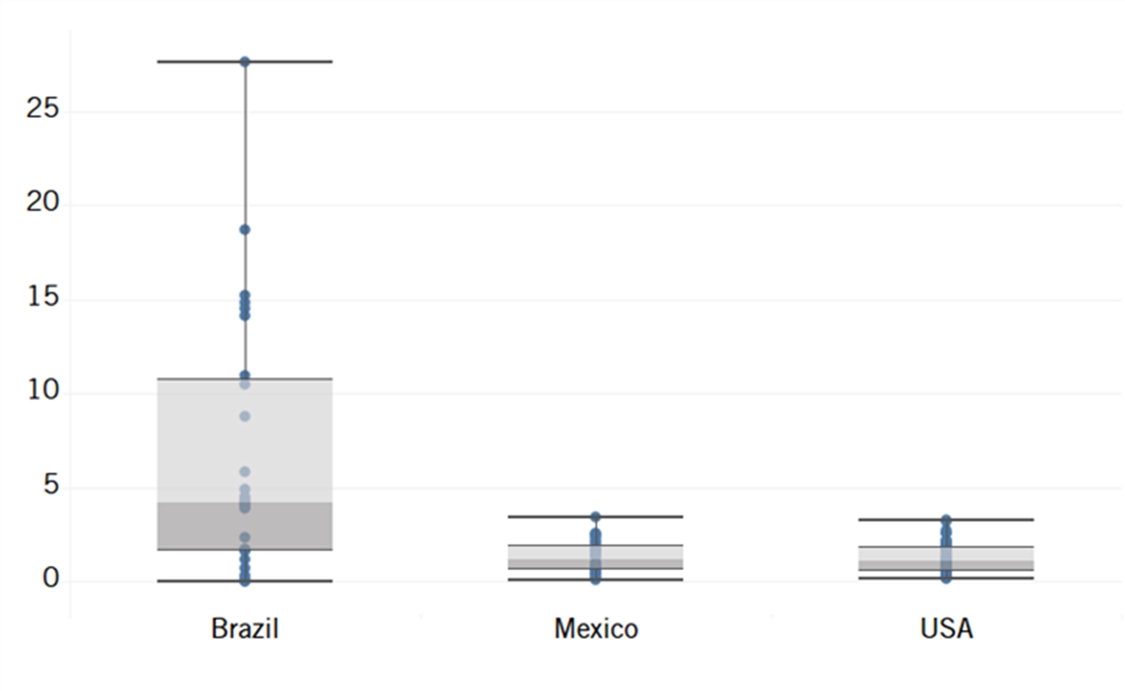
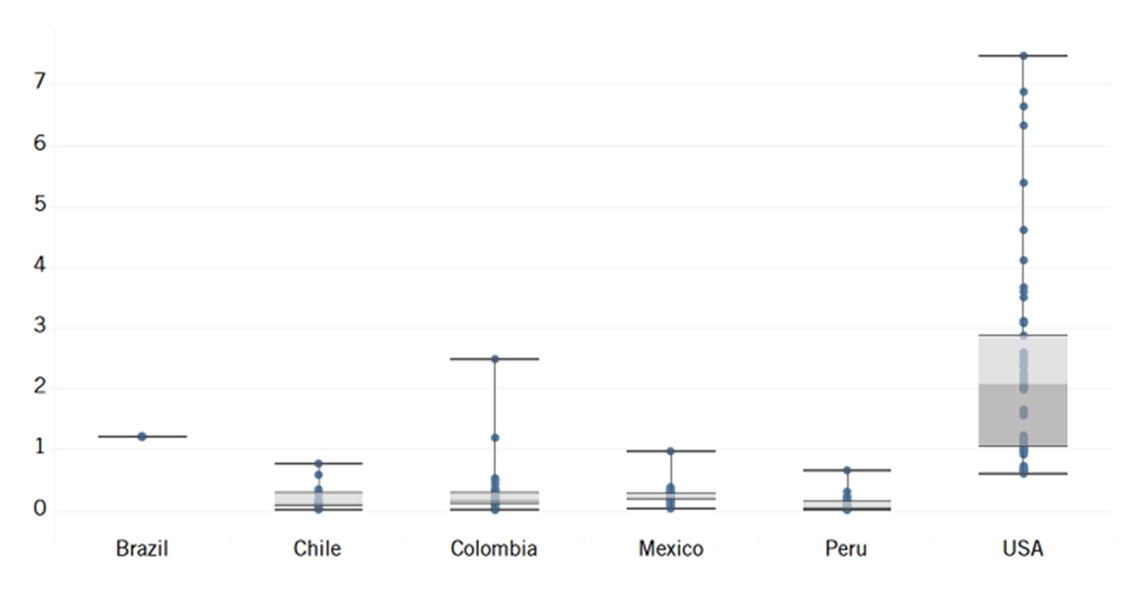
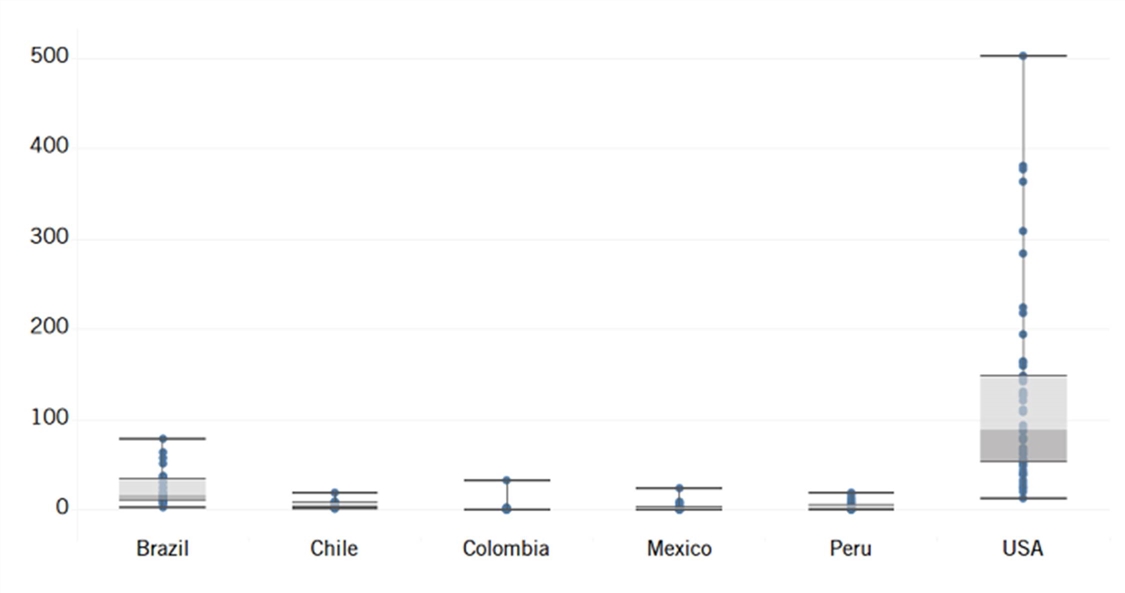
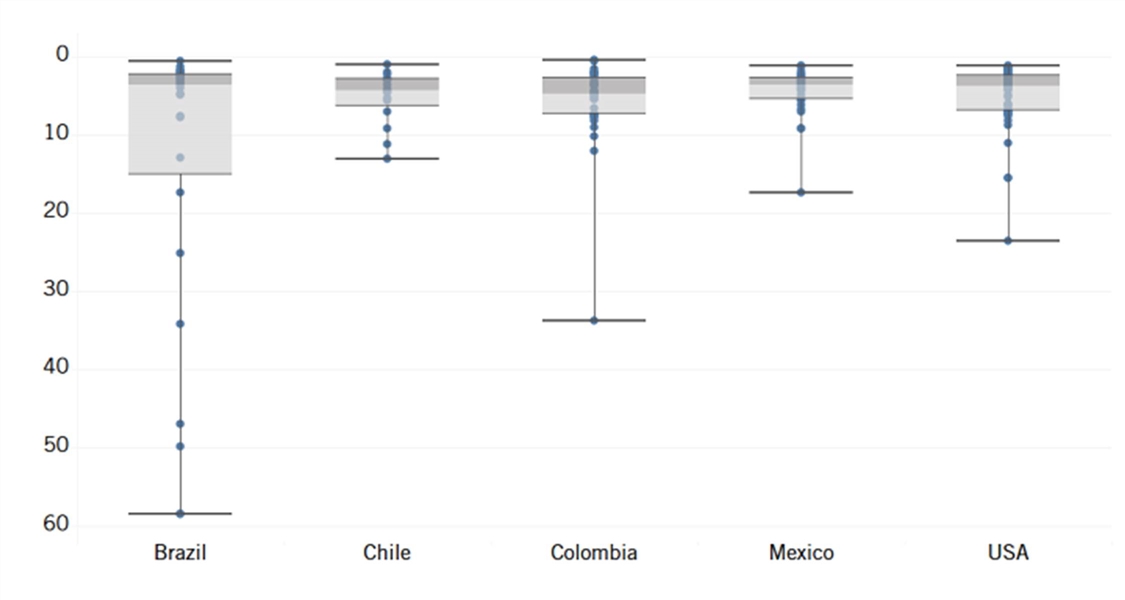
American states lead in this index of subnational innovation competitiveness, with 47 of its 50 states ranked higher than Mexico City, which is the best-performing region in Latin America (see Figure 1). Compared to the United States, the Latin American countries in this study have much less regional variation in their scores. The difference between the maximum and the minimum subnational innovation competitiveness score is the smallest in Chile, and a handful of the very-best-performing regions in Brazil, Mexico, and Peru rank higher than three U.S. states.
Figure 1: Maximum, minimum, quartiles, and median of overall subnational innovation competitiveness scores by country (dots denote the regions)[11]
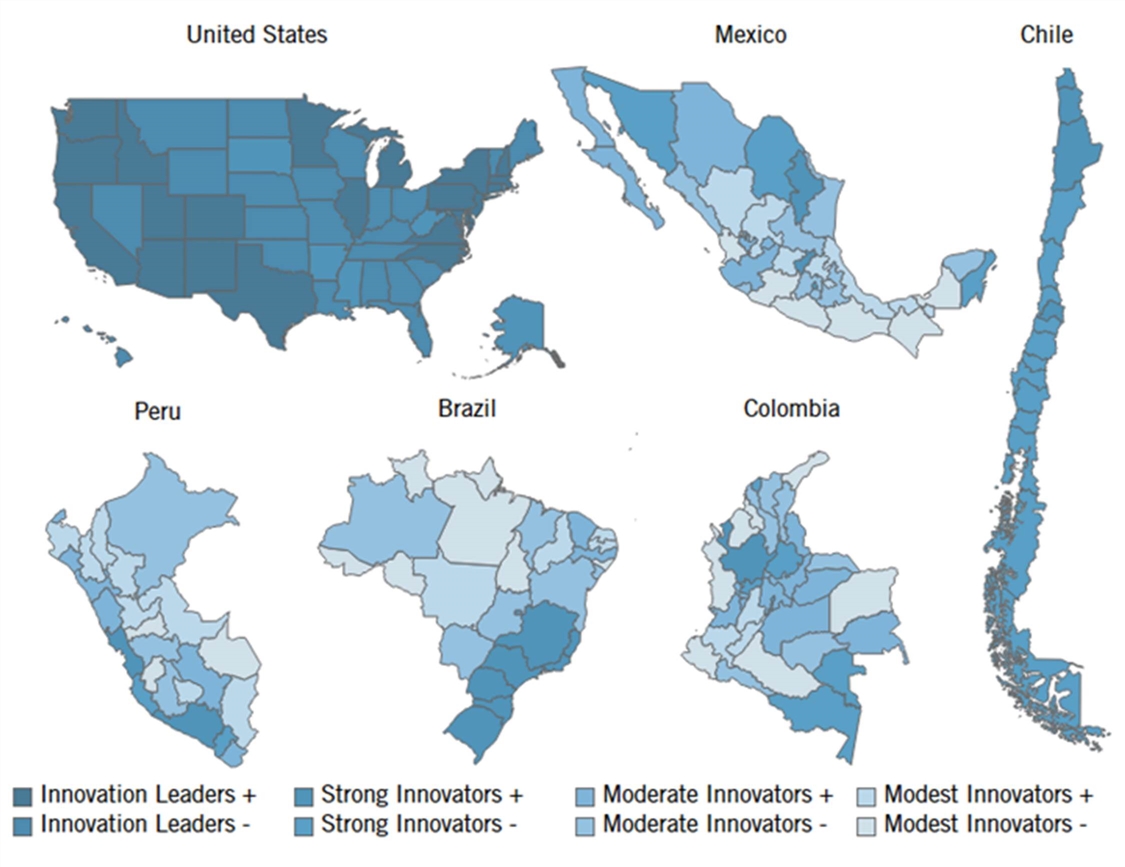
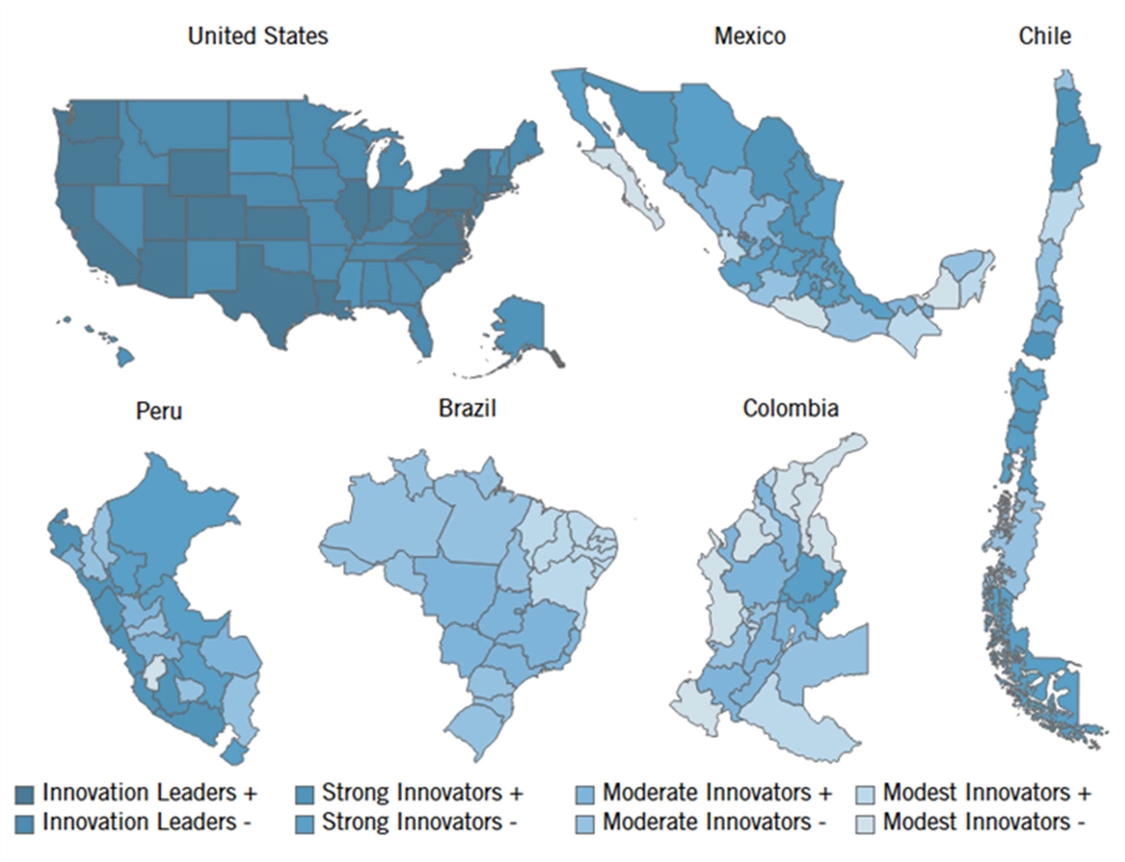
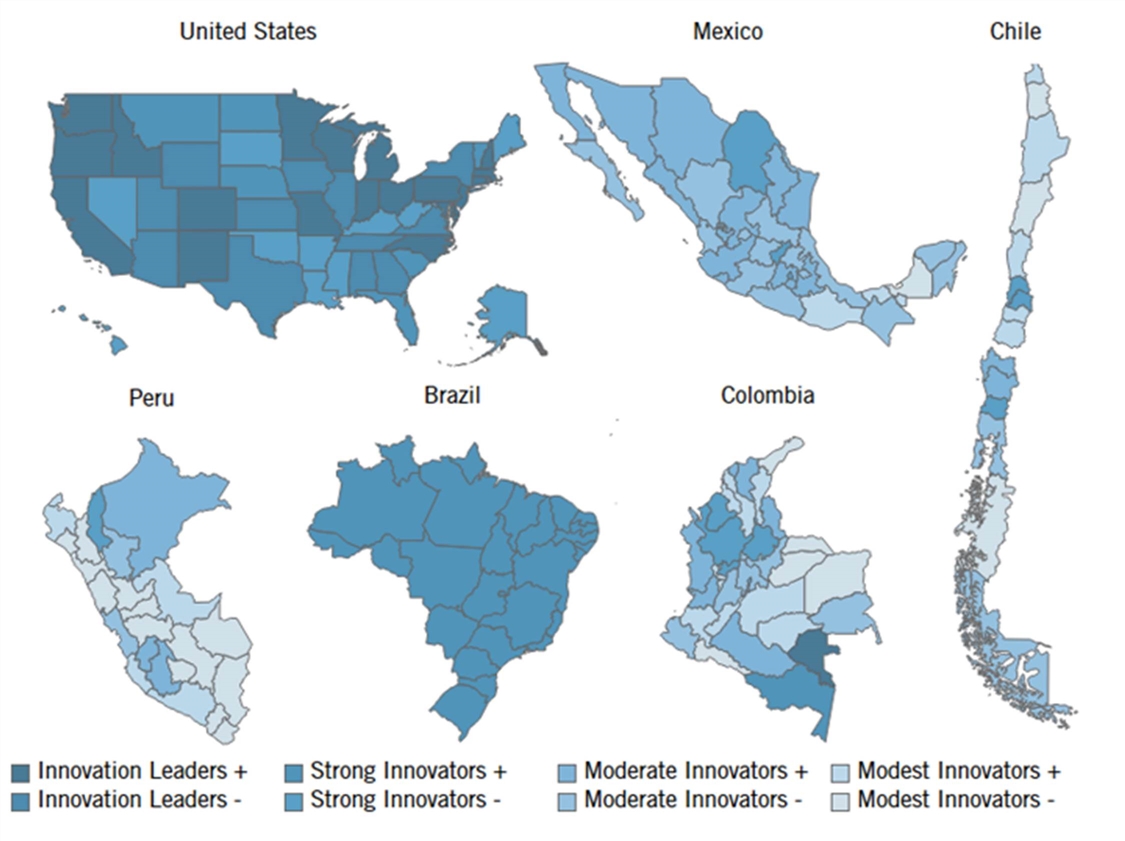
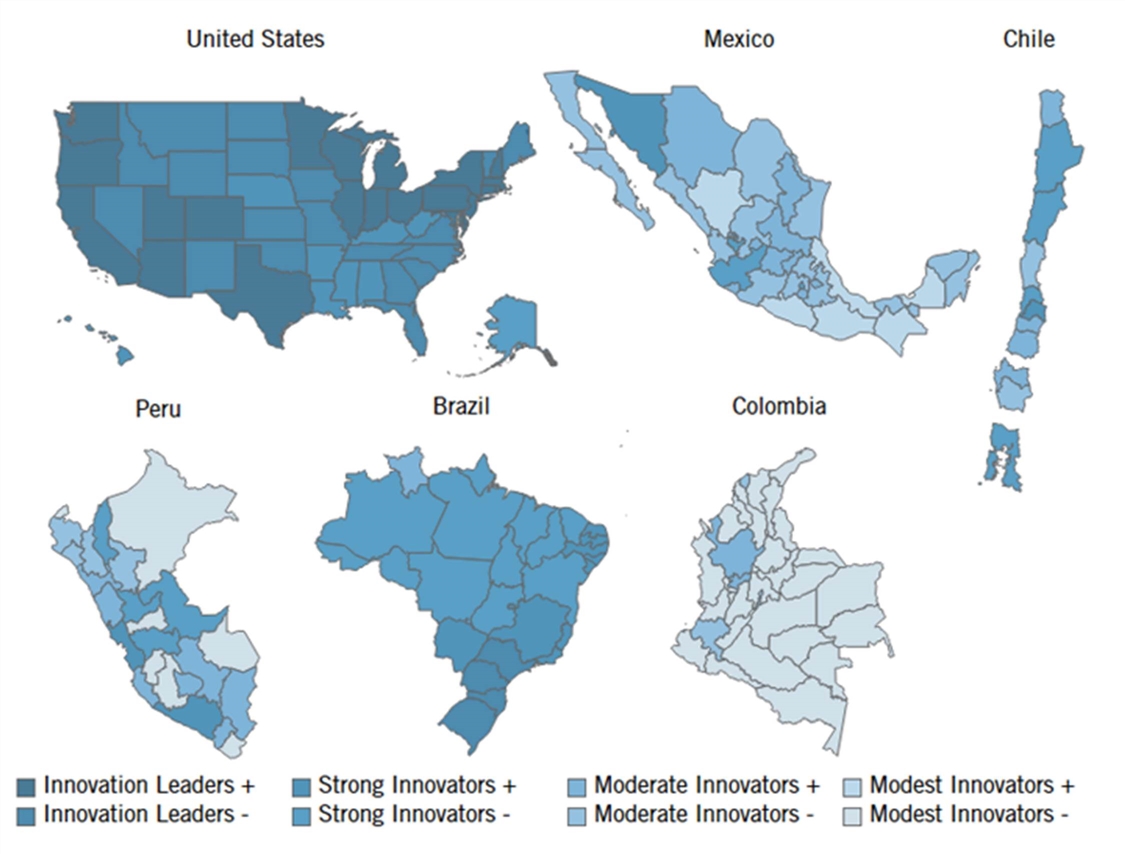
Regions were sorted into eight innovation competitiveness categories: modest innovator -, modest innovator +, moderate innovator -, moderate innovator +, strong innovator -, strong innovator +, innovation leader -, and innovation leader+ based on the regions’ positions in the ranking. The number of regions in each category was selected to be 23 to place an equal number of regions in each category given that there are 182 regions in total.[12] The minus sign in the name of the category indicates that its regions fall into a lower category than those regions that are in the respective category with a positive sign. As the colors of the charts indicate, the categories’ ascending order is modest innovator, moderate innovator, strong innovator, and innovation leader, in line with the rankings in the European Innovation Scorecard.
American states lead in this index of subnational innovation competitiveness, with 47 of its 50 states ranked higher than Mexico City, which is the best-performing region in Latin America.
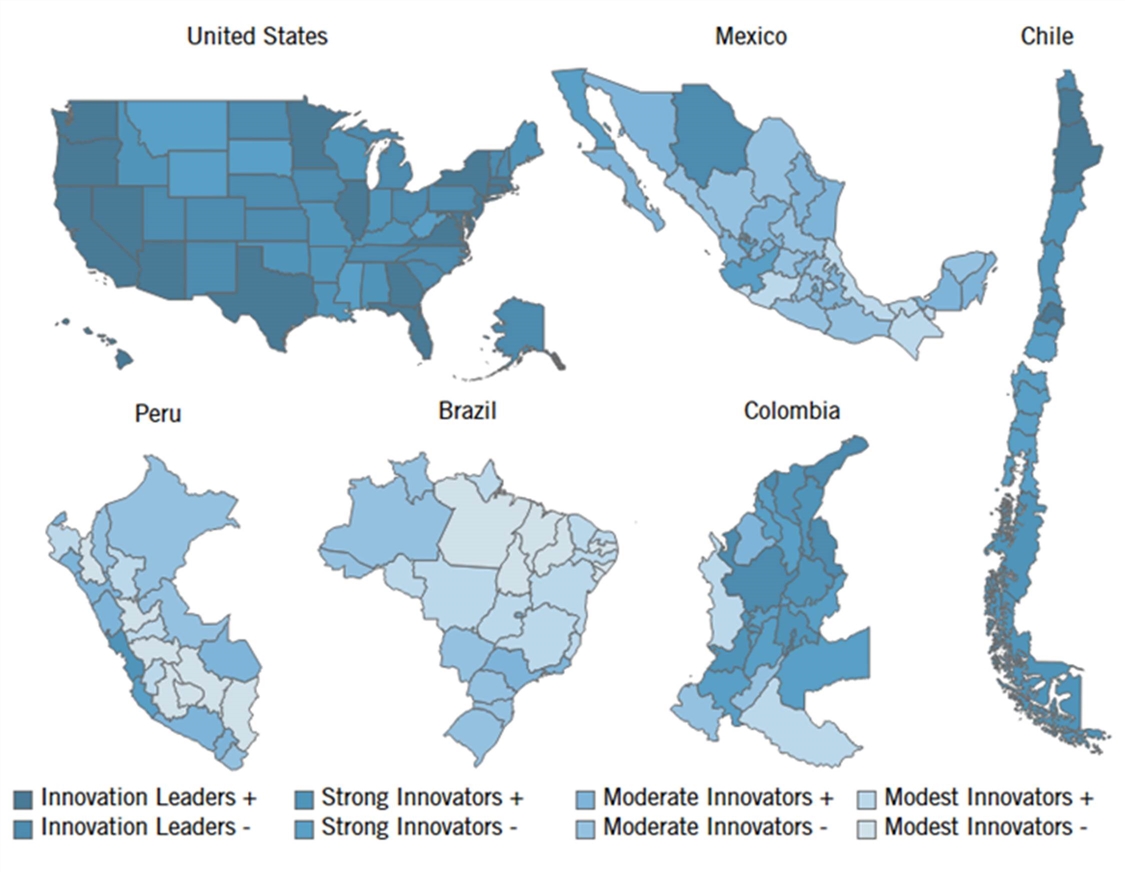
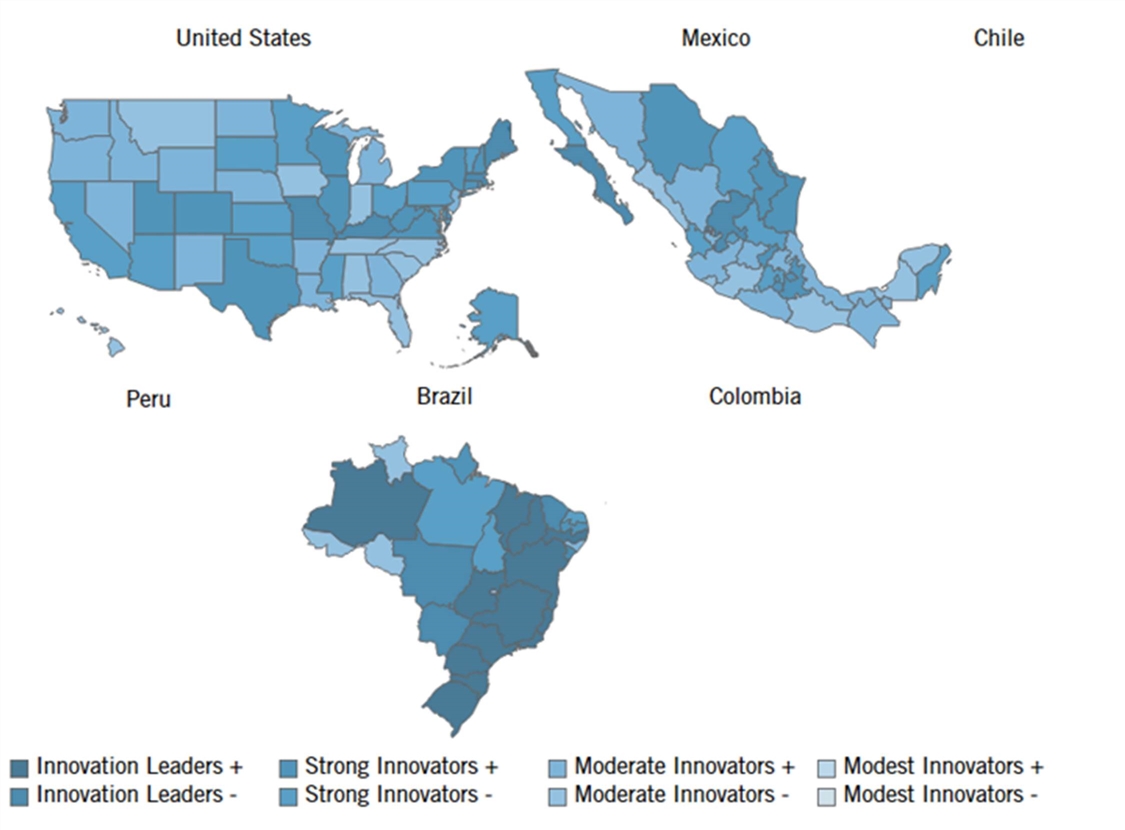
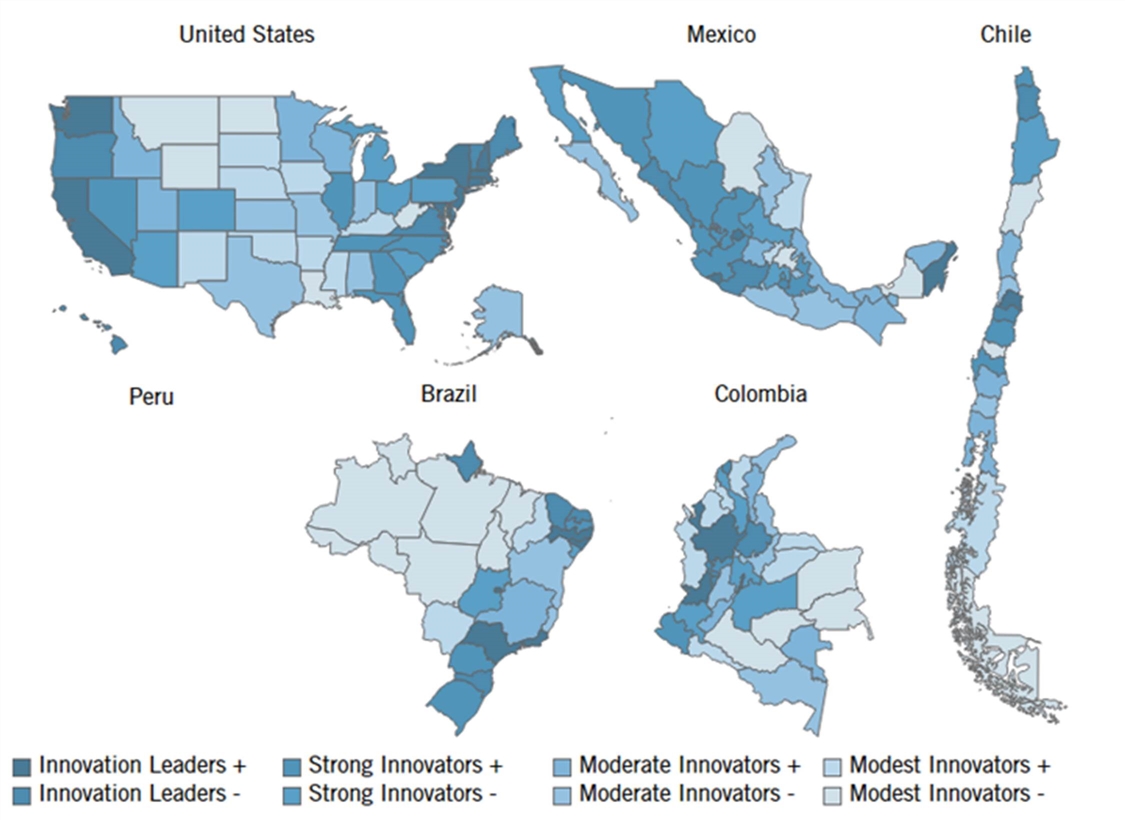
The east and west coasts of the United States exhibit strong innovation performance, while states in the middle of the country are lagging modest innovators, such as West Virginia or South Dakota (see Figure 2). The United States scores diversely as it has states in all eight innovation categories. Colombia’s best-performing regions are Bogotá and Antioquia. The strong innovator regions in Colombia are Bogotá and Antioquia. In Chile, the strong innovator regions are Santiago and Antofagasta. Many Mexican regions fall in the moderate or modest innovators category; however, Mexico City and Nuevo León are strong innovators due to their globalized economy and strong innovation capacity. Peru’s strong innovator regions are Arequipa and Lima, while the region of Ica is only a moderate innovator. Brazil’s strong innovator regions are Rio de Janeiro and São Paulo, while the region of Ceará is only a moderate innovator.
Figure 2: Overall SASICI subnational innovation competitiveness scores[13]
Knowledge Economy
Highly Educated Population
Why is this important? This indicator measures the share of a region’s 25–64-year-old (“prime age”) population with a bachelor’s degree (or equivalent) or higher. Education provides citizens with the skills and knowledge necessary to compete and innovate in the modern economy. While more time spent in school does not necessarily guarantee sufficient applied skills to compete in the modern global innovation economy—for example, the Council for Aid to Education found that 44 percent of current U.S. university graduates are not proficient in essential career skills—the proportion of highly educated residents remains a strong indicator of human capital.[14] Moreover, evidence suggests that more educated individuals are more likely and willing to adopt new technological innovations.[15]
Figure 3: Share of the 25–64-year-old population with a bachelor’s degree (or equivalent) or higher, 2019 (%)[16]
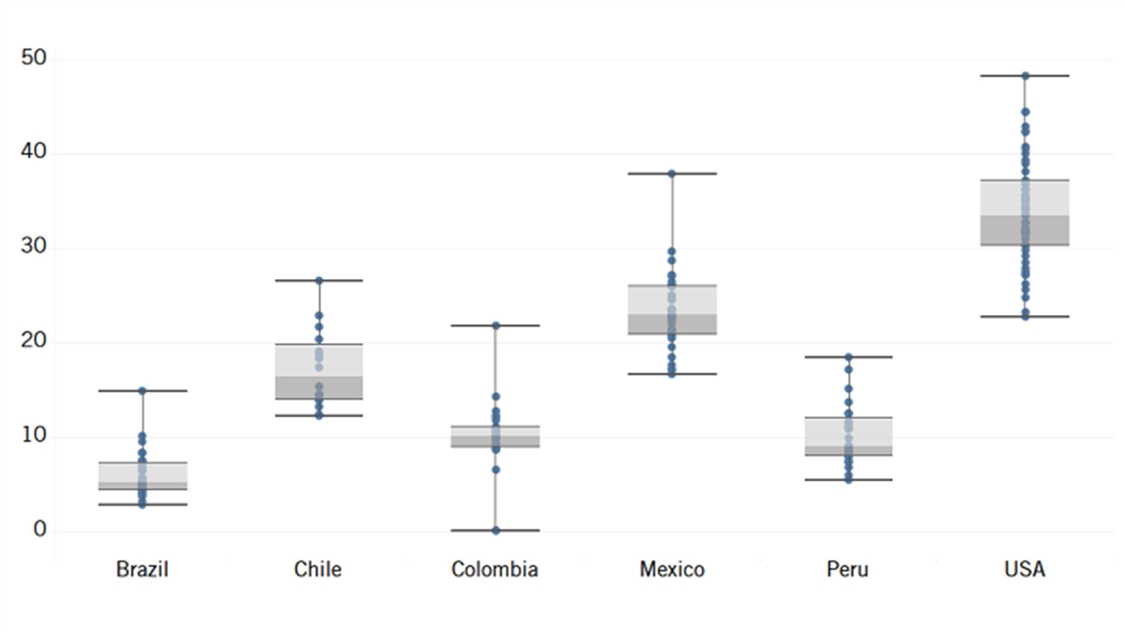
The rankings: The data highlights Peru’s intriguing trend in education. Regions like Arequipa (18.5 percent) and Lima (17.1 percent) stand out in educational attainment (see Figure 3 and Figure 4). By contrast, the San Martín (6.8 percent) and Ucayali (5.9 percent) regions have comparatively lower educational attainment.
In Mexico, the data showcase a divergence between regions such as Mexico City (37.9 percent) and Chiapas (16.7 percent). This reveals a regional contrast in educational attainment and innovation potential, possibly influenced by varying economic conditions, educational infrastructure, and policy priorities.
Similarly, Chile displays regional variations, with Magallanes (26.6 percent) standing out as a hub of educational achievement compared to Ñuble (12.4 percent). This suggests a divide in educational resources and opportunities, reflecting the impact of regional economic disparities and access to quality education.
Brazil’s education landscape exhibits a mix of patterns. Distrito Federal (14.9 percent) and São Paulo (10.1 percent) stand out in educational attainment, possibly driven by economic activity and cultural attractions. Conversely, regions like Pará (3.3 percent) and Maranhão (2.9 percent) showcase underperformance in education.
In Columbia, regions like Bogotá (21.8 percent), Atlántico (14.3 percent), and Boyacá (12.7 percent) exhibit higher percentages of highly educated populations compared to regions such as Vaupes (0.1 percent) and Vichada (0.1 percent). This disparity mirrors the broader socioeconomic gaps that potentially influence educational access and attainment.
Within the United States, the data unveils a rich tapestry of educational landscapes. States like Massachusetts (48.2 percent) and California (36.2 percent) reflect the influence of renowned universities and tech clusters, contributing to high levels of educational attainment. Conversely, states such as Mississippi (22.8 percent) face educational challenges rooted in socioeconomic disparities and limited resources.
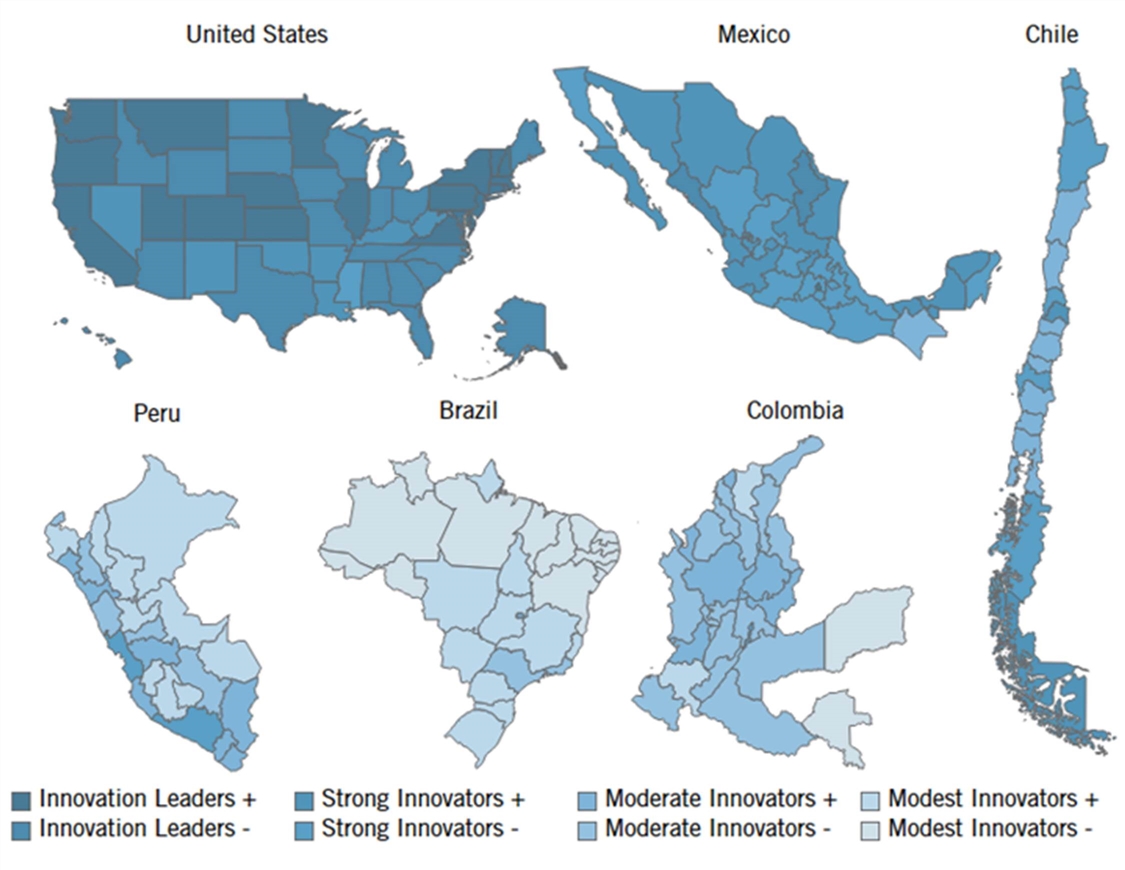
Figure 4: Performance map in highly skilled workforce indicator[17]
Skilled Immigration
Why is this important? Skilled immigration brings together workers with unique educational experiences and backgrounds as a driver of innovative ideas. Level of skill can be difficult to quantify, so this indicator is instead measured via educational attainment, calculated as a region’s share of foreign-born workers with at least some tertiary education relative to the total regional population. A 2016 ITIF study found that foreign-born workers living in the United States are highly represented in the number of scientists and engineers producing meaningful innovations, compared with the overall levels of immigration in the United States.[18] Similarly, half of Silicon Valley’s artificial intelligence (AI) start-ups have foreign-born founders.[19] A separate study found that 52 percent of all Silicon Valley start-ups have at least one foreign-born founder.[20] In addition to contributing to a state’s stock of skilled human capital, highly educated immigrant populations raise wages for both domestic- and foreign-born workers.[21]
Figure 5: Share of population that is foreign-born and has some tertiary education, 2019 (%)[22]
The rankings: The United States has the highest level of skilled immigrants, with Chile being a distant second. On the other hand, countries like Brazil and Peru generally exhibit lower levels.
While the United States leads in attracting skilled immigrants, there are varying levels of skilled immigration across its states. New Jersey and California lead the way with higher skilled immigration indicators (9.4 percent and 8.1 percent, respectively), but other areas like Mississippi and West Virginia display relatively lower indicators (0.5 percent and 0.7 percent). This diverse trend underscores the United States’ mixed appeal to skilled migrants, with certain regions standing out as magnets for skilled professionals.
Chile’s skilled immigration landscape exhibits a mix of patterns. Regions like Santiago (4.4 percent) and Tarapacá (3.3 percent) stand out in skilled immigration, possibly driven by economic activity and cultural attractions. Conversely, regions like Ñuble (0.6 percent) and Araucanía (0.5 percent) showcase underperformance in skilled immigration.
Mexico’s skilled immigration landscape portrays more consistent patterns. Chihuahua (2.7 percent) stands out with higher skilled immigration indicators, while others show less allure to skilled migrants, such as Colima and Tlaxcala (0.1 percent and 0.1 percent). Latin regions that are close to the United States attract more skilled immigrants.
The data highlights Peru’s similar trend in attracting skilled migrants. Lima (2.2 percent) stands out as a hub for skilled immigrants. Other regions, like Cusco (0.02 percent), Cajamarca (0.02 percent), and Apurímac (0.01 percent), attract essentially no skilled immigrants at all.
Colombia’s skilled immigration trend showcases regional disparities. Bogotá (2.5 percent), La Guajira (2.1 percent), and Norte de Santander (2.0 percent) demonstrate relatively high skilled immigration, potentially due to economic opportunities in urban centers. Meanwhile, Caquetá (0.1 percent) and Chocó (0.1 percent) reflect comparatively lower levels of skilled immigration.
Brazil’s skilled immigration trends are the lowest of all the countries. Regions like Rio de Janeiro (0.3 percent) and Sao Paulo (0.3 percent) present the highest skilled immigration levels, indicating their status as hubs for skilled migrants. Other regions, like Maranhão (0.01 percent) and Piauí (0.01 percent), attract very little skilled immigration.
Figure 6: Performance map in skilled immigration indicator[23]
Professional, Scientific, and Technical Employment
Why is this important? This indicator measures the share of employees working in PTS activities in each region. This includes, for example, engineers, researchers, and lawyers. PTS services include those needed to facilitate the development, implementation, and commercialization of innovations. Automation and globalization also make high-value-added professional services increasingly important in the modern economy. These occupations are highly knowledge-intensive and therefore harder to offshore. States with greater concentrations in these occupations are thus somewhat less threatened by increased levels of globalization.
Figure 7: Share of employees in professional, technical, and scientific services fields, 2019 (%)[24]
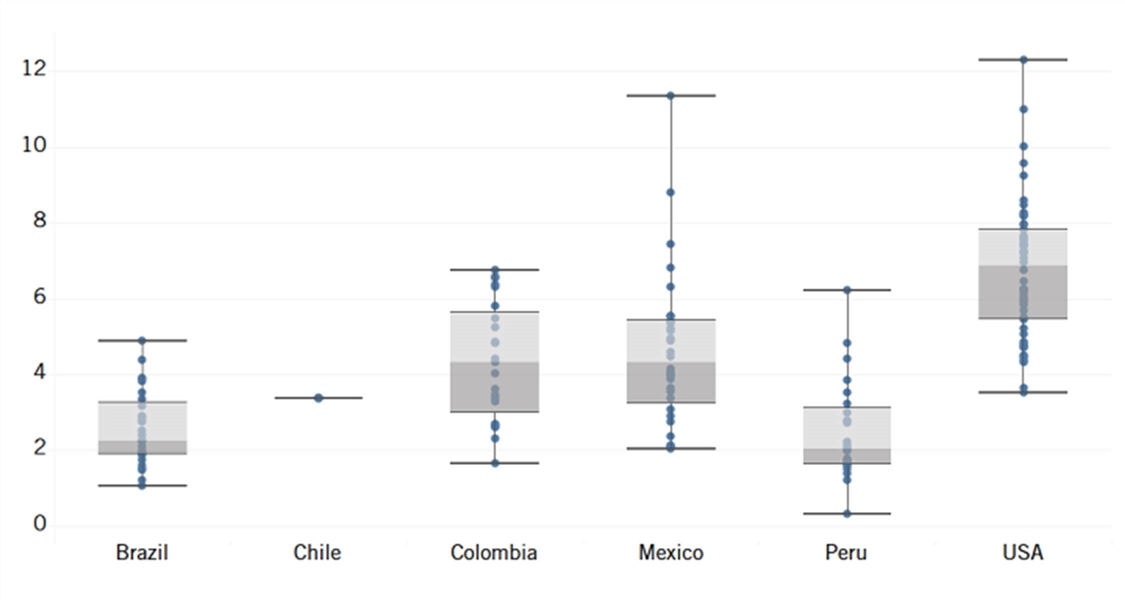
The rankings: The data reveal a range of PTS employment across Peru’s regions. Regions such as Lima (6.2 percent), Tacna (4.8 percent), and Arequipa (4.4 percent) showcase higher levels of skilled employment. These regions demonstrate Peru’s growing capacity to attract and accommodate skilled professionals in diverse fields.
Brazil exhibits a similar trend with certain regions leading in PTS employment. Notably, Distrito Federal (4.9 percent), São Paulo (4.4 percent), Santa Catarina (3.9 percent), and Rio de Janeiro (3.8 percent) stand out as hubs for skilled labor. These regions’ higher percentages signal Brazil’s allure as a destination for professionals seeking advanced career opportunities.
Chile’s employment landscape reflects varying degrees of PTS employment. Regions like Santiago (3.4 percent) lead in this aspect, indicating their role as economic and cultural centers. The data underscore Chile’s capacity to provide skilled opportunities in sectors ranging from technology to the arts.
Colombia presents a dynamic picture, with regions such as Norte de Santander (6.8 percent), Caldas (6.6 percent), and Risaralda (6.6 percent) featuring prominently in PTS employment. These regions highlight Colombia’s renowned research and innovation ecosystem, contributing to a robust employment landscape.
The United States’ PTS employment trends vary across its states. Virginia (12.3 percent), Massachusetts (11.0 percent), and Maryland (10.0 percent) stand out with high PTS employment scores, signifying the country’s technological and economic prowess. The data underscore the United States’ appeal to professionals seeking diverse career opportunities.
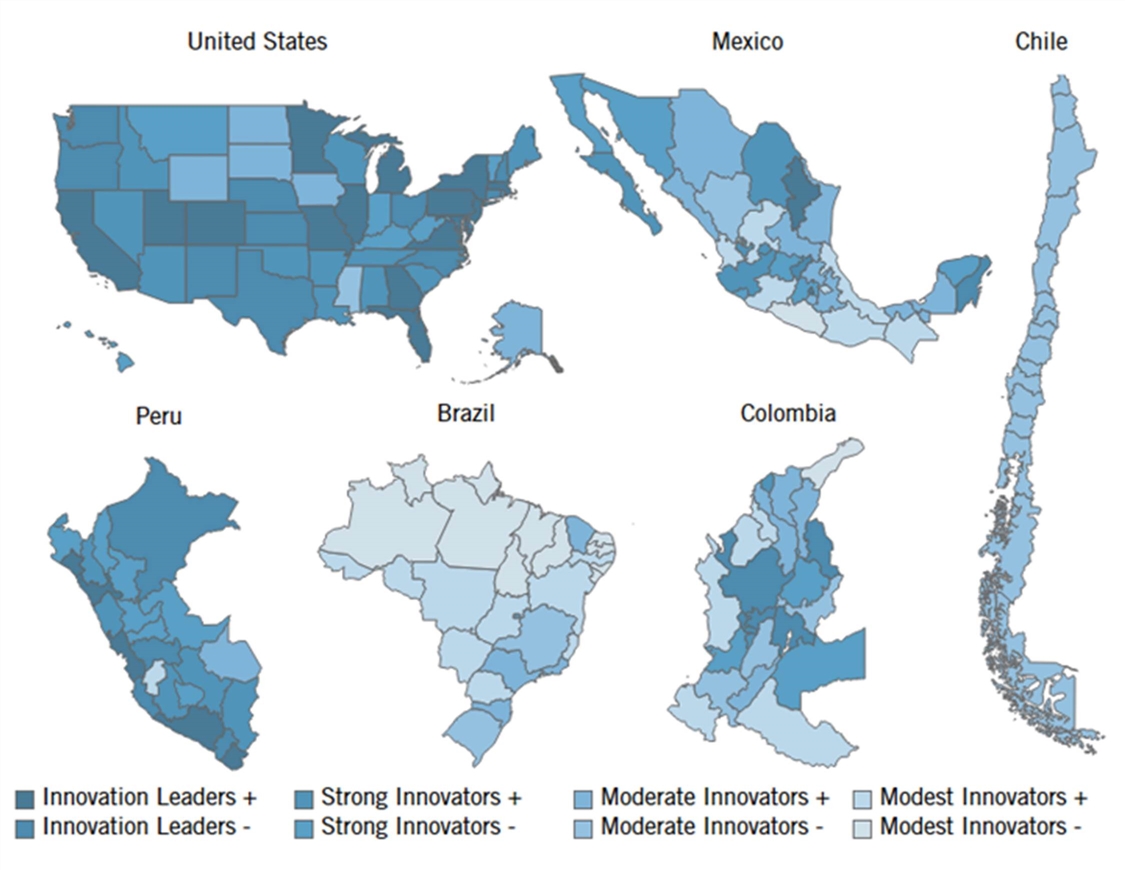
Figure 8: Performance map in professional, technical, and scientific employment indicator[25]
Manufacturing Labor Productivity
Why is this important? Gross value added (GVA) measures the contribution to GDP made by an individual producer, industry, or sector. This indicator measures the average GVA per manufacturing worker on a purchasing power parity (PPP) basis. Within manufacturing, high-value-added firms are most often capital-intensive, producing more technologically complex products and organizing their workers to take better advantage of their skills. They typically pay higher wages because their workers are more productive, generating greater value for each hour worked. All else being equal, firms with higher value-added levels are more likely to be able to meet global competitiveness challenges. Unfortunately, U.S. manufacturing labor productivity has been in decline for some time, falling by 1.34 percent between 2012 and 2019.[26]
Figure 9: PPP-adjusted gross value added per worker in the manufacturing sector, 2019 (USD)[27]
The rankings: Manufacturing labor productivity in Peru showcases regional differences. Tumbes ($121,726) and Ica ($113,133) among others demonstrate strong productivity, underlining Peru’s industrial prowess, while regions such as Cajamarca ($21,086) and Huancavelica ($8,658) lag significantly behind.
Brazil exhibits notable regional differences in manufacturing labor productivity. Rio de Janeiro ($29,541) and Paraná ($25,695) lead, reflecting their advanced manufacturing sectors. At the bottom are Sergipe and Bahia (both $17,856).
Mexico’s regions display mixed productivity figures. Coahuila ($85,131), Querétaro ($80,815), and Nuevo León ($78,830) are the leading regions in Mexico. By contrast, the regions of Campeche ($8,535) and Guerrero ($5,040) significantly lag behind the rest of Mexico’s regions.
Chile’s manufacturing productivity varies widely across its regions. Tarapacá ($77,949) and Antofagasta ($63,479) excel, spearheaded by their leading mining industries. . Regions like Atacama ($19,967) and Arica y Parinacota ($22,295) exhibit lower productivity, potentially indicating challenges in their manufacturing sectors.
Colombia showcases considerable variation in manufacturing productivity across its regions. Santander ($53,158) and Boyacá ($46,235) lead, reflecting the strength of these regions. Regions like Nariño ($9,915) and La Guajira ($2,295) also stand out as significantly lagging.
U.S. states exhibit significant diversity in their levels of manufacturing productivity. The data reports that states such as Louisiana ($333,712) and Wyoming ($291,511) have the highest levels of manufacturing productivity, although this data is significantly skewed by the prevalence of the oil and gas sectors (such as refining) in these states’ economies. (Unfortunately, to maintain the international comparisons needed for this study, it was not possible to back out the distortive effects of these states’ large energy sectors.) Indiana, Ohio, and Michigan were more indicative of the actual performance of the more manufacturing-oriented U.S. states (with values of $176,518, $152,458, and $147,100, respectively). States like Hawaii ($108,148) and Vermont ($100,084) display comparatively lower manufacturing output, possibly due to their smaller industrial bases.
Figure 10: Performance map in manufacturing labor productivity indicator (no data on Moquegua)[28]
Globalization
High-Tech Exports
Why is this important? This indicator measures a region’s exports in the machinery manufacturing; computer and electronic products manufacturing; and electrical equipment, appliances, and components manufacturing industries (North American Industry Classification System “NAICS” 333–335 or equivalent) as a share of GDP. These represent high-value-added goods that are crucial in the modern global economy. Considering a region’s exports of these goods as a share of its GDP shows to what extent a region has a comparative advantage in high-tech production and export. Moreover, this indicator represents a region’s position in global value chains for the production of these goods.
Figure 11: Exports in NAICS 333–335 (or equivalent) as a share of GDP, 2017 (%)[29]
The rankings: High-tech exports in Peru showcase interesting regional disparities. Lima (0.3 percent) and Ica (0.1 percent), while not a powerhouse in this regard, stand out as scoring highest. Most other regions like Junín (0.001 percent) and Pasco (0.001 percent) have almost no high-tech exports.
Brazil exhibits diverse high-tech export distribution. Regions like Rio de Janeiro (0.6 percent) show potential in technology export, while Sao Paulo (0.8 percent) and Amazonas (0.7 percent) lead the way. By contrast, regions including Pará (0.001 percent) and Bahia (0.002 percent) have hardly any high-tech exports.
Colombia also showcases regional diversity in high-tech exports, with regions such as San Andrés y Providencia (0.2 percent), Atlántico (0.1 percent) and Bogotá (0.1 percent) leading the way. Regions like Boyacá (0.001 percent) and Huila (0.001 percent) have hardly any high-tech exports.
The United States demonstrates a wide range of high-tech export levels among its states. States such as Oregon (5.8 percent) excel due to their technology-driven sectors. However, there are variations, with states like Alaska (0.1 percent) and Wyoming (0.3 percent) indicating room for technological expansion. Wyoming’s very weak performance on this indicator reinforces the point that its high performance on the prior manufacturing labor productivity indicator is highly distorted by its energy sector.
Data was not sufficiently available at the subnational level to include analysis for Chile and Mexico on this indicator.
Figure 12: Performance map in high-tech exports indicator[30]
Inward FDI
Why is this important? This indicator measures the inward FDI a region receives relative to its GDP, measured as the funds an entity in the region receives from a foreign-based entity to purchase, establish, or expand enterprises. Inward FDI not only spurs domestic economic activity but also facilitates technology transfer between foreign-owned enterprises and local establishments. Foreign owners can also introduce domestic firms to new international markets and help regions carve out positions in global supply chains. Inward FDI has also been associated with greater economic growth in market economies and tends to be more productive and induce greater levels of investment by domestic firms.[31]
Figure 13: Inward foreign direct investment as a percentage of GDP, 2017–2018 (average) (%) [32]
Because FDI can be very volatile from year to year, regions’ averages over three years are considered. Measures for each country required varying degrees of estimation; the methods are described in the appendix. This report does not include Colombia, Peru, and Chile for this indicator because regional data was not available for those countries.
Brazil’s FDI trends show very divergent outcomes. Notably, Amazonas (27.6 percent), Paraná (18.7 percent), Minas Gerais (15.2 percent), and São Paulo (14.9 percent) lead the way. By contrast, regions like Rondônia (0.16 percent) and Roraima (0.03 percent) attract essentially no foreign investment.
Mexico showcases a diverse FDI picture across its regions. Zacatecas (3.4 percent) and Baja California Sur (2.6 percent) stand out as the most attractive regions for foreign investors. However, Oaxaca (0.1 percent) and Colima (0.3 percent) show a significantly lower FDI inflow.
The United States, being a major global player, exhibits diverse FDI trends across its states. States like Maine (3.3 percent) and Missouri (3.2 percent) evince high attractiveness to foreign investors. However, some states like Montana (0.2 percent) and Iowa (0.2 percent) show slightly less FDI inflow.
Figure 14: Performance map in inward FDI indicator[33]
Innovation Capacity
Broadband Adoption
Why is this important? This indicator measures broadband adoption—that is, the share of households within each region that subscribe to a broadband Internet connection, either mobile or fixed. (All measures of broadband adoption used include satellite adoption as well). The Internet is now essential to full participation in today’s increasingly digitalized global economy. The COVID-19 pandemic vividly demonstrated how crucial widespread Internet adoption is for societies, enabling telework, tele-education, telehealth, etc. Increased access to the Internet has also been associated with greater productivity and economic growth.[34]
Figure 15: Share of households that have adopted broadband Internet, 2019 (%)[35]
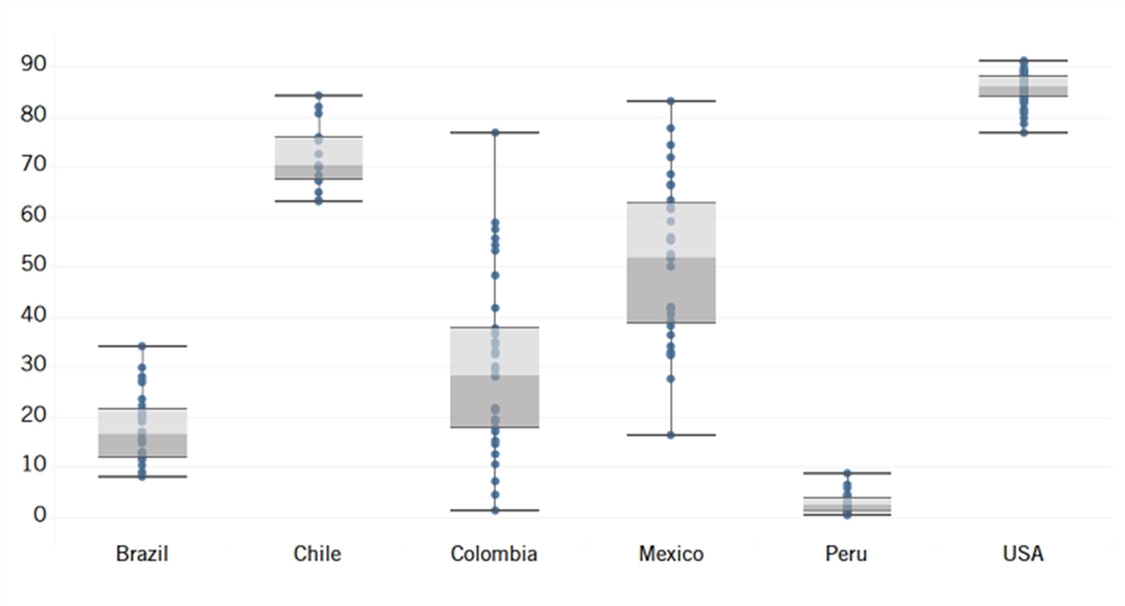
The rankings: Peru showcases a relatively low level of broadband adoption across its regions. Lima (8.7 percent) leads the way, followed by Arequipa (6.3 percent) and Tacna (5.8 percent). These numbers highlight Peru’s need for greater investment in digital connectivity and the accessibility of broadband Internet services.
Brazil’s regions display considerable variation in digital infrastructure. Santa Catarina (34.0 percent) and São Paulo (29.9 percent) stand out as leaders in broadband adoption. By contrast, regions like Maranhão (8.0 percent) and Pará (8.6 percent) lag.
Mexico’s broadband adoption levels vary across its regions. Sonora (83.0 percent) and Baja California Sur (77.7 percent) lead the way, highlighting their focus on digital connectivity. However, regions like Chiapas (16.4 percent) and Tlaxcala (27.5 percent) suggest a need for enhanced efforts to improve broadband access.
Chile’s regions evince mixed broadband Internet adoption rates. Regions like Antofagasta (84.3 percent), Santiago (82.0 percent), and Magallanes (80.6 percent) lead the way, while others like Araucanía (63.1 percent) and Maule (63.2 percent) show room for improvement in digital infrastructure.
Colombia exhibits significant regional diversity in digital connectivity, with many regions showcasing low broadband adoption rates, like Vaupés (1.3 percent) and Vichada (4.5 percent). Bogotá (76.9 percent) and Antioquia (58.8 percent) stand out as leaders in digital integration.
The United States showcases a less-diverse range of broadband adoption rates across its states. Washington (91.2 percent), Colorado (91.0 percent), and California (89.8 percent) lead the way, indicating their strong digital infrastructure. States like Mississippi (76.8 percent) and Louisiana (80.6 percent) show room for improvement in broadband adoption, but still perform considerably ahead of most Latin American regions.
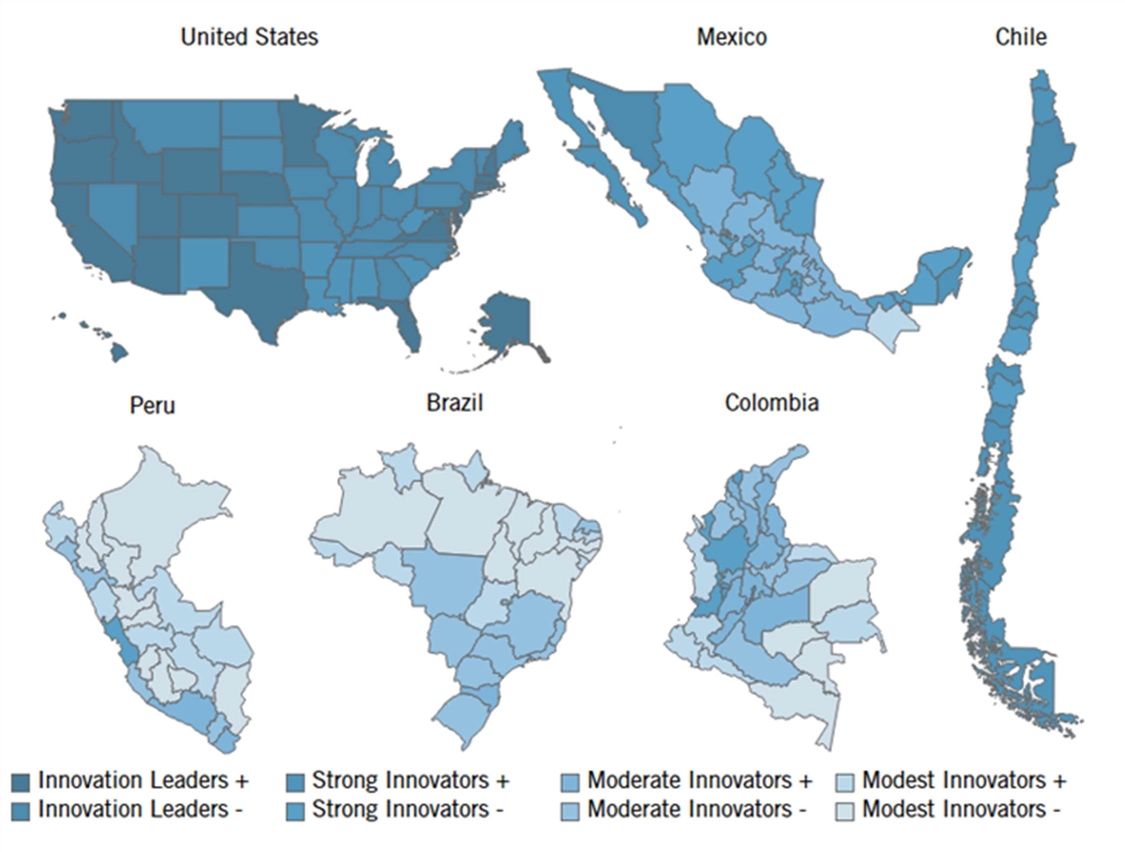
Figure 16: Performance map in broadband adoption indicator[36]
R&D Intensity
Why is this important? This indicator measures R&D expenditures in a region relative to its GDP considering R&D expenditures by all sectors: business, government, and higher education. R&D lies at the heart of innovation, as it represents the source of the new knowledge needed to discover, design, and implement innovative technologies and products. R&D results in slightly higher private returns and much larger social returns than other types of investment as new knowledge and technology spill over to the rest of an economy.[37]
Figure 17: R&D expenditures as a share of GDP, 2019 (%)[38]
The rankings: Peru’s regions display varying levels of R&D intensity. Amazonas (0.7 percent) and Ayacucho (0.3 percent) lead in prioritizing research and innovation, while Tacna (0.01 percent), Huánuco (0.01 percent), and Apurímac (0.02 percent) have almost no R&D activity, suggesting potential areas for increased focus on research-driven growth.
Brazil displays noticeable variation in commitment to R&D across most of its regions. Rio de Janeiro (1.2 percent) and São Paulo (1.2 percent) lead the way, indicating potential in R&D.
Mexico’s regions demonstrate varying degrees of R&D intensity. Coahuila (1.0 percent) leads in research intensity, while regions like Oaxaca (0.1 percent) and Chiapas (0.1 percent) exhibit lower emphasis on research activities.
Chile’s regions reflect a diverse approach to R&D. Los Ríos (0.8 percent) and Santiago (0.6 percent) lead in innovation efforts, while regions like Atacama (0.03 percent) and Aysen (0.01 percent) have room for improvement in boosting research activities.
Colombia varies in research and development across its regions. Vaupés (2.5 percent) leads in R&D intensity. By contrast, Putumayo (0.02 percent) and Vichada (0.01 percent) have almost no R&D activity.
The United States exhibits varied R&D intensity across its states. New Mexico (7.5 percent), Washington (6.9 percent), and Massachusetts (6.6 percent) lead in research emphasis, while states like Louisiana (0.6 percent) and Oklahoma (0.9 percent) have comparatively lower focus on research activities.
Figure 18: Performance map in R&D intensity indicator[39]
R&D Personnel
Why is this important? This indicator measures the number of R&D personnel as a share of all employees in each region. R&D personnel are indispensable to conducting R&D activities and turning investments into new productivity-enhancing knowledge and technologies.
Figure 19: R&D personnel as a share of total employees, 2017–2018 (%)[40]
The rankings: Peru’s regions exhibit varying levels of R&D personnel. Ucayali (0.1 percent) leads in terms of human resources dedicated to R&D in Peru, while Lambayeque (0.002 percent), Cajamarca (0.001 percent), and Huánuco (0.001 percent) have lower levels, suggesting potential areas for increased investment in skilled researchers.
Mexico’s regions display differing levels of R&D personnel. Nuevo León (0.2 percent) and Querétaro (0.2 percent) lead in allocating human resources to research, while regions like Chiapas (0.03 percent) and Oaxaca (0.02 percent) have comparatively fewer personnel dedicated to R&D.
Chile’s regions showcase diverse approaches to R&D personnel. Santiago (0.3 percent) and Los Ríos (0.2 percent) stand out with comparatively greater human resources allocated to research, while regions like Atacama (0.02 percent) and Aysen (0.01 percent) trail.
Colombia’s regions exhibit a commitment to research with substantial human resources allocated. Boyacá (0.6 percent) and Bogotá (0.5 percent) have the highest levels of R&D personnel, while Córdoba (0.1 percent) and Cauca (0.1 percent) have comparatively fewer R&D personnel.
The United States showcases varying levels of R&D personnel across its states. Washington (3.2 percent) and Massachusetts (2.6 percent) lead in human resources dedicated to research, while states like Alaska (0.4 percent), Arkansas (0.5 percent), and West Virginia (0.7 percent) have relatively fewer personnel engaged in R&D activities.
Figure 20: Performance map in R&D personnel indicator[41]
Patent Applications
Why is this important? This indicator measures international Patent Cooperation Treaty (PCT) patent applications filed by residents or entities within a region per one million residents. Patent output measures the “inventiveness” of a population. Patents also secure private returns on investment in R&D activities, which are necessary to incentivize these activities and their socially desirable spillover effects. By considering PCT patents, this indicator focuses on internationally filed patents to mitigate differences in patent qualifications between countries’ patent offices.
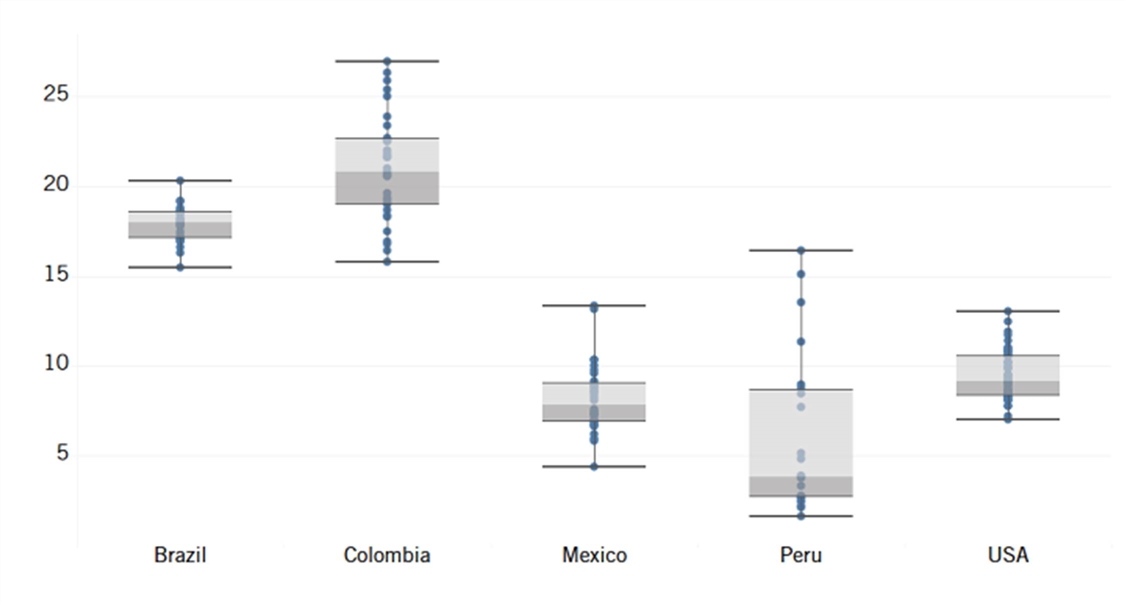
Figure 21: PCT patent applications per million residents, 2015[42]
The rankings: Patent applications vary across Peru’s regions, with Lima (18.1) and Arequipa (17.5) leading in terms of innovation activity, at least as expressed through patent filings. Cajamarca (0.6) and Piura (0.5) have very few applications, suggesting potential areas for increased focus on innovation.
Brazil’s regions vary in terms of patent application intensity. Santa Catarina (78.9) and Rio Grande do Sul (64.0) are standout regions in terms of patent filings, showcasing comparatively strong efforts in intellectual property (IP) creation and technological advancement.
Mexico demonstrates varying levels of patenting activity across its regions. Sonora (23.9) leads in patent filings, while regions like Durango (0.3), Guerrero (0.1), and Chiapas (0.03) show room for potential improvement in innovation efforts.
Chile’s regions exhibit diverse scores in patenting activity. Santiago (18.3) and Valparaíso (9.0) lead in patent applications, while Araucanía (1.0) and Coquimbo (1.1) show lower levels, suggesting opportunities for increased focus on IP creation.
Colombia displays significant variation in innovation across its regions. San Andrés y Providencia (32.6) leads in patent applications, while regions like Cauca (0.7) and Atlántico (0.4) evince very few patent applications.
The United States demonstrates varying levels of innovation across states. Massachusetts (502.4) and California (379.9) lead in patent applications, while states like Arkansas (32.4), Mississippi (20.0), and Alaska (12.2) have comparatively fewer patent filings, highlighting areas with potential for growth in IP creation.
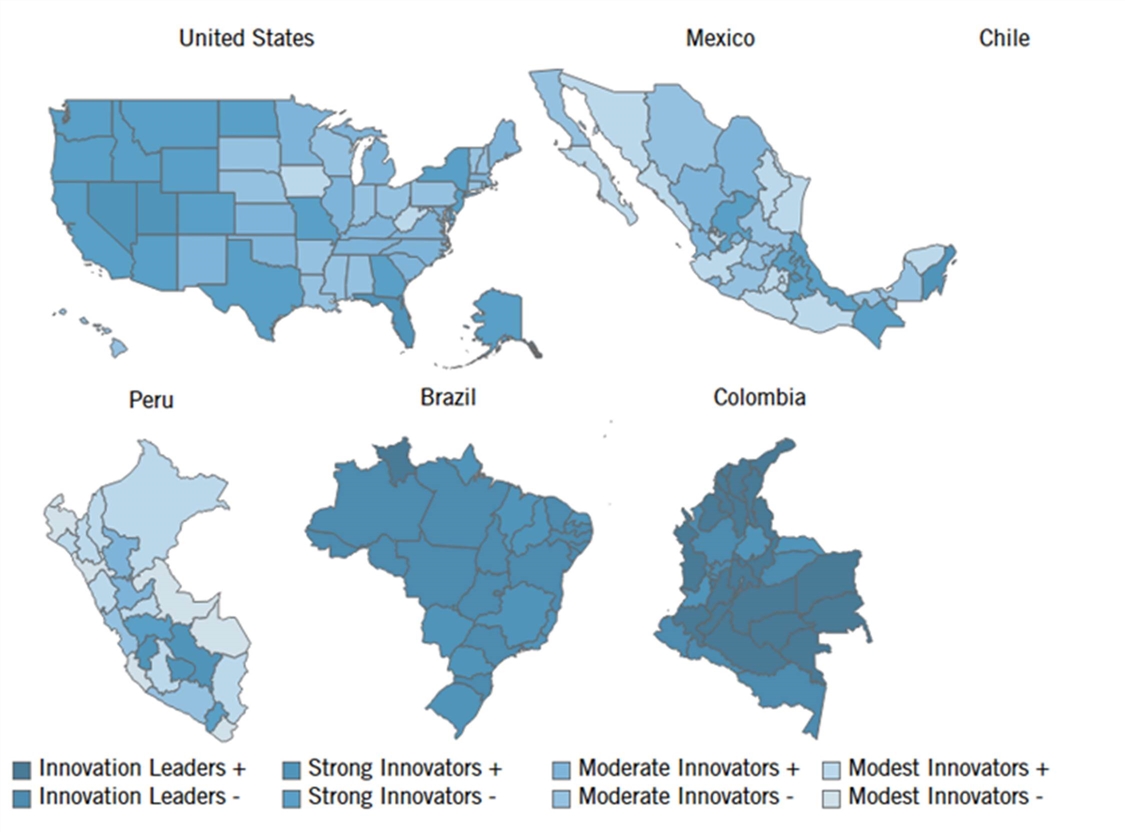
Figure 22: Performance map in patent applications indicator[43]
Business Creation
Why is this important? A thriving business ecosystem should experience a high volume of business start-ups. This indicator measures the share of a region’s business enterprises that were established in the past year. The business creation indicator is limited in scope to new businesses, without capturing business turnover resulting from the market disruption and creative destruction that forces incumbents to innovate or leave the market. Thus, the full impact of business competition on innovation is not captured. Moreover, this metric does not differentiate between industries, so there is no differentiation between creation rates in advanced, innovative industries and those in less-advanced industries. Absent a better alternative at the cross-national regional level, this indicator reflects a region’s overall economic resilience and regional competitiveness.
Figure 23: Economy-wide enterprise birth rate, 2016–2018 (%)[44]
The rankings: Business creation rates in Peru vary across regions, with Cusco (16.4 percent) and Huancavelica (15.1 percent) leading in fostering new businesses. Tumbes (1.6 percent) and Tacna (2.1 percent) show relatively lower rates, suggesting potential for increased entrepreneurial efforts.
Brazil demonstrates a balanced entrepreneurial environment, with all regions having moderate business creation rates. Roraima (20.3 percent) and Amazonas (19.2 percent) have relatively higher rates, indicating favorable conditions for startups.
Mexico exhibits consistent entrepreneurial efforts across its regions. Quintana Roo (13.1 percent) and Tlaxcala (13.4 percent) stand out, showing a strong commitment to new business ventures.
Colombia’s regions exhibit balanced entrepreneurial activities. Magdalena (26.3 percent) and Sucre (26.9 percent) lead, highlighting their vibrant startup ecosystems, while San Andrés y Providencia (16.8 percent), Santander (16.4 percent), and Bogotá (15.8 percent) show potential for further development.
The United States displays diverse entrepreneurial dynamics. Nevada (13.1 percent) and Florida (12.5 percent) lead in business creation, showcasing their entrepreneurial appeal, while Ohio (7.8 percent) and Iowa (7.2 percent) have comparatively lower rates, indicating scope for growth in their startup activity.
Figure 24: Performance map in business creation indicator[45]
Carbon Efficiency
Why is this important? As the world endeavors to combat climate change, decarbonization is of paramount importance. Regions’ ability to innovate sustainably to achieve a reduction in and the efficient use of carbon and other greenhouse gases will determine their long-term competitiveness, as well as their national economic prosperity. This indicator measures carbon dioxide (CO2) and other greenhouse gas efficiency per unit of output (as measured by PPP-adjusted GDP). It is noted that more-developed regions may have a slight advantage in this indicator due to their somewhat-more service-oriented economies. As policymakers look to improve efficiency and reduce overall emissions, they will take their lead from those regions that are devising new solutions and innovative technologies.
Figure 25: Metric tons of greenhouse gas (measured in CO2 equivalents) emitted per $10,000 of PPP-adjusted GDP, 2018[46]
The rankings: Brazil exhibits significant variation in carbon efficiency across its regions. Regions like Distrito Federal (0.5) and São Paulo (1.2) lead in carbon efficiency, displaying a national commitment to environmental responsibility. By contrast, regions like Acre (58.4) and Rondônia (58.5) exhibit a need for greater investment in reducing greenhouse gases.
Mexico displays diverse carbon efficiency levels across its regions. Regions like Colima (1.1) and Aguascalientes (1.3) exhibit the lowest carbon footprints. By contrast, Coahuila (17.4), Hidalgo (9.2), and Campeche (9.1) have much higher levels of greenhouse gases.
Chile demonstrates a range of carbon efficiency levels. Regions like Santiago (0.9) and O’Higgins (2.0) display lower greenhouse gas emissions, while Atacama (13.1) and Ñuble (11.2) exhibit a much-greater carbon footprint.
Colombia showcases varying carbon efficiency across its regions. Regions like Bogotá (0.4) and San Andrés y Providencia (0.5) exhibit the lowest greenhouse gas emissions, while regions like Vichada (33.7) display a need for more investment in this regard.
The United States presents a diverse range of carbon efficiency levels across its states. While states like Massachusetts (1.2) and California (1.4) demonstrate strong carbon efficiency, states like Wyoming (23.5) and North Dakota (15.6) face more significant challenges in reducing their carbon footprint.
Figure 26: Performance map in carbon efficiency indicator[47]
Venture Capital
Why is this important? This indicator examines a region’s total venture capital investment (measured as VC-receiving firms) relative to the size of its GDP. VC represents a form of business financing wherein investors provide funds to early-stage companies in exchange for equity in their firms. Given the considerable uncertainty regarding start-ups’ success potential, VC investment assumes higher risks than other forms of investment. Accordingly, VC investment is often intended for companies with real or perceived high-growth potential, often associated with their innovative technology use or business model design. A region’s receipt of VC investment reflects both the innovativeness of its start-up ecosystem as well as the commitment of its firms to lead in crucial technologies such as AI, biotechnology, clean energy, advanced manufacturing, and robotics. Due to the volatility of VC investment from year to year, this report considers regions’ average scores between 2017 and 2019.
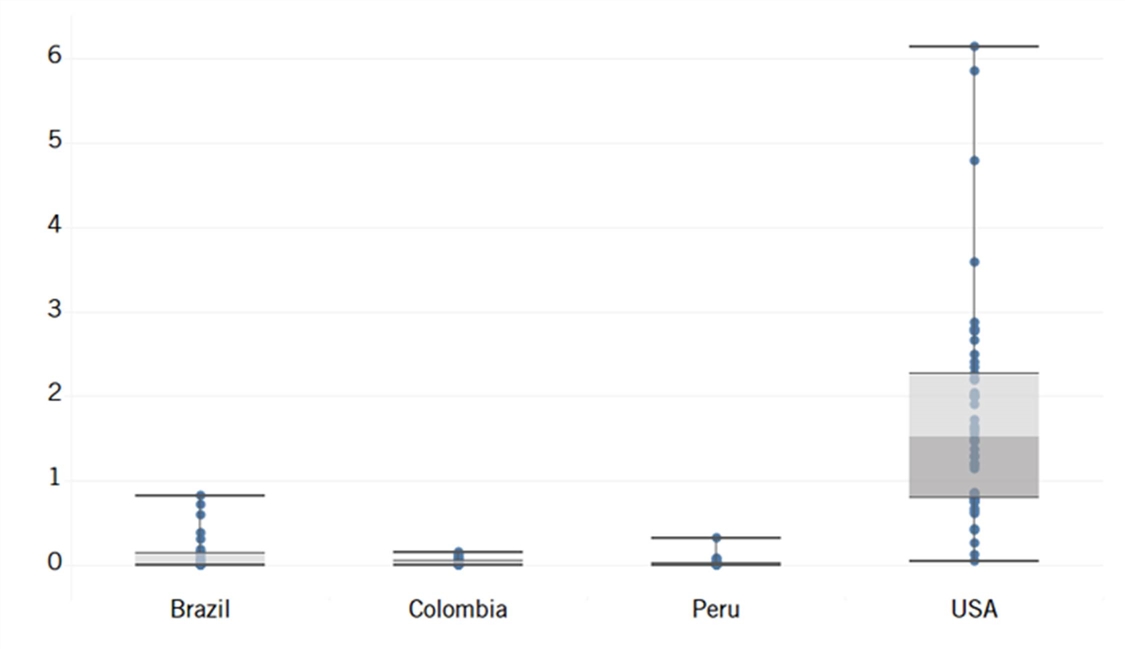
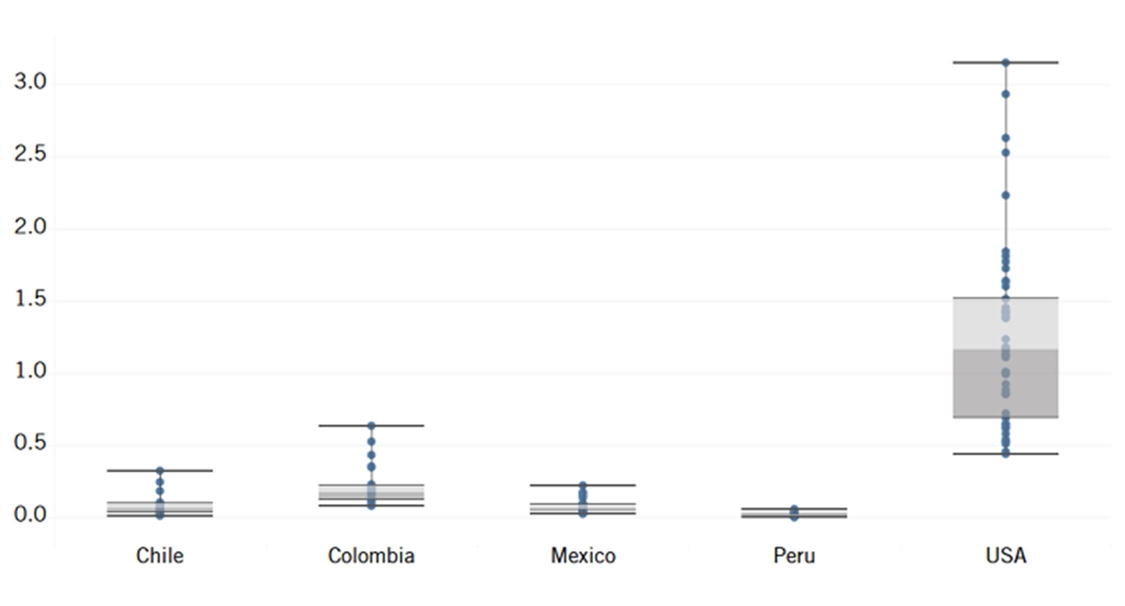
Figure 27: Venture capital investment received as a percentage of GDP, 2017–2019 (average) (%)[48]
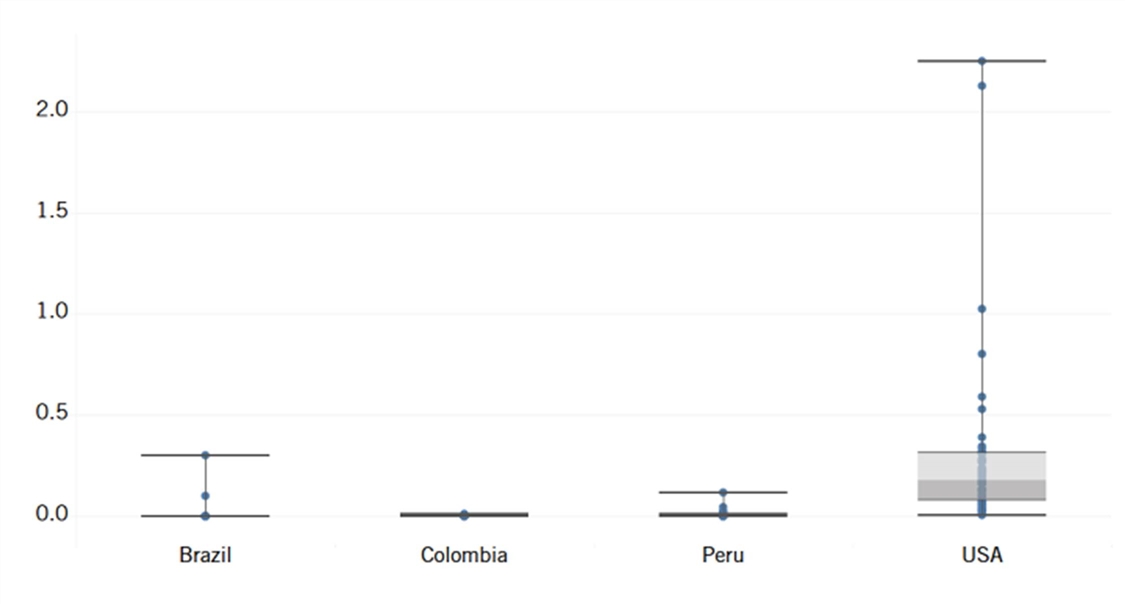
The rankings: Peru’s regions exhibit varying levels of venture capital attraction. Huancavelica (0.12 percent) leads the way in venture capital influx. Meanwhile, many regions like Apurímac (0.004 percent) and Loreto (0.003 percent) attract almost no venture capital at all.
Brazil displays venture capital attraction in only a couple of areas. São Paulo (0.30 percent) and Rio de Janeiro (0.10 percent) lead the country, indicating robust entrepreneurial activities. However, most of the other regions show essentially no venture capital involvement.
Colombia demonstrates varying degrees of venture capital engagement across its regions. Bogotá (0.01 percent) leads the way for start-ups and innovative ventures, while regions like Cauca (0.0002 percent) and Magdalena (0.0003 percent) attract very little venture capital.
The United States showcases a robust venture capital landscape. States like Massachusetts (2.13 percent) and California (2.25 percent) lead the nation in attracting venture funding, reflecting their status as global tech and innovation hubs. Other regions like New York (1.03 percent), Utah (0.80 percent), and Texas (0.20 percent) also display substantial venture capital activities.
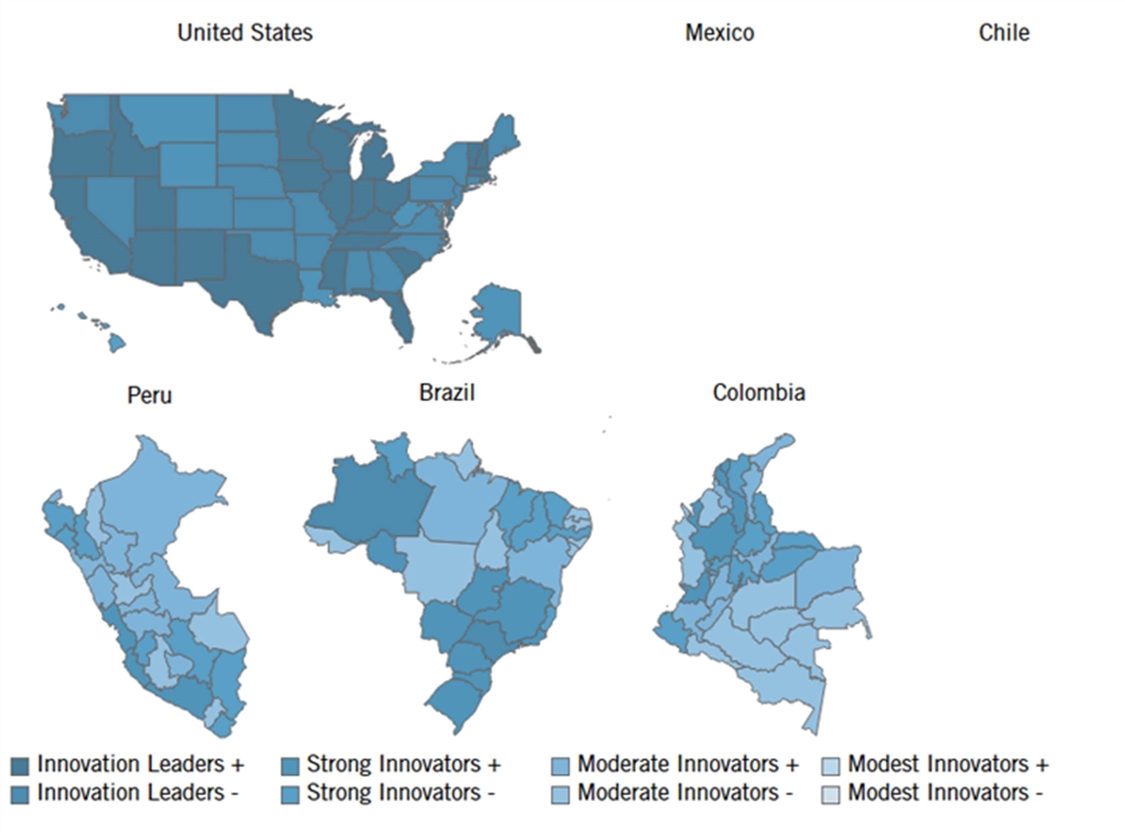
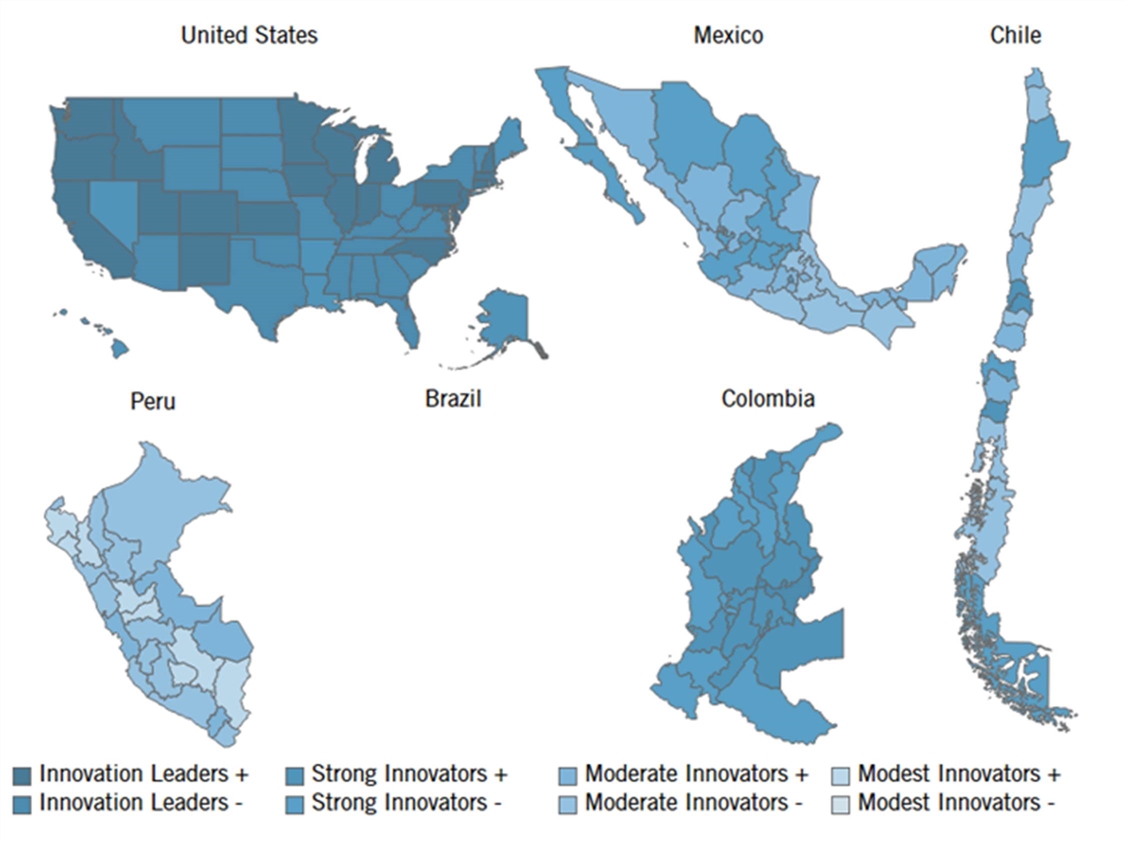
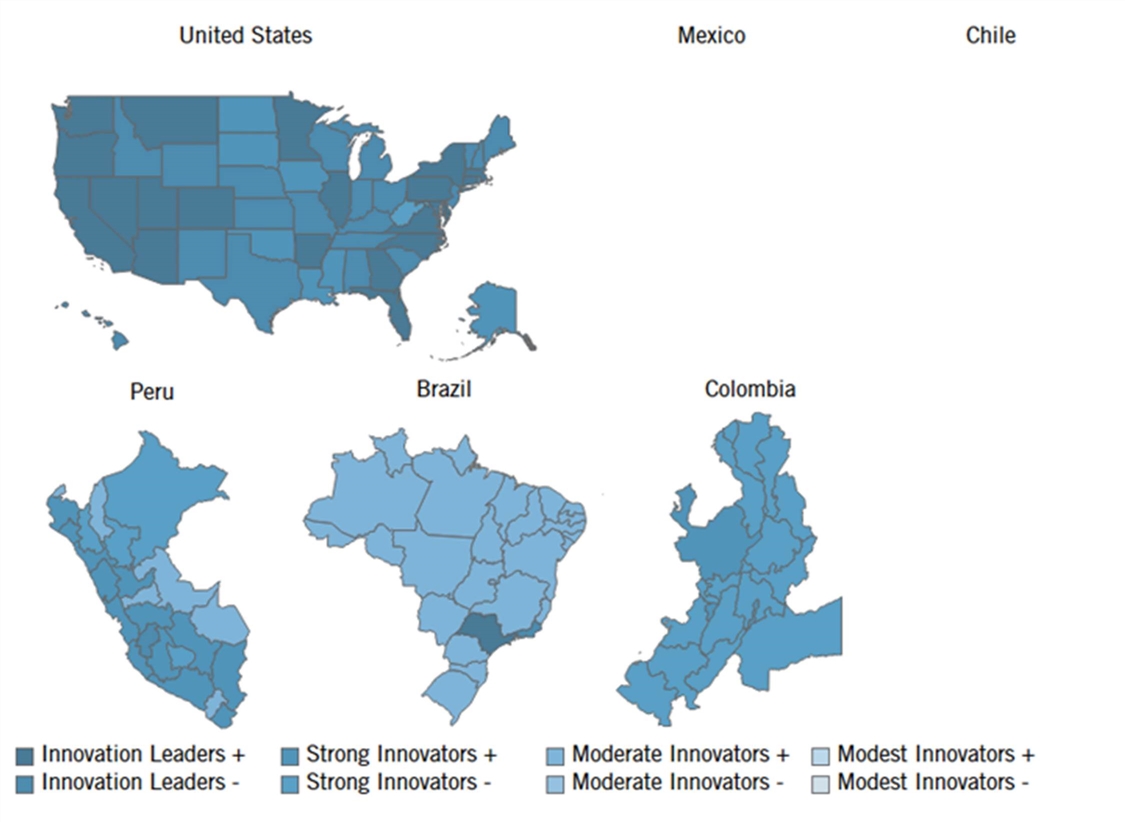
Figure 28: Performance map in venture capital indicator[49]
Policy Recommendations
Brazil
Knowledge Economy
Analysis of the knowledge economy component brings to light troubling trends concerning Brazil’s subpar indicators related to a highly educated population and its lackluster manufacturing labor productivity.
To effectively tackle these challenges and cultivate a heightened sense of competitiveness and innovation within the knowledge economy, it is imperative to adopt a focused and specific policy strategy. Addressing the shortcomings in highly educated population indicators and manufacturing labor productivity demands a comprehensive approach that underscores the importance of educational excellence, continuous lifelong learning, robust collaboration between industries and academia, all while embracing technological advancements. Additionally, promoting greater trade openness can invigorate industry competition, subsequently fostering remarkable strides in productivity gains.
Globalization
Brazil possesses the potential within its subnational regions to foster innovation, cultivate economic diversification, and bolster its global competitive standing. This transformation can give rise to a more harmoniously integrated and thriving business ecosystem at the subnational level, thereby making a substantial contribution to the country’s growth trajectory and its resilience on the international stage.
Within this context, the globalization component of the analysis has shed light on substantial challenges, including the country’s struggling indicators of high-tech exports and the uneven distribution of inward FDI across its states. Considering these obstacles, there arises a pressing need to adopt a strategic and focused policy approach that can galvanize Brazil’s international competitiveness.
While Brazil has made notable strides in business creation, the metrics concerning broadband adoption, R&D intensity and personnel, patent applications, carbon efficiency, and venture capital indicate areas warranting attention.
This should entail a comprehensive strategy that includes the promotion of high-tech exports, the orchestration of targeted trade missions, bolstering the capabilities of high-tech industries through capacity-building initiatives, nurturing collaborative industry clusters and special economic zones, aligning and coordinating policies across various levels of governance, and establishing regional investment promotion agencies.
Innovation Capacity
The innovation capacity component underscores a diverse spectrum of challenges and opportunities among Brazilian states. While Brazil has made notable strides in business creation, the metrics concerning broadband adoption, R&D intensity and personnel, patent applications, carbon efficiency, and venture capital indicate areas warranting attention.
Brazil possesses the potential to bolster its subnational innovation capacity, cultivating an environment conducive to sustainable growth, technological progress, and inclusive development. To achieve this, a comprehensive approach encompassing improved infrastructure, heightened R&D investment, fortified IP protection legislation and IP culture, sustainable practices (particularly in the Amazon region, the mining sector, and the agribusiness sector), tailored support for start-ups beyond São Paulo and Rio de Janeiro, and amplified access to venture capital is all imperative. These strategic measures would undoubtedly fuel innovation and empower states across the nation to flourish amidst the swiftly evolving global landscape.
Chile
Knowledge Economy
Despite Chileans acceding to higher education as no previous generation had, there is still an important percentage of the labor force that does not have a bachelor’s degree. On the other hand, the quality of school education is below the level of most Organization for Economic Cooperation and Development (OECD) members.[50] Both are reasons that explain the low labor productivity in Chile when compared with developed countries.[51]
To cope with these problems, the government should promote measures to improve the quality of education, especially in math; increase the percentage of formal workers by making the labor market more flexible—Chile has one of the highest costs for hiring and firing employees—and; in general, promote macro- and microeconomic conditions to elevate the labor productivity.
Regarding the attraction of talent from abroad, the percentage of immigrants with tertiary education is less than 3 percent. There exists tremendous room for improvement in advancing incentives to attract more skilled immigrants by targeting visas and simplifying the current process of receiving work authorizations. Moreover, the maximum of 15 percent of workers of a firm that can be foreigners is a restriction that should be removed.
Globalization
Chile has free trade agreements with most of the major economies in the world and recently joined the Comprehensive and Progressive Transpacific Partnership (CPTPP). However, its percentage of high-tech exports remains under 1 percent. In turn, exports of high-quality professional services have exhibited a significant increase in recent years and successive legal reforms have facilitated this development.
Chile has an open and transparent institutional framework to receive foreign investment and the government provides support to be able to manage the corresponding permits to materialize the investment.
The current administration has announced tax and permit management reforms to facilitate the entry of new foreign investment, which should be put in place as soon as possible.[52]
Innovation Capacity
Chile ranks higher than its peers in broadband adoption due to a competitive market of providers. The R&D activity in Chile is like in Peru, Colombia, and Mexico, and reflects the structure of the Chilean economy based on exploitation of natural resources.
The current government is trying to push more investment in R&D, but the incentives proposed are small and incoherent with other policies—such as the significant increase in tax collection that has been discussed recently. Chilean policymakers should consider working toward an easier tax scheme and reduction of firms’ taxes to spur a rising interest in investing in VC.
The government has a program that seeks to increase advanced human capital for the development of science and technology in the country by financing postgraduate scholarships in Chile and abroad for graduates or professionals demonstrating academic excellence. Graduates are mainly incorporated into universities, and it is desirable that there is more hiring in private companies.
Ten years ago, a reform was implemented that created a digital platform to create a company in one day and at no cost. However, it is still necessary to reduce the bureaucracy in other kinds of authorizations that are necessary to run a business, such as those required by local governments.
On the other hand, the disparity in carbon efficiency among the regions reflects the main industries in each region and the availability of renewable sources of energy. Chile has a real chance to be an important player in the green hydrogen industry and remain an important producer of copper and lithium, which are key elements to the energy transition. However, there are bottlenecks in lithium production and the green hydrogen strategies that the government needs to solve soon to take advantage of its benefits.
Chile has free trade agreements with most of the major economies in the world and recently joined the Comprehensive and Progressive Transpacific Partnership (CPTPP).
VC investment has experienced remarkable growth in recent years. The VC funds, the number of deals, and success stories are increasing, and each year the VC ecosystem in Chile consolidates and expands. This has allowed the creation and development of great opportunities, recently highlighting several startups that are raising rounds at high valuations—including a couple of unicorns—reflecting an explosive and unprecedented growth for Chile.
It is very important to promote the participation of institutional investors in local private investment funds without the current restrictions. Chile should transition from the current intensive scheme of governmental contributions to a system where private investment is encouraged, but also allow private pension funds—among other institutional investors—to be released from regulatory restrictions and have the incentives to invest in VC.
Colombia
Knowledge Economy
Colombia faces low levels of access to tertiary education among its population. This issue is a direct consequence of the significant challenge of expanding the tertiary educational coverage in Colombia. Particularly, this has led to the concentration of the educated population in a few cities in Colombia. This can be seen in regions like Bogotá, Atlántico, Valle, and Antioquia. This challenge might be addressed through public policies aimed at allocating a larger budget for education in regions away from major cities. This will help generate a larger pool of professionals for the labor market.
Additionally, there is a need to enhance skills in STEM, bilingualism, and technology-focused education for the Fourth Industrial Revolution. On that note, it is crucial to update the curriculums at all levels of education in the country to guarantee that human capital has the skills required to promote innovative business, as well as the required capacities for the future labor market. Moreover, it must be central to the education policy of the country adopting municipal and departmental strategies to promote access to education.
Furthermore, promoting the acquisition of digital skills among the entire population is required to narrow the digital divide and enable universal access to information and communications technology (ICT) for all Colombians. This would allow for a more vibrant and dynamic digital ecosystem.
Finally, policies offering incentives for R&D are essential to retain and expand the number of individuals engaged in R&D in the country. Individuals involved in R&D must come not only from academia and government but also from private companies that contribute to the country’s economic growth.
Globalization
Colombia is a major exporter of raw materials—which often lack added value—resulting in high-tech exports not being a prominent category in the economy. Policymakers should focus efforts on diversifying exports and incentivizing producers and exporters through favorable fiscal measures. On that note, it is key to strengthen legal certainty and harmonize legal frameworks related to the proper development of the country’s business activities. This is especially true for tax laws, which are constantly undergoing changes that affect the competitiveness of the country. Additionally, when such modifications should occur, it is crucial to coordinate them with all the actors of the ecosystem to build trust and attract foreign investment and talent.
Technology exports are concentrated in some cities, which leads to very low levels of high-tech exports for the rest of the country. Therefore, it is crucial to undertake policies to provide less-developed regions of the country with more financing and strategies to promote the production of technology products and services. Also, it is important to strengthen the financing of tech startups to boost the entrepreneurship ecosystems in the country as well as to create frameworks that incentivize VC investments to contribute to the economy with foreign capital flows.
Innovation Capacity
Despite not having highly favorable productivity levels, Colombia has been making a positive leap in allocating resources for R&D, as evident from the indicators, showing consistent R&D intensity across all regions of the country, even in areas with greater educational, economic, and social disparities. Therefore, it should remain a priority for policymakers to incentivize innovation capacity.
Regarding Internet service penetration, there still are some regions that have very low penetration rates, and millions of people that are not yet connected. To tackle this, it is crucial to urge the government to continue promoting the proper development of connectivity through robust policies that facilitate effective spectrum allocation, efficient rolling out of telecom infrastructure, and optimal development of new technologies such as 5G.
Additionally, it is fundamental to enhance the ICT business environment and promote related research by encouraging research and adopting new, more efficient models and operations using ICT—such as AI, IoT, machine learning, and cloud, among others. This will lead to more-innovative industries providing competitive products and services across sectors.
Mexico
Knowledge Economy
Mexico’s progress toward a knowledge-based economy can gain momentum through all-encompassing reforms centered on enhancing and cultivating skills. This can be achieved by adopting a triple helix approach that fosters collaboration among the public, private, and academic sectors. The education and labor regulatory frameworks and policies in Mexico, both at the federal and local levels, must transition toward a forward-looking perspective that anticipates the future skill demands for burgeoning markets heavily reliant on manufacturing, engineering, and technology.
To strengthen the Mexican education system, it’s crucial to not only bolster STEM teaching methodologies across all educational levels but also to recognize the significance of nurturing both soft skills and technical prowess. This can be achieved through investments in teacher training, curriculum refinement, and the allocation of resources to facilitate hands-on learning opportunities. Moreover, forging symbiotic partnerships between universities and industry holds immense potential to cultivate practical learning environments that are finely attuned to the evolving demands of markets. A transformative approach involves embracing a dual education system that seamlessly melds classroom instruction with real-world work exposure, effectively bridging the gap between academic knowledge and the ever-evolving needs of the market. This holistic strategy not only equips students with technical acumen but also empowers them with vital soft skills, thereby propelling them toward fulfilling careers in a rapidly changing professional landscape. To achieve this, it is important to consider encouraging private sector involvement in education through incentives and formal partnerships.
In addition, Mexico needs to enhance its entrepreneurial ecosystem, which involves revitalizing public programs, primarily focusing on: 1) facilitating access to funding; 2) streamlining bureaucratic hurdles at federal, state, and municipal levels; and 3) enhancing taxation and compliance procedures, along with reinforcing frameworks for property rights enforcement and protection. Combining policies for improving conditions for startups and access to skilled talent will consolidate existing hubs and encourage risk-taking for the creation of new ones.
Furthermore, it is advisable to attract and retain skilled talent by implementing immigration policies that streamline the entry of international professionals and researchers.
Globalization
Mexico’s globalization strategy should focus on strengthening regional collaborations and expanding its presence in international markets. Bolstering partnerships with neighboring countries and regional alliances, like the Pacific Alliance and the CTPP, will enhance trade and cooperation. Specifically, Mexico should not only strengthen regional collaborations and expand its international market presence but also strategically leverage its geographical proximity. To integrate nearshoring effectively into Mexico’s development strategy, coordination among all levels of government is crucial. Subnational governments play a pivotal role in ensuring essential factors such as a skilled workforce, alignment with local social contexts, and the prevention and mitigation of supply chain and political risks.
Additionally, existing trade agreements, such as the U.S.-Mexico-Cananda Free Trade Agreement (USMCA) and the EU-Mexico Agreement, represent key platforms to increase exports, attract foreign investment, and promote technology transfer. Mexican policymakers must develop targeted policies to support Mexican startups in entering global markets, providing them with resources and guidance to navigate international expansion. Policymakers should also foster collaborations in key sectors such as manufacturing, automotive, electronics, aerospace, and renewable energy to tap into global value chains.
To position itself as a regional and global trade hub, Mexico must strategically strengthen and invest in logistics and infrastructure, while also enhancing the local rule of law. This will create an appealing environment for foreign investments and streamlined trade operations. This comprehensive strategy will enhance both subnational and national economic competitiveness, ultimately elevating Mexico’s stature in the international trade arena.
Innovation Capacity
To amplify innovation capacity, Mexico should prioritize policies that incentivize research and development, foster the articulation of stakeholders, and cultivate a culture of innovation. Mexico must incorporate a gender and social inclusion cross-cutting approach in these efforts, ensuring that all individuals have equal opportunities to contribute and benefit from an innovation ecosystem.
Mexican policymakers should enhance both public and private investment in R&D by introducing compelling tax incentives, reactivating grants to support research, and funding avenues to support inventive ventures. Since the public institutional framework at the federal level has changed in terms of its scope and support for innovation, it is necessary to leverage and strengthen the existing mechanisms at the state level, as well as promote the engagement of these subnational stakeholders within the existing innovation ecosystem.
Mexican policymakers should enhance both public and private investment in R&D by introducing compelling tax incentives, reactivating grants to support research, and funding avenues to support inventive ventures.
Moreover, Mexican policymakers should bolster the safeguarding of intellectual property rights and data protection to not only protect inventions but also cultivate an environment that stimulates the commercialization of cutting-edge technologies for the development of Mexico’s key economic sectors. Mexico must also establish decentralized dynamic innovation clusters and hubs—beyond Mexico City—that serve as vibrant convergence points for academia, research institutions, industry, and startups, nurturing a fertile ground for sharing knowledge and catalyzing cross-industry cooperation.
To bridge the academia-industry divide, Mexican policymakers should cultivate mechanisms that forge robust stakeholder engagement, nurturing collaborative projects and the seamless transfer of technology know-how. Simultaneously, policymakers should make strategic investments in digital infrastructure and initiate comprehensive digital literacy initiatives to ensure universal access to information and communication technologies. This proactive step opens the doors for broader participation, enabling diverse individuals to participate in the innovation ecosystem and contribute to Mexico’s advancement.
Peru
Knowledge Economy
One of the main challenges that Peru faces in promoting an adequate innovation ecosystem is related to the still-inadequate levels of human capital in its labor force, which limits its performance in the dimension of the knowledge economy. The origins of these gaps can be traced from very high levels of anemia and malnutrition of the population under five years of age, and—during school years—to low educational performance in language and mathematics. Therefore, from a structural point of view, the first line of action to solve the gap is to promote effective policies for early childhood development and the improvement of educational quality in schools.[53] Likewise, it will be important to solve the problem of heterogeneity in the quality of technical and university education, especially to shorten the gaps between the capital and the provinces and public and private centers. In this way, beyond the quantity of PTS employment—where Peru is not doing badly in relative terms—it will be possible to strengthen the quality of PTS employment as well. For this, it is necessary to advance on several priority fronts, for example, promoting technical education in the last years of secondary school, strengthening the accreditation process of higher education institutions, institutionalizing solutions that contribute to the progressive closing of the gap between the training offer and labor demand, and promoting financing solutions (e.g., scholarships and/or educational loans).[54]
In this context, Peru has not yet been able to take advantage of the fact that, as part of the massive Venezuelan migration, a significant number of foreigners with high levels of qualification have arrived, which can be used to solve training gaps in specific sectors. However, for this to happen, it is a priority to adapt the institutional and legal framework to address migration, expand reception capacity—especially in areas with the highest concentration of migrant and refugee populations—with appropriate sectoral and cross-cutting policies. Peru also needs to mitigate risks and vulnerabilities that this process entails for the migrant and refugee populations, including the challenges of social and cultural integration, and challenges of gender discrimination. Peru also needs to build a social pact within Peru and with other countries for a more effective, social, and sustainable integration.[55] In addition, beyond the Venezuelan influence, initiatives designed to attract talent—foreign or repatriated—can begin to be put into practice, facilitating work permit procedures or special tax measures for non-residents within a framework of inter-institutional agreements that involve academia, the public, and the private sector.
One of the main challenges that Peru faces in promoting an adequate innovation ecosystem is related to the still-inadequate levels of human capital in its labor force, which limits its performance in the dimension of the knowledge economy.
Finally, another priority front pertains to the high level of informality in the country, which reflects productivity problems in the labor force and the competitiveness of firms. Beyond the extreme result of Moquegua, the levels of labor productivity specifically in the industrial sector are still low. All this limits the possibilities of investment both in worker training and investment in innovation and technology. For this reason, in addition to policies that reinforce the construction of human capital, it is important to promote a friendlier legal and institutional environment with the creation of formal jobs, to advance active labor policies that promote youth labor insertion and job training, and to attend to the still high productive heterogeneity by facilitating the adoption of technologies, especially in the medium- and small-enterprise (SME) segment.
Globalization
Over recent decades, Peru has been characterized by implementing trade opening policies and attracting foreign direct investment. However, to reinforce the globalization pillar, it is necessary to deepen these strategies so that they favor the productive diversification of the country and the expansion of high-value exports. In this sense, regarding the exportable supply, transversal policies become important: including:
▪ market opening, including compliance with international standards;
▪ sectoral policies, for example, public-private coordination spaces and promotion of strategic sectors with special labor and tax regimes; and
▪ specialized policies, to gain efficiencies in logistics services, administrative simplification, and digitization.[56]
Likewise, it is important to reinforce the role of the investment promotion agency to promote investment in areas of science, innovation, technology, and development; complemented with measures to improve the business environment in the country. The latter involves resuming the path of economic growth, but also through certain specific measures, such as institutionalizing regulatory quality and impact studies and solving critical bureaucratic barriers in R&D sectors.[57]
Innovation Capacity
One of the indicators where Peru shows adequate performance in relative terms is in the creation of companies. However, it is important to consider that due to the nature of the Peruvian labor market, many of these companies correspond to precarious or subsistence enterprises. For this reason, the results should not distract from the efforts that are still necessary to reinforce the competitiveness and productivity of the SME segment previously mentioned.
On the other hand, the performance in terms of R&D—including patent applications—is quite modest. This occurs due to existing distortions in the R&D ecosystem, where initiatives act in a disjointed manner, financing is insufficient, capacities are very limited, and there is a low participation of universities in the generation of new technologies for the productive sector. For this reason, it is necessary to advance in three priority axes. First, in the governance and institutional framework of the innovation system, avoiding the dispersion of initiatives based on an articulating approach between different actors and government levels. Second, increase the level of investment in R&D with a balanced participation of the various areas of knowledge in public financing. Third, promote the allocation of resources with an emphasis on strengthening science, technology, and innovation capacities.[58] One of the important reforms that are under debate in Peru is the creation of the Science and Technology Ministry to overcome the problems mentioned as well as the strengthening of the Productive, Innovation and Technological Transfer Centers—CITE, in Spanish.
The above initiatives should also be complemented by efforts at two levels. On the one hand, promoting digitization, and second, the adoption of more environmentally friendly technologies. In the first case, several initiatives stand out, such as, for example, promoting national and regional projects that allow the expansion of fiber optic networks, promoting greater adoption of 4G and 5G technologies, and reinforcing regulation, especially in what corresponds to the guarantee of reliable Internet connections. Strengthening monitoring and supervision procedures is crucial here to advance digitization of Peru’s states as well as the adoption of a digital transformation policy at the national level.[59] In the second case, a priority aspect is to advance in the transformation of the country’s energy matrix and accompany the technological changes driven by the private sector in critical sectors—agroindustry and mining.
United States
Knowledge Economy
To bolster the United States’ innovation ecosystem and global competitiveness, a comprehensive policy approach is recommended. Firstly, the U.S. government must direct a substantial increase in funding for R&D toward universities, research institutions, and private sectors. Concurrently, a renewed emphasis on STEM education at all levels is imperative to cultivate a proficient and adaptable workforce. Introducing immersive technologies into classrooms has the potential to make the U.S. education system more effective, but before these technologies are deployed in schools, the federal government should increase R&D investments in key areas that need further research.[60] Additionally, the United States should streamline the immigration process for STEM professionals through the implementation of fast-track visas, green cards, and accessible pathways to permanent residency and citizenship. To ensure a resilient workforce, the United States must establish targeted programs for workforce training and reskilling, enabling professionals to stay relevant amidst technological advancements. For instance, the United States should establish a National Robotics Strategy Committee similar to Australia’s, while revising education standards, preparing students for workplaces with robotics, and supporting workers affected by automation.[61] Simultaneously, investments in advanced manufacturing technologies, such as automation, robotics, and additive manufacturing, could not only enhance manufacturing productivity but also generate high-tech job opportunities. Finally, fostering global collaboration by partnering with international counterparts on research initiatives, knowledge exchange, and talent mobility would expand access to a diverse pool of expertise, propelling the nation’s innovation capacity to new heights.
Globalization
The U.S. government should set a strategic policy framework focused on increasing high-tech exports and attracting FDI to elevate the United States’ innovation competitiveness on the global stage. The United States must focus in particular on attracting greenfield as opposed to brownfield investment. The U.S. government should also implement targeted initiatives to promote the export of high-tech products and services, including streamlined export procedures, financial incentives, and trade missions that highlight the nation’s technological prowess. Concurrently, the United States should adopt a proactive approach to attract FDI by offering attractive incentives, simplified regulatory processes, and enhanced investor protections. By fostering an environment conducive to high-tech exports and foreign investment, the United States can harness the power of international collaboration and propel its innovation ecosystem to unparalleled heights, solidifying its position as a global leader in cutting-edge technologies and industries. The federal government should avoid export policies that limit sales of U.S. high-tech products to civilian and commercial actors in China, as U.S. high-tech companies need access to large markets at scale and, moreover, every $1 a U.S. semiconductor firm (for example) earns in China is one that a Chinese competitor does not.[62]
Funding for initiatives advanced in the CHIPS and Science Act, such as the critically important regional innovation hubs program, should be fully advanced in Biden administration budget proposals and Congressional budgeting reality.
Innovation Capacity
The United States should implement several policies to bolster its innovation capacities. First, bolstering investment in education and research is imperative, involving increased funding for R&D across universities, research institutions, and private sectors. To catalyze innovation, the government should nurture a robust collaboration between academia and industry through partnerships, enabling seamless knowledge transfer and technology commercialization. The National Science Foundation’s Technology, Innovation, and Partnerships (TIP) program should focus on 1) Artificial intelligence, machine learning, autonomy, and related advances; 2) High-performance computing, semiconductors, and advanced computer hardware and software; 3) Quantum information science and technology; 4) Robotics, automation, and advanced manufacturing; 5) Biotechnology, medical technology, genomics, and synthetic biology, and 6) advanced materials science.[63] The TIP should also focus on industry-relevant research with high technology readiness levels (TRLs) from the early stage because it avoids spillover of the value-added to other nations.[64]
The Biden administration should further build out the Manufacturing USA Network of Manufacturing Innovation Institutes and ensure that it achieves its promised goal of tripling funding for the Manufacturing Extension Partnership program. Funding for initiatives advanced in the CHIPS and Science Act, such as the regional innovation hubs program, should be fully advanced in Biden administration budget proposals and Congressional budgeting reality.
Moreover, supporting startups and entrepreneurship demands the creation of an enabling ecosystem, entailing grants, tax incentives, and access to venture capital, alongside the establishment of innovation hubs and accelerators. While some support for high-growth technology-intensive companies, such as the Small Business Innovation Research program is absolutely warranted, overall U.S. innovation policy should seek to be size neutral, in part because, to compete successfully in global markets in advanced-technology industries, size and scale matter.[65] Strategic infrastructure investment, encompassing modernization of transportation networks, energy grids, and digital connectivity, can attract and retain skilled talent and businesses. To incentivize innovation further, boosting R&D tax incentives and reinforcing intellectual property protection are crucial steps. By providing R&D grants, fostering public-private partnerships, streamlining regulations, and ensuring robust data privacy and security measures, the United States can create an environment conducive to innovation-driven economic growth. A first step in boosting R&D in the pharmaceutical industry is to reverse the Inflation Reduction Act’s pharmaceutical pricing provisions that compel pharmaceutical companies to negotiate prices with the Department of Health and Human Services on the most popular Medicare Part D branded drugs.[66] The federal government must also step up its game in defense of a more-robust global IP regime to spur U.S. competitiveness, support American jobs, and advance innovation. To strengthen domestic policies, U.S. policymakers should adopt website-blocking legislation, improve public engagement and education about IP, and stop trying to weaken the Bayh-Dole Act by advocating for the use of march-in rights to control drug prices.[67]
Conclusion
As countries continue to move forward through the 21st century, they ought to adopt new policies aimed at improving their international competitiveness in the innovation economy. In the case of Latin American countries, these policies are crucial for advancing beyond middle-income status. Due to regional disparities within countries, national-level policymakers must consider targeted policies for local-specific challenges. This is especially the case regarding greenhouse gas emissions in Latin America. Countries should also develop their competitive capabilities in knowledge-based and technologically advanced industries via a variety of policies. These include but are not limited to, investment in STEM education, incentivizing R&D spending, ensuring a proper patent system, and attracting high-skilled foreign professionals and foreign investment. This report has highlighted 13 different indicators which together help to measure subnational competitiveness in the innovation economy. By analyzing this index, policymakers can gain suggestions on the specific policies they should pursue, with special attention to underdeveloped or lagging regions.
Appendices
Appendix A: Composite and Category Scores Methodology
For each indicator, regions’ scores were converted to a standardized score, which was capped at ±3 to avoid an outlier performance on a single indicator from too heavily influencing the composite score. For composite and category scores, a weighted-average capped standardized score (WACSS) was calculated for each indicator, wherein the weights used are those listed in the table below (normalized such that an indicator’s applied weight is equal to its listed weight divided by the sum of the listed weights—i.e., applied weights sum to one). For the composite score, this was calculated by including all indicator weights; for the category scores, this was done by including only the weights for the indicators that fall under that category. WACCS are rescaled to a 100-point scale via min-max normalization, in which the “maximum” parameter is the maximum WACCS plus one-quarter standard deviation of WACCS, and the “minimum” parameter is the minimum WACCS minus one-quarter standard deviation of WACCS.
Mathematically, the WACCS of region ![]() is calculated as:
is calculated as:
![]()
wherein ![]() denotes the indicator,
denotes the indicator, ![]() denotes the capped standardized score for region
denotes the capped standardized score for region ![]() in indicator
in indicator ![]() , and
, and ![]() is the applied weight of indicator
is the applied weight of indicator ![]() , defined as:
, defined as:
![]()
such that ![]() .
.
The scaled score for region/UT ![]() is then calculated as:
is then calculated as:

Appendix B: Indicator Methodologies and Weights
Table A1: Indicator weights and descriptions
|
Indicator |
Weight |
Year |
Description |
Category |
|
Broadband Adoption |
0.50 |
2019 |
Share of households subscribing to broadband Internet |
Innovation Capacity |
|
Business Creation |
0.50 |
2016–2018 |
Enterprise birth rate in share of employer enterprises |
Innovation Capacity |
|
Carbon Efficiency |
0.50 |
2018 |
Metric tons of CO2e emitted per $10,000 of PPP-adjusted GDP |
Innovation Capacity |
|
High-Tech Exports |
0.75 |
2017 |
Exports in NACIS codes 333–335 (or equivalent) as a share of GDP |
Globalization |
|
Highly Educated Population |
0.75 |
2019 |
Share of 25–64-year-old population with a bachelor’s degree (or equivalent) or higher |
Knowledge Economy |
|
Inward FDI |
0.75 |
2017–2019 (average) |
FDI inflow as a share of GDP |
Globalization |
|
Manufacturing Labor Productivity |
1.25 |
2019 |
PPP-adjusted GVA per worker in the manufacturing sector |
Knowledge Economy |
|
Patent Applications |
1.25 |
2015 |
PCT patent applications per million residents |
Innovation Capacity |
|
Professional, Technical, and Scientific Employment |
1.25 |
2019 |
Share of employees in professional, technical, and scientific activities sector |
Knowledge Economy |
|
R&D Intensity |
1.50 |
2019 |
R&D expenditures as a share of GDP |
Innovation Capacity |
|
R&D Personnel |
1.50 |
2017, 2018 |
R&D personnel as a share of total employees |
Innovation Capacity |
|
Skilled Immigration |
0.50 |
2019 |
Share of population that is foreign born and has at least some tertiary education (ISEC 5–8) |
Knowledge Economy |
|
Venture Capital Received |
1.00 |
2017–2019 (average) |
Venture capital investments received as a share of GDP |
Innovation Capacity |
Appendix C: Estimation Methodologies
Estimating Unavailable Data
Subnational-level data was not available for all indicators and countries. To bridge this gap, we used available proxy indicators that are available on the subnational level, and we assumed that they correlate with the original indicator. For instance, if high-tech exports are only available on a national level but not on a subnational level, while all exports are available on a subnational level too, then it is possible to estimate the amount of subnational high-tech exports by using the distribution of all exports across regions. The national-level high-tech export data ensures that the estimated regional high-tech export measures are in line with the national performance. These estimations allow for capturing parts of the innovation competitiveness metrics of regions despite the unavailability of the exact original indicator.
Subnational data was not available for Mexico and Chile for the high-tech exports indicator and for Chile, Colombia, and Peru on the FDI indicator.
Innovation Categories
Regions were sorted into eight innovation competitiveness categories: modest innovator -, modest innovator +, moderate innovator -, moderate innovator +, strong innovator -, strong innovator +, innovation leader -, and innovation leader+ based on the regions’ positions in the ranking. The number of regions in each category was selected to be 23 to place an equal number of regions in each category given that there are 182 regions in total. The minus sign in the name of the category indicates that its regions fall into a lower category than those regions that are in the respective category with a positive sign. As the colors of the charts indicate, the categories’ ascending order is modest innovator, moderate innovator, strong innovator, and innovation leader, in line with the rankings in the European Innovation Scorecard.
Acknowledgments
The authors would like to thank Stephani Maita Uría at Macroconsult, Yohnny Campana at Macroconsult, Ana Sanchez at Columbian Chamber of IT and Telecoms, Ulisses Monteir Ruiz De Gamboa at the Mackenzie Center for Economic Freedom, and Julian Alexienco Portillo at Mackenzie Center for Economic Freedom for their contributions to this report.
About the Authors
Viktor Lazar is a policy fellow for global innovation policy at ITIF and a researcher at MCC’s Centre for Next Technological Futures in Hungary.
Ian Tufts is a technology and economic policy analyst at ITIF.
Stephen Ezell is vice president for global innovation policy at ITIF and director of ITIF’s Center for Life Sciences Innovation. He also leads the Global Trade and Innovation Policy Alliance.
Carolina Agurto is partner of Fundación IDEA and supervises the execution of projects and research regarding innovation, science, and technology among other subjects.
Alvaro Monge is partner of Macroconsult and a specialist in applied economic research, quantitative methods, economic development.
Germán López Ardila is legal and regulatory affairs director at Columbian Chamber of IT and Telecoms.
Ana Sanchez was a senior researcher at TicTac.
Vladimir Fernandes Maciel is coordinator of the Mackenzie Center for Economic Freedom
Pablo Eguiguren is director of public policy at Libertad y Desarrollo.
About GTIPA
The Global Trade and Innovation Policy Alliance (GTIPA) is a global network of independent think tanks that are ardent supporters of greater global trade liberalization and integration, deplore trade-distorting “innovation mercantilist” practices, but yet believe that governments can and should play important and proactive roles in spurring greater innovation and productivity in their enterprises and economies. Visit gtipa.org.
Endnotes
[1]. The World Bank, “Population, total - Latin America & Caribbean, World,” https://data.worldbank.org/indicator/SP.POP.TOTL?locations=ZJ-1W.
[2]. Alejandra Bernal, Jeorg Husar, and Johan Bracht, “Latin America’s Opportunity in Critical Minerals for the Clean Energy Transition,” (International Energy Agency, April 2023), https://www.iea.org/commentaries/latin-america-s-opportunity-in-critical-minerals-for-the-clean-energy-transition.
[3]. Caitlin Purdy and Rodrigo Castillo, “The Future of Mining in Latin America: Critical Minerals and the Global Energy Transition” (Brookings Institution, July 2022), https://www.brookings.edu/wp-content/uploads/2022/07/GS_07072022_LTRC-Future-Mining-Latin-America.pdf.
[4]. The World Bank, “Population, total – World,” https://data.worldbank.org/indicator/SP.POP.TOTL?locations=1W.
[5]. Robert D. Atkinson, “Why Federal R&D Policy Needs to Prioritize Productivity to Drive Growth and Reduce the Debt-to-GDP Ratio” (ITIF, September 2019), https://www2.itif.org/2019-federal-rd-productivity.pdf.
[6]. The World Bank, “Research and development expenditure (% of GDP) - Latin America & Caribbean, OECD members, United States,” https://data.worldbank.org/indicator/GB.XPD.RSDV.GD.ZS?locations=ZJ-OE-US.
[7]. Jorge Tello Gamarra et al., “Innovation studies in Latin America: a bibliometric analysis,” Journal of Technology Management & Innovation Vol. 13, No. 4 (November 2018), 24–36, http://dx.doi.org/10.4067/S0718-27242018000400024.
[8]. World Intellectual Property Organization (WIPO), “Global Innovation Index 2022, 15th Edition” (WIPO, 2022), https://www.wipo.int/publications/en/details.jsp?id=4626&plang=EN.
[9]. Robert Atkinson and Stephen Ezell, Innovation Economics: The Race for Global Advantage (New Haven, Connecticut: Yale University Press, 2012): 123–126, https://doi.org/10.1007/978-1-4614-4349-0_24.
[10]. Viktor Lázár et al. “The Transatlantic Subnational Innovation Competitiveness Index,” (ITIF, November 2022), https://itif.org/publications/2022/11/14/the-transatlantic-subnational-innovation-competitiveness-index/.
[11]. Authors’ calculation. For further information please see our methodology in the Appendices section.
[12]. Two of the eight groupings had 22 instead of 23 regions included, so as to get to 182.
[13]. Authors’ calculation. For further information please see our methodology in the Appendices section.
[14]. “Essential Skills Are in Demand, But Lacking,” Council for Aid to Education, https://cae.org/evidence/.
[15]. Ali Quazi and Majharul Talukder, “Demographic Determinants of Adoption of Technological Innovation” Journal of Computer Information Systems No. 51 (March 2011), 38–46, https://www.researchgate.net/publication/285705399_Demographic_determinants_of_adoption_of_technological_innovation.
[16]. Luke Dascoli and Stephen Ezell, “The North American Subnational Innovation Competitiveness Index” (ITIF, June 2022), https://www2.itif.org/2022-north-american-index.pdf; National survey of households (Enaho) (Share of 25–64-year-old population with a bachelor’s degree (or equivalent) or higher, 2022, accessed August 8, 2023); Elaboración propia en base a Encuesta CASEN 2020, Ministerio de Desarrollo Social y Familia (% of 25 to 64 years old with bachelor degree or higher, 2020, accessed June 20, 2023); Ministry of Education, Graduates in higher education (Graduate population of a bachelor’s degree or higher, 2019, accessed June 1, 2023); DANE, Population projections (Population projections at the departmental level, 2019, accessed June 1, 2023); OECD Stats, Education (Total tertiary education ISCED levels 5 to 8, 2019, accessed June 20, 2023); Brazil Census Data 2010 - IBGE (Instituto Brasileiro de Geografia e Estatistica) (Share of 25–64-year-old population with a bachelor’s degree (or equivalent) or higher), 2010, accessed August 17, 2023).
[17]. Ibid.
[18]. Adams Nager et al., “The Demographics of Innovation in the United States” (ITIF, February 2016), https://www2.itif.org/2016-demographics-of-innovation.pdf.
[19]. Tina Huang, Zachary Arnold, and Remco Zwetsloot, “Most of America’s ‘Most Promising’ AI Startups have Immigrant Founders” (Georgetown University website, October 2020), https://cset.georgetown.edu/publication/most-of-americas-most-promising-ai-startups-have-immigrant-founders/.
[20]. Vivek Wadhwa, “America’s New Immigrant Entrepreneurs” (Duke School of Engineering and UC Berkely School of Information, January 2007), https://people.ischool.berkeley.edu/~anno/Papers/Americas_new_immigrant_entrepreneurs_I.pdf.
[21]. Giovanni Peri, Kevin Shih, and Chad Sparber, “Foreign STEM Workers and Native Wages and Employment in U.S. Cities” (NBER Working Paper Series, no. 20093, May 2014), https://www.nber.org/system/files/working_papers/w20093/w20093.pdf.
[22]. Dascoli and Ezell, “The North American Subnational Innovation Competitiveness Index”; Estimated from the National survey of households (Enaho); Estimated from the Survey of the Venezuelan population (Enpove) (Share of population that is foreign born and has at least some tertiary education (TE), 2022, accessed August 8, 2023); Elaboración propia en base a Encuesta CASEN 2020, Ministerio de Desarrollo Social y Familia (Share of population that is foreign born and has at least some tertiary education (ISEC 5–8), 2020, accessed June 23, 2023); OECD, Regions and Cities Database (Share Tertiary educated in foreign-born population (25-64), 2019, accessed May 10, 2023); Brazil Census Data 2010 - IBGE (Instituto Brasileiro de Geografia e Estatistica) (Share of population that is foreign born and has at least some tertiary education (incomplete university degree), 2010, accessed August 17, 2023).
[23]. Ibid.
[24]. Dascoli and Ezell, “The North American Subnational Innovation Competitiveness Index”; National survey of households (Enaho) (Share of employees in professional, technical, and scientific activities sector, 2022, accessed August 8, 2023); OECD Stat. (Professional, scientific and technical activities, 2008-2021, accessed July 12, 2023) https://stats.oecd.org/index.aspx?queryid=3491; DANE, Large Integrated household survey (Employed population according to branch of activity, 2019, accessed May 10, 2023); DANE, Large Integrated household survey (Employed population, 2019, accessed May 10, 2023); Ministry of Labor and Employment, Brazil - Social Information Annual Report (RAIS), (Share of employees in professional, technical, and scientific activities sector, 2021, accessed August 17, 2023).
[25]. Ibid.
[26]. BLS, “Quarterly Census of Employment and Wages (labor productivity and costs),” http://www.bls.gov/cew/.
[27]. Dascoli and Ezell, “The North American Subnational Innovation Competitiveness Index”; National survey of households (Enaho), National Institute of Statistics and Informatics (INEI), World Bank (PPP-adjusted GVA per worker in the manufacturing sector, 2022, accessed August 8, 2023); OECD Stat. (GVA Million USD constant prices, constant ppp, 2018, accessed June 23, 2023) https://regions-cities-atlas.oecd.org/subarea/TL2/CHL/x/REGION_ECONOM-GVA_IND_TOTAL-REAL_PPP/2018; OECD Stat. (GVA Million USD constant prices, constant ppp in manufacturing, 2018, accessed June 23, 2023) https://regions-cities-atlas.oecd.org/subarea/TL2/CHL/x/REGION_ECONOM-GVA_IND_10_VC-GVA_SH/2018; OECD Stat. (Employment, 2018, accessed June 23, 2023) https://regions-cities-atlas.oecd.org/subarea/TL2/CHL/x/REGION_ECONOM-EMP_IND_TOTAL-PER/2018; OECD Stat. (Workers in manufacturing, 2018, accessed June 23, 2023) https://regions-cities-atlas.oecd.org/subarea/TL2/CHL/x/REGION_ECONOM-EMP_IND_10_VC-PER_SH/2018; DANE, GDP by department (Value added secondary activities, 2019, accessed June 1, 2023); DANE, Large integrated household survey (Employed population according to branch of activity, 2019, accessed June 1, 2023); Fundação Getulio Vargas (FGV) - Observatório da Produtividade Régis Bonelli; World Bank (PPP-adjusted GVA per worker in the manufacturing sector, 2020, accessed August 17, 2023). The department of Moquegua is omitted from the charts as it is an outlier because of a major local mining project that would bias the results.
[28]. Ibid.
[29]. Dascoli and Ezell, “The North American Subnational Innovation Competitiveness Index”; Superintendence of Customs and Tax Administration (Sunat), National Institute of Statistics and Informatics (INEI) (Exports in NACIS codes 333–335 (or equivalent) as a share of GDP, 2022, accessed August 8, 2023); Banco Central de Chile (High-Tech Exports, 2017, accessed June 28, 2023) https://si3.bcentral.cl/Siete/ES/Siete/Cuadro/CAP_BDP/MN_BDP42/BP6M_EXP_CUCI/BP6M_EXP_CUCI?cbFechaInicio=2013&cbFechaTermino=2023&cbFrecuencia=ANNUAL&cbCalculo=NONE&cbFechaBase=; DANE, DIAN, Exports database, (Exports in manufacture machinery (CIIU 2640) 2017, accessed May 10, 2023); DANE, DIAN, Exports Database, (Exports in manufacture in electronic devices (CIIU 2817, 2819, 2821, 2822, 2823, 2824, 2825,2826, 2829) 2017, accessed May 10, 2023); DANE, GDP by department (GDP by department, 2017, accessed May 10, 2023); Comex Stat. (High Tech Exports, 2020, accessed August 17, 2023).
[30]. Ibid.
[31]. Eduardo Borensztein, Jose De Gregorio, and Jong-Wha Lee, “How Does Foreign Direct Investment Affect Economic Growth?” NBER Working Paper Series, No. 5057 (March 1995), https://www.sciencedirect.com/science/article/abs/pii/S0022199697000330; W.N.M. Azman-Saini, Ahmad Zubaidi Baharumshah, and Siong Hook Law, “Foreign Direct Investment, Economic Freedom and Economic Growth: International Evidence,” Economic Modelling No. 27 (2010): 1079–1089, https://www.sciencedirect.com/science/article/abs/pii/S0264999310000635..
[32]. Dascoli and Ezell, “The North American Subnational Innovation Competitiveness Index”; World Bank (Inward FDI, 2017–2019 (average), accessed June 28, 2023) https://data.worldbank.org/indicator/BX.KLT.DINV.WD.GD.ZS?locations=CL; Banco de la República de Colombia (FDI inflow as a share of GDP, 2022, accessed May 10, 2023); Brazilian Central Bank, Brazilian Institute of Geography and Statistics (FDI, 2020, accessed August 17, 2023).
[33]. Ibid.
[34]. Nina Czernich et al., “Broadband Infrastructure and Economic Growth,” The Economic Journal No. 121 (May 2011), 505–532, https://doi.org/10.1111/j.1468-0297.2011.02420.x.
[35]. Dascoli and Ezell, “The North American Subnational Innovation Competitiveness Index”; National survey of households (Enaho), Telecommunications Investment Supervisory Body (Osiptel) (Share of households subscribing to broadband Internet, 2022, accessed August 8, 2023); OECD Regions and Cities at a Glance 2022 (Broadband Adoption, 2017, accessed June 20, 2023) https://stat.link/kwhi4m; Ministry of ICT, ICT quarterly report (Quarterly information on fixed internet access by department and population, 2019, accessed May 10, 2023); DANE, Housing projections (projections of total occupied dwellings at the departmental level, 2019, accessed May 10, 2023); Anatel (Regulatory Agency) (Broadband Adoption, 2022, accessed August 17, 2023) https://informacoes.anatel.gov.br/paineis/acessos/banda-larga-fixa.
[36]. Ibid.
[37]. Brown H. Hall, Jacques Mairesse, and Pierre Mohnen, “Measuring the Returns to R&D,” NBER Working Paper Series, No. 15622 (December 2009), https://doi.org/10.1016/S0169-7218(10)02008-3.
[38]. Dascoli and Ezell, “The North American Subnational Innovation Competitiveness Index”; National Institute of Statistics and Informatics (INEI); National Council of Science, Technology and Technological Innovation (Concytec) (R&D expenditures as a share of GDP, 2016, accessed August 8, 2023); OECD Regions and Cities Database (R&D Business, 2015, accessed June 22, 2023) https://regions-cities-atlas.oecd.org/subarea/TL2/CHL/x/REGION_INNOVATION%20-RD_EXP_BUS_SH-../2015; OECD Regions and Cities Database (R&D Government, 2015, accessed June 22, 2023) https://regions-cities-atlas.oecd.org/subarea/TL2/CHL/x/REGION_INNOVATION%20-RD_EXP_GOV_SH-../2015; OECD Regions and Cities Database (R&D Higher Education, 2015, accessed June 22, 2023) https://regions-cities-atlas.oecd.org/subarea/TL2/CHL/x/REGION_INNOVATION%20-RD_EXP_HE_SH-../2015; OECD Regions and Cities Database (R&D Private and Non-profit Sector, 2015, accessed June 22, 2023) https://regions-cities-atlas.oecd.org/subarea/TL2/CHL/x/REGION_INNOVATION%20-RD_EXP_PNP_SH-../2015; DANE, Investment in research and development survey (Intramural R&D spending according to departments where R&D-dedicated units are located, 2021, accessed May 10, 2023); DANE, GDP by department (GDP by department, 2021, accessed May 10, 2023); World Bank (R&D Percentage of Brazilian GDP, 2019, accessed August 17, 2023), https://data.worldbank.org/indicator/GB.XPD.RSDV.GD.ZS?locations=BR.
[39]. Ibid.
[40]. Dascoli and Ezell, “The North American Subnational Innovation Competitiveness Index”; National survey of households (Enaho); National Council of Science, Technology and Technological Innovation (Concytec) (R&D personnel as a share of total employees, 2016, accessed August 8, 2023); OECD Stat. (R&D personnel by sector and formal qualification (total internal personnel), Annual labour force (in thousands), 2014, accessed July 4, 2023) https://stats.oecd.org/; DANE, Investment in research and development survey (personnel dedicated to intramural R&D during 2021, according to the department where most of the time is spent and role performed, 2021, accessed May 10, 2023); DANE, GDP by department (GDP by department, 2021, accessed May 10, 2023); RAIS; Brazilian Estimative population data 2021 - IBGE (Instituto Brasileiro de Geografia e Estatistica) (Scientific and research development, 2021, accessed August 17, 2023).
[41]. Ibid.
[42]. Dascoli and Ezell, “The North American Subnational Innovation Competitiveness Index”; National Institute for the Defense of Competititon and Protection of Intellectual Property (Indecopi)(PCT patent applications per million residents, 2021, accessed August 8, 2023); OECD Regions and Cities Database (Patent PCT applications per million inhabitants, 2015, accessed June 20, 2023) https://regions-cities-atlas.oecd.org/subarea/TL2/CHL/x/REGION_INNOVATION%20-PCT_MILLION-../2015; Industry and Trade Superintendence, Intellectual Property Statistics (PCT Patents filed, 2015, accessed June 1, 2023); DANE, Population projections (Population projections at the departmental level, 2015, accessed June 1, 2023); Patent request - INPI (Instituto Nacional de Propriedade Industrial, 2021, accessed August 17, 2023); Total Brazilian Residents - IBGE (Instituto Brasileiro de Geografia e Estatística, 2021, accessed August 17, 2023).
[43]. Ibid.
[44]. Dascoli and Ezell, “The North American Subnational Innovation Competitiveness Index”; V National Economic Census of the INEI (2022), National Superintendence of Customs and Tax Administration (Sunat) (Enterprise birth rate in share of employer enterprises, 2022, accessed August 8, 2023); Banco Central de Chile (New firms created by year, 2016-2018, accessed June 28, 2023) https://si3.bcentral.cl/Siete/ES/Siete/Cuadro/CAP_ESTADIST_EXPERIM/MN_EXPERIM01/EST_EXP_DE01/638043681227416561?cbFechaInicio=2013&cbFechaTermino=2023&cbFrecuencia=ANNUAL&cbCalculo=NONE&cbFechaBase=; Banco Central de Chile (Stock of firms by year, 2016-2018, accessed June 28, 2023) https://si3.bcentral.cl/Siete/ES/Siete/Cuadro/CAP_ESTADIST_EXPERIM/MN_EXPERIM01/EST_EXP_DE01/638043681227416561?cbFechaInicio=2013&cbFechaTermino=2023&cbFrecuencia=ANNUAL&cbCalculo=NONE&cbFechaBase=; Confecamaras, Company demographics (Total Stock of companies, 2017, accessed June 1, 2023); Confecamaras, Company demographics (Total of new companies, 2017, accessed June 1, 2023); Ministry of Labor (Number of Employer Firms (Active), 2022, accessed August 17, 2023); Ministry of Labor (Number of Births, 2022, accessed August 17, 2023).
[45]. Ibid.
[46]. Dascoli and Ezell, “The North American Subnational Innovation Competitiveness Index”; OECD Regions and Cities Database (Metric tons of CO2 equivalent, 2018, accessed July 4, 2023) https://regions-cities-atlas.oecd.org/subarea/TL2/CHL/x/REGION_ENV-GHG_TOTAL-../2018; Banco Central de Chile (GPD 2018 (in $ millons), 2018, accessed July 4, 2023) https://si3.bcentral.cl/Siete/ES/Siete/Cuadro/CAP_CCNN/MN_CCNN76/CCNN2018_PIB_REGIONAL_N/637899740344107786; OECD Purchasing Power Parity Indicator (GDP 2018 adjusted PPP (in US$ millions), 2018, accessed July 4, 2023) https://data.oecd.org/conversion/purchasing-power-parities-ppp.htm; OECD, Regions and Cities (Emissions per capita, 2018, accessed May 10, 2023); DANE, Population projections (Population projections at the departmental level, 2018, accessed June 1, 2023); DANE, GDP by department (GDP by department, 2018, accessed May 10, 2023); IBGE (Instituto Brasileiro de Geografia e Estatística); World Bank; Sistema de Estimativas de Emissões e Remoções de Gases de Efeito Estufa (SEEG) do Observatório do Clima (Greenhouse Gas Emissions and Removals Estimates System by the Climate Observatory) (Metric tons of CO2e emitted per $10,000 of PPP-adjusted GDP, 2020, accessed August 17, 2023).
[47]. Ibid.
[48]. Dascoli and Ezell, “The North American Subnational Innovation Competitiveness Index”; National Institute of Statistics and Informatics (INEI), Peruvian Association of Seed and Entrepreneurial Capital (PECAP) (Venture capital investments received as a share of GDP, 2020, accessed August 8, 2023); Asociación Chilena de Venture Capital (Venture Capital Received, 2017–2019 (average), accessed June 28, 2023) https://www.acvc.cl/la-asociacion/; LAVCA, Colombia Venture Capital (Total investment in Venture Capital, 2021, accessed June 17, 2023); KPMG, Colombia Tech Report 2021, (Total Startups by department, 2021, accessed June 17, 2023); DANE, GDP by department (GDP by department, 2021, accessed May 10, 2023); The Brazilian Private Equity & Venture Capital Association (Venture Capital Received, 2020, accessed August 17, 2023).
[49]. Ibid.
[50]. For example, by comparing the results of the 2018 PISA test. The mean of Reading, Mathematics, and Science in Chile are 452, 417, and 444. The average for the OECD countries is 487, 489 and 489.
[51]. According to the World Bank, the GDP per person employed in Chile is $58,254 versus $105,712 presented by the High-Income countries in 2022.
[52]. D. Vasquez and D. Vasquez, “Gobierno lanza nuevo plan para estimular la inversión en el país | InvestChile,” (InvestChile, 2022), https://www.investchile.gob.cl/es/gobierno-lanza-nuevo-plan-para-estimular-la-inversion-en-el-pais/.
[53]. Y. Campana and A. Monge, “Lucha contra la pobreza: evolución reciente y opciones de política. Serie Propuestas de Política del Proyecto Construyendo Diálogo Democrático,” (Consorcio de Investigación Económica y Social (CIES), 2022).
[54]. Consejo Privado de Competitividad (2023) Informe de Competitividad 2023-2024. Peru Compite.
[55]. World Bank, “Una oportunidad para todos: los migrantes y refugiados venezolanos en el Perú,” (World Bank Group and State and Peacebuilding Fund, 2019).
[56]. J. Saavedra, et al., “Importancia de la Apertura Comercial Ruta Peru en Desarrollo Nacional,” (IPAE, 2021).
[57]. Consejo Privado de Competitividad, “Informe de Competitividad 2023-2024,” (Peru Compite, 2023).
[58]. P. Corilloclla, “Promoviendo el desarrollo basado en la ciencia, tecnología e innovación. Documento del Proyecto Perú Debate 2021: propuestas hacia un mejor gobierno,” (CIES, 2021).
[59]. Consejo Privado de Competitividad, “Informe de Competitividad 2023-2024,”
[60]. Juan Londono, “Developing an R&D Strategy to Integrate Immersive Learning Into the Classroom” (ITIF, August 2023), https://itif.org/publications/2023/08/07/developing-an-rd-strategy-to-integrate-immersive-learning-into-the-classroom/.
[61]. Morgan Stevens, “Why Policymakers Should Support Robotic Automation to Solve the Productivity Crunch in Logistics Facilities” (ITIF, June 2023), https://itif.org/publications/2023/06/26/policymakers-should-support-robotic-automation-to-solve-productivity-crunch-in-logistics/.
[62]. Robert Atkinson, “Export Controls Shrink the Global Markets U.S. Semiconductors Need to Survive” (ITIF, July 2023), https://itif.org/publications/2023/07/17/export-controls-shrink-global-markets-us-semiconductors-need-to-survive/.
[63]. Robert Atkinson, “Comments to the National Science Foundation Regarding the Technology, Innovation, and Partnerships (TIP) Directorate” (ITIF, July 2023), https://itif.org/publications/2023/07/06/comments-to-national-science-foundation-regarding-technology-innovation-and-partnerships-directorate/.
[64]. Ibid.
[65]. Robert Atkinson, “The National Economic Council Gets It Wrong on the Roles of Big and Small Firms in U.S. Innovation” (ITIF, July 2023), https://itif.org/publications/2023/07/20/nec-gets-it-wrong-on-roles-of-big-and-small-firms-in-us-innovation/.
[66]. Trelysa Long and Stephen Ezell, “The Hidden Toll of Drug Price Controls: Fewer New Treatments and Higher Medical Costs for the World” (ITIF, July2023), https://itif.org/publications/2023/07/17/hidden-toll-of-drug-price-controls-fewer-new-treatments-higher-medical-costs-for-world/.
[67]. Stephen Ezell, “Losing the Lead: Why the United States Must Reassert Itself as a Global Champion for Robust IP Rights” (ITIF, June 2023), https://itif.org/publications/2023/06/12/losing-the-lead-why-united-states-must-reassert-itself-as-global-champion-for-robust-ip-rights/.
