


Estimated State-Level Employment Impact of Enhancing Federal R&D Tax Incentives
Tax incentives for research and development (R&D) in America are less generous than in comparable countries—and now prevent firms from expensing the full value of R&D investments in the first year. Enhancing R&D tax incentives would create high-paying jobs across the country.
KEY TAKEAWAYS
Key Takeaways
Contents
Policies Under Consideration. 3
Regular and Alternative Simplified Credits 3
R&D Gains From Restoring Full expensing. 4
Changes to the B-Index Subsidy Rate. 4
R&D Gains From Doubling Credit Rates 6
Estimating Forgone Tax Revenue. 6
Estimating the Increase in Business R&D. 6
State-Level Employment Effects 7
Calculating the Change in the B-Index Subsidy Rate. 13
Econometric Model and Results 13
Estimating 2022 State-Level R&D Data. 15
Introduction
Business R&D drives innovation and competitiveness and creates millions of high-paying jobs. Federal R&D tax incentives exist to spur further business investment in R&D and raise R&D expenditures toward their socially optimal rate. However, R&D investment is still well below that optimal level, and U.S. business R&D tax incentives are paltry compared with those in other advanced economies. The recent removal of first-year full expensing of R&D expenditures has only worsened these problems. Increasing the generosity of R&D tax incentives would boost business R&D spending and create jobs in all 50 states plus Washington, D.C.
The purpose of this report is to estimate the employment gains to each state (and Washington, D.C.) under three scenarios:
1. If full expensing of R&D expenditures in the first year is restored.
2. If the statutory rates of the regular credit (RC) and alternative simplified credit (ASC) for qualified research and development expenditures (QRE) are doubled to 28 percent and 40 percent, respectively.
3. If full expensing is restored and the rates are doubled.
This report builds on a 2020 Information Technology and Innovation Foundation (ITIF) report by John Lester and Jacek Warda.[1] To avoid overcomplicating this new report, we only consider hypothetical changes to federal tax incentives and do not consider state-specific policies. Moreover, we report only direct job creation and do not estimate the number of indirect and induced jobs. States’ actual employment gains are therefore understated.
Overall, we estimate that 81,000 direct jobs would be created if full expensing were restored, 188,000 would be created if the credit rates were doubled, and 269,000 would be created if both actions were taken. These jobs are especially desirable because they pay high wages—the median national hourly wage in the Scientific Research and Development Services industry (NAICS 541700) was $48.47 as of May 2021—and have high employment multipliers.[2] The states expected to benefit the most are those with high business R&D intensities—defined as business R&D expenditures as a share of gross domestic product (GDP)—including California, Massachusetts, Michigan, and Washington. But all states are expected to see job creation.
Policies Under Consideration
Full First-Year Expensing
As part of the 2017 Tax Cut and Jobs Act, starting in 2022, U.S. businesses are no longer allowed to fully deduct their R&D expenditures from their taxable income—a practice known as “first-year full expensing.” Instead, they must deduct the expenses according to a 5-year depreciation schedule (and a 15-year schedule for R&D performed abroad). Because of the time value of money and devaluation from inflation, the present real value of the deductions (in the year the expenses are made) is lower; thus, the incentive to invest in R&D is lower.
Regular and Alternative Simplified Credits
The United States provides two primary federal R&D tax credits: the RC and the ASC. These credits provide an incentive to invest in R&D by ultimately lowering the acquisition costs the firms bear by reducing their federal corporate income tax liability.
Under the RC, firms can claim a 20 percent credit on QRE above a “base level,” which is equal to their R&D intensity in the period 1984–1988 times the average of sales in the preceding four years. QRE includes workers’ wages, the cost of certain supplies, and the rental or lease costs of computers and computing services—and they account for almost two-thirds of total business R&D expenditures.[3] There are special rules for calculating base-period R&D intensity if a firm did not exist over the entire 1984–1988 period.[4] If a firm’s current R&D spending exceeds the base level, it can claim a 20 percent tax credit on the difference. However, the base level must be at least half of current-year R&D expenditures. For firms subject to this constraint, each additional dollar spent on R&D raises the minimum base level by 50 cents, so only half the additional dollar is eligible for the 20 percent credit. These firms therefore face an effective marginal credit rate equal to half the statutory rate, or 10 percent.
Alternatively, the R&D ASC lets a firm claim a 14 percent credit on QRE above 50 percent of its base level, which is the firm’s average QRE over the preceding three years. If a firm does not have any R&D expenditures over the last three years, it can instead claim a 6 percent credit on 50 percent of its QRE in that year.
Because the following year’s ASC base increases with an increase in the current year’s expenditures, the effective ASC rate is less than the statutory 14 percent rate. If a firm spends an additional dollar on QRE in the current year (assuming it has already surpassed the 50 percent threshold), it will receive a 14-cent credit. However, its ASC base in each of the following three years will be 33 cents higher than it would be otherwise, and thus it would lose 2.33 cents in credits in each of the following three years (relative to what it would receive otherwise).[5] Assuming a 7.7 percent discount rate, as in Lester and Warda (2020), the present real value of the forgone credits is 6 cents. Therefore, the effective credit is only 8 cents per additional dollar, or 8 percent.
R&D Gains From Restoring Full expensing
We estimate the employment gains from restoring full expensing by first calculating how the policy affects the B-index R&D subsidy rate. We then use a fixed-effects econometric model to estimate a relationship between changes in the subsidy rate and business-funded R&D expenditures for OECD countries. Though we use country-level data, one key assumption going forward is that this relationship also holds at the U.S. state level.
Changes to the B-Index Subsidy Rate
The B-index subsidy rate is defined as one minus the revenue needed to break even on an additional dollar of R&D investment and is estimated assuming full expensing is the norm. That is, absent any other financial R&D incentives, the B-index subsidy rate in a country with full expensing of R&D expenditures is 0 percent. Changing to a 5-year depreciation schedule, firms can only deduct 20 percent of the nominal value of the expenditure per year. Again assuming a 7.7 percent discount rate, firms can now only deduct 86.7 percent of the real present value of the expenditures. With a 21 percent federal corporate income tax rate, this implies a 3.5 percentage-point increase in the B-index subsidy rate from the restoration of full expensing. (See the appendix for a more detailed calculation.)
Econometric Model
Data for the B-index subsidy rate is available for Organization for Economic Cooperation and Development (OECD) countries through the OECD.Stat website. With this data and OECD data on R&D expenditures funded by the business sector in each country, we construct a panel dataset with which we estimate a relationship between the B-index subsidy rate for large, profitable firms and business-funded R&D expenditures. The result is an unbalanced panel dataset for the years 2004 to 2020 for the 33 OECD countries for which at least 10 annual data points are available for each variable. The appendix provides a list of the countries included.
The relationship is estimated using the following fixed effects model:
![]()
where ![]() is the natural logarithm of business-funded R&D expenditures in country
is the natural logarithm of business-funded R&D expenditures in country ![]() in year
in year ![]() ;
; ![]() is the B-index subsidy rate (multiplied by 100) for country
is the B-index subsidy rate (multiplied by 100) for country ![]() in year
in year ![]() ;
; ![]() is the natural logarithm of country
is the natural logarithm of country ![]() ’s GDP in year
’s GDP in year ![]() ;
; ![]() and
and ![]() represent country and year fixed-effects, respectively; and
represent country and year fixed-effects, respectively; and ![]() is the error term.
is the error term.
Results
Table 1 shows the coefficient estimates for the model. Because our model exhibits heteroskedasticity, we report results using robust standard errors. Specifically, a 1 percentage-point increase in the B-index subsidy rate is associated with a 0.9 percent increase in R&D funded by businesses, and the relationship is statistically significant at the 95 percent confidence level. Thus, we estimate that the restoration of full expensing would increase business-funded R&D expenditures in each state by 3.1 percent. For all 50 states plus Washington, D.C., combined, this implies an increase of $18.6 billion.
The appendix reports the model results when R&D expenditures funded by other sectors are the dependent variable. When using robust standard errors, only higher education exhibits a statistically significant relationship with the B-index subsidy rate. However, the model’s within-group R2 is low (0.21), and since we are concerned with extrapolating these results to estimate state-level effects, the relationship between the subsidy rate and R&D expenditures funded by higher education is not used in the following estimations. Lastly, the model is run again for each of the different funding sectors, but this time with one-period lagged subsidy rates, particularly to see if forgone tax revenue affects government R&D funding in the following year. No statistically significant relationship is found.
Table 1: Regression results[6]
|
Independent Variable |
Coefficient Estimate |
Pr(>|t|) |
Standard Error |
Within-Group R2 |
Between-Group R2 |
Overall R2 |
|
B-index subsidy rate (in %) |
0.009 |
0.021** |
0.0036 |
0.62 |
0.79 |
0.78 |
|
ln(GDP) |
1.323 |
0.000*** |
0.1643 |
Note: Statistically significant at *** p<0.01, ** p<0.05
R&D Gains From Doubling Credit Rates
To estimate gains from changes to the credit rates, we draw on the extensive existing empirical literature studying the relationship between forgone tax revenue and induced R&D spending. We estimate the increase in business-funded R&D from doubling the RC and ASC marginal rates by estimating the subsequent forgone tax revenue and multiplying it by a factor of 1.25.
Estimating Forgone Tax Revenue
We estimate forgone tax revenue using table 1 from Lester and Warda’s 2020 report, recreated in table 2. Using 2011–2014 data from the Internal Revenue Service to determine the share of business R&D expenditures that qualify for each credit, the duo estimate that the effective federal credit rate on R&D spending is 5.8 percent. Thus, doubling both the RC and ASC marginal rates implies the effective rate also doubles to 11.5 percent.[7] That is, additional forgone revenue equals 5.8 percent of business R&D expenditures. We therefore multiply our estimates for states’ 2022 business-funded R&D expenditures (see appendix) by 5.8 percent to calculate forgone federal tax revenue by state. Specifically, we estimate total forgone revenue in the 50 states plus Washington, D.C., to be $34.5 billion.
Table 2: Effective federal tax credit rate on business R&D spending (Lester and Warda, 2020)
|
Share |
Marginal Rate |
Weighted Marginal Rate |
|
|
Qualified Research Expenditure (QRE) that is: |
|||
|
Eligible for the Regular Credit |
|||
|
Not constrained by the minimum base |
4.5% |
20.0% |
0.9% |
|
Constrained by the minimum base |
26.3% |
10.0% |
2.6% |
|
All |
30.9% |
11.5% |
3.5% |
|
Eligible for the Alternative Simplified Credit |
69.1% |
8.0% |
5.5% |
|
Weighted average federal credit rate on QRE |
9.0% |
||
|
Effective rate on total R&D spending[8] |
5.8% |
Estimating the Increase in Business R&D
There is a wide literature estimating the increase in business R&D from changes in the tax credit. Estimates vary considerably, though there seems to be a consensus that each additional dollar in forgone tax revenue induces at least $1 in additional business R&D expenditures. For example, in a 1993 paper, Philip Berger estimated that the 1981 R&D tax credit generated $1.74 in additional business R&D spending for each dollar of forgone revenue.[9] Two years later, in a report for the U.S. Office of Technology Assessment, economist Bronwyn Hall estimated the relationship to be roughly one-to-one.[10] Kenneth Klassen, Jeffrey Pittman, and Margaret Reed concluded that, on average, each dollar of forgone revenue induces $2.96 of additional R&D spending in the United States (and $1.30 in Canada).[11] And more recently, Andrew Finley, Stephen Lusch, and Kirsten Cook found that among U.S. firms that did not qualify for the existing RC, the ASC induced $2.26 in additional R&D spending for every tax dollar lost.[12] In light of this research, and for consistency with past ITIF assessments, we assume a conservative multiplication factor of 1.25—that is, every dollar in forgone revenue induces $1.25 in business R&D spending. Therefore, in aggregate, we estimate that the $34.1 billion of forgone revenue induces an additional $42.6 billion in business-funded R&D expenditures.
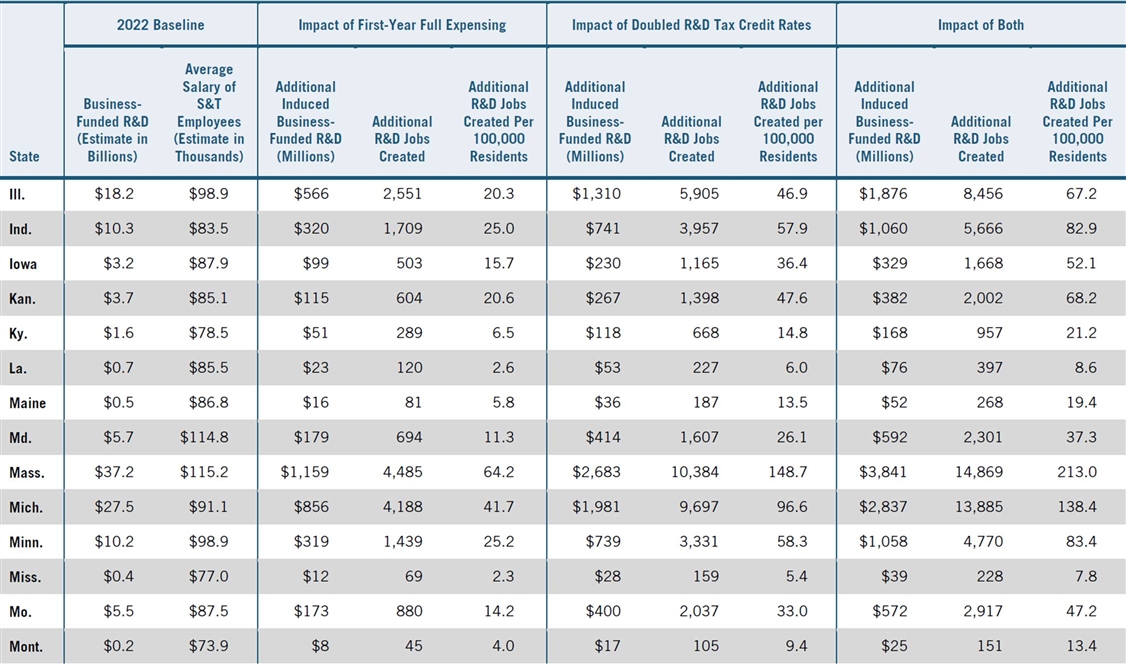
State-Level Employment Effects
Table 3 reports the estimated 2022 values for each state’s business-funded R&D expenditures, the average annual earnings of science and technology (S&T) employees, expected induced business-funded R&D in each scenario, and expected job creation. Business-funded R&D for 2022 is estimated using 2019 state-level data and 2021 country-level data from the National Science Foundation (NSF). S&T earnings data is provided by the Bureau of Labor Statistics, and the data is from 2021. The appendix provides a detailed description of the estimation methodologies used to arrive at these figures.
According to data from the Internal Revenue Service, wages made up 70 percent of QRE in 2014 (the last year for which data is available).[13] Unfortunately, this data is not available at the state level, so we assume this holds for all states. Moreover, per Lester and Warda, QRE accounts for 63.7 percent of all business R&D spending.[14] Therefore, we assume that 44.6 percent of induced R&D spending will be paid out in wages. We divide this by the average annual earnings of S&T employees in each state to calculate jobs added.
Overall, we estimate that approximately 81,000 direct jobs (24 per 100,000 people) would be created if first-year full expensing were restored, 188,000 (57 per 100,000) would be created if the tax credit rates were doubled, and 269,000 (81 per 100,000) would be created if both actions were taken.
The biggest beneficiaries—in terms of both gross jobs created and jobs created per capita—would be California, Massachusetts, Michigan, and Washington, which are states with high business R&D intensities. If both policies were to be enacted, we expect California would gain 78,117 jobs (200 per 100,000), Massachusetts would gain 14,869 (213 per 100,000), Michigan would gain 13,885 (138 per 100,000), and Washington would gain 17,653 (227 per 100,000).
Other states with lower R&D intensities would also see high levels of job creation, particularly when accounting for population. For example, Minnesota, Wisconsin, and Wyoming all rank in the top 15 in terms of expected jobs created per capita despite R&D intensities below the national level. Some less-expected beneficiaries and the number of expected jobs added if both policies were enacted:
▪ Idaho, 2,029 total jobs (105 per 100,000)
▪ Indiana, 5,666 total jobs (83 per 100,000)
▪ Minnesota, 4,770 total jobs (83 per 100,000)
▪ North Carolina, 8,080 total jobs (76 per 100,000)
▪ Pennsylvania, 9,771 total jobs (75 per 100,000)
▪ Wisconsin, 4,410 total jobs (75 per 100,000)
▪ Wyoming, 550 total jobs (95 per 100,000)
In some cases, job creation from these policies is estimated to be larger than the number of jobs created by the oft-touted openings or expansions of individual plants. For example, the expected direct job creation in Michigan if both policies were enacted is more than three times the number of jobs expected to be created from General Motors’ $7 billion investment in its Orion Township assembly plant announced last year (13,885 vs. 4,000).[15] Semiconductor manufacturing firm Wolfspeed recently announced its planned multibillion-dollar investment in North Carolina and that, with federal funding obtained through the CHIPS and Sciences Act, it hopes to create 1,800 jobs over the next eight years.[16] By our estimates, more direct jobs (2,437) would be created in North Carolina if just first-year full expensing were restored, and 4.5 times as many (8,080) would be created with both a return to full expensing and a doubling of the tax credit rates.
Conclusion
This report estimates direct job creation at the state level from expanded business R&D tax incentives under three scenarios: the restoration of full expensing, the doubling of the ASC statutory rate, and the implementation of both these policies.
Overall, we estimate that 81,000 direct jobs would be created if full expensing were restored, 188,000 jobs would be created if the R&D tax credit rates were doubled, and 269,000 jobs would be created if both policies were enacted. The states that would benefit the most from such policies are those with high business R&D intensities, such as California, Massachusetts, Michigan, and Washington. Other, less-R&D-intensive states such as Minnesota, Wisconsin, and Wyoming would also see high levels of per capita job creation. Moreover, since we only report estimates for direct job creation, the full employment benefit to each state is understated.
Table 3: Estimated employment impact of federal R&D incentive scenarios
Appendix
Calculating the Change in the B-Index Subsidy Rate
The B-index is the present value of pre-tax income needed to break even on an additional dollar spent on R&D. The B-index subsidy rate is then one minus this value. A country’s B-index is defined as
![]()
where ![]() is the combined net present value of allowances and credits for R&D expenditures and
is the combined net present value of allowances and credits for R&D expenditures and ![]() is the tax rate. For our purposes, we can assume the simple case where the only allowance is firms’ ability to expense their R&D expenditures, so that
is the tax rate. For our purposes, we can assume the simple case where the only allowance is firms’ ability to expense their R&D expenditures, so that ![]() , where
, where ![]() is the fraction of the present value of the expenditure firms can deduct from their taxable income. When firms can deduct all of their R&D expenses in the first year,
is the fraction of the present value of the expenditure firms can deduct from their taxable income. When firms can deduct all of their R&D expenses in the first year, ![]() and
and ![]() . The subsidy rate is therefore 0 percent. This is what is meant by the fact that first-year full expensing is considered the base case for the B-index subsidy rate.
. The subsidy rate is therefore 0 percent. This is what is meant by the fact that first-year full expensing is considered the base case for the B-index subsidy rate.
However, with a 5-year depreciation schedule, firms can only deduct 20 percent of the R&D expenditures from their taxable income in each of the next five years. Assuming a 7.7 percent annual discount rate, the new value of ![]() is
is
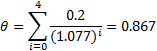
Therefore, firms can only expense 86.7 percent of the present value of their R&D expenditures. Under this scenario and with the United States’ 21 percent federal corporate income tax rate, ![]() , and the subsidy rate is therefore -3.5 percent. Thus, the switch to a 5-year depreciation schedule would lower the B-index subsidy rate by 3.5 percentage points, and a switch back to full expensing would increase the rate by 3.5 percentage points.[17]
, and the subsidy rate is therefore -3.5 percent. Thus, the switch to a 5-year depreciation schedule would lower the B-index subsidy rate by 3.5 percentage points, and a switch back to full expensing would increase the rate by 3.5 percentage points.[17]
Econometric Model and Results
The following countries were included in the econometric model.
Table 4: OECD countries included in the econometric analysis
|
Austria Belgium Canada Chile Colombia Czech Republic Denmark Estonia Finland France Germany |
Greece Hungary Iceland Ireland Israel Italy Japan Latvia Lithuania Luxembourg Mexico |
Netherlands Norway Poland Portugal Slovak Republic Slovenia South Korea Spain Turkey United Kingdom United States |
The results of the econometric analysis considering R&D funded by other sectors are reported in table 5. The models follow the same exact structure as that for business-funded expenditures. As mentioned previously, only R&D funded by higher education exhibits a statistically significant relationship with the B-index subsidy rate. However, this model only explains 21 percent of within-country variation in R&D expenditures, so it is disregarded for the report’s estimations.
Table 5: Regression results for R&D funded by other sectors[18]
|
Funding Sector |
Independent Variable |
Coefficient Estimate |
Pr(>|t|) |
Standard Error |
Within-group R2 |
Between-group R2 |
Overall R2 |
|
Government |
B-index subsidy rate (in %) |
-0.001 |
0.798 |
0.0021 |
0.72 |
0.91 |
0.90 |
|
ln(GDP) |
1.093*** |
0.000 |
0.0853 |
||||
|
Higher Education |
B-index subsidy rate (in %) |
0.014** |
0.013 |
0.0054 |
0.21 |
0.84 |
0.82 |
|
ln(GDP) |
1.178*** |
0.002 |
0.3433 |
||||
|
Nonprofits |
B-index subsidy rate (in %) |
-0.005 |
0.268 |
0.0049 |
0.21 |
0.70 |
0.68 |
|
ln(GDP) |
1.637*** |
0.000 |
0.2760 |
Note: Statistically significant at *** p<0.01, ** p<0.05
The following table 6 reports results for each category of R&D-funding sector with a one-year lagged B-index subsidy rate as the independent variable of interest. The motivating concern is that forgone revenue from a higher subsidy rate could lead to lower government-funded R&D in the following period. However, the relationship between government-funded R&D and the lagged subsidy rate is still far from statistically significant. The relationship with R&D funded by higher education is actually statistically significant at the 99 percent level, but the within-country R2 is lower than for the nonlagged subsidy rate. Finally, the relationship between the subsidy rate and R&D funded by nonprofit organizations is more statistically significant than in the nonlagged model. However, this relationship is still not significant at the 90 percent level, and the within-country R2 falls to just 0.17.
Table 6: Regression results with lagged subsidy rate[19]
|
Funding Sector |
Independent Variable |
Coefficient Estimate |
Pr(>|t|) |
Standard Error |
Within-Group R2 |
Between-Group R2 |
Overall R2 |
|
Business |
Lagged B-index subsidy rate (in %) |
0.007* |
0.099 |
0.0043 |
0.58 |
0.79 |
0.79 |
|
ln(GDP) |
1.333*** |
0.000 |
0.1844 |
||||
|
Government |
Lagged B-index subsidy rate (in %) |
-0.001 |
0.616 |
0.0020 |
0.68 |
0.91 |
0.90 |
|
ln(GDP) |
1.027*** |
0.000 |
0.0845 |
||||
|
Higher Education |
Lagged B-index subsidy rate (in %) |
0.015*** |
0.003 |
0.0048 |
0.20 |
0.84 |
0.82 |
|
ln(GDP) |
1.144*** |
0.004 |
0.3620 |
||||
|
Nonprofits |
Lagged B-index subsidy rate (in %) |
-0.005 |
0.181 |
0.0035 |
0.17 |
0.70 |
0.68 |
|
ln(GDP) |
1.590*** |
0.000 |
0.3180 |
Note: Statistically significant at *** p<0.01, ** p<0.05, * p<0.1
Estimating 2022 State-Level R&D Data
Unfortunately, the most recent NSF data for R&D expenditures at the state level is from 2019; however, this dataset reports state-level R&D expenditures broken down by both funding and performing sector—and the NSF recently published its 2021 country-level estimates for R&D broken down along the same lines. Therefore, we estimate states’ 2021 business-funded R&D by taking the 2019–2021 growth rate and assuming each state’s business-funded R&D grew at the national rate.
Using 2021 as the base year would work when considering only a change to the ASC rate; however, it cannot be used when considering the restoration of full expensing, since 2021 data still reflects a year in which full expensing was available. Therefore, we estimate states’ 2022 business-funded R&D expenditures using the 3.5-percentage-point decrease in the B-index subsidy rate and states’ 2022 GDPs—which we estimate by taking the growth rate through the first three quarters of 2022, annualizing it, and multiplying states’ 2021 GDPs by one plus this growth rate. We then plug these variables into our econometric model to estimate each state’s change in its business-funded R&D expenditures. (See table 8.) That is, rather than estimating the value itself, we estimate the change from the 2021 value using the econometric model.
Lastly, we estimate the average S&T salary for each state as the weighted average of the annual salaries for “Computer and Mathematical Occupations, ” “Architecture and Engineering Occupations, ” and “Life, Physical, and Social Science Occupations” per data from the Bureau of Labor Statistics. The latest such data is from 2021. Therefore, we estimate 2022 values simply by accounting for inflation—that is, we assume wages changed only nominally from 2021 to 2022.
Table 8: Data used to estimate states’ 2022 R&D expenditures[20]
|
State |
2019 Business-Funded R&D (Billions) |
2021 Business-Funded R&D (Billions) |
2021–2022 Annualized GDP Growth Rate |
Estimated 2022 Business-Funded R&D (Billions) |
2021 Average Salary of S&T Employee (Thousands) |
2022 Average Salary of S&T Employee (Thousands) |
|
Ala. |
$1.3 |
$1.5 |
8.1% |
$1.6 |
$88.4 |
$95.4 |
|
Alaska |
$0.0[21] |
$0.1 |
8.8% |
$0.1 |
$89.2 |
$96.3 |
|
Ariz. |
$5.3 |
$6.3 |
7.1% |
$6.6 |
$89.5 |
$96.7 |
|
Ark. |
$0.4 |
$0.5 |
10.4% |
$0.6 |
$73.6 |
$79.5 |
|
Calif. |
$167.9 |
$202.4 |
4.4% |
$205.2 |
$113.3 |
$122.4 |
|
Colo. |
$5.5 |
$6.5 |
9.0% |
$7.0 |
$99.5 |
$107.5 |
|
Conn. |
$6.6 |
$7.9 |
6.7% |
$8.2 |
$96.2 |
$103.9 |
|
Del. |
$2.2 |
$2.6 |
6.2% |
$2.7 |
$98.1 |
$106.0 |
|
D.C. |
$0.3 |
$0.3 |
4.6% |
$0.3 |
$114.1 |
$123.2 |
|
Fla. |
$6.4 |
$7.6 |
7.9% |
$8.0 |
$82.5 |
$89.1 |
|
Ga. |
$4.8 |
$5.7 |
8.2% |
$6.0 |
$91.1 |
$98.4 |
|
Hawaii |
$0.1 |
$0.2 |
6.5% |
$0.2 |
$85.8 |
$92.7 |
|
Idaho |
$2.7 |
$3.2 |
11.6% |
$3.6 |
$76.0 |
$82.1 |
|
Ill. |
$14.2 |
$17.0 |
7.9% |
$18.0 |
$91.6 |
$98.9 |
|
Ind. |
$7.9 |
$9.5 |
8.9% |
$10.1 |
$77.3 |
$83.5 |
|
Iowa |
$2.5 |
$2.9 |
9.5% |
$3.1 |
$81.4 |
$87.9 |
|
Kan. |
$2.8 |
$3.4 |
9.6% |
$3.7 |
$78.8 |
$85.1 |
|
Ky. |
$1.3 |
$1.5 |
8.9% |
$1.6 |
$72.7 |
$78.5 |
|
La. |
$0.6 |
$0.7 |
6.3% |
$0.7 |
$79.2 |
$85.5 |
|
Maine |
$0.4 |
$0.5 |
7.1% |
$0.5 |
$80.4 |
$86.8 |
|
Md. |
$4.8 |
$5.5 |
5.1% |
$5.7 |
$106.3 |
$114.8 |
|
Mass. |
$29.9 |
$35.8 |
5.5% |
$36.8 |
$106.7 |
$115.2 |
|
Mich. |
$21.2 |
$25.5 |
8.4% |
$27.2 |
$84.4 |
$91.1 |
|
Minn. |
$8.0 |
$9.6 |
7.7% |
$10.1 |
$91.5 |
$98.9 |
|
Miss. |
$0.3 |
$0.4 |
8.8% |
$0.4 |
$71.3 |
$77.0 |
|
Mo. |
$4.4 |
$5.1 |
8.5% |
$5.5 |
$81.0 |
$87.5 |
|
Mont. |
$0.2 |
$0.2 |
8.8% |
$0.2 |
$68.4 |
$73.9 |
|
Neb. |
$0.8 |
$0.9 |
12.1% |
$1.0 |
$77.9 |
$84.1 |
|
Nev. |
$1.0 |
$1.2 |
8.0% |
$1.3 |
$79.1 |
$85.4 |
|
N.H. |
$1.2 |
$1.4 |
0.7% |
$1.4 |
$91.9 |
$99.3 |
|
N.J. |
$20.3 |
$24.4 |
8.1% |
$25.9 |
$103.8 |
$112.1 |
|
N.M. |
$0.4 |
$0.5 |
8.4% |
$0.5 |
$94.9 |
$102.5 |
|
N.Y. |
$19.8 |
$23.4 |
5.7% |
$24.1 |
$101.2 |
$109.3 |
|
N.C. |
$13.4 |
$16.0 |
8.4% |
$17.1 |
$91.1 |
$98.3 |
|
N.D. |
$0.4 |
$0.4 |
15.3% |
$0.5 |
$75.4 |
$81.5 |
|
Ohio |
$10.0 |
$11.9 |
6.7% |
$12.4 |
$84.0 |
$90.7 |
|
Okla. |
$1.0 |
$1.2 |
10.0% |
$1.3 |
$81.5 |
$88.0 |
|
Ore. |
$7.9 |
$9.5 |
8.0% |
$10.1 |
$91.9 |
$99.2 |
|
Pa. |
$15.2 |
$18.1 |
7.5% |
$19.1 |
$84.5 |
$91.2 |
|
R.I. |
$0.7 |
$0.8 |
5.2% |
$0.8 |
$98.0 |
$105.8 |
|
S.C. |
$1.7 |
$2.0 |
9.0% |
$2.2 |
$79.7 |
$86.1 |
|
S.D. |
$0.2 |
$0.2 |
9.8% |
$0.2 |
$72.5 |
$78.2 |
|
Tenn. |
$1.6 |
$1.9 |
9.8% |
$2.0 |
$78.3 |
$84.5 |
|
Texas |
$23.5 |
$28.0 |
13.8% |
$31.8 |
$91.4 |
$98.7 |
|
Utah |
$2.8 |
$3.3 |
7.9% |
$3.5 |
$82.2 |
$88.8 |
|
Vt. |
$0.2 |
$0.3 |
8.3% |
$0.3 |
$80.3 |
$86.7 |
|
Va. |
$4.8 |
$5.5 |
5.5% |
$5.7 |
$105.4 |
$113.8 |
|
Wash. |
$37.1 |
$44.9 |
5.8% |
$46.4 |
$113.3 |
$122.4 |
|
W.Va. |
$0.2 |
$0.3 |
11.2% |
$0.3 |
$72.5 |
$78.3 |
|
Wis. |
6.5 |
$7.7 |
7.5% |
$8.1 |
$79.6 |
$86.0 |
|
Wyo. |
$0.7 |
$0.8 |
13.2% |
$0.9 |
$72.8 |
$78.6 |
Acknowledgments
The author would like to thank John Lester and Jacek Warda for their advice in adapting their past work.
About the Author
Ian Clay is a research assistant for ITIF’s Global Innovation team. He holds a B.S. in mathematics and economics from the University of Iowa and an M.S. in economics from the University of St. Andrews in the United Kingdom.
About ITIF
The Information Technology and Innovation Foundation (ITIF) is an independent, nonprofit, nonpartisan research and educational institute focusing on the intersection of technological innovation and public policy. Recognized by its peers in the think tank community as the global center of excellence for science and technology policy, ITIF’s mission is to formulate and promote policy solutions that accelerate innovation and boost productivity to spur growth, opportunity, and progress. For more information, visit us at itif.org.
Endnotes
[1]. John Lester and Jacek Warda, “Enhanced Tax Incentives for R&D Would Make Americans Richer” (ITIF, September 2020), https://itif.org/publications/2020/09/08/enhanced-tax-incentives-rd-would-make-americans-richer/.
[2]. United States Bureau of Labor Statistics, May 2021 National Industry-Specific Occupational Employment and Wage Estimates (NAICS 541700 – Scientific Research and Development Services), accessed January 19, 2022, https://www.bls.gov/oes/current/naics4_541700.htm.
[3]. Lester and Warda, “Enhanced Tax Incentives for R&D Would Make Americans Richer.”
[4]. For firms recording both sales and QRE for the first time after 1983 or for fewer than three tax years during the period 1984–1988, the fixed-based R&D intensity is set at 3 percent for the first five years. After that time, it is calculated using averages of sales and QRE. By the 11th year, the intensity is calculated as the ratio of QRE to sales in five of the previous six years.
[5]. ![]()
[6]. OECD, Implied tax subsidy rates on R&D expenditures (Large firms, Profitable; accessed January 10, 2022), https://stats.oecd.org/; OECD, Gross domestic expenditure on R&D by sector of performance and source of funds (Business enterprise; accessed January 10, 2022), https://stats.oecd.org/.
[7]. The actual effective credit rate is 5.77 percent. Therefore, when doubled, the new rate is 11.54%.
[8]. On average from 2011 to 2014, QRE accounted for 63.7 percent of domestic R&D spending by firms, as reported by the National Science Foundation.
[9]. Philip G. Berger, “Explicit and Implicit Tax Effects of the R&D Tax Credit,” Journal of Accounting Research, vol. 31, no.2 (1993): 131–141, https://www.jstor.org/stable/2491268.
[10]. Bronwyn H. Hall, “Effectiveness of Research and Experimentation Tax Credits: Critical Literature Review and Research Design” (Washington, D.C.: U.S. Congress, Office of Technology Assessment, 1995), https://eml.berkeley.edu/~bhhall/papers/BHH95%20OTArtax.pdf.
[11]. Kenneth J. Klassen, Jeffrey A. Pittman, and Margaret P. Reed, “A Cross-national Comparison of R&D Expenditure Decisions: Tax Inentives and Financial Constraints,” Contemporary Accounting Research, vol. 21, no. 3 (2004), https://onlinelibrary.wiley.com/doi/abs/10.1506/CF2E-HUVC-GAFY-5H56.
[12]. Andrew R. Finley, Stephen J. Lusch, and Kirsten A. Cook, “The Effectiveness of the R&D Tax Credit: Evidence from the Alternative Simplified Credit,” Journal of the American Tax Association, vol. 37, no. 1 (2015), https://doi.org/10.2308/atax-50964.
[13]. United States Internal Revenue Service, SOI Tax Stats – Corporation Research Credit (Table 1, 2014; accessed January 26, 2022), https://www.irs.gov/statistics/soi-tax-stats-corporation-research-credit.
[14]. See note to Table 2.
[15]. Kalea Hall, “GM Announces $7 Billion in Michigan EV, Battery Investment,” The Detroit News, January 25, 2022, https://www.detroitnews.com/story/business/autos/general-motors/2022/01/25/gm-7-billion-michigan-ev-battery-investment/9209279002/.
[16]. “Wolfspeed Selects North Carolina for World’s Largest Silicon Carbide Materials Facility,” Wolfspeed, September 9, 2022, https://www.wolfspeed.com/company/news-events/news/wolfspeed-selects-north-carolina-for-worlds-largest-silicon-carbide-materials-facility/.
[17]. This calculation assumes that expenses are deducted immediately rather than at the end of the period.
[18]. OECD, Implied tax subsidy rates on R&D expenditures; OECD, Gross domestic expenditure on R&D by sector of performance and source of funds.
[19]. Ibid.
[20]. Gary Anderson, John Jankowski, and Mark Boroush, “U.S. R&D Increased by $51 Billion in 2020 to $717 Billion; Estimate for 2021 Indicates Further Increase to $792 Billion,” National Center for Science and Engineering Statistics, January 4, 2023, https://ncses.nsf.gov/pubs/nsf23320#utm_medium; United States Bureau of Economic Analysis, Regional Data (SQGDP2 GDP by state; accessed January 18, 2022), https://apps.bea.gov/itable/?ReqID=70&step=1; United States Bureau of Labor Statistics, May 2021 State Occupational Employment and Wage Estimates (accessed January 26, 2022), https://www.bls.gov/oes/current/oessrcst.htm; United States National Science Foundation (NSF), Business Enterprise Research and Development: 2019 (Table 55; accessed January 17, 2022), https://ncses.nsf.gov/pubs/nsf22329; NSF, National Patterns of R&D Resources: 2019–2020 Data Update (Table 10; accessed January 17, 2022), https://ncses.nsf.gov/pubs/nsf22320; NSF National Patterns of R&D Resources: 2014–2015 Data Update (Table 10; accessed January 18, 2022), https://www.nsf.gov/statistics/2017/nsf17311/#chp2.
[21]. Less than $50 million.
