---
title: "Targeted Pressure: How Chinese Manufacturing Competition Impacts US States"
summary: |-
Chinese industrial policy is reshaping global manufacturing and impacting every U.S. state. The result is growing risk to American industry, jobs, and national security.
date: "2026-06-01"
issues: ["Manufacturing", "National Competitiveness"]
authors: ["Trelysa Long", "Meghan Ostertag"]
content_type: "Reports & Briefings"
canonical_url: "https://itif.org/publications/2026/06/01/targeted-pressure-how-chinese-manufacturing-competition-impacts-us-states/"
---
# Targeted Pressure: How Chinese Manufacturing Competition Impacts US States
## Key Takeaways
- Unfair Chinese policies and practices, not market-based competition, are reducing foreign manufacturing capabilities, including America’s.
- Overcapacity and below-cost pricing are central competitive tools. In many sectors, Chinese firms expand output beyond global demand, driving down prices and squeezing more U.S. firms out of both domestic and third-country markets.
- Erosion of U.S. industrial capacity poses national security risks. Many affected industries are critical to defense and infrastructure, increasing U.S. vulnerability to supply chain disruptions and economic coercion.
- Every U.S. state is harmed by unfair Chinese competition, with negative implications for companies, economic output, and well-paying jobs.
- This report examines a leading industry for each U.S. state and the current and potential future negative impact from Chinese unfair competition.
# Introduction
China is engaged in an intensifying techno-economic war to dominate a select group of advanced, globally traded industries that are the bedrock of technological leadership and economic power in the 21st century. The Information Technology and Innovation Foundation (ITIF) calls these industries “national power industries.” China’s gains in national power industries are coming at the expense of U.S. and allied global market share and production capabilities, which puts at risk not just America’s global competitiveness, but also its national security.[1](#_edn1) That’s because becoming dependent on Chinese firms in the “enabling,” “dual-use,” and defense industries that together comprise the larger class of national power industries leaves the United States open and vulnerable to coercion from China—an unacceptable risk amid rising tensions between the two countries.[2](#_edn2)
Importantly, this techno-economic battle is taking place not just in high-tech industries that are clustered in places like Silicon Valley and Harvard Square, but also in many other strategically important industries that are spread across the entire country. Every state relies on these industries, ranging from agricultural machinery to medical instrument manufacturing, to employ hundreds or thousands of workers and contribute to its economy—and most of these industries are facing increasing competition from China.
However, China and its firms are not normal competitors. Unlike American firms, those in China benefit from high levels of government subsidies, artificially inflated demand, tax incentives, favorable financing, reduced energy prices, and many more policy instruments used to strengthen Chinese competitiveness. In this way, U.S. firms can no longer compete on innovativeness and productivity alone, and many have seen declines in sales, employment, and market share as a result. These firms are no longer competing just against other firms, but also against the might of the Chinese government.
> Every state relies on national power industries—and most of these industries are facing increasing competition from China.
Despite the abundance of information on the risks posed by unfair Chinese competition in these industries, there is a significant lack of data to support a causational techno-economic analysis, particularly at the state level, on how Chinese firms may have contributed to the decline of American industries. This data gap limits policymakers’ ability to assess where and how Chinese competition is affecting U.S. industries and regions. To address this, policymakers should consider a dedicated effort to systematically collect and analyze global and state-level market share data across manufacturing industries. Such an initiative would enable a more precise identification of which state industries face the greatest competitive pressures from China, as well as when and how these pressures emerge.
This report draws on the best available industry-wide data on employment, exports, and global market share to assess a single national power industry in each state in the context of the U.S.-China competition in that industry. In doing so, it examines the relationship between U.S. firms in these industries and the potential competitive pressures posed by China.
# State Analyses
All industries analyzed in this report are national power industries, or industries that enable a strong military or give the United States leverage over other nations. The specific industry for each state was selected using a location quotient (LQ), which measures an industry’s specialization relative to a state’s economy. The LQ is calculated as an industry’s share of a state’s economy divided by the national industry’s share of the U.S. economy or as a state’s share of domestic output in an industry divided by the state’s overall share of the national economy. In this report, the industry’s share of output is calculated using the number of employees in that industry. Each selected industry had a high LQ in its state in 2023.
The state analyses use data from the U.S. Census Bureau’s County Business Patterns to measure employment in each industry at the state level, supplemented by anecdotal evidence on investment and major firms, where available. To examine the relationship between these state industries and Chinese competition, the analyses incorporate data on U.S. and Chinese global market shares, where available; when such data is unavailable, U.S. and Chinese exports as a share of global exports are used as proxies. This approach is supported by Saltarelli et al., who found that “export [data] mirrors remarkably well domestic production for manufacturing sectors or sectors related to physical goods.”[3](#_edn3) Additionally, where applicable, export data was used to assess how the United States and China compete in key third-country markets. Industry exports are calculated using the appropriate Harmonized System (HS) codes and Standard International Trade Classification (SITC) codes.
It should be noted that export data depicts the value of exports from the two countries, not necessarily from U.S. or Chinese firms. For instance, a Tesla facility operating in and exporting products from China will be counted as producing Chinese exports even though Tesla is an American company.
## Alabama: Artificial and Synthetic Fibers and Filaments Manufacturing (NAICS 325220)
Alabama is one of the largest producers of artificial and synthetic fibers and filaments in the country, employing 20 percent of the industry’s workforce. However, the United States is no longer as strong in this industry as it once was. China’s emergence as a low-cost producer has significantly increased competition for American manufacturers and at least partially contributed to the decline of this industry in the United States.
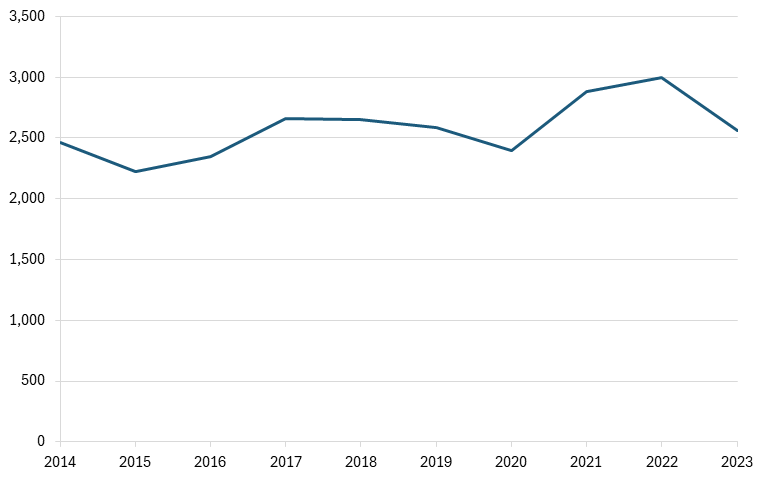
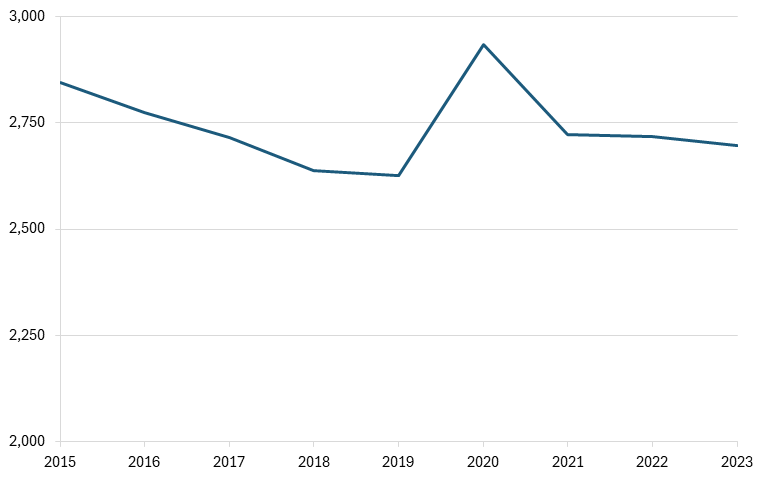
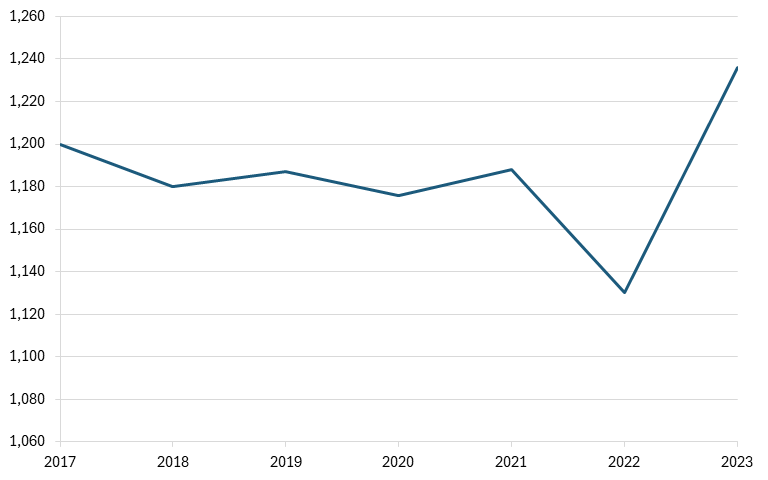
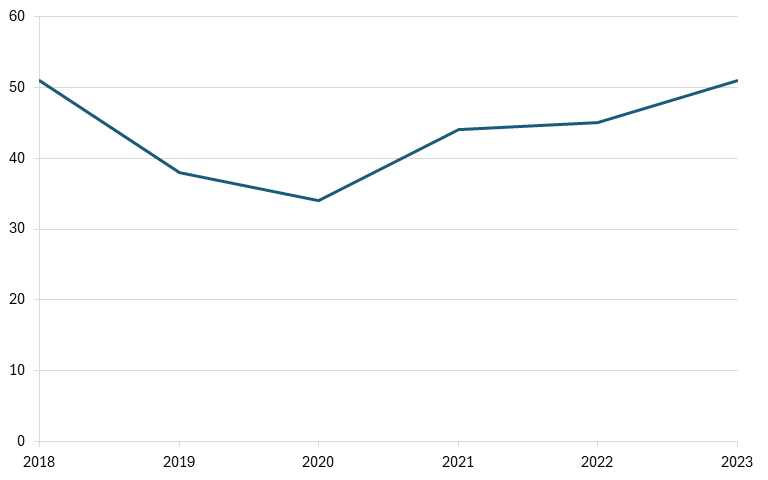
The artificial and synthetic fibers and filaments industry produces several types of man-made fibers, including polyester, nylon, and acrylic, which have industrial uses in addition to their well-known textile uses, such as industrial-strength cables, medical equipment, and personal protective equipment.[4](#_edn4) Alabama is a relatively strong producer of artificial and synthetic fibers in the United States, although employment in the industry has fluctuated over the past decade. From 2013 to 2023, employment fell from 2,500 to as low as 2,200 in the late 2010s, before rising again to a peak of 3,000. As of 2023, Alabama’s artificial and synthetic fibers and filaments industry employed just over 2,500 workers.[5](#_edn5) (See figure 1.)
**Figure 1: Employment in the artificial and synthetic fibers and filaments industry in Alabama**
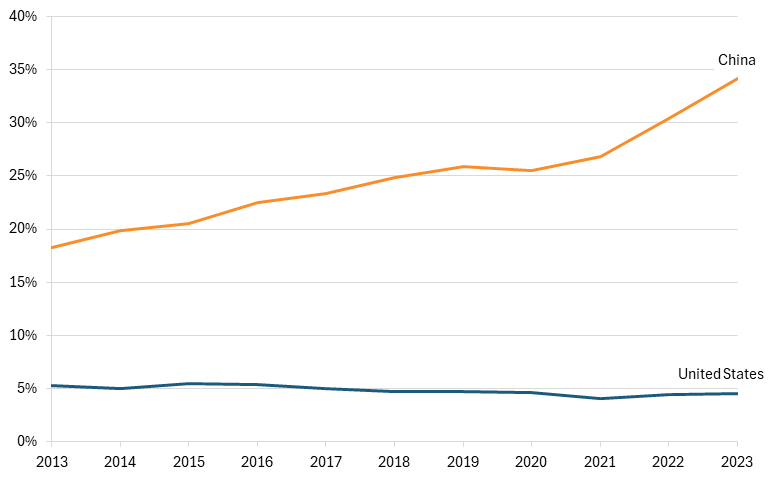
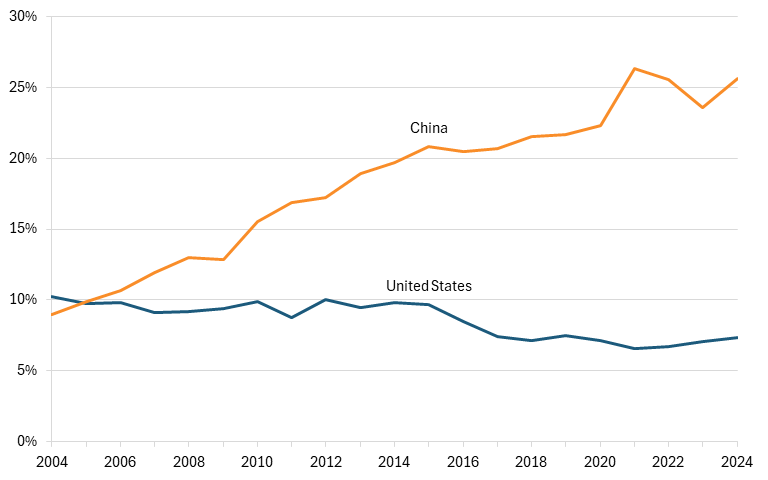
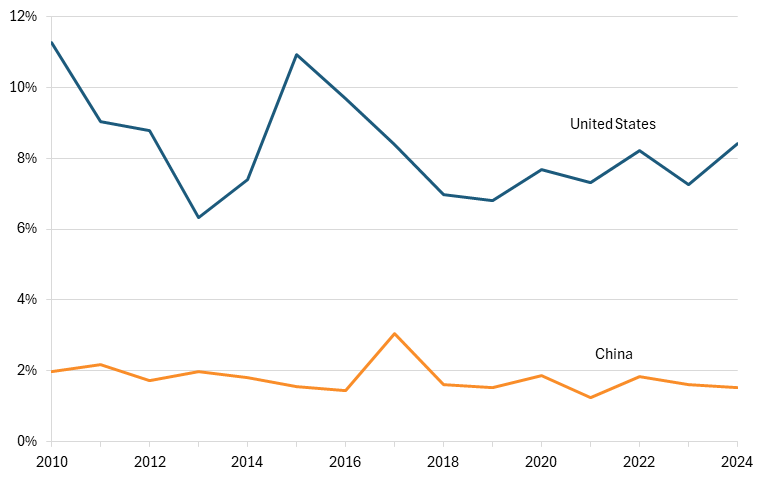
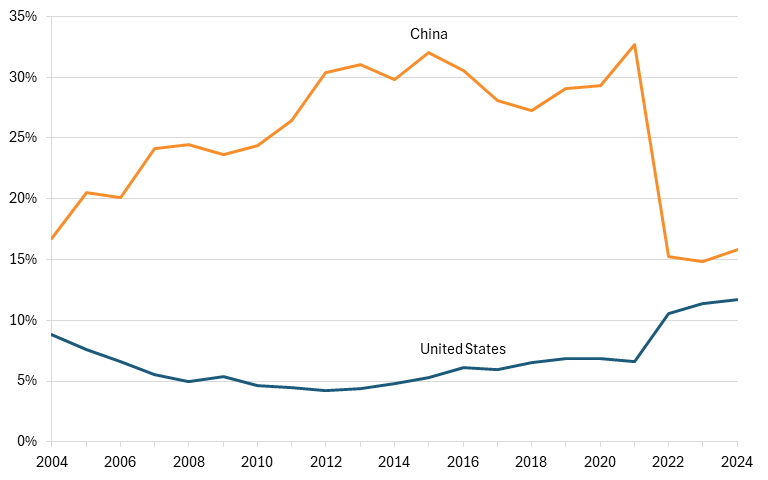
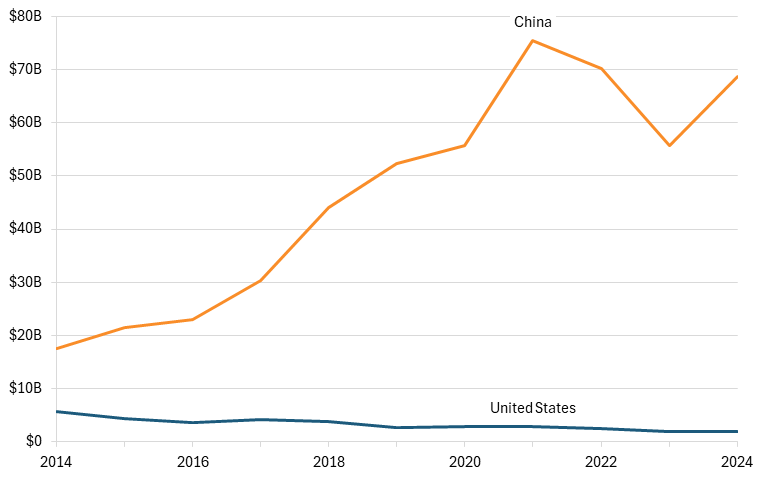
The United States used to be one of the largest producers of man-made fibers. An analysis of HS code 5402, synthetic filament yarn, one of the major exports of firms in these industries, demonstrates that from 1996 to 2000, the United States commanded 11 percent of the global market share in this industry, less than Germany (14 percent) but more than similarly advanced economies such as South Korea and Italy (10 percent each). China maintained less than 1 percent of the global market share. However, China’s accession to the World Trade Organization (WTO) changed this reality. In 2023, China held 48 percent of this growing industry, while U.S. market share more than halved to just 5 percent.[6](#_edn6)
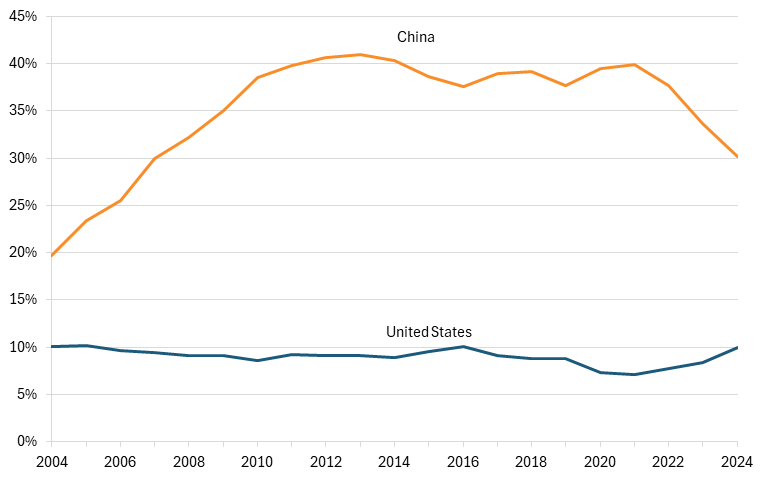
Chinese firms were able to rapidly increase exports and market share through low production pricing and high production levels, both of which reduced the market price of synthetic fibers and squeezed U.S. producers. Today, U.S. production of synthetic fibers has declined by 74 percent since its peak in 1996.[[7]](#_edn7) China holds over one-third of global market share across all goods produced by the synthetic fiber industry (HS 54 and 55), an increase of 86 percent from 2013 to 2023. At the same time, the United States has seen its global market share fall to just 4.6 percent.[8](#_edn8) (See figure 2.)
**Figure 2: Global market share of synthetic fiber exports**
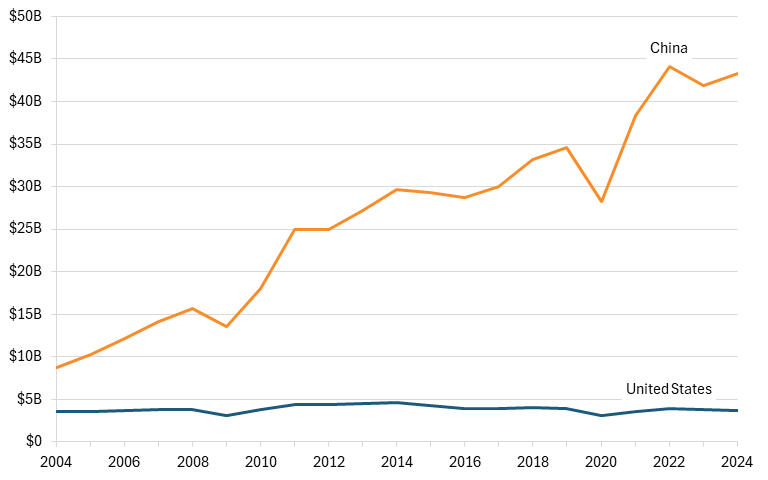
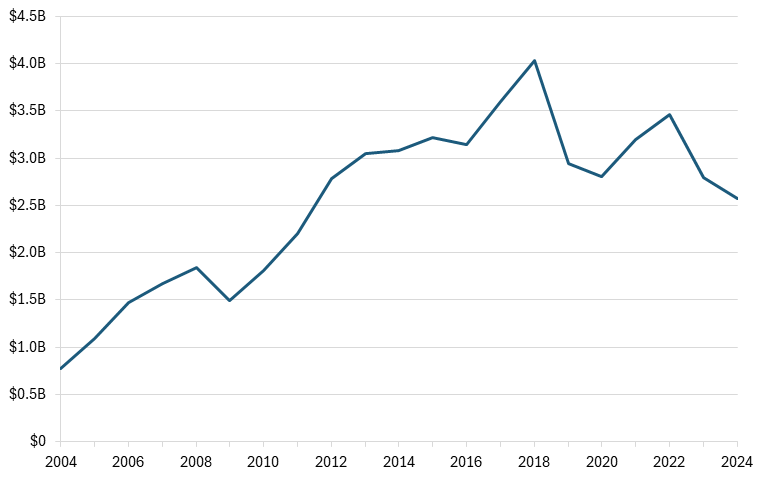
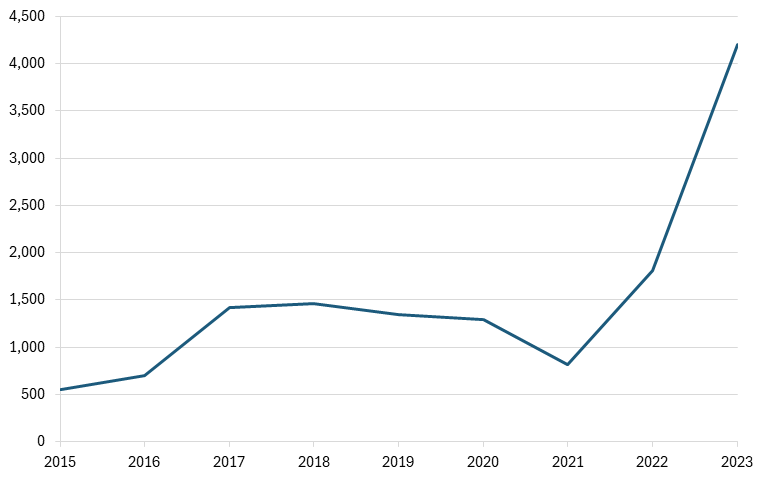
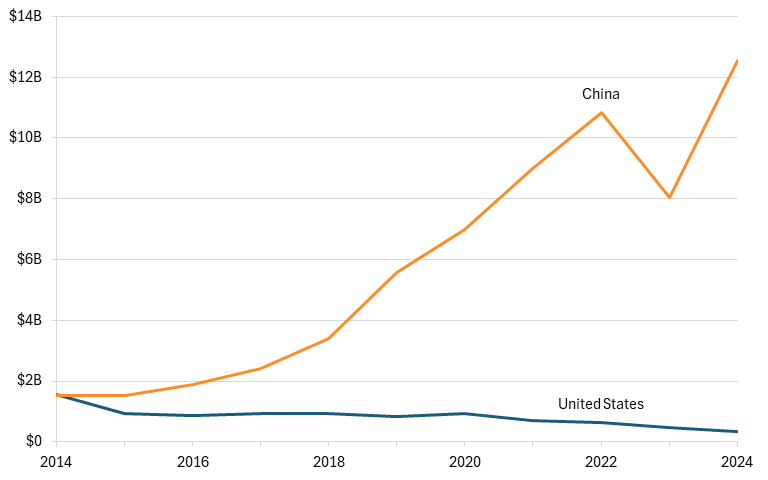
The market for synthetic fibers has grown steadily since the late 1990s, more than doubling since 1996.[9](#_edn9) However, this growth has not been distributed evenly. Chinese exports in the synthetic fiber industry (HS 54 and 55) were only about $4 billion greater than U.S. exports in 2004. By 2024, Chinese exports had surged, with exports increasing by 398 percent to over $40 billion. For the United States, exports have remained stagnant or declined every year since the early 2000s, with exports increasing just 3 percent.[[10]](#_edn10) (See figure 3.)
**Figure 3: Artificial and synthetic fiber (HS 54 and 55) exports**
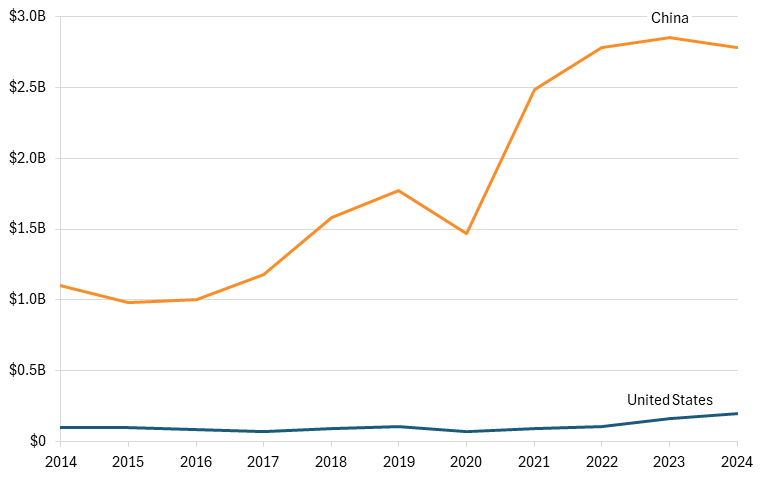
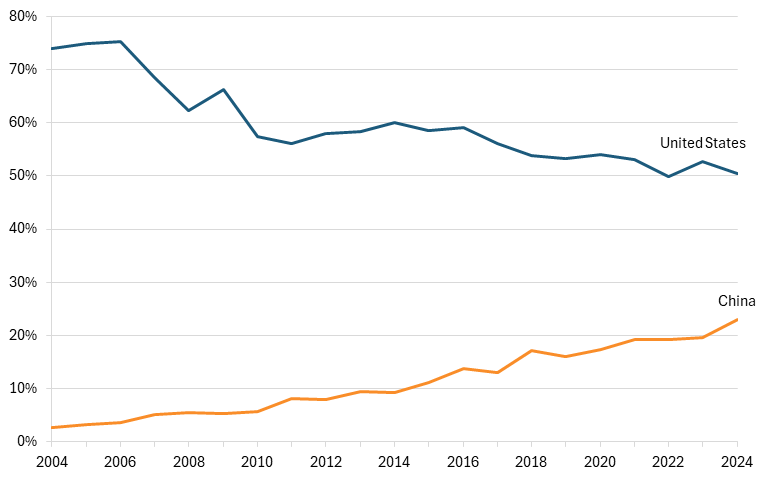
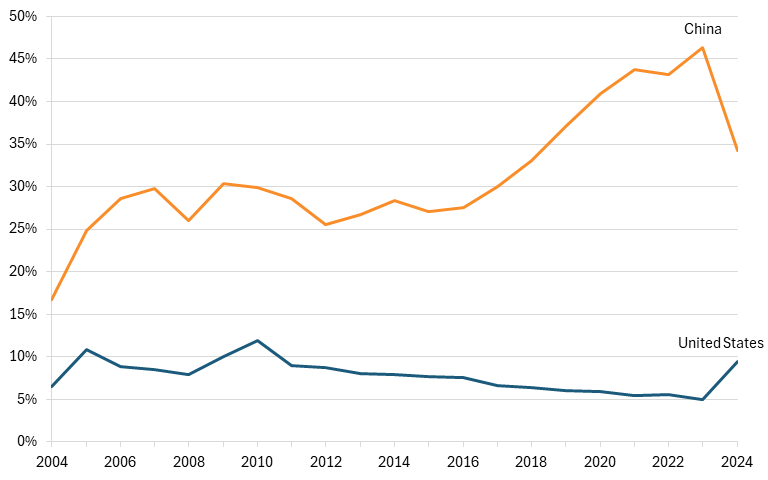
China’s rapid growth in global market share is only possible through the domination of third-party markets. Large textile-exporting countries are importers of synthetic fibers, making them key markets for firms in that industry. Exports to Bangladesh, India, Italy, and Vietnam—four of the five largest exporters of textiles in the world—were dominated by China.[11](#_edn11) China exported $2.8 billion worth of synthetic fibers to these countries in 2024, while U.S. exports totaled just 7 percent of that, or $199 million.[12](#_edn12) (See figure 4.)
China’s rise as one of the top exporters of synthetic fibers in the world correlates with the subsequent decline in the U.S. synthetic fiber industry. The industry in the United States has seen its workforce, which used to be over 17,500 workers, fall by 25 percent and output decline steeply, leaving U.S. firms insignificant in the global market, far overshadowed by Chinese competitors.[[13]](#_edn13) The evidence indicates that China’s accession to the WTO, and the free trade protections that came with it, allowed Chinese firms to overproduce and underprice goods, enabling them to gain global market share at the expense of the United States and making it a contributor to the decline of the synthetic fibers industry in Alabama.
**Figure 4: Synthetic fiber exports to Bangladesh, India, Italy, and Vietnam**
## Alaska: Metal Tank (Heavy Gauge) Manufacturing (NAICS 332420)
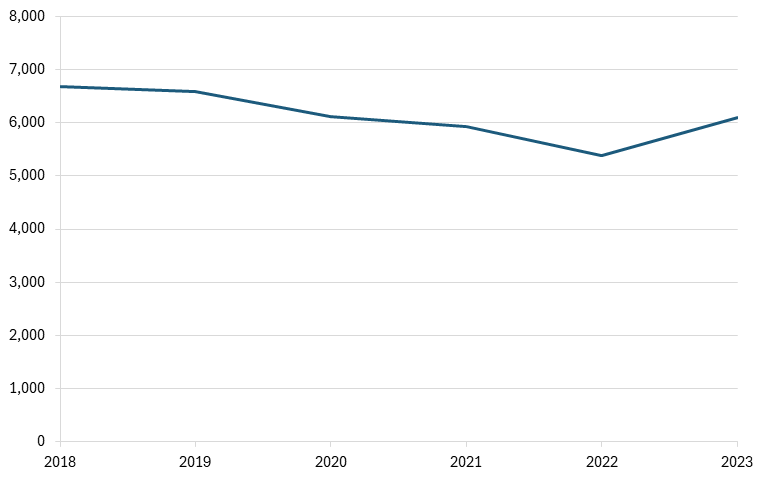
Alaska’s metal tank (heavy gauge) manufacturing industry plays a small but important role in supporting the state’s energy, mining, and infrastructure sectors. These tanks—used for storing petroleum, chemicals, and water—are critical inputs for Alaska’s resource-based economy. However, like many U.S. fabricated metal product industries, the sector operates in an increasingly competitive global market wherein China’s rapid expansion, supported by state-backed industrial policies, presents a growing challenge.
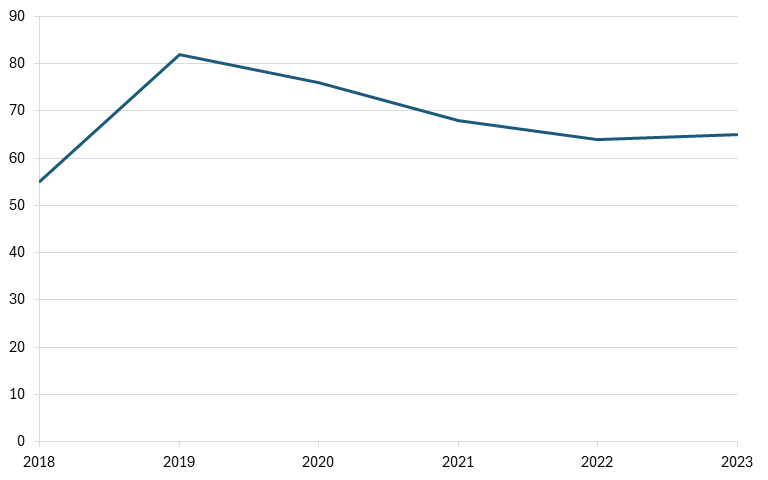
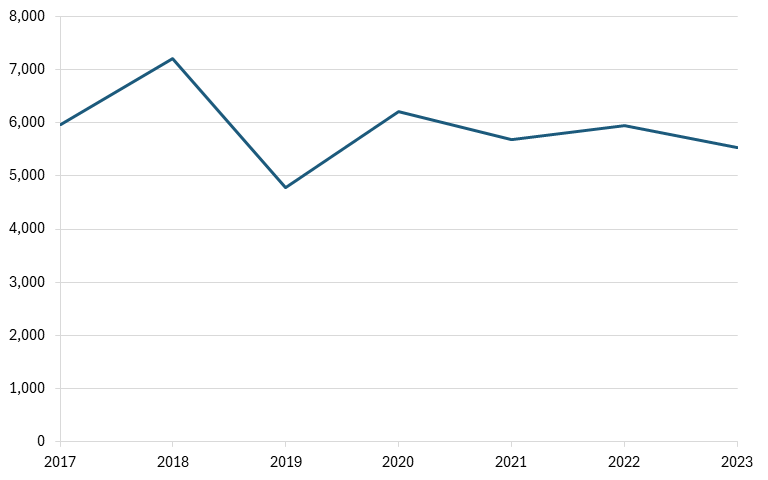
While Alaska is not a large manufacturing state, its metal tank industry is closely tied to oil and gas activity and broader industrial demand. Employment in the industry has fluctuated over the past several years, rising from roughly 55 workers in 2018 to a peak of over 80 in 2019 before declining and stabilizing around the mid-60s by 2023.[14](#_edn14) (See figure 5.)
**Figure 5: Number of jobs in metal tank (heavy gauge) manufacturing in Alaska**
Despite its localized importance, the U.S. metal tank manufacturing industry remains a relatively small player globally compared with China. Fabricated metal products, including storage tanks (HS codes 7309, 7311, 7611, 7613, 8609), have seen China emerge as a dominant exporter over the past two decades. Chinese firms benefit from economies of scale, vertically integrated steel supply chains, and extensive government support, allowing them to produce tanks and related fabricated metal products at lower cost than U.S. competitors.[15](#_edn15)
China’s rise is particularly evident in export market share. Since the early 2000s, China has consistently captured a significantly larger share of global exports of metal tanks than the United States has. While China’s export share has fluctuated largely between roughly 40 and 70 percent over the past two decades, the United States has remained in the single digits, typically below 10 percent.[16](#_edn16) (See figure 6.) These trends also largely correspond to Alaska’s employment trends over the past several years, with employment remaining relatively stagnant, similar to U.S. exports.
**Figure 6: United States’ and China’s shares of global exports of heavy-gauge metal tank manufacturing**
China’s global dominance in fabricated metal products is closely tied to state support. Under industrial strategies such as Made in China 2025, the Chinese government has prioritized advanced manufacturing sectors, including metals and industrial equipment. Chinese metal producers benefit from a range of subsidies, including below-market financing from state-owned banks, discounted land and energy, export tax rebates, and direct fiscal support. According to the Organization for Economic Cooperation and Development (OECD), government support for Chinese metal producers is significantly higher than for firms in market economies, contributing to persistent global overcapacity and downward pressure on prices.[[17]](#_edn17) This allows Chinese firms to undercut international competitors, sometimes selling products at or near cost.
The competitive pressure from China is also visible in key export markets. The United States has traditionally exported metal tanks primarily to neighboring countries, particularly Canada and Mexico. Over the past two decades, however, China has steadily increased its presence in these markets. While the United States still maintains a dominant share—often accounting for 60 to 80 percent of exports to these countries—China’s share has risen from less than 6 percent to the mid-teens and, in some years, above 20 percent, suggesting that U.S. firms are facing growing competition from lower-cost Chinese competitors.[18](#_edn18) (See figure 3.)
**Figure 7: United States’ and China’s shares of heavy-gauge metal tank exports to Mexico and Canada**
Overall, while Alaska’s metal tank manufacturing industry is relatively small, it remains exposed to global competitive pressures. China’s continued expansion in fabricated metal products—fueled by subsidies, overcapacity, and export-oriented industrial policy—poses a long-term risk to U.S. producers. For Alaska, where the industry supports critical energy and infrastructure activities, sustained competition from lower-cost imports could limit growth, reduce margins, and constrain job creation. Ensuring the resilience of this niche-yet-essential manufacturing sector will depend on maintaining domestic industrial capabilities amid intensifying global competition.
## Arizona: Semiconductor and Related Device Manufacturing (NAICS 334413)
Arizona is specialized in and dependent on the semiconductor industry, which operates in a highly competitive global market. China’s extensive subsidies and continued rapid expansion of manufacturing capacity pose a challenge to the sector’s future success.
The semiconductor industry is the second-largest traded industry in Arizona, behind the aerospace sector, contributing over $3.5 billion in exports.[19](#_edn19) Employment in this industry has surged in recent years due to sizeable investments in the greater Phoenix area from some of the largest semiconductor firms in the world, such as Intel and Taiwan Semiconductor Manufacturing Corporation (TSMC). These investments contributed to a 61 percent increase in employment between 2015 and 2023, with the largest jump occurring in 2022, the year the CHIPS and Science Act was passed.[20](#_edn20) (See figure 8.) These investments have also made Arizona one of the largest hubs for semiconductor manufacturing in the United States.
**Figure 8: Employment in semiconductor manufacturing in Arizona**
However, while investment in the Arizona semiconductor industry has been significant, the Chinese government has invested even more, threatening to take global market share from American producers. Through substantial subsidies and overproduction, Chinese firms are suppressing semiconductor prices, gaining global market share, and potentially harming the future success of Arizona fabs. Overall, the Chinese government plans to invest over $150 billion in the industry by 2030, nearly three times the $52 billion invested by the United States in the CHIPS and Science Act in 2022.[[21]](#_edn21) In the first half of 2025 alone, the government invested $63.3 billion in the industry.[22](#_edn22)
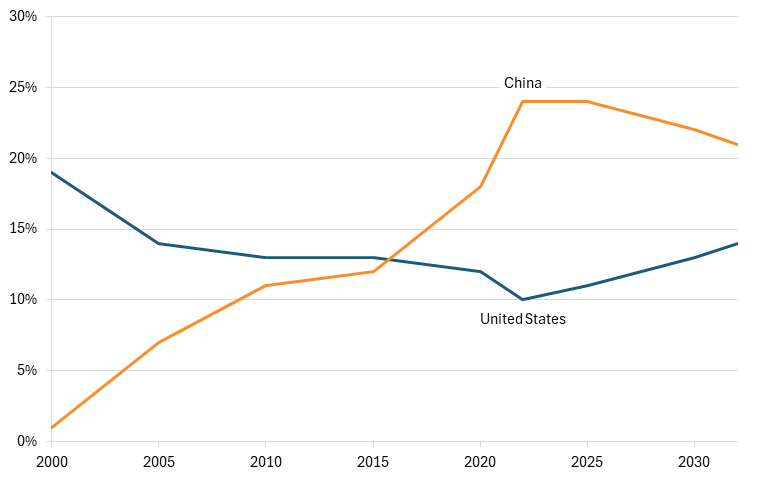
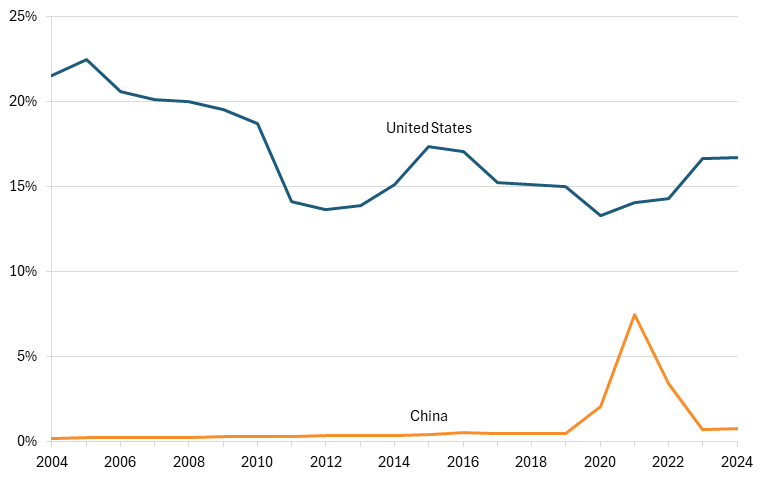
China’s push for dominance in semiconductors is most evident in legacy semiconductor manufacturing, which has benefited from significant industrial subsidies and has grown faster than the rest of the global market. Chinese legacy chip production capacity grew more than four times as fast as global demand between 2015 and 2023.[23](#_edn23) Continually increasing production capacity without corresponding demand growth can result in overcapacity, which reduces prices and revenue for U.S. chip manufacturers. In terms of overall semiconductor production capacity, China’s stock has been rising at the expense of the United States, disproportionately affecting areas highly concentrated in semiconductors, such as Arizona. Between 2000 and 2025, China’s share of global semiconductor manufacturing capacity increased by 20 percentage points, while the United States saw its share decline by 8 percentage points.[[24]](#_edn24) (See figure 9.)
**Figure 9: Share of global semiconductor production capacity, 2000–2032 (projected from 2025)**
For much of the early 2000s, the United States exported far more semiconductors (HS codes 8541 and 8542) than China did. However, from 2009 until the present, China has overtaken the United States, with exports growing exponentially while U.S. exports have remained stagnant. From 2014 to 2024, Chinese semiconductor exports grew by 126 percent, while U.S. exports increased by just 37 percent.[25](#_edn25) (See figure 10.) Indeed, TSMC’s $165 billion investment to support the construction of six fabs in Arizona, most of which are not yet operational, will likely increase U.S. exports as more fabs come online.[26](#_edn26) However, the U.S. Commerce Department has noted that China’s chip industry expansion poses a threat to new chip facilities in the United States, stating that new Chinese chip capacity could result in fabs in the United States and other allied countries being reduced to producing fewer chips than is necessary to remain profitable.[[27]](#_edn27)
**Figure 10: Semiconductor exports**
The high subsidies in the Chinese semiconductor industry allow Chinese firms to sell semiconductors at a lower cost than U.S. competitors can, at times selling chips below production cost. Chinese manufacturers sell chips 30 to 50 percent cheaper than U.S. suppliers do, making their products more attractive in third-party markets.[28](#_edn28) U.S. exports to Malaysia, Singapore, and Vietnam have grown at a fraction of the pace of China’s, with Chinese exports to these countries close to double that of the United States in 2024. (See figure 11.)
**Figure 11: Semiconductor exports to Malaysia, Singapore, and Vietnam[29](#_edn29)**
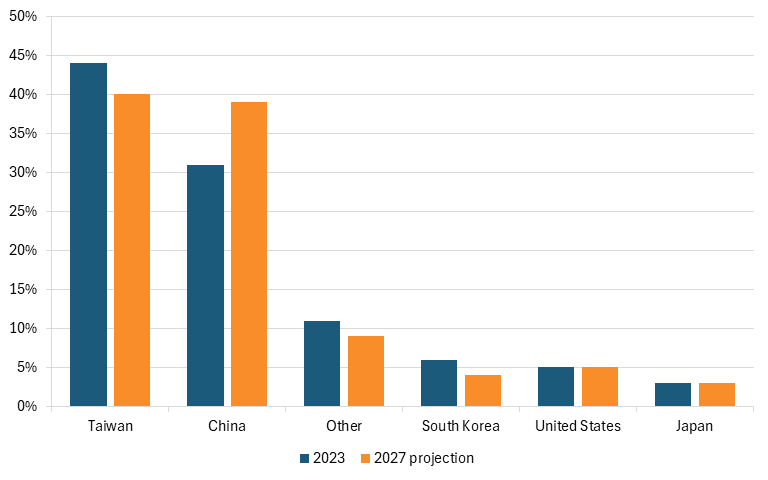
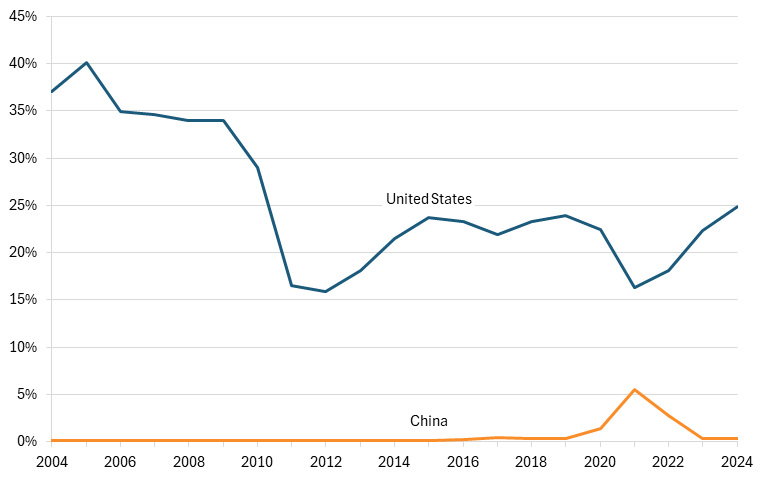
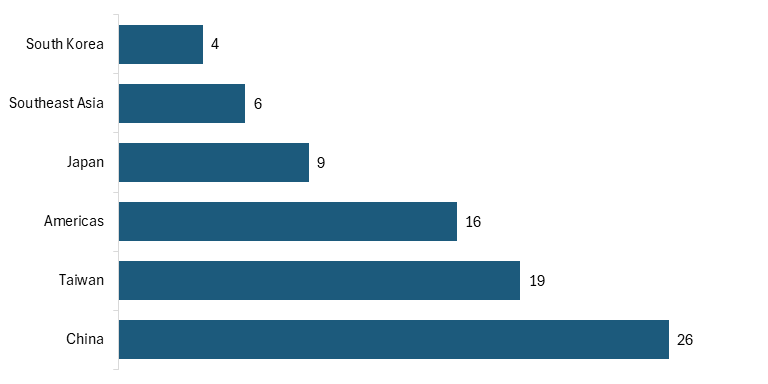
In China’s Made in China 2025strategy, released in 2015, the government explicitly aims to achieve 70 percent self-sufficiency in semiconductor products by 2025 and to become the world leader in semiconductor manufacturing by 2030.[30](#_edn30) Although these goals haven’t yet been reached, China-based firms are expected to continue to grow rapidly, as policy support and investment remain aligned with these objectives. China’s share of legacy chip manufacturing is expected to grow from 31 percent in 2023 to 39 percent in 2027, making it second globally behind Taiwan, whose share is projected to decline from 44 percent to 40 percent.[31](#_edn31) The United States is projected to hold 5 percent of the global market share. (See figure 12.) Moreover, between 2022 and 2026, China is expected to build more new fabs and complete more major expansions than any other region will, bringing 26 facilities online, compared with only 16 in the Americas.[32](#_edn32)
**Figure 12: Global market share in legacy semiconductor manufacturing, 2023 vs. 2027 projection[33](#_edn33)**
China’s push for dominance in the global semiconductor market poses a direct threat to U.S. firms, and its growth is not expected to slow.[[34]](#_edn34) As Chinese producers replace U.S. suppliers domestically and expand aggressively into third-country markets, U.S. semiconductor exports will face sustained erosion in market share, revenue, and profitability. Chinese authorities will continue to aggressively subsidize the semiconductor industry to reach their $150 billion target, thereby contributing to overcapacity and artificially low prices for Chinese firms. For Arizona, where semiconductors are one of the state’s most important export industries and an industry that has seen rapid growth over the past several years, this loss of global demand and reduced revenue would translate into slower industry growth and weaker job creation—a threat to the future of the state’s economy.
## Arkansas: Motor and Generator Manufacturing (NAICS 335312)
Arkansas has one of the largest motor and generator manufacturing industries in the country, employing over 2,600 workers and competing in a competitive global market.[[35]](#_edn35) This industry is a critical input to U.S. energy and power infrastructure, making it vital for the United States to maintain a secure supply chain and strong domestic manufacturing capabilities. While the United States has historically been a major producer of advanced electrical equipment, including industrial motors and generators, China’s rapid expansion in electrical machinery manufacturing poses a significant threat to the sector’s future success and U.S. national and economic security.[36](#_edn36)
Motor and generator manufacturing produces essential components used in industrial machinery, HVAC systems, power generation equipment, and manufacturing processes. These products are critical inputs across the economy, with generators serving as primary and secondary power sources for factories, hospitals, telecommunications towers, and data centers, making the industry a key part of critical infrastructure.[37](#_edn37) The expansion of data center infrastructure, in particular, has been a powerful catalyst for growth in this sector.
Arkansas plays an important role in this industry, particularly in the state’s western regions. The state is home to major manufacturers, including ABB Motors and Mechanical, headquartered in Fort Smith, and Nidec Motor Corporation in Mena. The concentration of production in a handful of facilities makes the industry particularly important to local economies in Arkansas, where manufacturing jobs provide stable, high-wage employment. Between 2015 and 2023, employment in the motor and generator industry in Arkansas experienced a decline. Despite a surge from 2019 to 2020, employment in this industry fell by about 5 percent, while overall employment in the state increased by 11 percent.[38](#_edn38) (See figure 13).
**Figure 13: Employment in the motor and generator manufacturing industry in Arkansas**
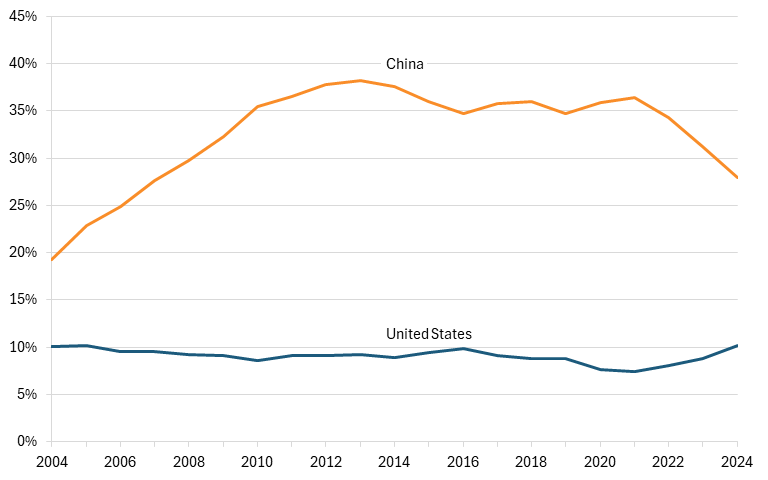
Despite its importance to Arkansas, the U.S. motor and generator industry has lost ground globally. China has rapidly increased its share of global exports, becoming a dominant supplier of electric motors and generators. In the early 2000s, the United States’ share of global exports of motors and generators (HS 8501, 8502, and 8503) exceeded that of China, with the United States holding about 10 percent of the global market while China held 9 percent. However, by 2005, China had surpassed the United States and continued to increase its global export share, rising from 9 percent to over 25 percent by 2024. In comparison, the U.S. share of global exports fell from 10 percent to 7 percent.[39](#_edn39)
**Figure 14: United States’ and China’s shares of global exports of motors and generators**
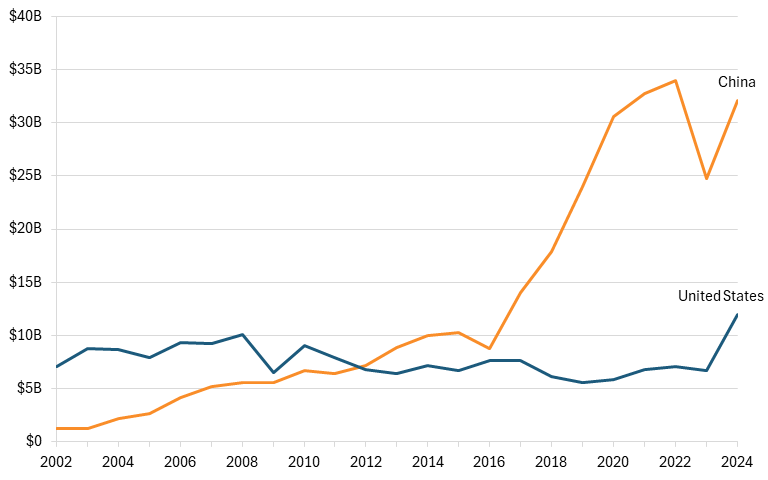
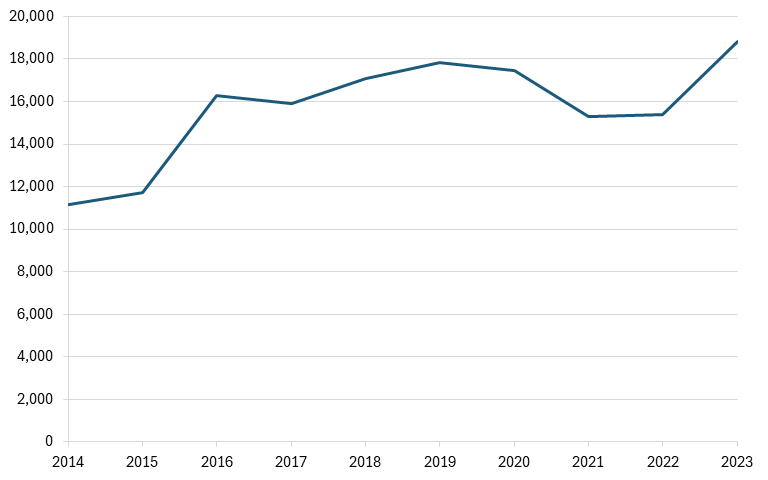
China’s rise in global market share has been driven in part by its ability to penetrate foreign markets, including the United States. U.S. imports of motors and generators from China increased substantially between 2004 and 2018, peaking at over $4 billion, a 420 percent increase, before declining slightly in recent years. Despite this decline, import levels remain significantly higher than over 20 years ago in 2004, demonstrating the continued presence of China’s producers in the U.S. market. (See figure 15.)
Being a significant input to critical infrastructure, the United States needs to have a strong and secure supply chain for motors and generators. Relying on imports from China in this industry leaves the United States vulnerable to economic coercion and national security risks.
**Figure 15: U.S. imports of motors and generators from China**
China’s rapid expansion in the motor and generator industry has occurred within a broader industrial strategy prioritizing the electrical equipment industry, recognizing it as a strategic manufacturing sector under the Made in China 2025 plan.[40](#_edn40) Made in China 2025 is a cohesive strategy for Chinese industrial dominance, outlining the government’s support for national champions in strategic industries through large-scale subsidization, tax credits, export seller credits, and more. These policies have supported the scaling of the Chinese electrical equipment industries, including motors and generators, and likely reduced costs for Chinese producers, allowing them to quickly gain market share globally.
China’s growing competitiveness is evident not only in its penetration of the U.S. market but also in third-country markets that have traditionally been dominated by U.S. firms. Canada and Mexico, the two largest export destinations for U.S. motor and generator manufacturers, are increasingly importing motor and generator products from China.[41](#_edn41) Over the past decade, the share of exports of motors and generators to Canada and Mexico from the United States has declined from about 75 percent to 50 percent, while China’s export share has grown from 3 percent to 23 percent, nearly a quarter of all imports.[42](#_edn42) (See figure 16.)
**Figure 16: United States’ and China’s shares of motors and generator exports to Canada and Mexico**
China’s continued expansion in motor and generator manufacturing poses a direct threat to U.S. firms and the regional economies that depend on them. As Chinese producers gain market share in both domestic and international markets, U.S. manufacturers may face declining exports, tighter profit margins, and reduced investment. In Arkansas, motor and generator manufacturing employment has already experienced a decline over the past several years, and the growing threat of China could worsen the situation still, translating into slower growth, reduced economic output, and potential jobs losses.
## California: Computer Storage Device Manufacturing (NAICS 334112)
California specializes in the computer and storage device manufacturing industry, which operates in a highly competitive global market. Although California remains home to many of the United States’ most important computer hardware and data storage firms, China’s extensive industrial support for electronics and information technology manufacturing has helped it become the dominant global producer and exporter in this space, posing a significant challenge to California’s future industry success.
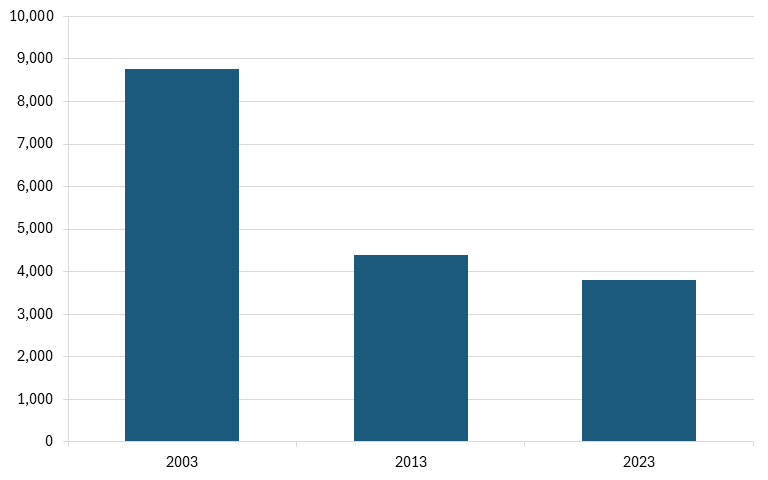
Computer and storage device manufacturing includes products such as servers, enterprise computing systems, and computer storage devices. These products are critical to the digital economy, particularly as the build-out of data centers continues and the demand for data storage supporting artificial intelligence (AI) continues to grow. California is the center of gravity for this industry in the United States, with many of the country’s leading firms in computing hardware, data infrastructure, and storage systems based in the state. California is home to Supermicro in San Jose, Western Digital in San Jose, and Apple in Cupertino. This concentration of firms has made California one of the country’s most important states for advanced computing hardware. At the same time, the industry has shrunk over the long term in employment terms. California’s employment in this industry fell from 8,761 workers in 2003 to 4,381 in 2013 and then to 3,799 in 2023, a decline of roughly 57 percent.[43](#_edn43) (See figure 17.) Still, 84 percent of the country’s workforce in this industry is in California, underscoring California’s importance to this industry.[44](#_edn44)
**Figure 17: Employment in computer storage device manufacturing in California**
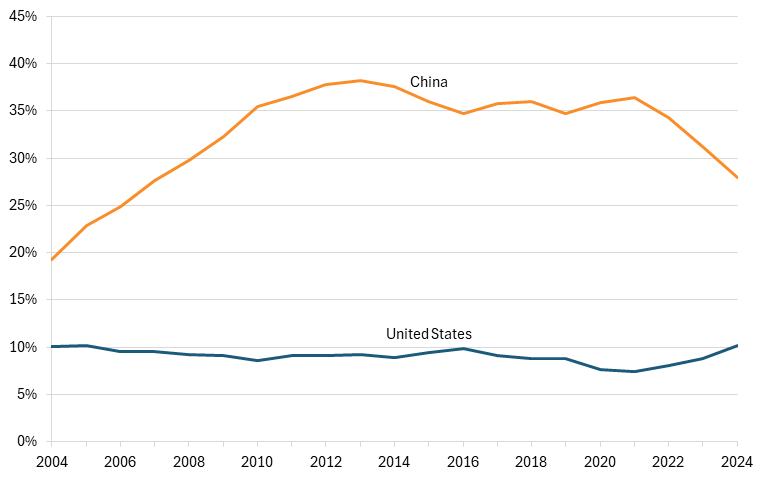
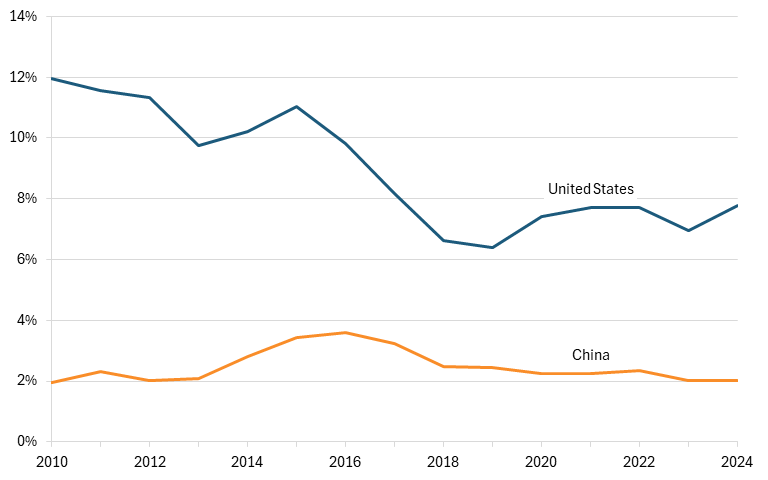
China has consistently held a larger share of the export market for computer storage devices (HS codes 8471, 8473, and 8523) than the United States has over the past two decades. In 2004, China accounted for about 20 percent of all exports in this industry, while the United States accounted for about 10 percent. China’s exports continued to increase relative to the rest of the world over the next decade, controlling about 37 percent of the export market at its peak in 2013, before declining for the next several years. In 2024, China’s exports in this industry accounted for one-quarter of all exports, while U.S. exports still sat at about 10 percent.[45](#_edn45)
**Figure 18: United States’ and China’s shares of global exports of computer storage devices**
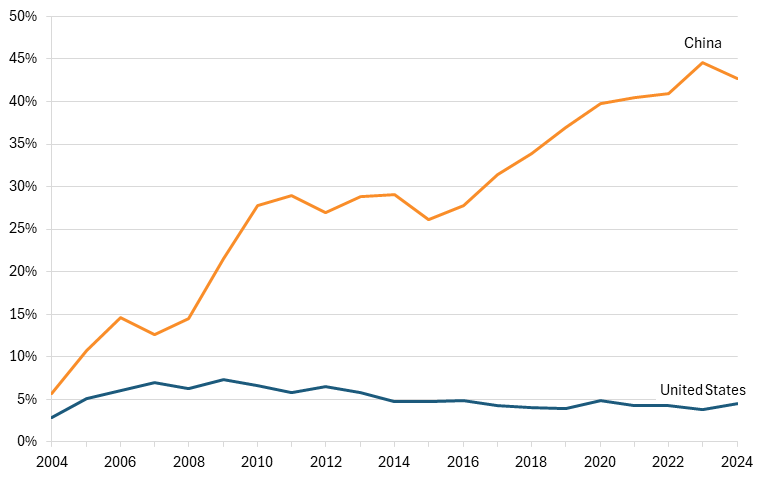
In East Asian markets, a critical region for technology exports such as computer storage devices, China’s market share has also surged. In 2024, China exported about 6 percent of all computer storage device products to Indonesia, the Philippines, and Vietnam, while the United States exported about 3 percent. By 2024, however, Chinese exports had surged, reaching 45 percent in 2023 before declining slightly to 43 percent in 2024. The United States’ exports to these markets, on the other hand, stagnated. By 2024, the United States accounted for about 5 percent of all exports to this region, a marginal increase from 20 years prior. The scale of China’s growth underscores its aggressive export expansion strategy and its dominance of third-country markets.[46](#_edn46)
**Figure 19: United States’ and China’s shares computer storage device exports to Indonesia, the Philippines, and Vietnam**
China’s dominance in computer and storage device manufacturing has been driven by a deliberate strategy to build a broader computing hardware stack. Under Made in China 2025, Beijing identified next-generation information technology as a priority sector and pushed implementation through national, provincial, and city-level guidance.[[47]](#_edn47) In practice, that support has enabled Chinese firms to produce high-value computer hardware, including servers, data center equipment, and other digital infrastructure products.[48](#_edn48) China’s vast domestic market for cloud services, enterprise IT, and digital infrastructure has further reinforced this growth, allowing domestic producers to scale rapidly before expanding abroad.
China’s concerted effort to build advanced manufacturing capacity and expand into higher-value products has been highly successful, driving a surge in exports and likely a substantial increase in global market share. While it’s difficult to conclude definitively that China’s rise in computer storage device manufacturing directly caused California’s employment decline or the stagnation of U.S exports, the correlation is clear.
China’s continued growth in this industry could be an even greater threat to California in the future. Should China continue its strategic investment in next-generation IT industries through industrial strategies similar to Made in China 2025, we can expect Chinese exports to continue rising while U.S. producers face growing pressure. For California, that would mean weaker export volume, lower profits, reduced output, and further job losses in the country’s most important computer and electronics manufacturing state.
## Colorado: Computer Storage Device Manufacturing (NAICS 334112)
Colorado has the second-largest computer storage device manufacturing industry in the country, operating in a highly competitive global market. Although the state remains home to important data storage and enterprise hardware capabilities, China’s rapid expansion in electronics manufacturing and data-storage supply chains poses a growing challenge to the future competitiveness of Colorado firms.
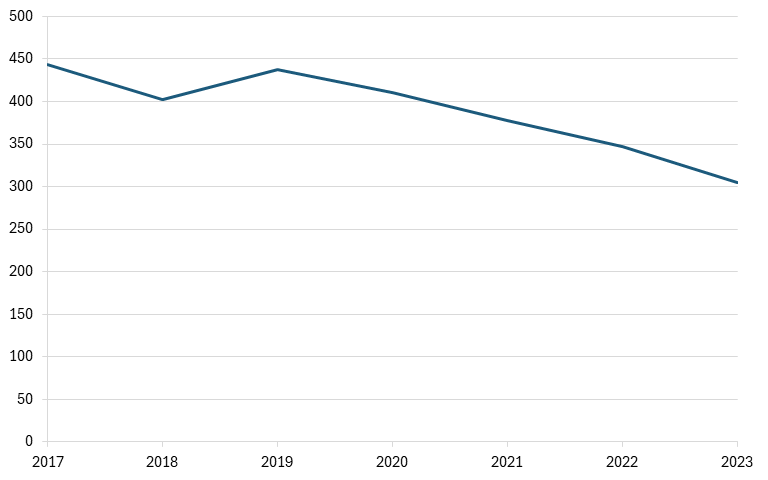
Computer and storage device manufacturing includes products such as servers, enterprise computing systems, and computer storage devices. These products are critical to the digital economy, particularly as the build-out of data centers continues, and the demand for data storage to support AI grows. Seagate Technology, a major global data-storage company, has a long-standing presence in Colorado, leading the industry in the state. Between 2017 and 2023, employment declined gradually, falling from about 450 to 300. Yet, as of 2023, 7 percent of the country’s workforce in this industry is still located in Colorado, making it the second-largest employer in the U.S. computer storage device industry, behind only California.[49](#_edn49)
**Figure 20: Employment in computer storage device manufacturing in Colorado**
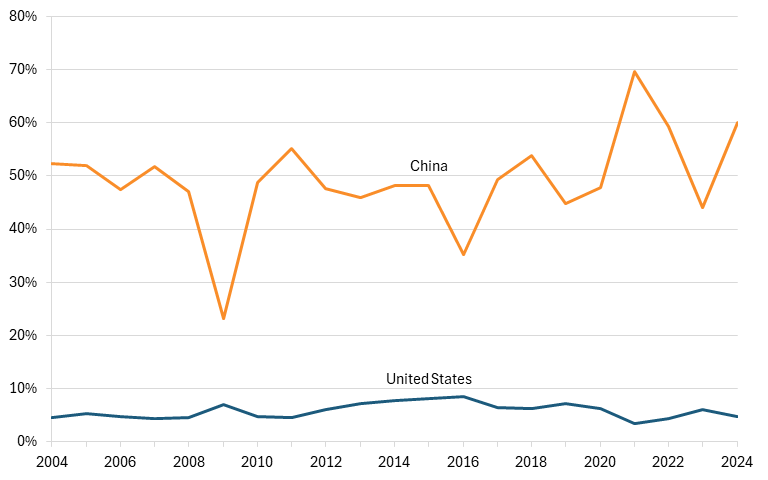
However, this industry, like many others, is being increasingly shaped by Chinese firms, themselves supported by large-scale industrial policy. China has outpaced the United States in global exports of computer storage devices (HS codes 8471, 8473, and 8523) over the past two decades, with China’s share of exports increasing from 20 percent in 2004 to 28 percent in 2024, and reaching a peak of 37 percent in 2023. The United States, on the other hand, has seen its share of global exports in this industry sit at about 5 percent over the same two-decade period.[50](#_edn50) (See figure 21.)
**Figure 21: United States’ and China’s shares of global exports of computer storage devices**
China accounted for about 6 percent of exports to Indonesia, the Philippines, and Vietnam in 2004, but by 2024, this share had increased substantially to nearly 45 percent. This increase also significantly widened the gap between China and the United States. U.S. exports to these markets in 2024 was very similar to 2004, with its share of exports increasing from 3 percent to just 5 percent.[51](#_edn51)
**Figure 22: United States’ and China’s shares of computer storage device exports to Indonesia, the Philippines, and Vietnam**

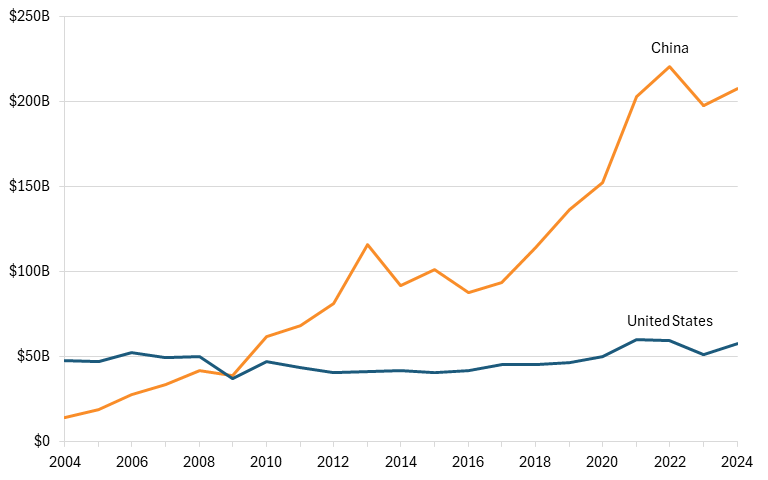
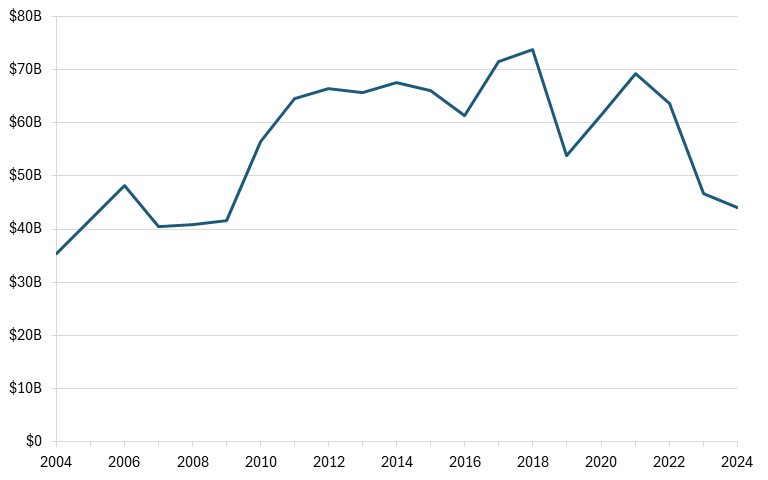
China has penetrated not only foreign, third-country markets but also the U.S. market. Imports of computer storage devices from China increased steadily from 2004 to 2018, rising from $35 billion to nearly $74 billion. In the years since, imports from China have declined gradually, falling to $43 billion, still a 25 percent increase since 2004.[52](#_edn52)
**Figure 23: U.S. imports of computer storage devices from China**
China’s dominance in computer and storage device manufacturing has been driven by a deliberate strategy to build out its broader computing hardware ecosystem. Under Made in China 2025, Beijing identified next-generation information technology as a priority sector and advanced that goal through coordinated national, provincial, and local policy support.[[53]](#_edn53) In practice, this support has helped Chinese firms expand production of higher-value computer hardware, including servers, data center equipment, and other digital infrastructure products.[54](#_edn54) China’s vast domestic market for cloud services, enterprise IT, and digital infrastructure has reinforced this growth, allowing domestic producers to achieve scale at home before expanding aggressively into foreign markets.
China’s concerted effort to build advanced manufacturing capacity and move into higher-value technology products has been highly successful, fueling a surge in exports and likely a substantial increase in global market share. While it is difficult to say definitively that China’s rise in computer storage device manufacturing has directly caused a decline in Colorado employment or the stagnation of U.S. exports, the correlation is hard to ignore.
China’s continued growth in this industry could pose an even greater threat to Colorado in the years ahead. If China continues to support next-generation IT industries through industrial strategies similar to Made in China 2025, Chinese exports are likely to continue rising while U.S. producers face mounting competitive pressure. For Colorado, China’s competition could still place pressure on the expanding industry, resulting in potential for lower profits, reduced output, and substantial job losses.
## Connecticut: Aircraft Engine and Engine Parts Manufacturing (NAICS 336412)
Connecticut is one of the most important states for aircraft engine and engine parts manufacturing in the United States, with a highly specialized workforce and a concentration of globally competitive firms. However, the industry operates in an increasingly competitive global market in which China’s state-backed push into aerospace manufacturing poses a growing long-term threat to U.S. leadership.
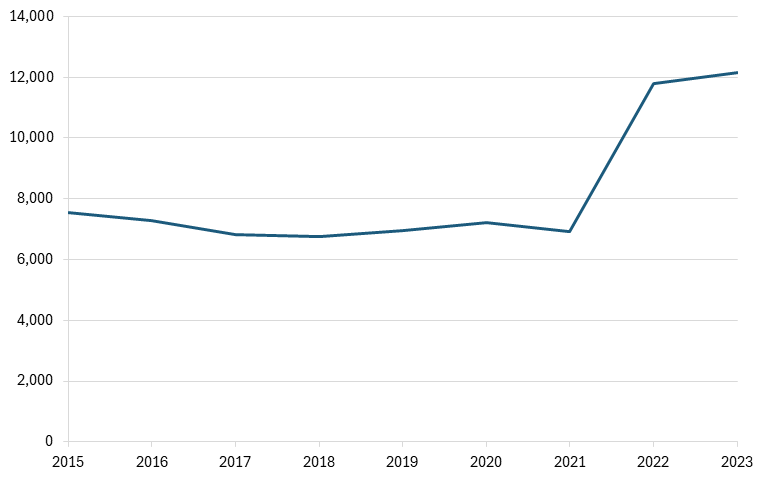
Aircraft engine and engine parts manufacturing includes the production of propulsion systems, turbines, and critical components used in both commercial and military aircraft. These products are essential to national defense, commercial aviation, and the broader aerospace supply chain. Connecticut plays an outsized role in this industry, anchored by major firms such as RTX, which owns Pratt & Whitney, a leading manufacturer of aircraft engines, and GE Aerospace, which maintains significant operations in the state. Sikorsky (a Lockheed Martin company) also contributes to the broader aerospace ecosystem in Connecticut.[55](#_edn55) Employment trends reflect the strength and growth of the industry over the past decade, with employment increasing from approximately 11,000 workers in 2014 to a peak of nearly 19,000 in 2023.[56](#_edn56) (See figure 24.)
**Figure 24: Employment in aircraft engine and engine parts manufacturing in Connecticut**
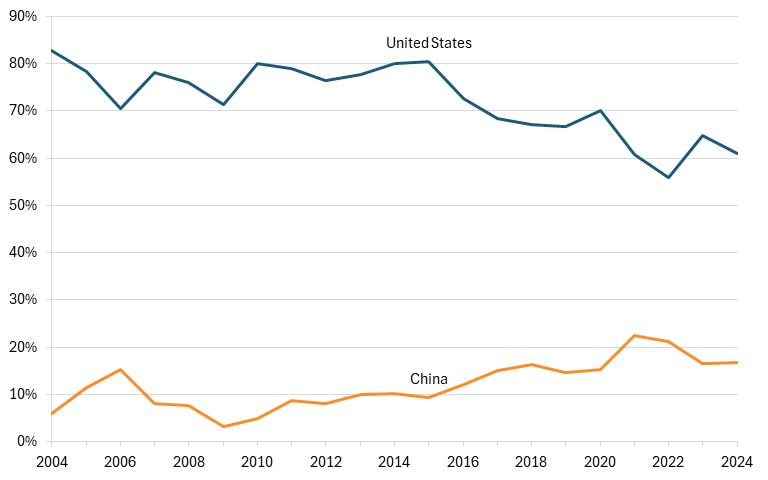
Despite Connecticut’s importance domestically, the United States has seen its position in the global aerospace supply chain face increasing pressure. Historically, the United States has maintained a strong lead in aircraft engine exports, but its share of global exports (HS codes 840710, 840910. 8411, 841210) has declined over time as other countries—including China—have expanded their capabilities. In the late-2000s, the United States accounted for over 13 percent of global exports in this industry, but that share has since fallen to below 10 percent in recent years. China’s share of global exports has also increased marginally over this period, from about 1.5 percent to 2 percent.[57](#_edn57) (See figure 25.)
China’s comprehensive five-year plan, Made in China 2025, identifies aerospace equipment as a priority sector, and therefore the Chinese government has provided extensive support to domestic aerospace firms through subsidies, state-directed financing, and government procurement policies.[58](#_edn58) For example, the Commercial Aircraft Corporation of China (COMAC), the country’s flagship civil aviation manufacturer, has received tens of billions of dollars in state support to develop indigenous aircraft such as the C919. According to the Center for Strategic and International Studies (CSIS), COMAC had received an estimated $49 billion in state subsidies and support mechanisms as of 2020.[59](#_edn59) However, it is notable that COMAC does not produce its own engines and instead relies on other firms.
**Figure 25: United States’ and China’s shares of global exports of aircraft engines and engine parts**
In addition to direct subsidies, Chinese aerospace firms benefit from preferential access to financing from state-owned banks, subsidized inputs, and government-backed R&D initiatives. The OECD has documented significant government support across China’s aerospace sector, noting that such policies reduce production costs, enable below-equity returns for investors, and allow firms to compete internationally even before achieving full technological parity.[60](#_edn60)
While China still lags behind the United States and key allies in high-performance jet engine technology, it has made notable progress. Programs such as the CJ-1000A jet engine aim to reduce reliance on foreign suppliers and build a fully domestic aerospace supply chain. Over time, this could allow Chinese firms to compete more directly in global markets, particularly in third-country exports.
Exports to some of the United States’ closest aerospace trading partners, including Canada, the United Kingdom, and Germany, closely mirror global trends.[61](#_edn61) The United States still holds a greater share of the export market in these countries than China does; however, its leadership has faced a slow decline. As of 2024, the United States accounted for 8 percent of all exports to these countries, while China accounted for just 2 percent.[62](#_edn62)
**Figure 26: United States’ and China’s shares of aircraft engine and engine part exports to Canada, the United Kingdom, and Germany**
China’s expansion into aerospace part manufacturing has broader implications for global market dynamics. As in other advanced manufacturing sectors, state support can enable overcapacity and pricing advantages that distort international competition. China’s sustained investment signals a long-term strategy to compete with established producers in the United States. For Connecticut, a state that is highly competitive in this industry and has seen its workforce grow over the past several years, these dynamics do not pose an imminent risk, but they could threaten the success of the industry in the long term.
## Delaware: In-Vitro Diagnostic Substance Manufacturing (NAICS 325413)
In-vitro diagnostic substance manufacturing is a growing advanced-manufacturing industry in Delaware. While China has expanded its presence in the global diagnostics market, the available evidence does not indicate that Chinese competition is currently a major cause for concern for Delaware producers, but it is something to watch out for in the future. China has benefited from substantial state support in the broader medical technology sector and has improved its capabilities over time, but the United States remains the far larger exporter of in-vitro diagnostic substances and continues to dominate exports to key advanced foreign markets. For Delaware, the data suggests that the state’s diagnostics industry is growing in a market wherein U.S. firms still hold a stronger competitive position.
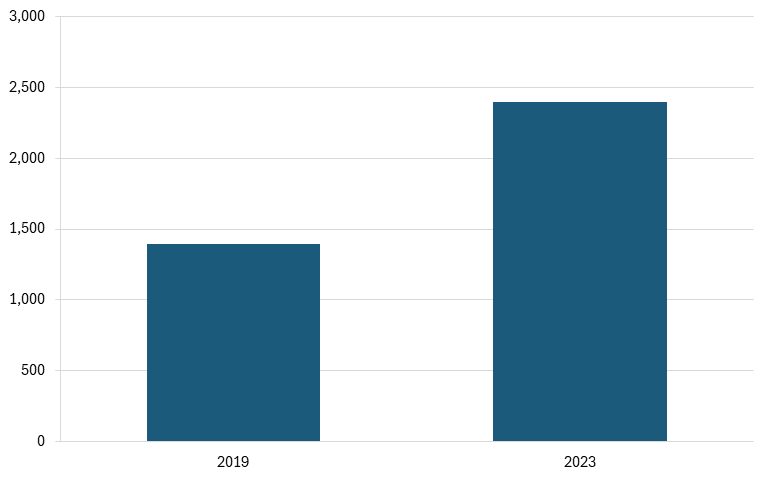
In-vitro diagnostic substance manufacturing includes the production of diagnostic and laboratory reagents, assay kits, calibrators, controls, and related products used to detect disease and monitor patient health. These goods are a critical part of modern health care and support hospital laboratories, chronic disease management, and infectious disease testing. Delaware has become a meaningful location for this activity. Employment in this industry in Delaware rose from about 1,400 in 2019 to 2,400 in 2023, an increase of 72 percent.[63](#_edn63) (See figure 27.) Though its workforce is relatively small in absolute terms, Delaware employs 6 percent of all workers in in-vitro diagnostic substance manufacturing, making it home to a significant share of the national workforce. The state is home to several major firms in this industry, including Siemens Healthineers, which, in 2021, announced that it would invest more than $32 million to expand its laboratory diagnostics manufacturing facility in Newark, Delaware, increasing its manufacturing capacity.[64](#_edn64)
**Figure 27: Employment in in-vitro diagnostic substance manufacturing in Delaware**
China has invested heavily in its biopharmaceutical and medical devices industries, with these sectors among the 10 critical industries highlighted in its Made in China 2025 strategy. Under Made in China 2025, China mobilized federal, state, and local funding to support critical industries and elevate national champions, aiming to lead the world in advanced manufacturing and strategic industries.[65](#_edn65) And though China has made significant strides in all these industries, it has failed to make a meaningful mark in the in-vitro diagnostic substance industry, lagging behind the United States in total exports.
The United States’ export share of in-vitro diagnostic substances (HS codes 3002 and 3822) has actually fallen in recent years, despite the United States’ leadership and the industry’s growth in states such as Delaware. From 2004 to 2024, the share of global exports from the United States declined from 22 percent to 17 percent, with the low point occurring during the COVID pandemic, when medical device manufacturing increased globally. Despite this decline, the United States still maintains a meaningful lead over China, whose exports have accounted for close to 0 percent of the total market for most of the period from 2004 to 2024. Notably, China’s exports increased sharply during the pandemic, reaching a peak global export share of 7 percent, but have since declined back to pre-2020 levels.[66](#_edn66) (See figure 28.)
**Figure 28: United States’ and China’s shares of global exports of in-vitro diagnostic substances**
Similarly, China has failed to make inroads into the United States’ most prominent export markets. Looking at the three largest export destinations for U.S. in-vitro diagnostic substances (excluding China), the United States still dominates the market, accounting for 25 percent of all exports in 2024.[67](#_edn67) China, on the other hand, accounted for just 0.3 percent of exports to these markets in 2024, down from its surge in 2020, further demonstrating its weakness in this industry relative to the United States.[68](#_edn68) (See figure 29.)
That said, China has demonstrated its ability to rapidly increase output and gain market share in industries it deems critical to national power, and it has long treated medical technology as one of these industries. Under Made in China 2025, China set a goal of increasing its global market share in this industry by developing 5 to 10 globally recognizable brands, which the U.S.-China Economic and Security Review Commission finds China has succeeded at.[69](#_edn69) They also set a goal of procuring 70 percent of hospital medical devices domestically, which China has not yet achieved. The localization rate for in-vitro diagnostic equipment was about 46 percent in 2024.[70](#_edn70)
Additionally, a report from MERICS finds that Chinese medical technology firms received measurable financial support from the government between 2017 and 2022, including subsidies, tax incentives, and below-market financing. Overall, government support grew from $725 million in 2017 to between $2.9 billion and $3.9 billion in 2022.[71](#_edn71) This support was equivalent to at least 25 percent of companies’ net profit over that period. With such substantial support for firms and a clearly defined plan to increase competitiveness and global market share, medical device manufacturers in China have the means to become major competitors in the future, posing a potential threat to the dominance of the U.S. in-vitro diagnostic industry.
**Figure 29: United States’ and China’s shares of in-vitro diagnostic substance exports to Germany, Japan, and the Netherlands**
For Delaware, the main takeaway is that China’s role in this industry should be viewed as a long-term development rather than an immediate threat. Delaware’s in-vitro diagnostic substance manufacturing base has expanded in recent years, with employment growing substantially and large investments on the way, helping the United States to lead the world in this industry. Conversely, China has seen minimal growth in this industry’s exports, suggesting that Chinese firms have thus far failed to challenge their U.S. counterparts. However, if Chinese firms continue to receive substantial state support, they could become more formidable competitors in the future, posing a threat to the U.S. industry’s success.
## Florida: Computer Terminal and Other Computer Peripheral Equipment (NAICS 334118)
Florida is a strong producer of computer terminals and peripheral equipment, particularly in high-value segments such as enterprise hardware, storage systems, and defense-related electronics. However, China’s growth in the industry, supported by state-backed industrial policies, poses a significant challenge to the long-term competitiveness of U.S. producers.
Computer terminal and other computer peripheral equipment manufacturing includes products such as monitors, terminals, storage devices, servers, and input/output peripherals. These products are critical inputs into the broader information technology ecosystem, supporting industries ranging from cloud computing and telecommunications to defense and aerospace systems. Notably, these products are increasingly valuable because of their necessity for data center construction.
Florida is home to several major firms in this industry, including Jabil Inc., one of the largest electronics manufacturing services firms in the world, and TD SYNNEX, a distributor of information technology. These firms, along with several others, support one of the largest workforces for this industry in the country, employing 12 percent of the U.S. workforce. Despite the industry’s growing importance and Florida’s strength, employment has remained relatively stagnant. Between 2017 and 2023, employment in this industry increased by just 36 workers, from 1,200 to 1,236.[[72]](#_edn72) (See figure 30.)
**Figure 30: Employment in computer terminal and computer peripheral equipment manufacturing in Florida**
However, like other technology manufacturing industries, the United States remains a relatively small player in the global market, especially compared with China. Under the Made in China 2025 strategy, Beijing identified next-generation information technology as a priority sector and pushed implementation through national, provincial, and city-level guidance.[[73]](#_edn73) In practice, that support has enabled Chinese firms to produce high-value computer hardware, including servers, terminals, and other digital infrastructure products.[74](#_edn74) China’s vast domestic market for cloud services, enterprise IT, and digital infrastructure has further reinforced this growth, allowing domestic producers to scale rapidly before expanding abroad.
China’s concerted effort to build advanced manufacturing capacity in computer equipment and next-generation IT has been highly successful, driving a surge in exports and likely a substantial increase in global market share. It has also enabled Chinese firms to emerge as global leaders. Lenovo, for example, was the world’s largest PC manufacturer as of 2024, accounting for roughly one-quarter of global shipments.[75](#_edn75) Other major firms, including Huawei and Inspur, are leading producers of enterprise computing equipment, while contract manufacturers such as Foxconn operate large-scale facilities in China that supply global markets.
While China has consistently exported more computer terminals and peripheral equipment (HS codes 8471 and 8473) than the United States has since the early 2000s, the gap has widened over the past two decades. From 2004 to 2024, China’s share of global exports grew from approximately 20 percent to 30 percent, peaking at about 41 percent around 2013. In contrast, the United States’ share of exports stagnated, staying at about 10 percent or less over the 21-year period.[76](#_edn76) (See figure 31.)
**Figure 31: United States’ and China’s shares of global exports of computer terminals and other computer peripheral equipment**
China’s rapid export growth has been driven by its ability to dominate third-country markets, particularly in Asia. Malaysia, Vietnam, and the Philippines—three key electronics manufacturing hubs—serve as critical destinations for intermediate goods used in global supply chains. Over the past two decades, China’s share of exports of computer peripheral equipment to these countries has increased significantly, rising from about 16 percent to about 35 percent from 2004 to 2024, and peaking at 45 percent in 2023. In contrast, The United States’s share of exports to these markets again stayed stagnant between 5 and 10 percent.[[77]](#_edn77)
**Figure 32: United States’ and China’s shares of computer terminal and other computer peripheral equipment exports to Malaysia, Vietnam, and the Philippines**
China’s push for dominance in the global computer hardware market poses a direct threat to U.S. producers, and its growth is unlikely to slow. As Chinese firms continue to benefit from extensive state support and rapidly increase exports, especially into key third-country markets, U.S. firms will also continue to face reduced export opportunities, risking the growth of the already large gap between the United States and China. In Florida, where this industry supports high-value manufacturing and high levels of skilled employment, continued erosion of global competitiveness could translate into slower growth, reduced investment, and weaker job creation, posing a long-term risk to the state’s economy.
## Georgia: Storage Battery Manufacturing (NAICS 335911)
Georgia is specialized in and dependent on the storage battery industry, which operates in a highly competitive global market. However, by using mercantilist policy instruments such as subsidies and tax incentives, China has rapidly expanded its manufacturing capacity in this industry, moving it from a nation on par with the United States to a global leader. Though recent policy actions have strengthened the Georgia battery economy, China’s dominance is likely to pose a challenge to the sector’s future success.
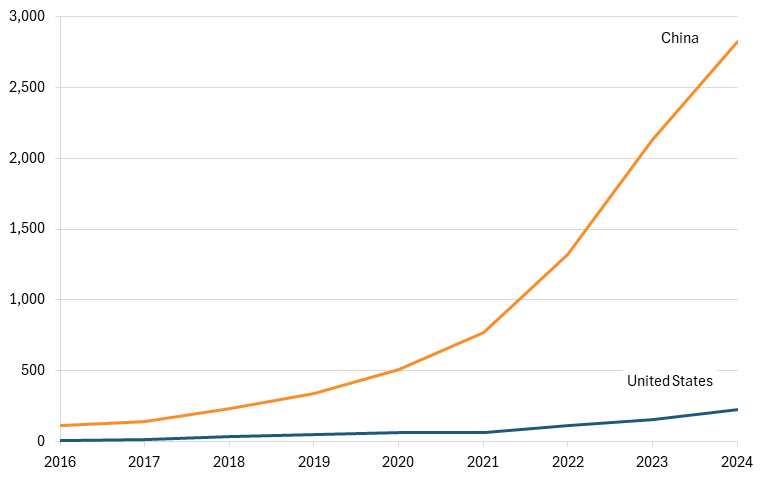
Storage battery manufacturing, which includes the production of rechargeable batteries, including lithium-ion and lithium iron phosphate (LFP), is a critical input to several national power industries, including electric vehicles (EVs) and renewable energy storage, and Georgia is a critical producer of these products in the United States. Following the passage of the Inflation Reduction Act (IRA), which provides tax credits for EVs with battery minerals and components sourced in North America, Georgia received billions of dollars in investment for battery production as SK On, LG Energy, and several EV companies constructed factories in the state.[78](#_edn78) Of the national workforce in this industry, 13 percent is reside in Georgia, totaling 4,200 workers directly employed, a more than sixfold increase in the size of the workforce compared with 2015.[79](#_edn79) (See figure 33). Additionally, following the completion of an LG Energy Solutions plant in Bryan County in 2026, another 3,000 workers will be employed in the state.[80](#_edn80) However, the repeal of the EV tax credits under the Trump administration could be detrimental to the industry. The International Council on Clean Transportation has estimated that by 2030, the loss of the EV tax credit could risk 7,000 jobs in battery pack and cell component manufacturing and recycling.[81](#_edn81)
**Figure 33: Employment in storage battery manufacturing in Georgia**
Regardless of the future of Georgia’s battery manufacturing economy, the state’s current strength in this industry is relatively small compared with China’s. In 2024, China accounted for 85 percent of global battery production capacity, while the United States held less than 10 percent. Looking specifically at lithium-ion batteries, China’s capacity was about 12 times that of the United States.[82](#_edn82) (See figure 34.)
**Figure 34: Lithium-ion battery manufacturing capacity (gigawatt hours)[83](#_edn83)**
China’s dominance in the battery industry would not be possible without the support of China’s federal and provincial governments, which have used a concerted strategy of industrial subsidies, research and development (R&D) financing, and vertical integration to support the increase and advancement of Chinese battery supply, while using EV adoption incentives and minimum battery purchase mandates to boost demand.
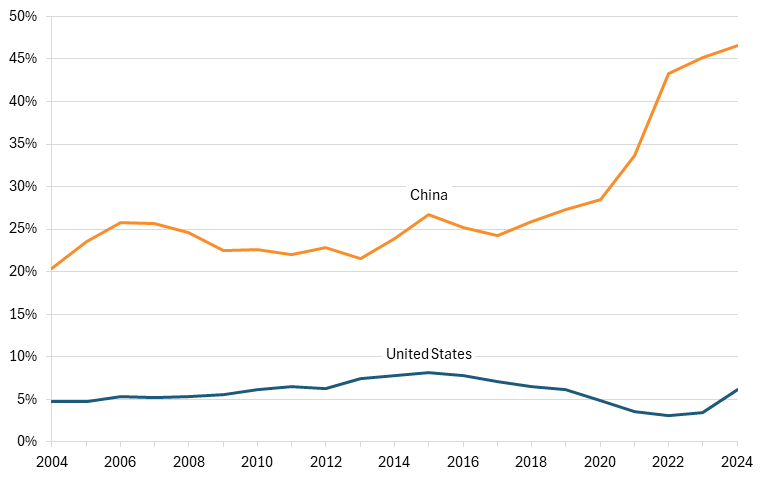
Perhaps the most powerful reason Chinese firms have been able to innovate and rapidly increase production in the battery industry is their complete vertical integration. China mines over two-thirds of the world’s graphite and 18 percent of its lithium—two key inputs to batteries—and overall extracts 60 percent of all rare earth minerals mined annually in the world. China also holds a near monopoly on the processing of rare earth minerals. In 2023, China refined 95 percent of the world’s manganese, 70 percent of cobalt and graphite, 67 percent of lithium, and more than 60 percent of nickel. In the transition of these minerals to battery components, China accounts for more than 90 percent of global cathode and anode material capacity.[84](#_edn84) Moreover, China’s dominance is expected to continue and grow, with the International Energy Agency (IEA) estimating that more than 77 percent of refined rare earths will come from China by 2030.[85](#_edn85) By dominating the battery supply chain, Chinese battery makers gain first access to key intermediate inputs for battery production, purchase these products at lower prices, experiment with new chemical combinations before competitors can, and potentially block competitors from accessing materials.[86](#_edn86)
Additionally, China’s federal and provincial governments have provided battery producers with substantial subsidies. CATL, China’s largest battery maker, received $1.8 billion from the Chinese government in subsidies from 2018 to 2023, while EVE Energy, the country’s fourth-largest battery producer, received $209 billion in 2023 alone. The government has also provided battery makers with R&D subsidies, helping Chinese firms stay ahead of global competition and boost sales. CATL and BYD, which together produce nearly half of all batteries globally, received nearly $830 million in research support to produce solid-state batteries, the next generation of storage batteries.[87](#_edn87)
The Chinese government has also boosted sales of its national champions in battery manufacturing by incentivizing EV adoption and the use of storage batteries. Since 2009, the Chinese government has invested hundreds of billions of dollars in advancing the EV industry, enabling Chinese EVs to be the cheapest in the world, often priced below cost. China has also implemented financial incentives for EV owners, such as waiving the license plate fee, exempting EVs from traffic control measures (which limit the number of cars on the road), and developing the world’s largest public charging infrastructure.[88](#_edn88) In the energy sector, the Chinese government began requiring firms to add 10 to 30 percent of battery storage to their grids for each gigawatt of wind or solar power, increasing demand for batteries.[[89]](#_edn89) By incentivizing EV and battery storage adoption, the Chinese government has catalyzed demand for batteries, boosting industry sales.
It’s no surprise that, given these favorable policies, China has become the world’s largest battery manufacturer. In 2024, China’s share of storage battery exports (HS code 8507) reached a peak of 46 percent, meaning that almost half of all storage batteries exported originated in China. China’s exports are far above those of the United States, despite recent investments in the industry, as U.S. exports accounted for just over 5 percent of global exports in 2024, as seen in figure 35.
**Figure 35: United States’ and China’s shares of global exports of storage batteries**
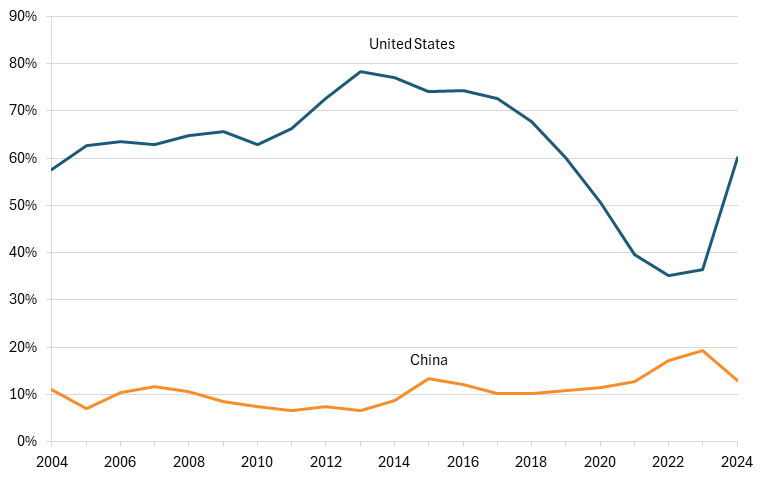
Despite its dominance in the storage battery industry, China has so far failed to take a significant share of the export market of America’s closest trade partners. Canada and Mexico are the two largest destinations for U.S. storage battery exports, and for much of the early to mid 2000s, the United States accounted for the majority of battery exports to those two countries. Its share of exports increased from 60 percent to about 80 percent from 2004 to 2013, but then experienced a decline, falling to a nadir of just 35 percent in 2022. In the years since, U.S. exports have rebounded, jumping back to 60 percent in 2024. In contrast, China has slowly increased its exports to these countries, with its export share increasing from about 10 percent in 2004 to 20 percent in 2023. In 2024, China’s share of exports to Canada and Mexico declined to 13 percent, as shown in figure 36.
**Figure 36: United States’ and China’s shares of storage battery exports to Canada and Mexico**
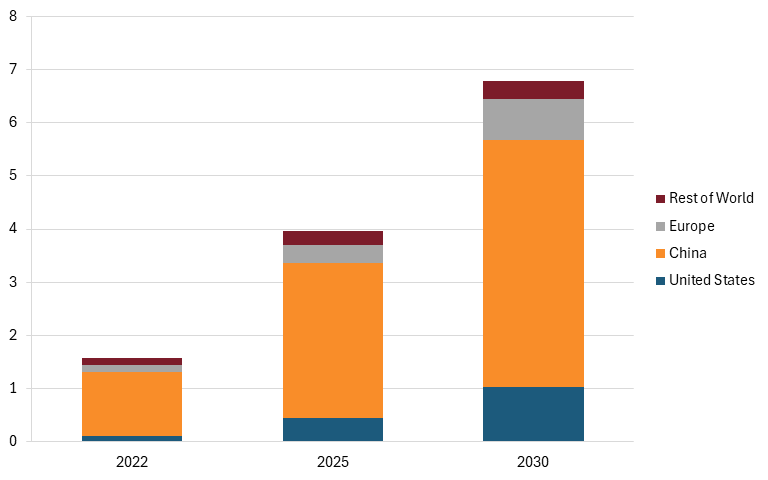
According to IEA, China is expected to increase its battery manufacturing capacity significantly over the next several years, but additional capacity created in the United States and Europe in response to a critical need to diversify the battery supply chain is set to erode China’s lead in global market share. By 2030, IEA estimates that China will account for about two-thirds of the global market share, and its manufacturing capacity will rise to 4.7 terawatt-hours (TWh). The United States, heavily influenced by the growth of domestic manufacturing in states such as Georgia, is expected to see its lithium-ion battery manufacturing more than double between 2025 and 2030, reaching 1 TWh. (See figure 37).
**Figure 37: Lithium-ion battery manufacturing capacity, TWh (projected for 2025 and 2030)[90](#_edn90)**
China’s dominance in battery manufacturing poses a direct threat to U.S. firms seeking to enter or expand in the global battery market, and recent U.S. policy actions put the future of battery manufacturing in Georgia and other states at risk. As Chinese firms continue to benefit greatly from favorable policies and massive subsidies from the federal and provincial governments, American policymakers must view battery manufacturing not just as another industry but also as one critical to national power. In Georgia, the storage battery industry has been a boon to the economy, resulting in thousands of jobs and high levels of economic growth. However, failing to protect and empower this industry on the state and federal levels will threaten the progress that has already been made, resulting in the continued loss of global market share, slower growth, and weaker job creation—a threat to the Georgia economy.
## Hawaii: Optical Instrument and Lens Manufacturing (NAICS 333314)
Hawaii has developed a niche but strategically important presence in optical instrument and lens manufacturing, an industry that supports scientific research, defense, and advanced imaging technologies. However, the industry operates in an increasingly competitive global market in which China’s rapid expansion—supported by concerted industrial policy and state-backed financing—poses a growing threat to U.S. producers.
Optical instruments and lens manufacturing includes the production of microscopes, telescopes, surveying instruments, and precision optical components used across aerospace, defense, medical, and research applications. Institutions in Hawaii, such as the University of Hawaii and observatories on Mauna Kea, have helped foster a localized ecosystem of optical engineering and precision manufacturing.[91](#_edn91) Firms such as Oceanit Laboratories and smaller precision optics contractors contribute to this specialized manufacturing base, often serving defense and research markets.[92](#_edn92)
Despite its relatively small size, Hawaii’s optical manufacturing workforce has remained stable and has shown modest growth in recent years. Employment declined from just over 50 workers in 2018 (the first year of available data) to about 34 in 2020, then rebounded to approximately 51 by 2023, reflecting both the volatility and resilience of this niche sector.[93](#_edn93)
**Figure 38: Number of workers in optical instrument and lens manufacturing in Hawaii**
At the national level, the United States remains a significant producer of high-end optical instruments, particularly in advanced and defense-related applications. However, it is a relatively small player in the global export market compared with China, which has rapidly expanded its production capacity across a wide range of optical goods, including lower- and mid-range instruments.
China’s rise in the optical instruments and lens industry has been substantial. In the early 2000s, China held a larger share of global exports (HS code 9001, 9002, 9005, 9011, 9013), than the United States did, holding about 17 percent compared with the United States’ 9 percent. Over the next decade, China steadily increased its share, reaching a peak of 33 percent in 2021, while the United States saw its share hover between 4 and 7 percent. However, in 2022, Chinese exports experienced a sudden dip, dropping to about 16 percent in 2024, while the U.S. export share increased to 12 percent.[94](#_edn94) (See figure 39.)
**Figure 39: United States’ and China’s shares of global exports of optical instruments and lenses**
China’s dominance in this industry (at least up until 2022) has been enabled in large part by Chinese government support. Optical and precision instruments are identified as priority sectors under China’s Made in China 2025 strategy, which emphasizes high-end manufacturing and technological self-sufficiency.[95](#_edn95) Chinese firms benefit from a range of policy tools, including direct subsidies, tax incentives, discounted land, and below-market financing from state-owned banks. According to analyses by the OECD, such support mechanisms reduce production costs and allow Chinese firms to scale rapidly, often leading to overcapacity and downward pressure on global prices.[96](#_edn96)
Major Chinese firms in the optical instruments industry include Sunny Optical Technology, one of the world’s largest manufacturers of optical components and camera modules, as well as firms such as OFILM, which produces optical and imaging components for consumer electronics and industrial applications.[97](#_edn97) These firms have benefited from strong domestic demand and government-backed expansion into global markets. In contrast, U.S. optical manufacturing is concentrated in high-value, specialized segments. Leading American firms such as Teledyne Technologies focus on precision optics, photonics, and scientific instrumentation for specific industries.[98](#_edn98)
China’s continued expansion in optical manufacturing—fueled by state support, economies of scale, and aggressive export strategies—poses a long-term risk to U.S. producers. As Chinese firms move up the value chain and compete more directly with high-end manufacturers, the competitive pressures facing U.S. firms are likely to intensify. For Hawaii, where the industry is small and highly specialized, these global dynamics translate into heightened vulnerability. Maintaining a strong foothold in this industry will depend on continued investment in research, innovation, and defense-related applications. Without such support, the state’s niche optical manufacturing sector risks being overshadowed by lower-cost, state-backed competitors in the global market, and the United States risks ceding greater shares of the export market to Chinese competitors.
## Idaho: Semiconductor and Related Device Manufacturing (NAICS 334413)
Idaho is specialized in and dependent on the semiconductor industry, which operates in a highly competitive global market. Micron, a leading producer of memory semiconductors that’s headquartered in Idaho, is poised to make a significant investment in the Idaho economy and increase manufacturing output. However, China’s extensive subsidies to its own memory chip manufacturer pose a significant challenge to Micron’s future domestic manufacturing success.
The semiconductor industry is Idaho’s largest export industry, exporting $539 million in 2022.[99](#_edn99) It is also one of the largest employers in the state, employing just over 6,000 workers in 2023. However, since 2018, employment in the semiconductor manufacturing industry has declined by roughly 9 percent while Idaho’s overall workforce has increased by nearly 19 percent, demonstrating a decline in the industry despite high levels of economic output.[100](#_edn100) (See figure 40).
**Figure 40: Employment in the semiconductor manufacturing industry in Idaho**
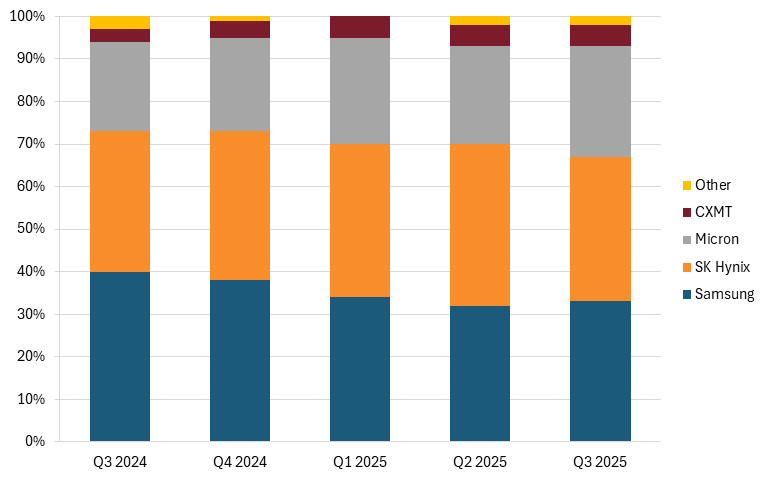
Micron, one of the largest dynamic random access memory (DRAM) chip manufacturers in the world, is the state’s largest employer, employing 10,000 workers and contributing substantially to the $2.5 billion in value added created by the Idaho semiconductor industry.[101](#_edn101) DRAM chips are essential for the construction of data centers and the build-out of AI, as they provide the high-bandwidth memory needed to power AI server computations.[[102]](#_edn102) Micron controls 26 percent of the global market share in this industry, behind South Korean firms Samsung and SK Hynix.[[103]](#_edn103) Though this industry has historically been dominated by these three firms, Chinese competitor ChangXin Memory Technology (CXMT) has made waves in the global market, rising to the fourth-largest firm and holding 5 percent of global market share in late 2025.[[104]](#_edn104) (See figure 41.)
CXMT was founded by the local government of the Chinese city of Hefei and receives substantial subsidies from the Chinese national government.[[105]](#_edn105) The Chinese government plans to invest over $150 billion in the semiconductor industry by 2030, nearly three times the $52 billion invested by the United States in the CHIPS and Science Act in 2022.[[106]](#_edn106) What’s more, the Chinese government has recently indicated that DRAM memory technologies are a priority area for future subsidies, a benefit for CXMT, and a potential threat to Micron.[[107]](#_edn107)
**Figure 41: Global DRAM chip market share by revenue[108](#_edn108)**
Despite Micron’s success, memory chip manufacturing has historically been offshored, with very few fabs operating in the United States. However, Micron has announced that it will increase its investment in the U.S. semiconductor manufacturing industry, with plans to build two new fabs in Idaho, one of which will be operational by 2027.[[109]](#_edn109) These investments will likely increase U.S. exports of memory chips (HS 854232), which fell by 64 percent from 2014 to 2024. In comparison, China, with its significant subsidies, saw exports increase nearly threefold over the same period. (See figure 42.)
**Figure 42: Memory semiconductor exports**
However, Micron’s expansion of domestic production does not guarantee increased exports. The U.S. Commerce Department has noted that China’s chip industry expansion poses a threat to new chip facilities in the United States, and that new Chinese chip capacity could lead U.S. and allied countries’ fabs to produce fewer chips than is necessary to remain profitable.[[110]](#_edn110) Between 2022 and 2026, China is expected to increase production capacity by building more new fabs and completing more major expansions than any other region in the world, bringing 26 facilities online, compared with only 16 in the Americas.[111](#_edn111) (See figure 43.)
**Figure 43: New fabs and major expansions to come online, 2022–2026[112](#_edn112)**
The high subsidies in the Chinese semiconductor industry enable Chinese firms to sell semiconductors at lower prices than U.S. competitors can, at times selling chips below production cost. Chinese manufacturers sell chips 30 to 50 percent cheaper than U.S. suppliers, making their products more attractive in third-party markets.[113](#_edn113) U.S. exports of memory chips to Malaysia, Singapore, and Vietnam have grown at a fraction of the pace of China’s since 2014, with Chinese exports to these markets 38-times greater in value than U.S. exports. (See figure 44.)
**Figure 44: Memory semiconductor exports to Malaysia, Singapore, and Vietnam**
In China’s Made in China 2025 strategy, the government explicitly aims to achieve 70 percent self-sufficiency in semiconductor products by 2025 and to become the leader in semiconductor manufacturing, including DRAM chips, by 2030.[114](#_edn114) Although these goals haven’t yet been reached, China-based firms are expected to continue to grow rapidly as policy support and government subsidy programs remain aligned with these objectives.
China’s push for dominance in the global semiconductor market and its emergence in the memory chip market pose a direct threat to U.S. firms, and its progress is not expected to slow.[[115]](#_edn115) As Chinese producers replace U.S. suppliers domestically and expand aggressively into third-country markets, U.S. semiconductor exports will face sustained erosion in global market share, revenue, and profitability. Chinese firms such as CXMT will continue to receive financial benefits unmatched by U.S. competitors, enabling them to retain and gain market share at the expense of American and allied firms. Chinese authorities will continue to aggressively subsidize the semiconductor industry in order to reach their $150 billion target, thereby contributing to artificially low prices for Chinese firms. For Idaho, which has seen both a recent decline in its semiconductor industry and heightened investment in the industry, these trends are worrying, as China’s dominance in this industry could translate into slower growth and weaker job creation in the state’s most important traded industry.
## Illinois: Construction Machinery Manufacturing (NAICS 333120)
Illinois is specialized in and dependent on the construction equipment manufacturing industry, which operates in a highly competitive global market. Despite the dominance of American firms in this industry, many of which are based in Illinois, Chinese firms have become legitimate players on the global stage. China’s use of subsidies and artificial demand shocks has contributed to the rapid growth of Chinese construction equipment manufacturers, posing a significant risk to the future success of American firms.
Machinery manufacturing is the second-largest export industry in Illinois (behind chemical manufacturing), with exports valued at $12.5 billion in 2024.[116](#_edn116) Construction machinery exports alone accounted for $1.8 billion, driven by the presence of some of the largest manufacturers in the world.[117](#_edn117) Illinois employs about 1/10th of the country’s workforce in construction machinery manufacturing, with about 5,500 employees as of 2023. However, the number of employees has declined by about 7 percent since 2017, while, in comparison, Illinois’s total workforce has grown by 3 percent.[118](#_edn118) (See figure 45.)
**Figure 45: Employment in construction machinery manufacturing in Illinois**
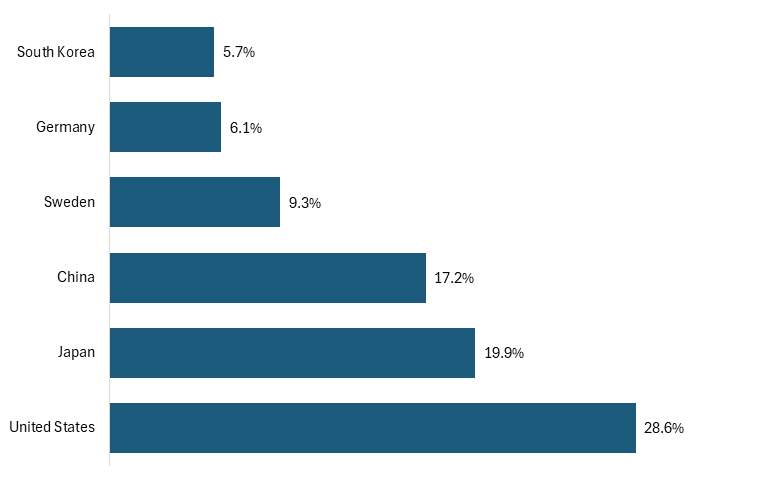
Caterpillar and John Deere, the first and third-largest construction equipment manufacturers by global revenue, are each headquartered in Illinois, while Komatsu, the second-largest firm by global revenue, also maintains manufacturing operations in the state.[119](#_edn119) In total, American firms control roughly 27 percent of the global market share in this industry, ahead of Japan (21 percent) and China (18 percent). (See figure 46.)
**Figure 46: Global market share in construction equipment by revenue, 2025[120](#_edn120)**
However, American leadership in this industry is far from guaranteed. While employment has declined in Illinois, U.S. global market share has also seen a decline, falling by more than 1 percentage point between 2024 and 2025, while China increased its market share by an equal amount. Chinese firms have benefited from the national government’s financial and policy support, including several policies that increase demand for industrial equipment. First, Chinese construction equipment firms have received direct government subsidies, enabling them to produce more goods and sell them at lower prices. In 2022 and 2023, XCMG, the largest construction manufacturer in China and the fourth-largest in the world, received $56 million and $94 million in government subsidies, respectively.[[121]](#_edn121) The European Union has also found evidence of subsidization and dumping by the Chinese construction equipment industry, which allowed Chinese firms to sell products at below-market prices, making it difficult for European firms to compete.[[122]](#_edn122)
In March 2024, the Action Plan for Promotion of Large-Scale Equipment Replacement and Trade-in of Consumer Goods called for a 25 percent increase in capital investment for equipment in seven key industries by 2027, including the construction industry. This domestic-demand shock for equipment manufacturers is estimated to increase industrial equipment purchases by approximately $38.8 billion. In support of this initiative, the government also passed a series of financial support vehicles to further incentivize the purchase of construction equipment. These vehicles included value-added tax exemptions and special loans valued at $69 billion for specific industries and small businesses. While these incentives will apply to construction equipment from all countries, the U.S. International Trade Administration (ITA) has noted that domestically manufactured products will be prioritized when possible, advantaging Chinese firms.[123](#_edn123)
With the help of these initiatives, three Chinese firms are now among the world’s 15 largest construction equipment manufacturers, and one has grown rapidly. Between 2015 and 2025, XCMG saw its revenue grow at a compounded annual growth rate (CAGR) of 8 percent, exceeding those of John Deere, Komatsu, and Caterpillar. Zoomlion, another Chinese firm, experienced a 3 percent CAGR. (See figure 47.) Growing at a faster rate than American and allied firms, XCMG, Zoomlion, and other Chinese firms such as Sany present a real threat to American leadership in this industry.
**Figure 47: CAGR of revenue, 2015–2025[124](#_edn124)**
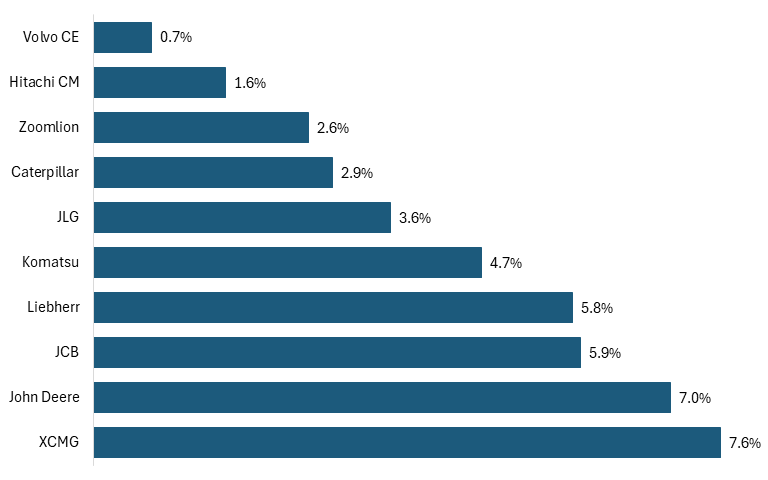
The financial support provided to Chinese firms has made their goods cheaper and more plentiful on the global market. Despite exporting more than twice the value of construction equipment than China did throughout the early 2000s, U.S. exports are now just a fraction of China’s. From 2014 to 2024, U.S. exports of construction equipment (HS codes 8427, 8429, 8430, 8431) fell by 26 percent, while Chinese exports grew by 141 percent over the same period, making Chinese exports more than 2.5 times those of the United States. (See figure 48.)
**Figure 48: Construction equipment exports[125](#_edn125)**
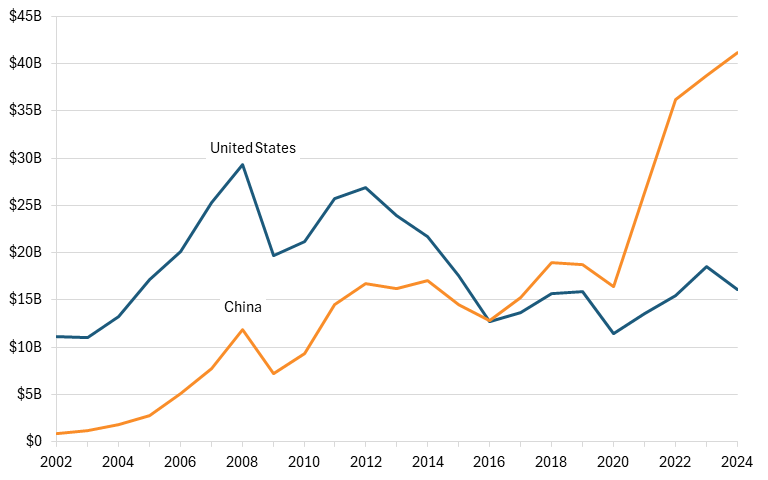
The impact of subsidies is particularly pronounced in Chinese exports to U.S. allied nations. Not only do Chinese subsidies on construction equipment make it difficult for European firms to compete with cheaper Chinese imports, but they also severely impact the competitiveness of American-made products. U.S. exports to Belgium, Germany, France, Italy, the Netherlands, and the United Kingdom, the largest European importers of American construction equipment, have declined steadily since the early 2000s, while Chinese exports have had an opposite experience. China now exports four times as much construction equipment by value to European allied nations as the United States does. (See figure 49.)
**Figure 49: Construction equipment exports to Belgium, Germany, France, Italy, Netherlands, and the United Kingdom[126](#_edn126)**
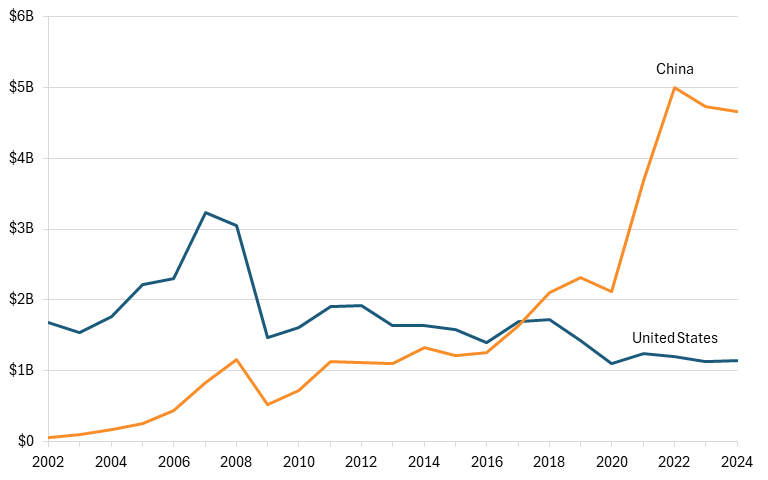
China’s push for dominance in the global construction equipment market poses a direct threat to U.S. firms, and experts believe this growth is unlikely to slow. Industry leaders in the Chinese construction equipment industry have postulated that the industry would grow up to 15 percent in 2025, with the largest growth expected in international markets.[127](#_edn127) At the same time, though U.S. firms benefited from strong domestic demand in 2025, firms must be wary of the decline in foreign sales to Chinese competitors.[128](#_edn128) Chinese firms will continue to expand into foreign markets with the government’s financial backing, enabling them to retain and gain market share at the expense of American and allied firms. In Illinois, which has already started to see a decline in its construction machinery workforce, the loss of global demand and reduced revenue due to Chinese competition could be detrimental to the state’s economy.
## Indiana: Iron and Steel Mills and Ferroalloy Manufacturing (NAICS 331110)
Indiana is a critical piece of the U.S. steel industry, accounting for a substantial share of domestic steel production and employment. However, the industry operates in a highly competitive global market, wherein China’s rapid expansion, supported by extensive state subsidies and comprehensive industrial policies, has contributed to global overcapacity, downward price pressure, and intensifying competition in export markets. China’s continued dominance will have a negative impact on the U.S. and Indiana steel and iron industries if left unchecked.
Iron and steel mills and ferroalloy manufacturing include the production of pig iron, steel, and ferroalloys used in construction, automotive manufacturing, energy infrastructure, and defense applications. Indiana plays a critical role in this industry, consistently being the largest steel-producing state in the country, accounting for roughly 25–30 percent of total U.S. raw steel production according to the U.S. Geological Survey, and about 22 percent of national employment in the industry.[129](#_edn129) Cleveland-Cliffs’ Indiana Harbor complex (one of the largest integrated steel mills in North America) and U.S. Steel’s Gary Works (one of the largest steel plants in the Western Hemisphere) are both critical to the Indiana iron and steel supply chain network.[130](#_edn130)
Despite the state’s strength, employment trends indicate a regression. Employment in Indiana’s iron and steel mills industry declined by 19 percent between 2017 and 2023, from about 21,000 to 17,000.[131](#_edn131) (See figure 50.)
**Figure 50: Employment in iron and steel mills and ferroalloy manufacturing in Indiana**
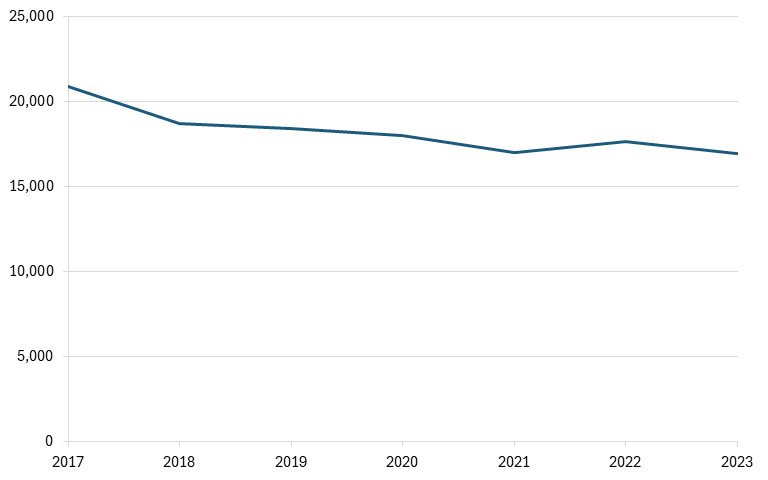
This employment decline mirrors broader structural challenges in the U.S. steel industry, including import competition and price volatility tied to global overcapacity, both due largely to China. In 2005, China designated the steel sector as a “pillar industry,” deeming it strategic and thus qualifying it for high levels of state support.[132](#_edn132) In the years since, China’s steel industry has received subsidized energy, preferential financing from state-owned banks, tax incentives, and direct subsidies. The OECD has documented that government support for Chinese steel firms significantly exceeds that of firms in market economies, contributing to persistent excess capacity and allowing them to rise to the top of the global steel production.[133](#_edn133) In 2024, China accounted for more than 50 percent of global crude steel production, compared with roughly 4 percent for the United States.[134](#_edn134) Such high levels of production and overcapacity have placed sustained downward pressure on global steel prices, reducing profitability for U.S. producers.[135](#_edn135)
Chinese firms such as China Baowu Steel Group (the world’s largest steel producer), HBIS Group, and Ansteel Group have expanded rapidly with government backing. China Baowu alone produces more steel annually than the entire U.S. industry does.[136](#_edn136) These firms are at least partially state owned and are able to maintain production even during periods of low profitability, contributing to global oversupply.
The growth of China’s industry has coincided with a relative stagnation in the United States’ share of global exports. From 2004 to 2024, the United States exported between 4 and 5 percent of global iron and steel (HS code 72), while Chinese exports surged, from about 5 percent of global exports in 2004 to 17 percent in 2024. In other words, U.S. exports as a share of global exports stayed relatively stagnant; China’s share of global exports increased threefold.[137](#_edn137)
**Figure 51: United States’ and China’s shares of global exports of iron and steel**
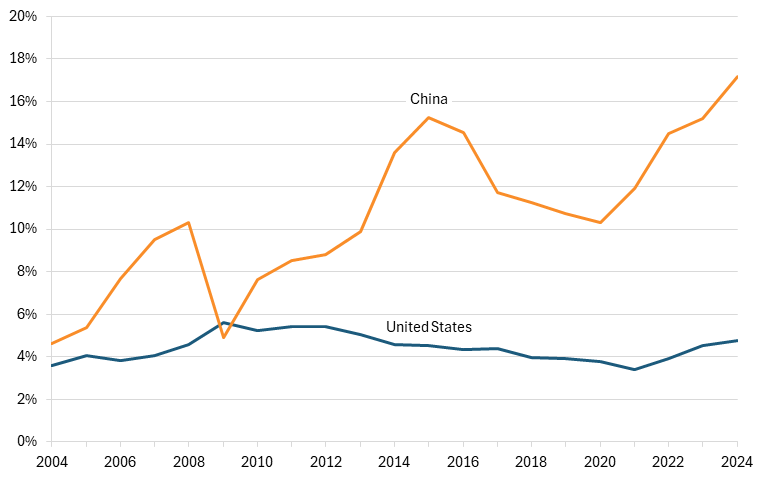
However, the United States retains a stronger position in exports relative to its closest trading partners, Canada and Mexico, supported by an integrated North American supply chain.[138](#_edn138) As shown in figure 52, U.S. exports to these countries have consistently exceeded China’s, though the share of exports from the United States has declined gradually over the past 20 years. In 2009, the United States accounted for nearly two-thirds of all exports of iron and steel to Canada and Mexico, but in 2024, that share fell to just 50 percent. Though China has measurably gained export share in this industry, the relative decline of U.S. exports is a cause for concern.[[139]](#_edn139)
**Figure 52: United States’ and China’s shares of iron and steel exports to Canada and Mexico**
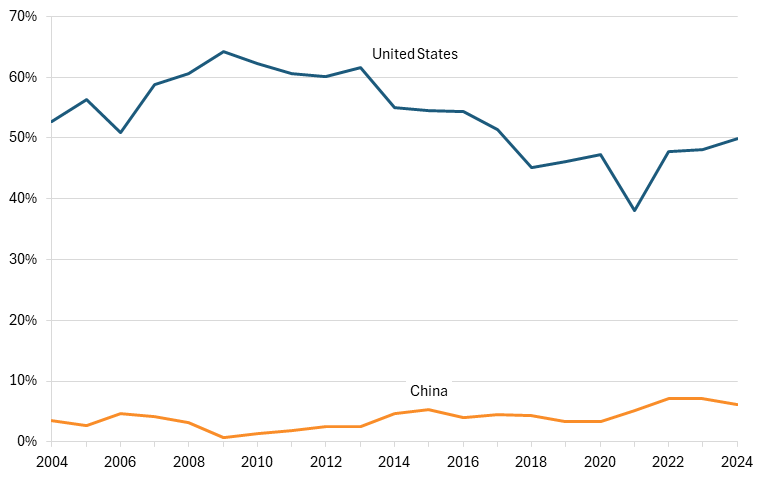
China’s industrial policies have contributed to a chronic global oversupply in steel, with the OECD estimating that excess global steel capacity will exceed 720 million metric tons by 2027, more than the combined steel production of the OECD countries in 2024.[140](#_edn140) This persistent oversupply suppresses prices, advantaging firms with high levels of state support, such as those in China, and making it difficult for those without said support, such as those in Indiana and the rest of the United States, to compete.
For Indiana, where steel production is a critical driver of the manufacturing economy, these global dynamics present clear risks. Though the state’s industry remains highly productive and a cornerstone of the U.S. steel industry, Chinese production and overcapacity threaten its long-term viability, risking future economic decline, job losses, and the security of one of the United States’ most critical supply chains.
## Iowa: Construction Equipment Manufacturing (NAICS 333111)
Iowa specializes in the construction machinery industry, which operates in a highly competitive global market. The state hosts several major equipment manufacturers and a dense network of suppliers that produce machinery for construction, earthmoving, and infrastructure development. However, the rapid rise of Chinese construction equipment manufacturers, aided by extensive subsidies and government-catalyzed demand, poses an increasing challenge to the long-term competitiveness of U.S. producers in Iowa.
Construction machinery manufacturing is a significant manufacturing industry in Iowa. According to data from the U.S. Census Bureau, the industry’s employment levels have fluctuated significantly over the past several years. In 2018, the industry employed nearly 10,000 workers; however, this number declined through 2021, reaching a low of about 6,500, and then climbed again to nearly 11,000 in 2023, the most of any state in the country.[141](#_edn141) (See figure 53.) Iowa’s equipment manufacturing ecosystem includes globally recognized firms such as Vermeer Corporation, which produces trenchers, directional drills, and other infrastructure equipment, and Deere & Company, one of the world’s largest construction companies, which has several production facilities across the state.[142](#_edn142)
**Figure 53: Employment in construction equipment manufacturing in Iowa**
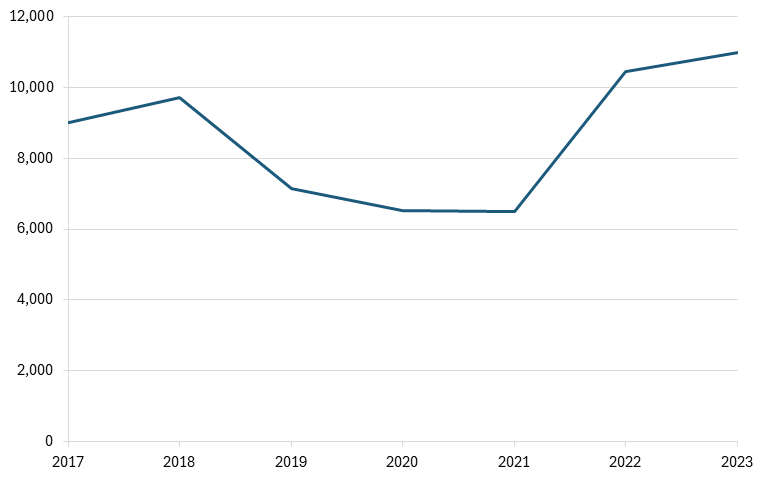
Despite the strength of these American firms in Iowa, global competition in construction machinery has intensified over the past two decades, largely due to the rise of Chinese manufacturers. In the early 2000s, U.S. companies dominated global exports of construction equipment. However, by the 2020s, Chinese firms had rapidly gained global market share. As of 2025, American firms controlled roughly 27 percent of the global market by revenue, while China had moved up to third place, holding 18 percent of market share.[143](#_edn143) (See figure 54.)
**Figure 54: Global market share in construction equipment by revenue, 2025[144](#_edn144)**

Accordingly, as China gained market share, its exports grew at the expense of the United States. U.S. exports of construction equipment (HS codes 8427, 8429, 8430, and 8431) fell by roughly 26 percent between 2014 and 2024, while Chinese exports grew by about 141 percent, leaving China exporting more than two and a half times the value of U.S. construction equipment exports.[145](#_edn145)
**Figure 55: Construction equipment exports**

China’s rapid rise in this industry has been fueled by extensive government support for domestic manufacturers. Major Chinese equipment producers such as XCMG Group, Zoomlion, and Sany Group have benefited from subsidies, preferential financing, and industrial policies aimed at strengthening China’s machinery sector. For example, XCMG, the largest Chinese construction equipment manufacturer, received $56 million in subsidies in 2022 and $94 million in 2023 from the Chinese government in programs designed to boost manufacturing capacity and exports.[[146]](#_edn146) Chinese policy initiatives have also increased domestic demand for construction equipment, helping national manufacturers scale production more rapidly and increase revenue more than foreign competitors have. In 2024, the Chinese government released the Action Plan for Promotion of Large-Scale Equipment Replacement and Trade-in of Consumer Goods, which calls for a 25 percent increase in capital investment in equipment across several industries by 2027.[147](#_edn147) The policy is expected to generate approximately $38.8 billion in additional industrial equipment purchases, supported by financial incentives, including value-added tax exemptions and special lending programs, totaling roughly $69 billion in support.[148](#_edn148)
These programs have enabled XCMG to become not only the largest manufacturer in China but also the world’s fastest-growing construction firm by global revenue. Its CAGR from 2015 to 2025 was 8 percent. Zoomlion, another Chinese firm, experienced a CAGR of about 3 percent. (See figure 56.) John Deere, in comparison, comes in second at about 7 percent.[[149]](#_edn149)
**Figure 56: CAGR of revenue, 2015–2025[150](#_edn150)**

As Chinese firms scale production and expand abroad, they have increasingly targeted third-party markets that have historically been important destinations for American machinery exports. Europe has been a key target, where China has gained market share by offering products at lower prices than many Western competitors have. Investigations by the European Commission have found evidence that subsidies and other state support mechanisms allow Chinese equipment manufacturers to sell machinery at artificially low prices, making it difficult for U.S. and European producers to compete in international markets.[151](#_edn151)
U.S. exports to Belgium, Germany, France, Italy, the Netherlands, and the United Kingdom, the largest European importers of American construction equipment, have declined steadily since the early 2000s, while Chinese exports have had the opposite experience. China now exports four times as much construction equipment by value to European allied nations as the United States does. (See figure 57.) At the same time, Chinese exports to the United States have also grown rapidly. Between 2014 and 2024, imports of Chinese construction machinery increased by 66 percent.[152](#_edn152)
For Iowa, where construction machinery manufacturing is a highly concentrated, export-oriented industry, these global trends pose a significant long-term risk. As Chinese firms expand capacity and aggressively enter foreign markets, American manufacturers may face declining global market share, lower export revenues, and increased price competition. Because Iowa’s machinery industry depends heavily on international demand, prolonged erosion of U.S. competitiveness could translate into slower industry growth, reduced investment, and potential job losses in the future.
**Figure 57: Construction equipment exports to Belgium, Germany, France, Italy, the Netherlands, and the United Kingdom[153](#_edn153)**

## Kansas: Farm Machinery and Equipment Manufacturing (NAICS 333111)
Kansas is specialized in and dependent on the farm machinery and equipment industry, which operates in a highly competitive global market dependent on exports. While the United States has historically been a global leader in agricultural equipment production, China’s rapid expansion, driven by state support, rising exports, and increasing global market share, poses a growing threat to the long-term competitiveness of American firms and the Kansas economy.
Farm machinery and equipment manufacturing is a cornerstone of Kansas’s industrial base, reflecting the state’s deep integration with large-scale commercial agriculture, which relies on equipment essential to modern farming. Major firms such as AGCO produce large industrial equipment, such as tractors, combines, and forage equipment, in Kansas, with AGCO operating two major facilities in Hesston and Beloit. AGCO, along with other major producers such as John Deere, has made Kansas one of the largest states for farm machinery manufacturing, directly employing over 5,000 people. In fact, employment in Kansas’s farm machinery sector has increased steadily over the past several years, rising 40 percent from 2017 to 2023.[154](#_edn154) (See figure 58.) These jobs are particularly important, as they support both above-average wages and a broad network of suppliers, logistics providers, and agricultural workers.[155](#_edn155) However, employment in the industry has declined in recent years, falling by 14 percent over the previous decade, even as overall employment has increased.[156](#_edn156)
**Figure 58: Employment in farm machinery manufacturing in Kansas**
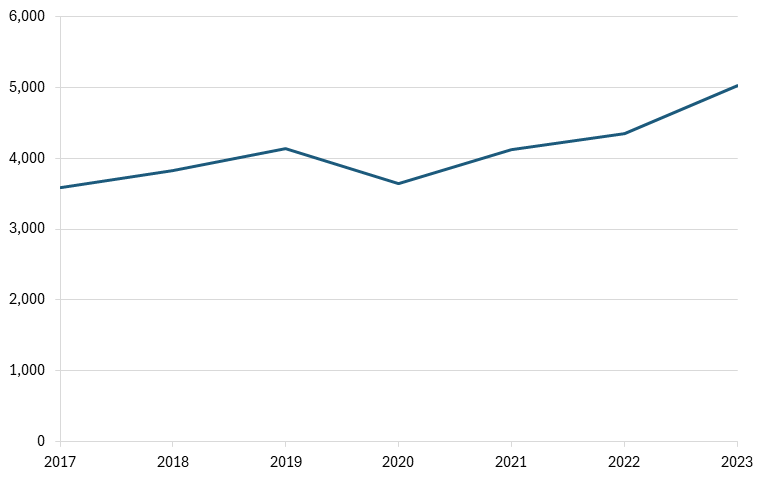
The industry’s importance to Kansas is reflected not only in employment but also in its economic output. Industrial machinery, which includes agricultural machinery and equipment, was the third-largest export from Kansas in 2023, behind aircraft parts and meat products, and was valued at over $1.3 billion.
Kansas’s success in the industry has helped the United States become one of the largest agricultural machinery manufacturers in the world. However, global competition has intensified. As shown in figure 59, U.S. exports of farm machinery and equipment (HS Codes 8432, 8433, 8434, 8435, 8436, 8437, 8701) once dwarfed those from China. In 2004, the United States exported 12 times more value in agricultural equipment than China did, and for the next several years, the United States maintained a significant lead over its competitor, even as Chinese exports increased gradually. However, by 2020, Chinese exports had begun to surge, overtaking those of the United States in 2023. As of 2024, China exported nearly $2 billion more in agricultural machinery than did the United States.[157](#_edn157)
**Figure 59: Agricultural equipment exports[158](#_edn158)**
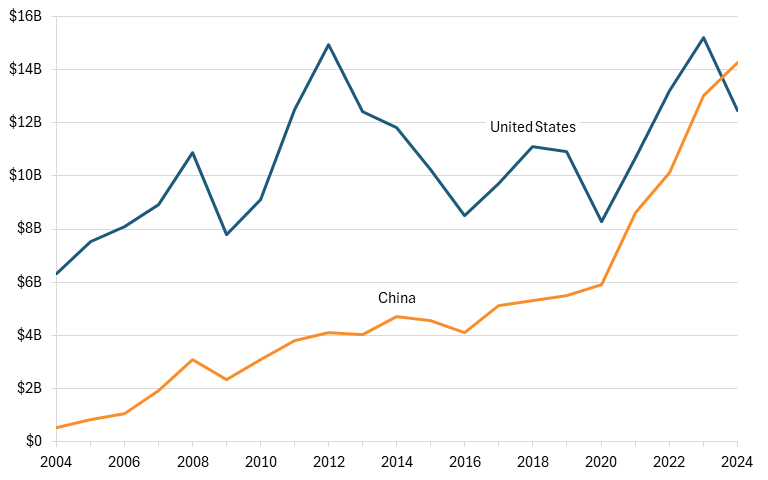
Not only has China overtaken the United States, but it also exports more agricultural machinery than almost every other nation does. Only Germany and Italy exceeded China in 2023.[[159]](#_edn159) (See figure 60.) According to Chinese customs data from 2025, agricultural exports increased by 32.2 percent between 2024 and 2025, surpassing Italy and making China the world’s second-largest exporter of agricultural machinery.[[160]](#_edn160)
**Figure 60: United States’ and China’s share of global exports of agricultural, horticultural, and forestry machinery by country, 2023[161](#_edn161)**
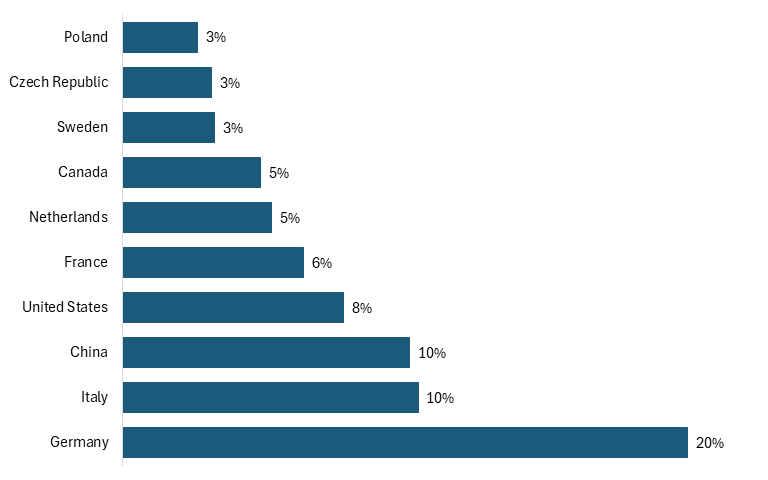
China’s rapid rise in this industry has been supported by a range of industrial policies aimed at increasing domestic production and global competitiveness. The federal government implemented the Agricultural Machinery Production Subsidies in 2020, which provide a fixed-rate subsidy of approximately 30 percent on agricultural machinery, effectively reducing the price of Chinese agricultural machinery and increasing demand.[162](#_edn162) The government also artificially catalyzed demand for agricultural machinery through its 2018 document “Guiding Opinions on Accelerating the Promotion of Agricultural Mechanization and Transformation and Upgrading of Agricultural Machinery Equipment Industry,” which called for an increase in the mechanization rate for crop cultivation from 67 percent in 2018 to 75 percent in 2025.[163](#_edn163) Both these initiatives, combined with export promotion through programs such as the Belt and Road Initiative, which encourage developing countries to purchase Chinese products in tandem with China-led infrastructure projects, have enabled Chinese firms to compete aggressively with the United States and allied countries.
This competition is evident not only in total exports but also in exports to key markets in developing countries. Chinese exports of farm machinery to key Southeast Asian markets, including Indonesia, the Philippines, and Vietnam, have grown dramatically over the past two decades, while U.S. exports to these countries have remained relatively flat, hovering around $65 million; Chinese exports have surged, exceeding $1 billion annually in recent years. (See figure 61.)
**Figure 61: Farm machinery exports to Indonesia, the Philippines, and Vietnam[164](#_edn164)**
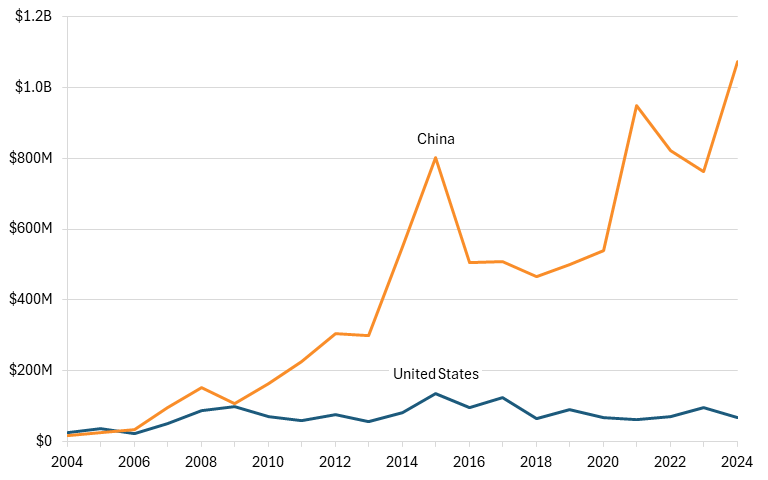
China’s continued expansion in agricultural machinery poses a direct threat to U.S. firms and the regional economies that depend on them. As Chinese producers gain market share in both domestic and international markets, U.S. manufacturers may face declining exports, tighter profit margins, and reduced investment. For Kansas, where farm machinery manufacturing supports thousands of jobs and plays a critical role in the state’s industrial economy, these trends could translate into slower growth and long-term economic vulnerability for the United States in the future.
## Kentucky: Major Household Appliance Manufacturing (NAICS 335220)
Kentucky is highly specialized in household appliance manufacturing, an advanced industry that plays a central role in the state’s economy and export base. However, rising Chinese dominance, fueled by large-scale industrial subsidies, rapid capacity expansion, and aggressive export strategies, poses a growing threat to the long-term competitiveness and independence of both Kentucky’s and America’s appliance sector
Major household appliance manufacturing includes the production of refrigerators, freezers, washing machines, dishwashers, dryers, and other large household appliances used in residential settings. These products are widely traded internationally and rely on complex manufacturing supply chains that include steel components, compressors, electronics, and software systems. The industry is highly capital intensive and historically dominated by firms in the United States, Europe, Japan, and South Korea.
Kentucky is one of the largest appliance manufacturers in the United States and hosts one of the world’s largest appliance manufacturing complexes. Appliance Park in Louisville is the global headquarters and largest manufacturing facility of GE Appliances, which employs approximately 8,000 workers in the state.[165](#_edn165) Additionally, Kentucky is home to other large appliance producers such as Whirlpool and Samsung. Altogether, the Kentucky economy is highly dependent on the household appliance industry, with employment in the industry growing by 66 percent from 2018 to 2023, from about 3,700 to about 6,200. In comparison, the overall Kentucky workforce grew just 4 percent over that same period.[166](#_edn166)
**Figure 62: Employment in major household appliance manufacturing in Kentucky**
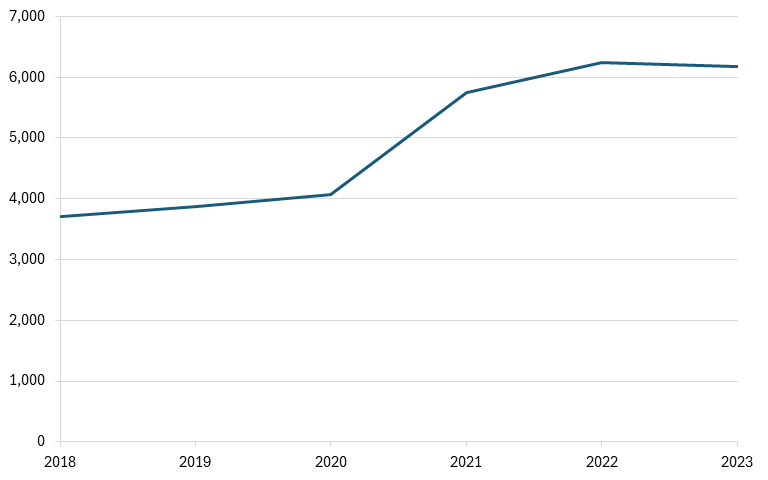
GE Appliances alone contributes billions to the state economy, with a 2024 impact analysis estimating that the company’s operations contributed $12.8 billion to Kentucky’s gross domestic product (GDP).[167](#_edn167) Its presence in the state is also projected to grow. In 2025, the company announced an additional $490 million investment in Appliance Park, which will create 800 new jobs and shift the production of several washing machine models from China back to Kentucky.[168](#_edn168)
Despite Kentucky’s strength, the global appliance market has shifted dramatically toward China over the past two decades. China is now the world’s largest producer and exporter of household appliances, accounting for over 40 percent of global production. (See figure 63). Chinese firms such as Haier, Midea, and Hisense have become dominant global players, competing directly with U.S.-based manufacturers. Haier has also expanded its operations through acquisitions, including an acquisition of GE Appliances in 2016, meaning one of the largest domestic appliance producers in the United States is now under China’s purview.
**Figure 63: United States’ and China’s market shares in household appliances[169](#_edn169)**
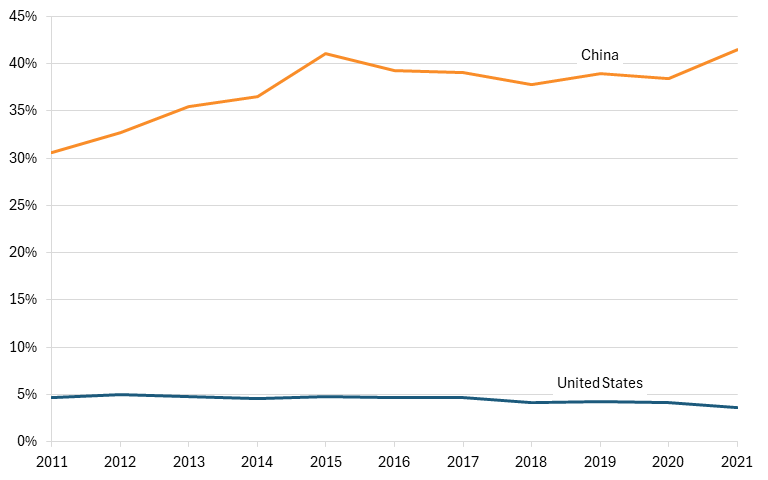
This shift is clearly visible in global trade data. In the early 2000s, the United States was a leading exporter of household appliances (HS codes 8418, 8422, 8450, 8508, 8516), and while it still exported $4 billion less in volume than China, it was relatively close considering the gap today. But from 2004 to 2024, China increased its exports of household appliances by an incredible 704 percent, while the United States increased exports by just 58 percent.[170](#_edn170) China now exports $62 billion more than the United States does in household appliances.
**Figure 64: United States’ and China’s exports of household appliances[171](#_edn171)**
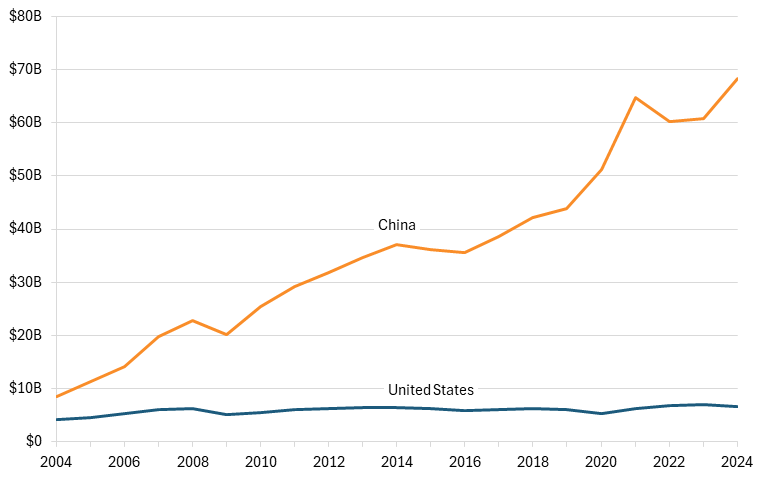
China’s export growth has been driven in large part by its expansion into third-country markets, particularly Canada and Mexico. America’s two largest trading partners have increasingly imported household appliances from China rather than the United States, allowing China to close the export gap in this critical market for U.S. exporters. Though the United States still exports more to these countries, Chinese exports increased by 865 percent between 2004 and 2024, compared with just 81 percent for U.S. exports, demonstrating China’s encroachment on key American trading partners and allies, while the United States continues to exhibit lackluster growth.[[172]](#_edn172)
**Figure 65: United States’ and China’s exports of household appliances to Canada and Mexico[[173]](#_edn173)**
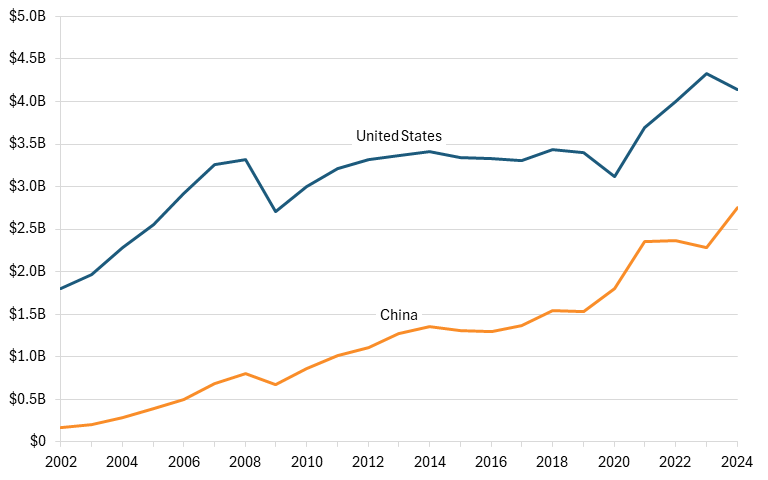
A major driver of China’s success in appliance manufacturing is extensive government support. For example, public filings show that Midea and Haier received more than $200 million annually in government subsidies between 2022 and 2024.[174](#_edn174) Additionally, the Chinese government has implemented demand-side policies designed to stimulate appliance consumption. Programs such as the “Home Appliances Going to the Countryside” initiative, launched in 2007, and appliance trade-in subsidies have boosted domestic demand, enabling firms to achieve economies of scale and lower per-unit costs.[175](#_edn175) More recently, China’s 2024 to 2027 equipment replacement initiative includes incentives for consumer goods purchases.[176](#_edn176) In its 2024 financial reports, Midea stated that both supply- and demand-side subsidy policies had led to increased sales volumes, higher consumer demand, and lower prices for certain products.[177](#_edn177)
China’s rapid expansion in the global appliance industry poses a growing challenge both to U.S. producers and to Kentucky’s position as a major manufacturing hub for household appliances. Chinese firms continue to benefit from a large manufacturing ecosystem, strong government support, and policies aimed at expanding both domestic demand and exports. These advantages have enabled Chinese manufacturers to rapidly increase global production capacity and capture market share in international markets. As Chinese producers continue to scale production and expand their presence around the world, global appliance prices could face downward pressure, making it more difficult for U.S. manufacturers to compete on cost. Such an effect could erode U.S. export opportunities and reduce the profitability of domestic production. Despite Kentucky’s expansion of its household appliance manufacturing workforce, continued aggressive competition from China could severely hurt the Kentucky economy, leading to job losses and a decline in economic growth.
## Louisiana: Alumina Refining and Primary Aluminum Production (NAICS 331313)
Louisiana is a critical hub for the U.S. aluminum value chain, particularly in alumina refining and primary aluminum production. However, the industry operates in an increasingly competitive global market wherein China’s rapid expansion—supported by extensive state subsidies and industrial policy—poses a significant threat to the long-term competitiveness of U.S. producers.
Alumina refining and primary aluminum production includes the processing of bauxite into alumina and the smelting of alumina into primary aluminum. These materials are essential inputs for aerospace, automotive, construction, and defense applications, making this industry an essential input to the national power industry supply chain. Louisiana plays an outsized role in this industry due to its access to the Mississippi River system, deepwater ports, and energy infrastructure, making it a strategic location for refining and processing. Overall, it employs 78 percent of the nation’s workforce in this sector.[178](#_edn178)
Louisiana is home to the last operating alumina refinery in the United States, operated by Atalco in Gramercy.[179](#_edn179) However, despite the necessity of maintaining domestic alumina refining and processing capabilities in the United States, employment in this industry has declined over the past several years. As shown in figure 66, employment fell from nearly 1,000 workers in 2019 to a low of about 600 in 2022, before rebounding slightly in 2023.[180](#_edn180)
**Figure 66: Employment in aluminum refining and processing in Louisiana**
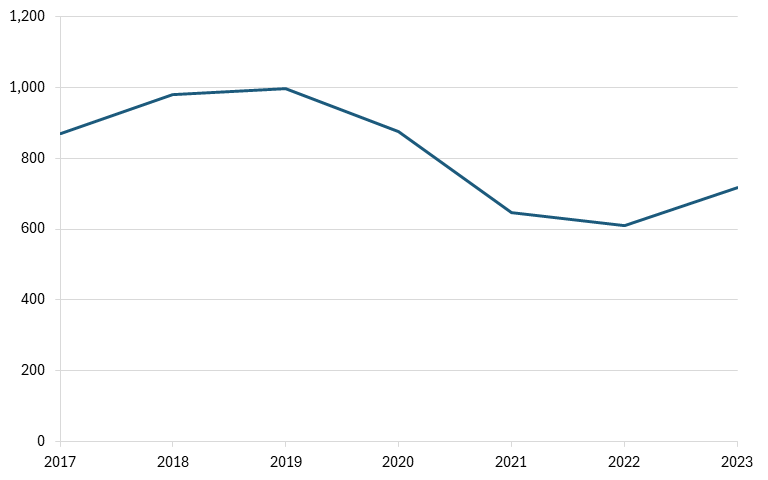
Considering the state’s prominence in the U.S. alumina refining and aluminum production industry, Louisiana’s employment decline has coincided with an overall weakening of the U.S. aluminum industry. And this weakening has also coincided with the rise of China. According to the U.S. Geological Survey, China now accounts for more than half of global primary aluminum production, compared with less than 10 percent for the United States.[181](#_edn181)
China’s dominance is driven in large part by state support. Aluminum was identified as a strategic industry in Made in China 2025, enabling Chinese firms to benefit from subsidized electricity, preferential loans from state-owned banks, tax incentives, and direct financial subsidies. A report by the OECD finds that Chinese aluminum producers receive significantly higher government support than do firms in market economies, contributing to persistent global overcapacity.[182](#_edn182) Estimates suggest that Chinese aluminum producers, such as Aluminum Corporation of China and Hongqiao Group, receive tens of billions of dollars in implicit subsidies, particularly through below-market electricity pricing, which can account for up to 40 percent of production costs.[183](#_edn183) This support allows Chinese firms to maintain production even when global prices fall below market-based cost levels, contributing to downward pressure on global aluminum prices.[184](#_edn184)
These policies have led Chinese exports to surge relative to the United States’ over the past 20 years or so. From 2004 to 2024, U.S. exports of primary aluminum products (HS codes 2818, 7601, 7603, 7604, 7605, 7606, 7607) increased from $4.2 billion to $7.2 billion.[185](#_edn185) Comparatively, Chinese exports, which stood at about $4.1 billion in 2004, boomed, increasing to $23 billion. (See figure 67.)
**Figure 67: United States’ and China’s exports of the aluminum refining and production industry**
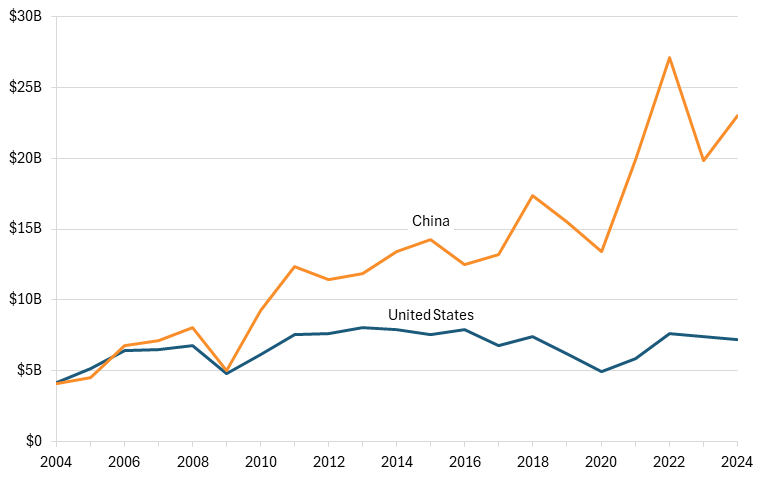
Despite the growth of China, the United States has maintained relatively strong export relations with its closest trading partners. Canada and Mexico remain the largest destinations for U.S. aluminum exports.[186](#_edn186) As shown in figure 68, U.S. exports to these countries have remained consistently higher than Chinese exports, though China has begun to increase its presence in these markets in recent years.[187](#_edn187)
**Figure 68: United States’ and China’s exports of the aluminum refining and production industry to Canada and Mexico**
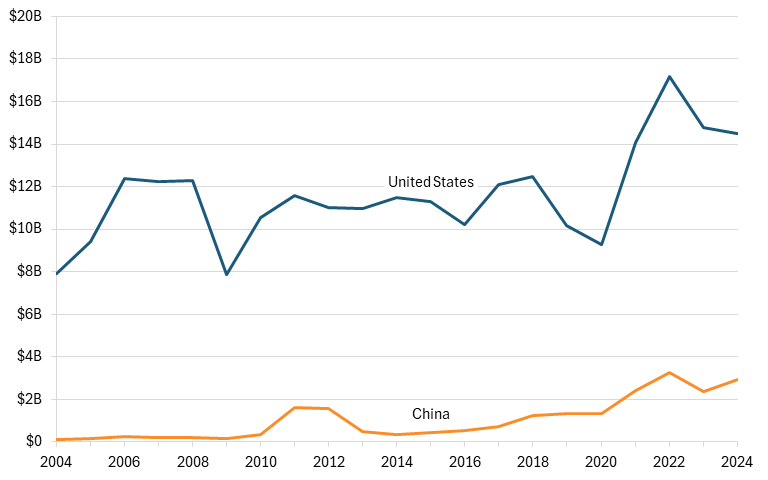
Overall, China maintains a strong grip on the global aluminum industry, and by extension, the greater basic metals industry. In 2022, the most recent year of available data, China held 42 percent of the global market share in basic metals, over four times that of the United States, which held about 10 percent.[[188]](#_edn188) That decade alone, China’s market share had climbed 10 percentage points, from 32 percent in 2013. (See figure 69.)
**Figure 69: Global market share in basic metals**
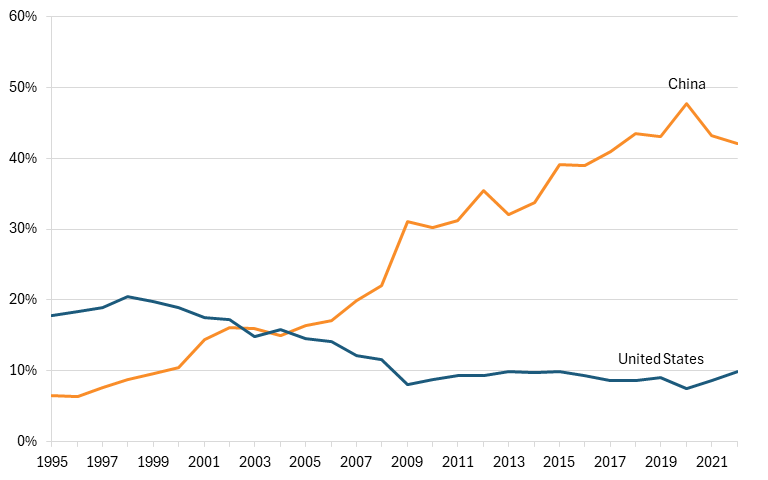
For Louisiana, these global dynamics translate into tangible economic risks. Though it’s impossible to say if the growth of China’s aluminum industry has directly caused the weakening of Louisiana’s, it’s evident that, as China’s industry grows, the state’s alumina refining industry is increasingly exposed to international competition against state-backed enterprises. As Chinese overcapacity continues to suppress global aluminum prices and take over export markets, Louisiana-based firms face tighter margins and potential employment declines. Should China’s explosion in the aluminum market continue unimpeded and expand into key U.S. markets such as Canada and Mexico, the viability of domestic aluminum refining and production may be called into question.
## Maine: Analytical Laboratory Instrument Manufacturing (334516)
Analytical laboratory instrument manufacturing is a small but growing advanced-manufacturing industry in Maine. While China has expanded rapidly in the global analytical instrumentation market—supported by industrial policy and state backing—the available evidence suggests that U.S. firms continue to dominate the industry, and Chinese competition, while rising, represents a longer-term challenge rather than an immediate threat to Maine producers.
This industry produces high-precision instruments used in laboratory analysis, including chromatography systems, spectrometers, and diagnostic equipment. These tools are critical for applications in pharmaceuticals, environmental monitoring, food safety, and biotechnology. Maine has developed a niche presence in this industry, driven by specialized firms and growing employment. Employment in Maine’s analytical laboratory instrument manufacturing sector increased from about 800 workers in 2013 to over 1,100 in 2023.[189](#_edn189) (See figure 70.) Maine is home to several notable firms in this space. Most prominently, IDEXX Laboratories, headquartered in Westbrook, is a global leader in veterinary diagnostics and water testing instrumentation.[190](#_edn190) The company produces advanced diagnostic analyzers and laboratory systems used worldwide. Other firms, including Ocean Insight (formerly Ocean Optics), contribute to Maine’s specialization in spectroscopy and optical measurement technologies.[191](#_edn191)
**Figure 70: Employment in analytical laboratory instrument manufacturing in Maine**
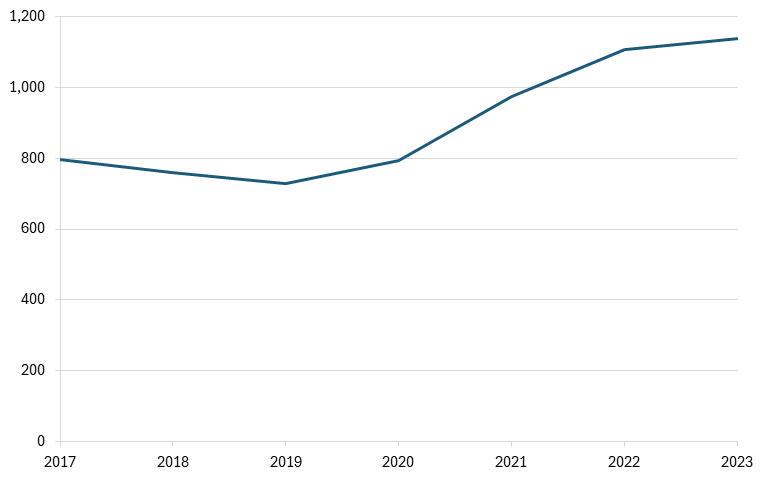
China has identified scientific instruments and medical devices as priority industries under its Made in China 2025 strategy, mobilizing national and provincial resources to build domestic capabilities. Chinese firms have benefited from subsidies, tax incentives, government procurement preferences, and state-backed financing.[[192]](#_edn192) According to analyses by organizations such as the U.S.-China Economic and Security Review Commission and MERICS, these policies have supported rapid growth in China’s scientific instrument industry. The former has found that, under the policies laid out in Made in China 2025, China has cultivated at least 6 internationally recognized medical equipment firms, meeting its goal of developing between 5 and 10 of these companies by 2025.[[193]](#_edn193) Though not all these companies directly compete in the specific subset of analytical laboratory equipment manufacturing, some do, such as the firm Mindray.
Additionally, MERICS has found that Chinese medical technology firms received measurable financial support from the government between 2017 and 2022, including subsidies, tax incentives, and below-market financing. Overall, government support grew from $725 million in 2017 to between $2.9 billion and $3.9 billion in 2022.[[194]](#_edn194) This support was equivalent to at least 25 percent of companies’ net profit over this period.
With these levels of substantial support and clearly defined goals for the industry, Chinese firms have been able to substantially increase exports of analytical lab instruments (HS codes 9012, 9025, 9027, 9030, and 9031). From 2004 to 2024, China’s share of global exports increased from roughly 2 percent to about 9 percent. In contrast, the United States’ export share decreased from just over 25 percent to 16 percent, a 36 percent decline. Nevertheless, the United States still holds an absolute advantage over China, exporting about $11 billion more in value.[195](#_edn195) (See figure 71.)
**Figure 71: United States’ and China’s shares of global exports of analytical laboratory equipment**
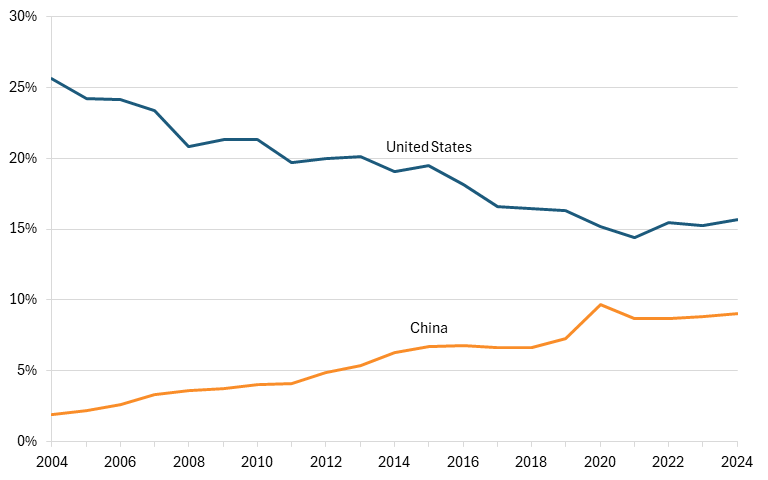
This trend is also evident in key allied markets. The United States continues to export more analytical instruments to its largest export markets, such as Canada, Germany, and Japan, for these goods, but Chinese exports to these countries have increased steadily, reducing its gap to the United States from about 42 percentage points to about 16 percentage points, indicating China’s growing competitiveness abroad.[[196]](#_edn196) (See figure 72.)
**Figure 72: United States’ and China’s shares of analytical laboratory equipment exports to Canada, Germany, and Japan**
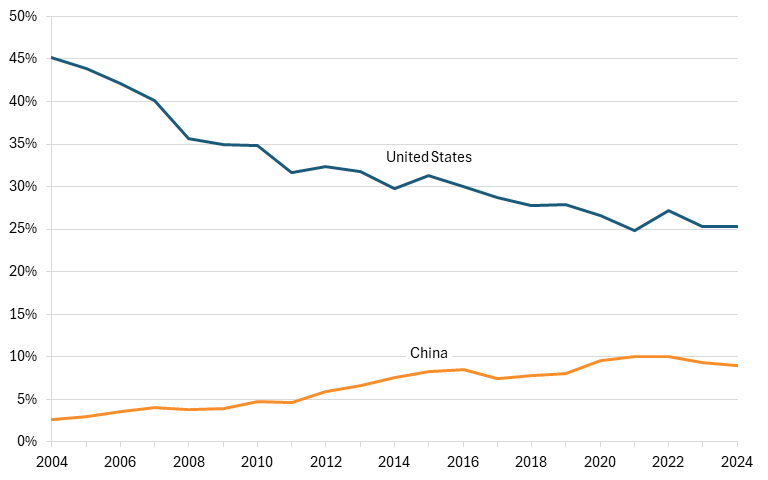
The United States currently retains a leading position in analytical laboratory instruments by trade value, with exports continually increasing, while leading states, such as Maine, continue to grow their workforces. China, however, has made significant gains in the industry, expanding its export presence with sustained state support and making inroads into the global medical device market through several world-recognized firms. Should Chinese firms continue to receive substantial state support, and should the Chinese government continue to prioritize the growth of its medical device sector, China could become a more formidable competitor in the future, potentially taking global market share from U.S. firms and risking the decline of revenue, growth, and jobs in the future.
## Maryland: Biological Product (except Diagnostic) Manufacturing (NAICS: 325414)
A core industry in Maryland is biological product (except diagnostic) manufacturing (NAICS: 325414). Biological product (except diagnostic) manufacturing is defined as “establishments primarily engaged in manufacturing vaccines, toxoids, blood fractions, and culture media of plant or animal origin (except diagnostic).”[197](#_edn197) Biological product (except diagnostic) manufacturing companies in Maryland include IDT Biologika Corporation and Intralytix, Inc.[198](#_edn198) The primary products produced by these companies include malaria diagnostic test kits (SITC: 54163), human blood plasma (SITC: 54163), cell therapy products (SITC: 54164), and others.[199](#_edn199)
Over the past 10 years (available data), the biological product (except diagnostic) manufacturing industry in Maryland has expanded. Indeed, from 2014 to 2023, Maryland’s industry’s employees rose 47.5 percent from 1,738 to 2,563 employees while the overall U.S. manufacturing sector only rose 8 percent.[200](#_edn200) As such, this indicates that Maryland’s industry has grown faster than the overall manufacturing sector and has expanded to be a greater share of the sector. When examined closer, Maryland’s industry did experience a slight decline from 2015 to 2016, but has generally trended upward.[201](#_edn201)
**Figure 73: Employment in biological product (except diagnostic) manufacturing in Maryland**
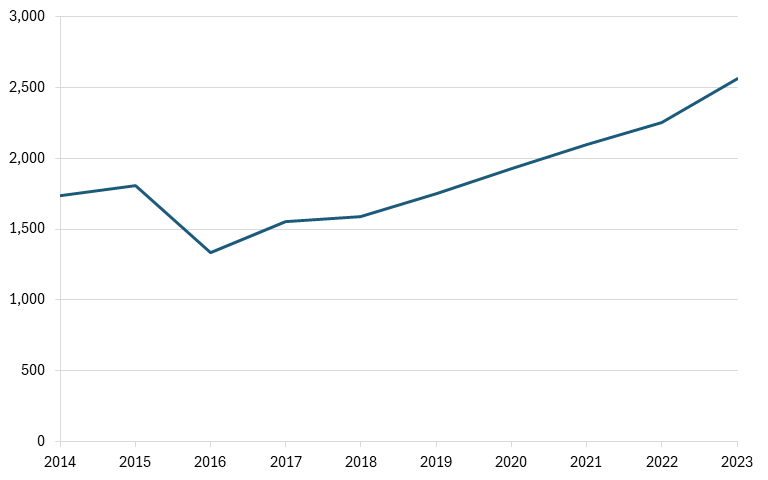
Corresponding with the time period above, from 2014 to 2023, China’s exports to the world remained stable while Maryland’s biological product (except diagnostic) manufacturing industry grew. Indeed, while Maryland’s industry employees expanded, China’s exports as a share of the global exports remained at 0.3 percent.[202](#_edn202) This indicates that Chinese competition is unlikely to have influenced Maryland’s industry trends, as Chinese exports did not change despite Maryland’s industry growth. Although Chinese exports did experience a large spike from 0.9 percent to 12.1 percent from 2020 to 2021, Maryland’s industry continued to grow and did not seem to be affected by the large growth—this growth was likely due to the COVID-19 pandemic.[203](#_edn203) More generally, Chinese competition does not seem to affect the U.S. biological products manufacturing industry. Indeed, while U.S. exports have gone through periods of growth and decline, Chinese exports have remained stable.[204](#_edn204)
**Figure 74: United States’ and China’s shares of global exports of biological (except diagnostic) product manufacturing**
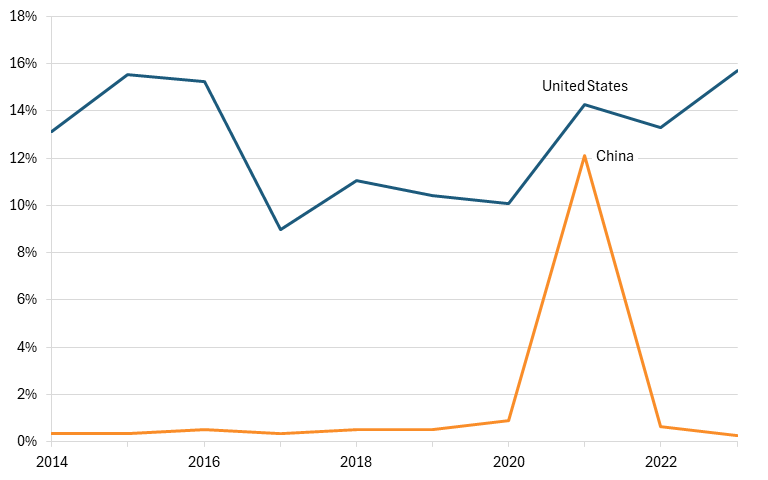
## Massachusetts: Irradiation Apparatus Manufacturing (NAICS 334517)
A core industry in Massachusetts is irradiation apparatus manufacturing. The irradiation apparatus manufacturing industry is defined as “establishments primarily engaged in manufacturing irradiation apparatus and tubes for applications, such as medical diagnostic, medical therapeutic, industrial, research and scientific evaluation. Irradiation can take the form of beta-rays, gamma-rays, X-rays, or other ionizing radiation.”[205](#_edn205) The irradiation apparatus manufacturing companies in Massachusetts include Image Diagnostics, Inc., Pyramid Technical Consultants, Inc., and Wasik Associates Inc.[206](#_edn206) The primary products produced by these companies include scintigraph apparatus for use in medical, surgical, dental, or veterinary sciences (SITC: 77412), computed tomography apparatus (SITC: 77421), x-ray tubes (SITC: 77423), and others.[207](#_edn207)
Over the past 10 years (available data), the irradiation apparatus manufacturing industry in Massachusetts has expanded. Indeed, from 2014 to 2023, Massachusetts’ industry’s employees grew 27 percent from 1,801 to 2,288 employees, while overall U.S. manufacturing worker employment only grew by 8 percent.[208](#_edn208) As such, Massachusetts’ industry has expanded faster than the manufacturing sector has and now accounts for a larger share of it. However, on closer examination, the vast majority of Massachusetts’ industry’s growth came from 2022 to 2023, when the number of employees rose 128 percent from 1,002 to 2,288 employees.[209](#_edn209) When these outlier years are removed, Massachusetts’ industry is contracting, with employees declining 44 percent, while the overall U.S. manufacturing sector has grown 6.7 percent.[210](#_edn210) In sum, Massachusetts’ industry may have grown overall, but that growth is due to a single year. This surge could have been due to the increase in employment in Massachusetts’ biopharma industry, which saw employment rise 6.9 percent in 2022.[211](#_edn211)
**Figure 75: Employment in irradiation apparatus manufacturing in Massachusetts**
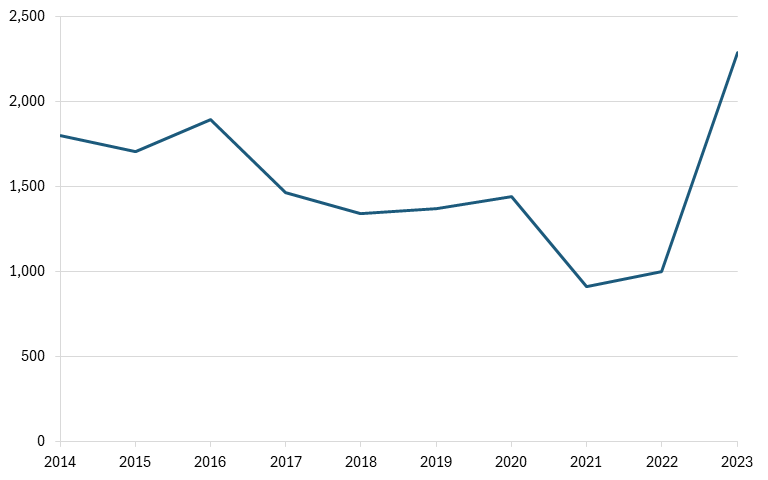
Corresponding with the time period above, from 2014 to 2023, China’s exports to the world grew while Massachusetts’ irradiation apparatus manufacturing industry also grew. Indeed, while Massachusetts’ industry’s employees expanded, China’s exports as a share of the global exports rose from 7.2 percent to 9.5 percent, indicating that China is unlikely to have played a role in Massachusetts’ industry trends, since both were growing concurrently.[212](#_edn212) However, when Massachusetts’ industry outlier years (2022–2023) are removed, China may indeed have had some impact on Massachusetts’ industry trends. Indeed, when those two years are removed, Chinese export shares rose from 7.2 percent to 10.2 percent while Massachusetts’ industry employees declined 44 percent from 1,801 to 1,002 employees.[213](#_edn213) And when Massachusetts’ industry employees rose significantly from 1,002 to 2,288 during those outlier years, Chinese exports declined from 10.2 percent to 9.5 percent.[214](#_edn214) As such, this indicates that Chinese competition may indeed play a role in Massachusetts’ irradiation apparatus manufacturing industry trends.
**Figure 76: United States’ and China’s shares of global exports of the irradiation apparatus manufacturing industry**
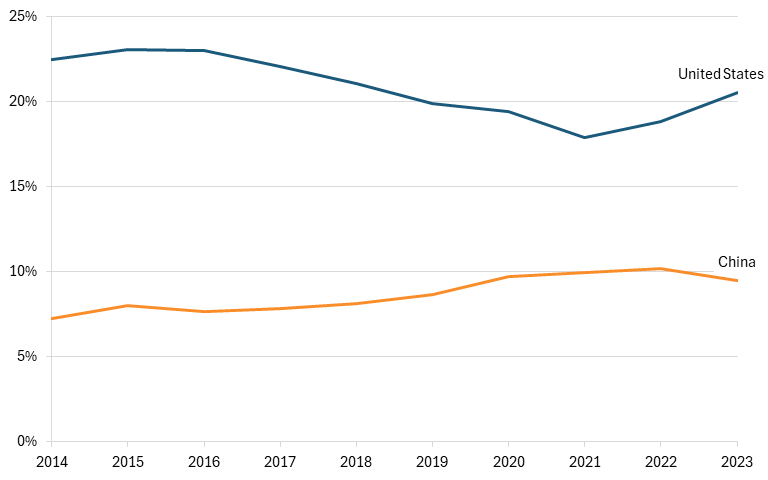
Although the Chinese government does not provide subsidies that are specifically for the irradiation apparatus manufacturing industry, the Chinese industry likely does not compete fairly with global competitors. This is because the Chinese government provides subsidies to its medical technology industry, which could subsequently benefit the irradiation apparatus manufacturing industry, as it is used in the medical technology field. Indeed, a paper by the European Center for International Political Economy finds that the Chinese medical technology industry benefits from direct financial support, tax benefits, R&D support, and local content requirements from the Chinese government.[215](#_edn215) As a result, the Chinese medical technology industry has taken away market shares from other global competitors that do not benefit from government support.[216](#_edn216) Corroborating this, a study by MERICS finds that the Chinese government increased its support to 122 medical technology firms by 5 times between 2017 and 2022, from roughly $734 billion to $4 billion.[217](#_edn217) It also finds that China provided significantly more state support to this sector than did any other advanced economies.[218](#_edn218) As a result, China’s medical technology and irradiation apparatus products likely do not compete fairly with their global competitors.
## Michigan: Light Truck and Utility Vehicle Manufacturing (NAICS: 336112)
A core industry in Michigan is the light truck and utility vehicle manufacturing industry (NAICS: 336112). This industry is defined as “establishments primarily engaged in (1) manufacturing complete light trucks and utility vehicles (i.e., body and chassis) or (2) manufacturing light truck and utility vehicle chassis only. Vehicles made include light duty vans, pick-up trucks, minivans, and sport utility vehicles.”[219](#_edn219) The light truck and utility vehicle manufacturing companies in Michigan include General Motors, Ford Motor Company, and AutoAlliance International. The primary products produced by these companies include motor vehicles for the transport of goods, not elsewhere specified or included (nesoi), with diesel engines, having a gross vehicle weight (GVW) not exceeding 5 metric tons (SITC: 78120), vehicles for the transport of goods, spark-ignition internal combustion piston engine, GVW not exceeding 2.5 metric tons (SITC: 78219), and others.[220](#_edn220)
Over the past 10 years (available data), the light truck and utility vehicle manufacturing industry in Michigan has expanded. Indeed, from 2014 to 2023, Michigan’s industry’s employees grew 101 percent from 17,285 to 34,771 employees while U.S. manufacturing sector’s employees only grew 8 percent.[221](#_edn221) As such, Michigan’s industry grew 10 times faster than did the overall manufacturing sector and, as such, has quickly expanded its share of the sector.[222](#_edn222) When examined closer, Michigan’s industry has followed a relatively stable year-over-year growth rather than experiencing periods of large declines or growth.[223](#_edn223)
**Figure 77: Employment in the light truck and utility vehicle industry in Michigan**
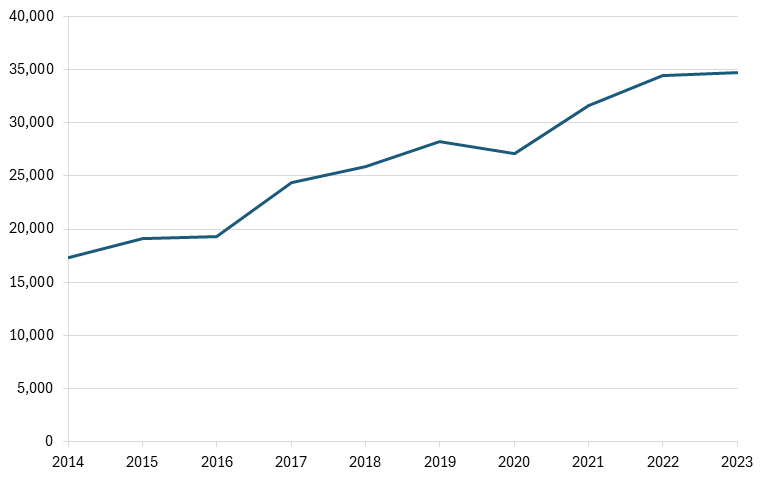
Corresponding with the time period above, from 2014 to 2023, China’s exports to the world grew while Michigan’s industry was also expanding. China’s exports as a share of the global exports grew significantly from 1 percent to 7.7 percent, indicating that Chinese competition is unlikely to have influenced Michigan’s industry trends, as both were growing concurrently.[224](#_edn224) Even when Chinese export shares grew quickly from 2021 to 2023 (from 3.4 percent to 7.7 percent), Michigan’s industry continued to grow steadily, further indicating that Chinese competition may not have influenced Michigan’s industry.[225](#_edn225) However, in general, Chinese competition could have an impact on the overall U.S. industry. Indeed, while the share of Chinese exports rose, U.S. export share fell from 9 percent to 7.4 percent.[226](#_edn226)
**Figure 78: United States’ and China’s shares of global exports of the light truck and utility vehicle industry**
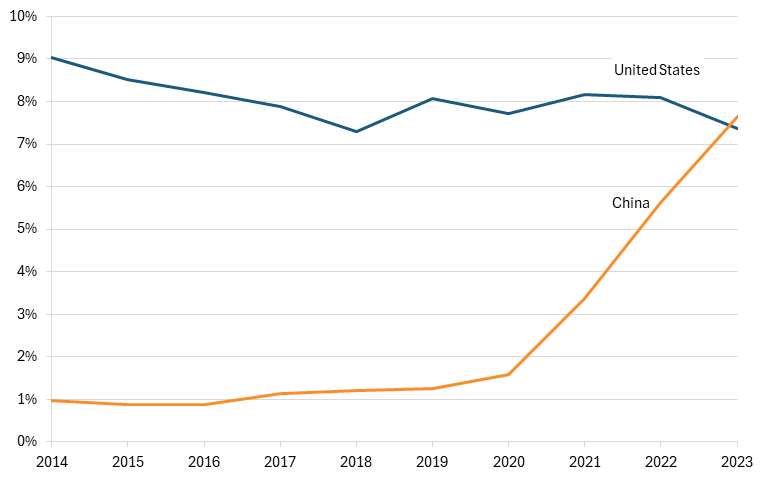
Chinese auto firms do not compete fairly with their global competitors. Indeed, the Chinese government has historically provided subsidies to bolster both its auto parts industry. For instance, from 2001 to 2012, the Chinese government provided the auto parts industry with about $27.5 billion in subsidies and intended to provide an additional $10.9 billion in subsidies from 2012 to 2022 in order to advance the technological development of the industry.[227](#_edn227) As a result, China’s auto parts industry could gain market share from its foreign competitors, such as U.S. firms, due to the extra support from the government.
## Minnesota: Scale and Balance Manufacturing (NAICS 333997)
A core industry in Minnesota is the scale and balance manufacturing industry, which is defined as “establishments primarily engaged in manufacturing scales and balances, including those used in laboratories.”[228](#_edn228) The scale and balance manufacturing companies in Minnesota include Thermo Ramsey LLC and Avery Weigh-Tronix LLC.[229](#_edn229) Among the primary products produced by these companies are digital electronic type personal weighing machines, including baby and household scales (SITC: 74532), scales for continuous weighing of goods on conveyors (SITC: 74531), parts of weighing machinery except digital weight indicators (SITC: 74539), and others.[230](#_edn230)
Over the past six years (available data), the scale and balance manufacturing industry in Minnesota has expanded. Indeed, from 2018 to 2023, Minnesota’s industry’s employees grew 9.3 percent from 407 to 445 employees, while the U.S. manufacturing sector only grew 3.5 percent.[231](#_edn231) As such, Minnesota’s industry grew more than twice as fast as the overall manufacturing sector.[232](#_edn232) When examined closer, Minnesota’s industry followed a relatively stable year-over-year growth rather than fluctuating between large growth and decline periods.[233](#_edn233)
**Figure 79: Employment in scale and balance manufacturing in Minnesota**
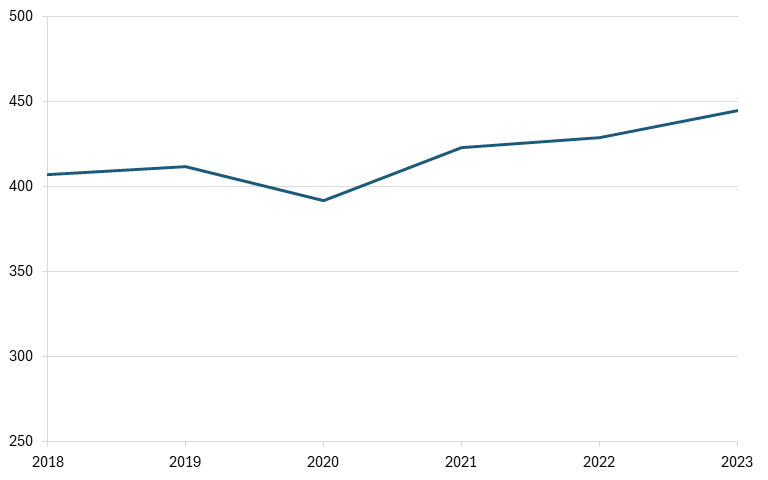
Corresponding with the time period above, from 2018 to 2023, China’s exports to the world grew while Minnesota’s scale and balance manufacturing industry was also expanding. Indeed, while Minnesota’s industry’s employees expanded, China’s exports as a share of the global exports grew from 29.8 percent to 35.8 percent, indicating that Chinese competition is unlikely to have influenced Minnesota’s industry trends, as both are growing concurrently.[234](#_edn234) However, in general, Chinese competition could have some impact on the overall U.S. scale and balance industry, as Chinese export share growth is correlated with U.S. export share decline. For instance, from 2018 to 2020, the Chinese export share rose from 29.8 percent to 39.1 percent while the U.S. export share declined from 8 percent to 6 percent.[235](#_edn235) Yet, from 2021 to 2023, when China’s export share declined from 40 percent to 35.8 percent, the U.S. share rose from 5.7 percent to 7.1 percent.[236](#_edn236) In sum, Chinese competition may not have influenced Minnesota’s industry trends, but may have affected U.S. industry overall.
**Figure 80: United States’ and China’s shares of global exports of the scale and balance manufacturing industry**
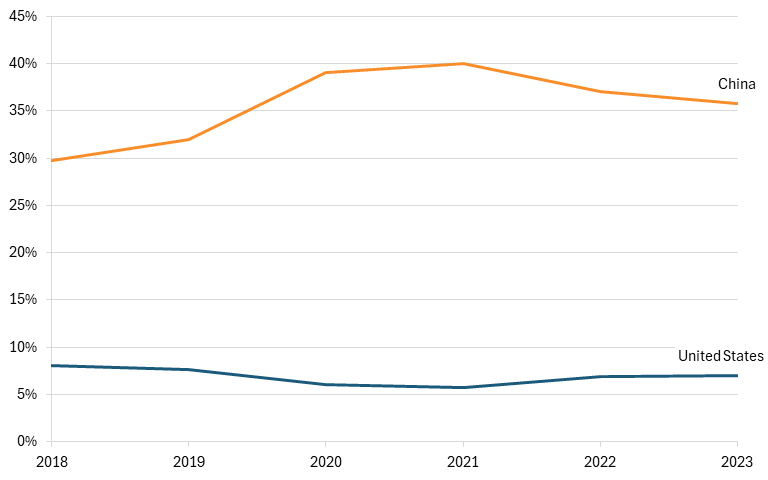
## Mississippi: Power, Distribution, and Specialty Transformer Manufacturing (NAICS 335311)
A core industry in Mississippi is power, distribution, and specialty transformer manufacturing. The industry is defined as “establishments primarily engaged in manufacturing power, distribution, and specialty transformers (except electronic components). Industrial-type and consumer-type transformers in this industry vary (e.g., step up or step down) voltage but do not convert alternating to direct or direct to alternating current.”[237](#_edn237) The power, distribution, and specialty transformer manufacturing companies in Mississippi include National Distribution Systems, Inc. and Southern Power and Coating Solutions.[238](#_edn238) The primary products produced by these companies include ballasts for discharge lamps or tubes (SITC: 77123), liquid dielectric transformers having a power handling capacity not exceeding 50 kilovolt-ampere (SITC: 77111), transformer parts (SITC: 77129), and others.[239](#_edn239)
Over the past six years (available data), the power, distribution, and specialty transformer manufacturing industry in Mississippi has expanded. Indeed, from 2018 to 2023, Mississippi’s industry’s employees grew 32 percent from 3,595 to 4,760 employees while U.S. manufacturing sector’s employees grew only 3.5 percent.[240](#_edn240) In other words, Mississippi’s industry grew faster than the overall manufacturing sector and, as such, expanded its share of the manufacturing sector. When examined closer, Mississippi’s industry’s growth comes primarily from a sudden growth from 2018 to 2019 and 2022 to 2023.[241](#_edn241) During the intervening years, Mississippi’s industry went through a period of contraction.[242](#_edn242)
**Figure 81: Employment in power, distribution, and specialty transformer manufacturing in Mississippi**
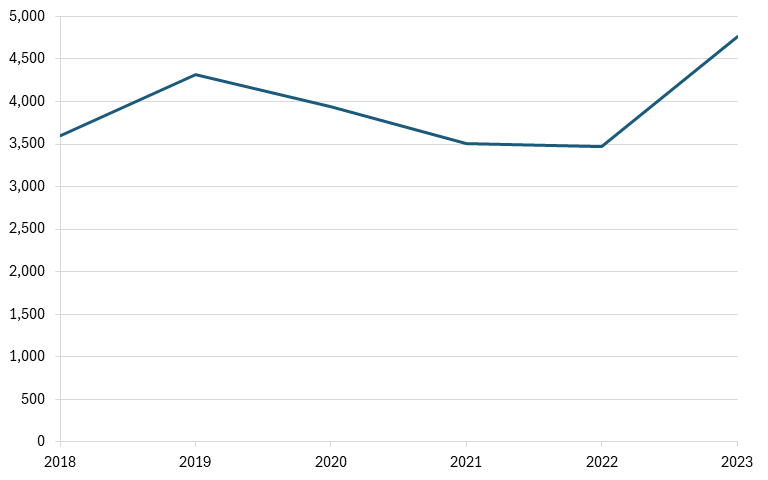
Corresponding with the time period above, from 2018 to 2023, China’s exports to the world grew while Mississippi’s power, distribution, and specialty transformer manufacturing was also expanding. Indeed, while Mississippi’s employees expanded, China’s exports as a share of the global exports grew from 19.5 percent to 24.5 percent, showing that Chinese competition may not have any influence on Mississippi’s industry trends.[243](#_edn243) However, on closer inspection, Chinese competition could have some influence on Mississippi’s industry if the two outlier growth years are removed. Indeed, when examining Mississippi’s industry’s declining years (2019–2022), Chinese exports grew from 22.4 percent to a high of 26.1 percent, indicating that Chinese competition could have influenced Mississippi’s industry decline.[244](#_edn244) In sum, Chinese competition may have some influence over Mississippi’s industry trends, but longer time series data is needed. In general, Chinese competition may have had only minimal impact on the overall U.S. industry as its exports rose while U.S. exports remained around 4.5 percent.[245](#_edn245)
**Figure 82: United States’ and China’s shares of global exports of the power, distribution, and specialty transformer manufacturing industry exports**
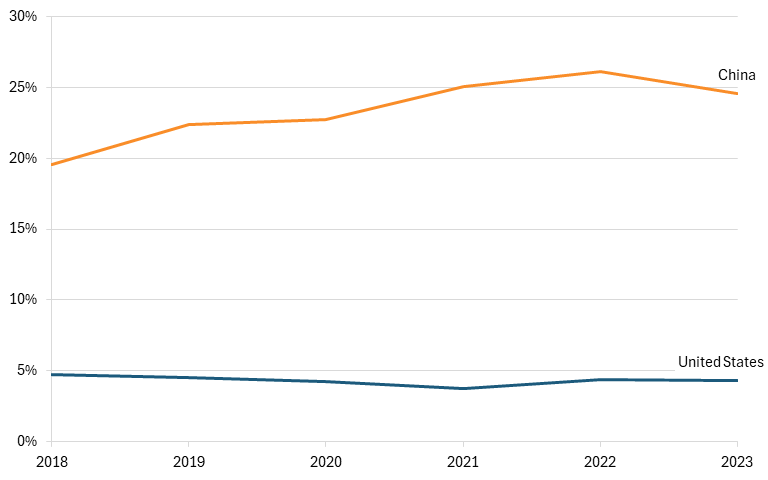
## Missouri: Noncurrent Carrying Wiring Device Manufacturing Industry (NAICS 335932)
A core industry in Missouri is the noncurrent carrying wiring device manufacturing industry, which “comprises establishments primarily engaged in manufacturing noncurrent-carrying wiring devices.”[246](#_edn246) The noncurrent carrying wiring device manufacturing companies in Missouri include The Gund Company, Inc. and Zpartz Inc.[247](#_edn247) The primary products produced by these companies include electrical junction boxes for a voltage not exceeding 1,000 V (SITC: 77259), electrical conduit tubing lined with insulation (SITC: 77329), insulators, nesoi (SITC: 77324), and others.[248](#_edn248)
Over the past nine years (available data), the noncurrent carrying wiring device manufacturing industry in Missouri has expanded. Indeed, from 2015 to 2023, Missouri’s industry’s employees rose 40 percent from 1,070 to 1,493 employees while U.S. manufacturing sector’s employees grew 6.3 percent.[249](#_edn249) As such, this indicates that Missouri’s industry’s growth far exceeded the overall manufacturing sector’s growth and has expanded its share of the overall manufacturing sector. When examined closer, a large share of Missouri’s industry’s growth came from 2015 to 2016 when employees rose from 1,070 to 1,390.[250](#_edn250) Yet, even when this outlier is removed, Missouri’s industry still expanded 7.4 percent, exceeding U.S. manufacturing sector’s 6.4 percent growth rate.[251](#_edn251)
**Figure 83: Employment in noncurrent carrying wiring device manufacturing in Missouri**
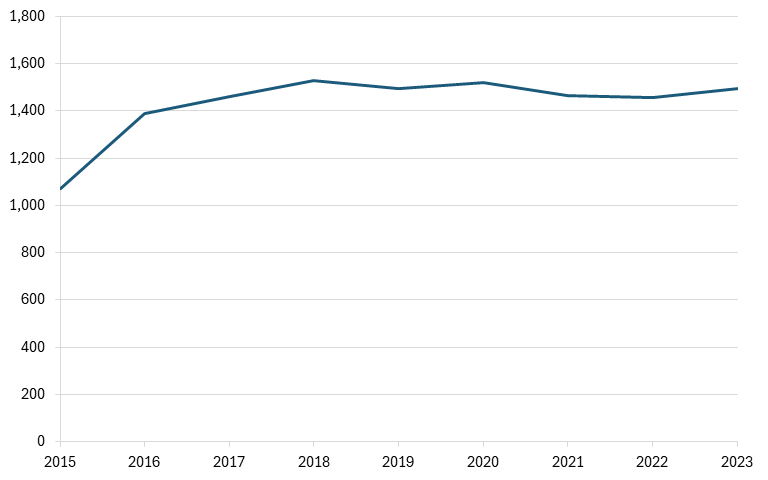
Corresponding with the time period above, from 2015 to 2023, China’s exports to the world grew while Missouri’s noncurrent carrying wiring device manufacturing industry was also expanding. Indeed, while Missouri’s industry’s employees expanded, China’s exports as a share of the global exports grew from 17 percent to 21.2 percent.[252](#_edn252) As such, Chinese competition is unlikely to have an impact on Missouri’s industry, as both have grown concurrently. Moreover, even when Missouri’s industry’s outlier year is removed, both Missouri’s industry and Chinese exports have risen, further corroborating that Chinese competition may not have any influence over the Missouri’s industry trends. However, it should be noted that Chinese competition could have some influence over the noncurrent carrying wiring device manufacturing industry in other states. Indeed, from 2015 to 2021, while Chinese exports rose from 17 percent to 22.4 percent, U.S. exports experienced a decline from 10.4 percent to 8 percent.[253](#_edn253) Yet, from 2021 to 2023, when Chinese exports declined from 22.4 percent to 21.2 percent, U.S. exports rose from 8 percent to 10 percent.[254](#_edn254) In sum, Chinese competition may not have influenced the trends on Missouri’s industry, but it could certainly have some impact over other U.S. states’ industry.
**Figure 84: United States’ and China’s shares of global exports of the noncurrent carrying wiring device manufacturing industry**
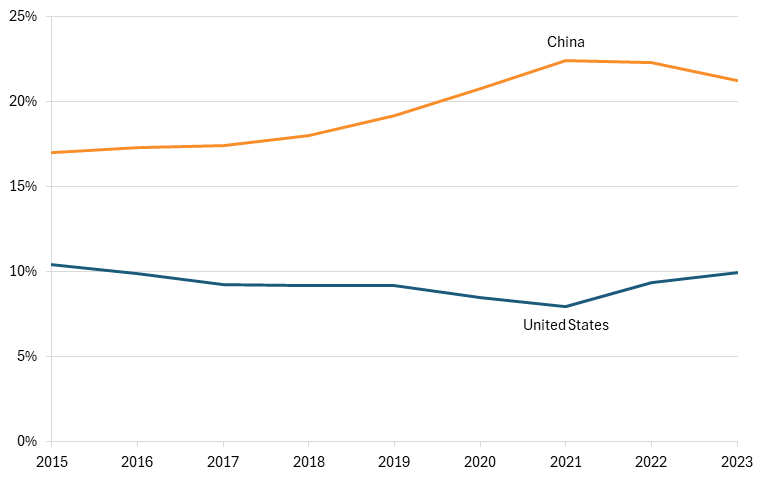
## Montana: Nonferrous Metal (except Aluminum) Smelting and Refining Industry (NAICS 331410)
A core industry in Montana is the nonferrous metal (except aluminum) smelting and refining industry. It is defined as “establishments primarily engaged in (1) smelting ores into nonferrous metals and/or (2) the primary refining of nonferrous metals (except aluminum) by electrolytic methods or other processes.”[255](#_edn255) The nonferrous metal (except aluminum) smelting and refining companies in Montana include Boulder River Foundary, Inc., N-S Refinery Services, and Rec Advanced Silicon materials LLC.[256](#_edn256) The primary products produced by these companies include hard zinc spelter (SITC: 28810), selenium (SITC: 52222), copper mattes (SITC: 28320), and others.[257](#_edn257)
Over the past eight years (available data), the nonferrous metal (except aluminum) smelting and refining industry in Montana has expanded. Indeed, from 2016 to 2023, Montana’s industry’s employees expanded 14.4 percent from 493 to 564 employees while U.S. manufacturing sector’s employees rose 6.4 percent.[258](#_edn258) As such, this indicates that Montana’s industry has exceeded the growth of the overall manufacturing sector and now comprises a larger share of it as well. When examined closer, Montana’s industry employees have seen a stable increase for most years but also a large decline from 2020 to 2021 before increasing significantly from 2021 to 2022.[259](#_edn259) This was likely due to layoffs during the pandemic. Overall, Montana’s industry has trended upward.
**Figure 85: Employment in nonferrous metal (except aluminum) smelting and refining in Montana**
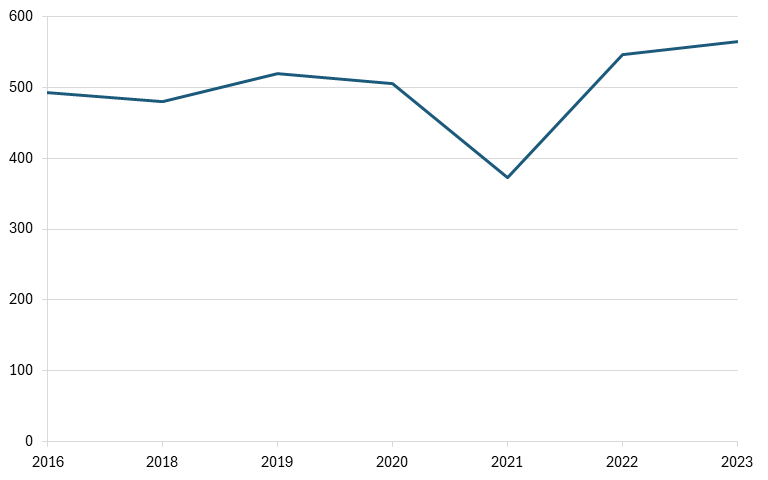
Corresponding with the time period above, from 2016 to 2023, China’s exports to the world grew while Montana’s nonferrous metal (except aluminum) smelting and refining industry was also expanding. Indeed, while Montana’s employees grew, China’s exports as a share of the global exports rose slightly from 1.7 percent to 2.2 percent, indicating that Chinese competition is unlikely to have impacted Montana’s industry, as both grew concurrently.[260](#_edn260) Corroborating this, during periods when overall U.S. exports in the industry grew, Chinese exports remained stable or only grew slightly. Indeed, from 2016 to 2022, U.S. exports rose from 5.2 percent to 7.3 percent while Chinese exports remained stable at about 2 percent from 2016 to 2020 and grew slightly from 1.9 percent to 2.2 percent in the subsequent years.[261](#_edn261)
**Figure 86: United States’ and China’s shares of global exports of the nonferrous metal (except aluminum) smelting and refining industry**
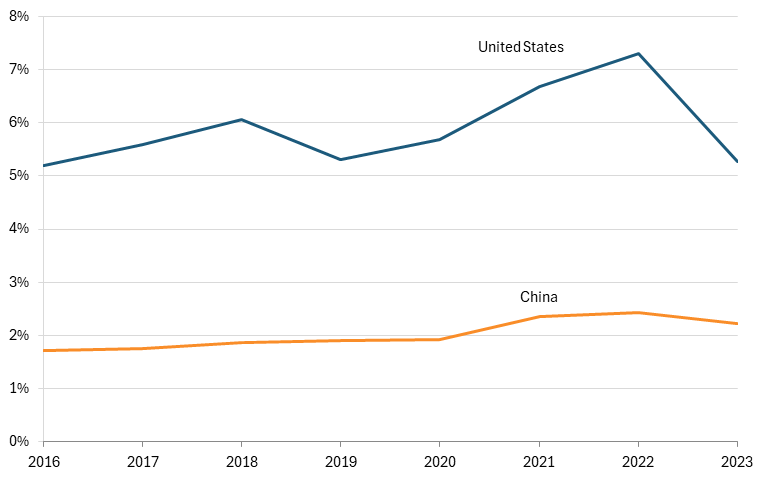
The Chinese nonferrous metal smelting and refining industry competes unfairly with its global competitors. Indeed, the Chinese government has historically provided direct subsidies to bolster some of its nonferrous metal industries. For instance, the Chinese government provided about $9 billion to $10 billion in financial support to its rare earth companies between 2010 and 2019.[262](#_edn262) These subsidies grew at about 22 percent annually and came in the form of direct grants, tax breaks, discounted resources, and preferential treatment.[263](#_edn263) One of the recipients of these subsidies, the China Northern Rare Earth Group High-Tec Co., received $21 million in subsidies in 2020 alone.[264](#_edn264) As a result of these subsidies, China had captured 85 to 90 percent of the global rare earth refining capacity by 2019.[265](#_edn265) In addition to the rare earth industry, the Chinese government also provides support to the general nonferrous metal sector. For example, in 2025, the Chinse government released a plan to support the growth of the nonferrous metal that intends to raise the average value-added growth rate by 5 percent from 2025 to 2026.[266](#_edn266) In sum, the Chinese nonferrous metal (except aluminum) industry is not competing fairly with its global competitors even if it is not taking away shares from U.S. companies.
## Nebraska: Farm Machinery and Equipment Industry (NAICS 333111)
A core industry in Nebraska is farm machinery and equipment, which “comprises establishments primarily engaged in manufacturing agricultural and farm machinery and equipment, and other turf and grounds care equipment, including planting, harvesting, and grass mowing equipment (except lawn and garden-type).”[267](#_edn267) The farm machinery and equipment industry companies in Nebraska include Agco, Automatic Equipment Manufacturing, and Agri-Products Inc. The primary products produced by these companies are greens mowers (SITC: 72121), harvesting machinery or threshing machinery, nesoi (SITC: 72123), cotton gins (SITC: 72442), and others.[268](#_edn268)
Over the past 10 years (available data), the farm machinery and equipment industry in Nebraska has contracted.[269](#_edn269) Indeed, from 2014 to 2023, Nebraska’s industry’s employees declined 19 percent while the overall U.S. manufacturing industry’s employees grew 8 percent, indicating that the Nebraskan industry is in decline, as it is not keeping up with U.S. manufacturing growth. When it comes to raw values, the state’s industry declined during this period from 7,417 to 6,024 employees.[270](#_edn270) At its peak in 2014, the state’s industry had 7,417 workers.[271](#_edn271) (See figure 87.)
**Figure 87: Employment in farm machinery and equipment manufacturing in Nebraska**
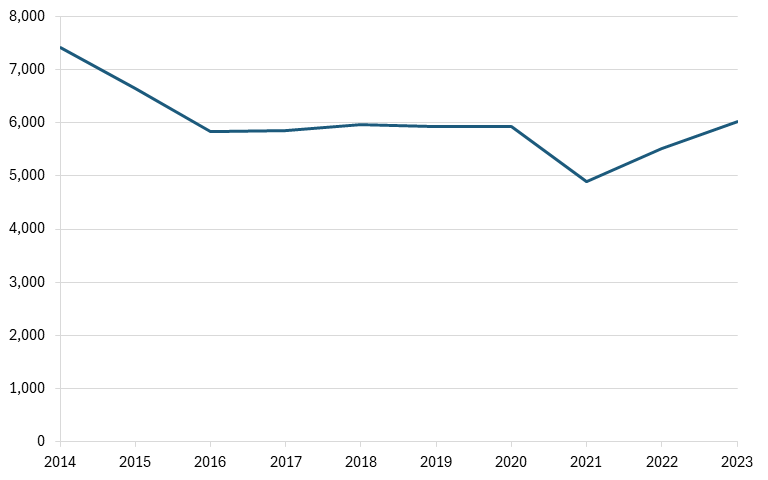
Corresponding with the time period above, from 2014 to 2023, China’s exports in this industry rose while Nebraska’s industry was declining. Indeed, while Nebraska’s industry’s employees in this industry declined, China’s exports as a share of the global exports rose from 8.7 percent to 12.3 percent, the highest growth all nations.[272](#_edn272) In other words, this is an indication that China’s production in this industry is growing and could be impacting the farm machinery and equipment companies in Nebraska. Moreover, U.S. exports in this industry had the second largest decline at 2.4 percent from 13.2 percent to 10.8 percent, further indicating that the Nebraskan and U.S. farm machinery industry could be in decline due to China’s rise.[273](#_edn273) (See figure 88.)
**Figure 88: United States’ and China’s share of global exports of farm machinery and equipment**
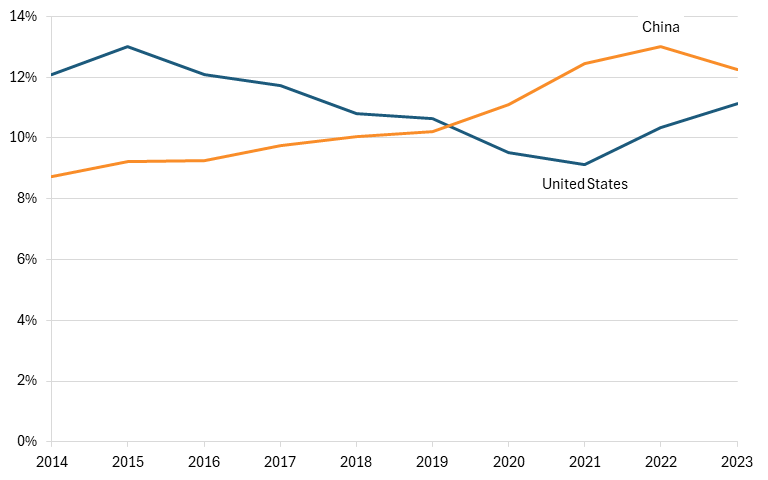
## Nevada: Search, Detection, Navigation, Guidance, Aeronautical, and Nautical System and Instrument Manufacturing (NAICS 334511)
A core industry in Nevada is the search, detection, navigation, guidance, aeronautical, and nautical system and instrument manufacturing industry. This industry “comprises establishments primarily engaged in manufacturing search, detection, navigation, guidance, aeronautical, and nautical systems and instruments.”[274](#_edn274) Industry products include aircraft instruments (except engine), flight recorders, and navigational instruments and systems.[275](#_edn275) The companies falling into this industry in Nevada include Sierra Pacific Innovations Corp and Valkyrie Systems Aerospace Inc.[276](#_edn276)[NK1](#_msocom_1) The primary products produced by these companies include radar detectors of a kind used in motor vehicles (SITC: 77834), optical direction finding compasses for use in civil aircraft (SITC: 87411), instrument and appliances for use in civil aircraft (SITC: 87411).[277](#_edn277)
Over the past six years (available data), the navigation, guidance, aeronautical system, and instrument manufacturing industry in Nevada has contracted slightly. Indeed, from 2018 to 2023, Nevada’s industry’s employees grew 3.2 percent while the overall U.S. manufacturing industry’s employees grew 3.5 percent, indicating that the Nevada industry is in decline as it is not keeping up with U.S. manufacturing growth. When examined closer, from 2018 to 2021, Nevada’s industry did experience an expansion as its employees grew 28 percent, while U.S. manufacturing industry’s employees declined 1.7 percent. However, from 2021 to 2023, the industry declined 19 percent despite U.S. manufacturing growing 5.3 percent.
When it comes to raw values, Nevada’s industry had 3,918 employees in 2018 before peaking at 5,010 in 2021.[278](#_edn278) However, by 2023, that number had declined back to 4,045 employees, just slightly higher than its 2018 numbers.[279](#_edn279) As such, this decline back to 4,045 employees means that the Nevada industry could not keep up with U.S. manufacturing growth.
**Figure 89: Employment in search, detection, navigation, guidance, aeronautical, and nautical system and instrument manufacturing in Nevada**
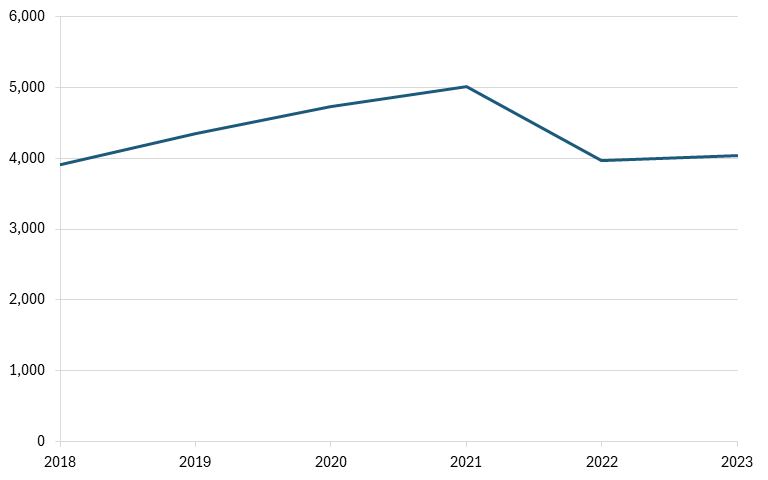
Corresponding with the time period above, from 2018 to 2023, China’s exports to the world followed similar trends as Nevada’s search, detection, navigation, guidance, aeronautical, and nautical system and instrument manufacturing industry. Indeed, while the Nevada industry’s employees grew from 2018 to 2021, China’s exports as a share of the global exports also rose from 22.5 percent to 28 percent.[280](#_edn280) From 2021 to 2023, while Nevada industry’s employees contracted, China’s exports also declined from 28 percent back to 26 percent.[281](#_edn281) In other words, China’s industry likely could not have an influence on Nevada’s search, detection, navigation, guidance, aeronautical, and nautical system and instrument manufacturing industry’s trends. Corroborating this, U.S. share of global exports in this industry remained relatively stable despite China’s export growth. More likely, during this period, the industry expanded and then contracted as both China’s exports and Nevada’s employees from the industry followed the same trend.
**Figure 90: United States’ and China’s shares of global exports of search, detection, navigation, guidance, aeronautical, and nautical systems and instruments**
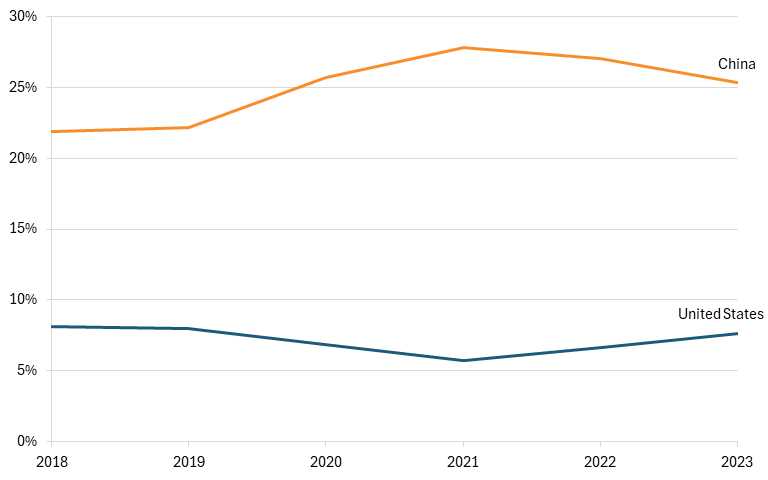
## New Hampshire: Computer Terminal and Other Computer Peripheral Equipment Manufacturing (NAICS 334118)
A core industry in New Hampshire is the computer terminal and other computer peripheral equipment manufacturing industry, defined as “establishments primarily engaged in manufacturing computer terminals and other computer peripheral equipment (except storage devices).”[282](#_edn282) More specifically, the industry involves automatic teller machine (ATM) manufacturing, joystick devices manufacturing, and keyboard manufacturing.[283](#_edn283) The computer terminal and other computer peripheral equipment manufacturing industry companies in New Hampshire include Global American Sales, Inc., Microdaq.co Ltd., and Seamark International LLC.[284](#_edn284) Some of primary products produced by these companies include keyboard units (SITC: 75260), card key and magnetic media entry devices (SITC: 75260), and monitors, of a kind solely or principally used in an automatic data processing systems of heading 8471, nesoi (SITC: 76140).[285](#_edn285)
Over the past 10 years (available data), the computer terminal and other computer peripheral equipment manufacturing industry in New Hampshire has expanded. Indeed, from 2014 to 2023, New Hampshire’s industry’s employees grew 26 percent from 466 to 600. Meanwhile, the U.S. manufacturing sector’s employees grew by 8 percent, indicating that New Hampshire’s industry is becoming a larger portion of the manufacturing sector. Despite this overall expansion, New Hampshire’s industry saw an even larger expansion from 2014 to 2018 when its employees grew 159 percent to 1,206 employees while the U.S. manufacturing industry’s grew 4.3 percent.[286](#_edn286) Finally, from 2018 to 2023, New Hampshire’s industry contracted 51 percent while the U.S. manufacturing industry grew 3.5 percent. This is partly due to a single year contraction from 2019 to 2020 when employees dropped from 1,179 to 377. Regardless of the shifts, New Hampshire’s industry expanded from 2014 to 2023.
**Figure 91: Employment in computer terminal and other computer peripheral equipment manufacturing in New Hampshire**
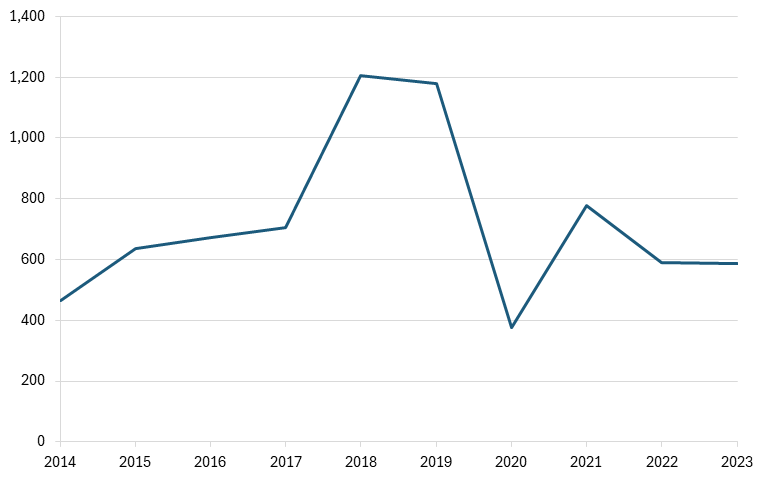
Corresponding with the time period above, from 2014 to 2023, China’s exports to the world has not followed a trend that indicates it had any heavy influence on New Hampshire’s computer terminal and other computer peripheral equipment manufacturing industry. Indeed, from 2014 to 2018, while New Hampshire’s industry was rising, China’s exports as a share of the global total remained relatively stable at about 27 to 29 percent.[287](#_edn287) And during New Hampshire’s industry’s decline from 2018 to 2023, China’s exports as a share of the world total also declined from 29 to 23 percent, indicating that the industry simply may have been facing a decline rather than Chinese firms gaining U.S. firms’ markets.[288](#_edn288)
**Figure 92: United States’ and China’s shares of global exports of computer terminals and other computer peripheral equipment**
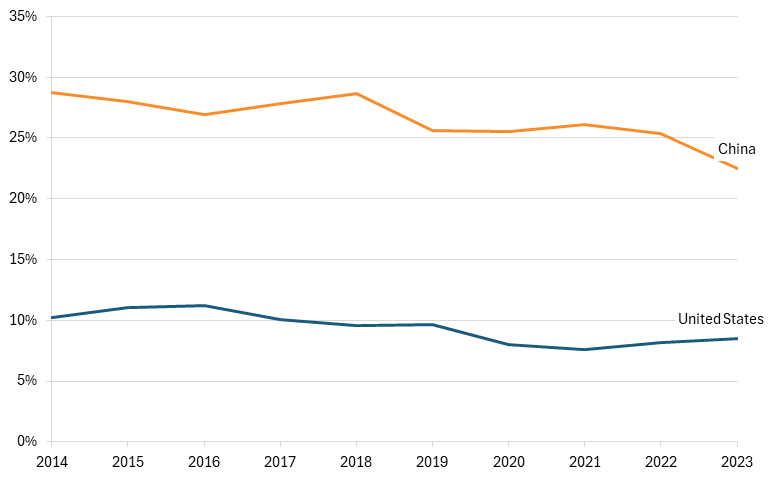
Besides a lagging industry, any losses in the New Hampshire industry were likely captured by other Asian nations. The exports data shows that Other Asia had the highest increase in exports as a share of the global total at 9.3 percent during New Hampshire’s industry’s decline from 2018 to 2023.[289](#_edn289)
In sum, competition from Chinese companies was not a primary driver in New Hampshire’s computer terminal and other computer peripheral equipment manufacturing industry’s rise from 2014 to 2018 and its subsequent decline from 2018 to 2023.
## New Jersey: Pharmaceutical Preparation Manufacturing (NAICS 325412)
A core industry in New Jersey is the pharmaceutical preparation manufacturing industry. The pharmaceutical preparation manufacturing industry is defined as “establishments primarily engaged in manufacturing in-vivo diagnostic substances and pharmaceutical preparations (except biological) intended for internal and external consumption in dose forms, such as ampoules, tablets, capsules, vials, ointments, powders, solutions, and suspensions.”[290](#_edn290) Such companies in New Jersey include Aace Pharmaceuticals Inc., Aarkish Pharmaceuticals NJ Inc, and Apogee Pharma Inc.[291](#_edn291) The primary products produced by these companies include tilitdine (inn) and its salts (SITC: 51465), antihistamines (SITC: 51577), and epinephrine (SITC: 54155), and others.[292](#_edn292)
Over the past 10 years (available data), the pharmaceutical preparation manufacturing industry in New Jersey has expanded. Indeed, from 2014 to 2023, New Jersey’s industry’s employees grew 52 percent from 7,147 to 10,858 while the overall U.S. manufacturing industry’s employees grew 8 percent, indicating that New Jersey’s industry expanded its share of manufacturing employees. Despite the general upward trend, New Jersey’s industry employees experienced a 23 percent decline while the overall U.S. manufacturing sector’s employees grew 3.4 percent from 2015 to 2020. In the subsequent years, New Jersey’s industry expanded again with employees growing 29 percent compared with the U.S. manufacturing sector’s 2.8 percent. Regardless of the shifts, New Jersey’s industry expanded from 2014 to 2023.
**Figure 93: Employment in pharmaceutical preparation manufacturing in New Jersey**
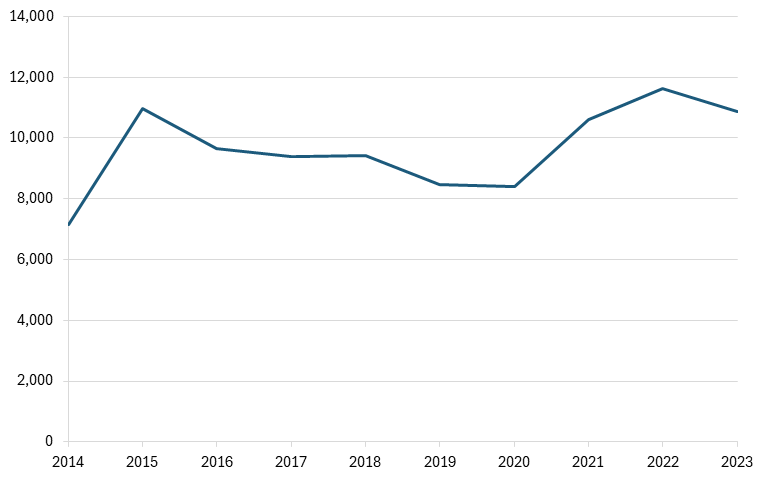
Corresponding with the time period above, from 2014 to 2023, China’s exports to the world generally rose while New Jersey’s industry was also rising. Indeed, while New Jersey’ industry’s employees grew, China’s exports as a share of the global exports also rose from 5.1 percent to 6.1 percent.[293](#_edn293) From 2015 to 2020 when New Jersey’s industry was declining, China’s exports as a share of the global total remained relatively stable at a range of 5.2 percent to 5.6 percent, indicating that China is unlikely to have played a role in New Jersey’s industry’s trends.[294](#_edn294) Moreover, while New Jersey’s industry expanded from 2020 to 2023, China’s exports shares also grew, further indicating that Chinese competition is unlikely to have influenced New Jersey’s industry.
**Figure 94: United States’ and China’s share of global exports of the pharmaceutical preparation manufacturing industry**
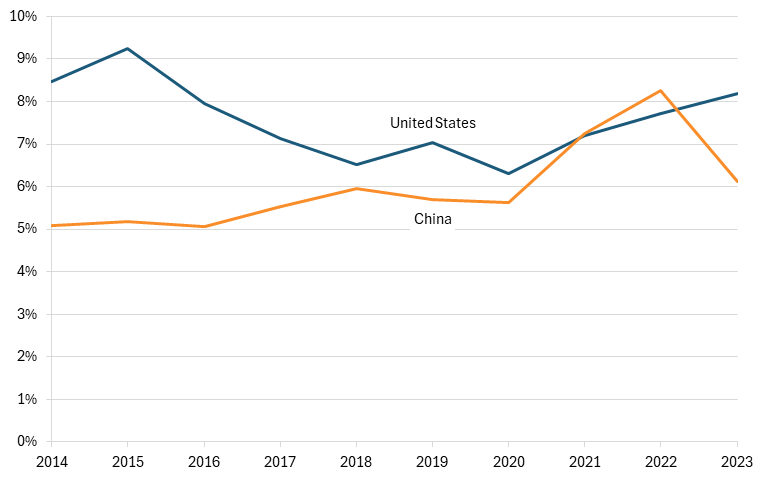
## New Mexico: Semiconductor and Related Device Manufacturing (NAICS 334413)
New Mexico has a long-standing presence in semiconductor manufacturing, anchored by major legacy fabrication facilities and federal research infrastructure. While smaller than leading semiconductor hubs such as Arizona or Texas, the industry remains a critical component of New Mexico’s advanced manufacturing base. However, like other U.S. semiconductor clusters, New Mexico faces growing competitive pressure from China’s state-backed expansion of chip production capacity.
Semiconductor manufacturing in New Mexico is highly concentrated in the Albuquerque area, where Intel operates one of its largest and most advanced U.S. manufacturing campuses. Its Rio Rancho facility alone employs thousands of workers and represents one of the largest private-sector employers in the state.[295](#_edn295) The facility has received billions in cumulative investment and continues to play a role in advanced packaging and fabrication processes. In addition to Intel, New Mexico benefits from the presence of Sandia National Laboratories and Los Alamos National Laboratory, both of which contribute to semiconductor R&D, materials science, and microelectronics innovation.[296](#_edn296) Overall, New Mexico has seen a rapid increase in the number of semiconductor manufacturing employees in the state. Between 2017 and 2023, the number of employees increased by 88 percent, from about 1,600 to over 3,000.[297](#_edn297) (See figure 95.)
**Figure 95: Employment in semiconductor manufacturing in New Mexico**
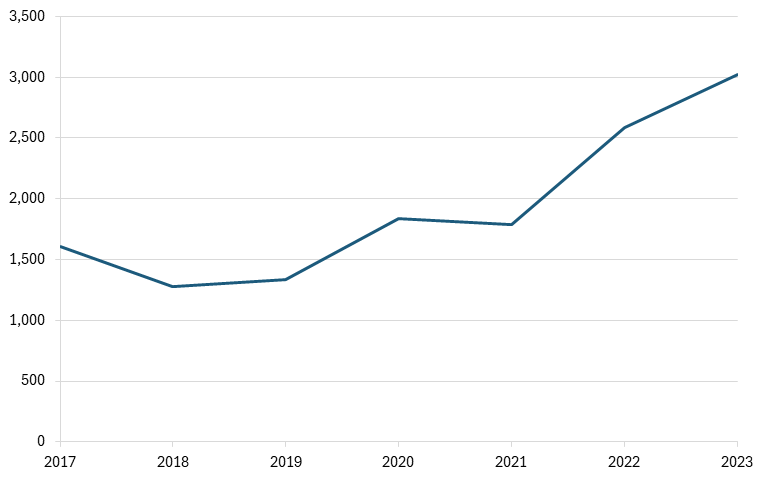
In 2022, the federal government invested $52 billion in the U.S. semiconductor industry through the CHIPS and Science Act, which aimed to revitalize domestic semiconductor manufacturing. Though much of the investment is directed toward larger semiconductor hubs such as in Arizona, New Mexico still stands to benefit indirectly through investment in workforce development and R&D funding for the national laboratories.[[298]](#_edn298) Overall, New Mexico employs nearly 4,000 workers in the semiconductor industry, and semiconductors are the state’s second-most valuable exports, valued at about $1.6 billion in 2022.[299](#_edn299)
While investment in domestic semiconductor production has the potential to increase U.S. manufacturing capacity and American competitiveness, the Chinese government has invested even more, thereby threatening the global market share the United States commands. Through substantial subsidies and overproduction, Chinese firms are suppressing semiconductor prices, gaining global market share, and harming the future success of Arizona fabs. Overall, the Chinese government plans to invest over $150 billion in the industry by 2030.[[300]](#_edn300)
China’s push for dominance in semiconductors is most evident in legacy semiconductor manufacturing, which has benefited from significant industrial subsidies and grown faster than the rest of the global market has. This is also the type of semiconductor that Intel specializes in. Chinese legacy chip production capacity grew more than four times faster than global demand did between 2015 and 2023.[301](#_edn301) Continually increasing production capacity without corresponding growth in demand can result in overcapacity, which reduces prices and revenue for U.S. chip manufacturers. In terms of overall semiconductor production capacity, China’s stock has been rising at the expense of the United States, disproportionately affecting areas highly concentrated in semiconductors, such as New Mexico. Between 2000 and 2025, China’s share of global semiconductor manufacturing capacity increased by 20 percentage points, while the United States saw its share decline by 8 percentage points.[[302]](#_edn302) (See figure 96.)
**Figure 96: Share of global semiconductor production capacity (projected from 2025)**

For much of the early 2000s, the United States exported far more semiconductors (HS 8541 and 8542) than China did. However, since 2009, China has overtaken the United States, with exports growing rapidly while U.S. exports have remained stagnant. From 2014 to 2024, Chinese semiconductor exports grew from $91 billion to $208 billion, an increase of 126 percent. Conversely, U.S. exports increased from $41 billion to just $57 billion, a 37 percent increase.[303](#_edn303) (See figure 97.) Indeed, investment spurred by the CHIPS and Science Act will increase U.S. manufacturing capacity and exports after those new fabs become operational. The U.S. Department of Commerce has warned that China’s rapid expansion of semiconductor production poses a risk to newly built fabrication facilities in the United States and allied countries, as increased Chinese capacity could reduce utilization rates at these fabs below levels needed to sustain profitability.[[304]](#_edn304)
**Figure 97: Semiconductor exports**
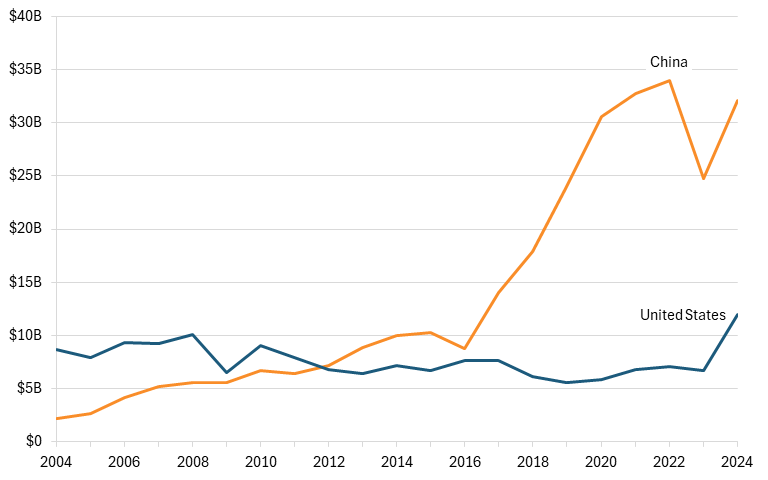
The high subsidies in the Chinese semiconductor industry allow Chinese firms to sell semiconductors at a lower cost than U.S. competitors can, at times selling chips below production cost. On average, Chinese manufacturers sell chips between 30 and 50 percent cheaper than U.S. suppliers do, increasing the attractiveness of their products in third-party markets.[305](#_edn305) Consequentially, U.S. exports to Malaysia, Singapore, and Vietnam have grown at a fraction of the pace of China’s, with Chinese exports to these countries close to double that of the United States in 2024.[306](#_edn306) (See figure 98.)
**Figure 98: Semiconductor exports to Malaysia, Singapore, and Vietnam**
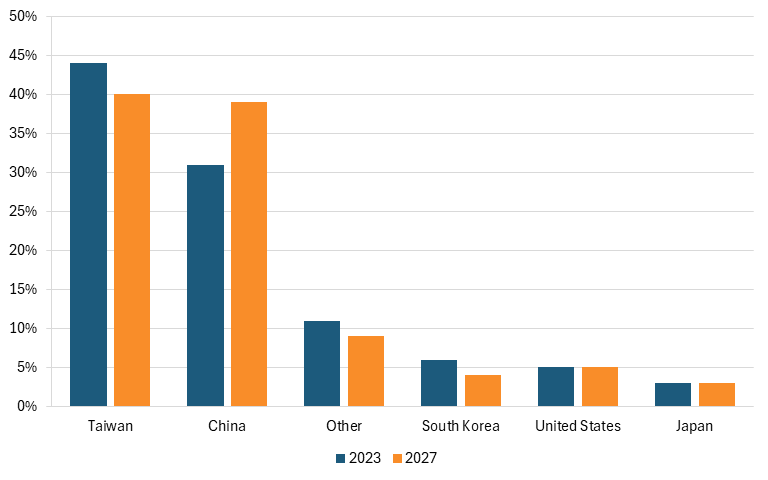
Under its Made in China 2025 strategy, the Chinese government set explicit targets of achieving 70 percent self-sufficiency in semiconductors by 2025 and establishing global leadership in semiconductor manufacturing by 2030.[[307]](#_edn307) While these benchmarks have not yet been fully met, Chinese firms are expected to continue expanding rapidly as state support and investment remain closely aligned with these long-term objectives. China’s share of legacy chip manufacturing is expected to grow from 31 percent in 2023 to 39 percent in 2027, making it second globally behind Taiwan, whose share is projected to decline from 44 percent to 40 percent.[308](#_edn308) The United States is projected to hold 5 percent of the global market share. (See figure 99.) Moreover, between 2022 and 2026, China is expected to build more new fabs and complete more major expansions than any other region, bringing 26 facilities online, compared with only 16 in the Americas.[309](#_edn309)
**Figure 99: Global market share in legacy semiconductor manufacturing, 2023 vs. 2027 projection[310](#_edn310)**
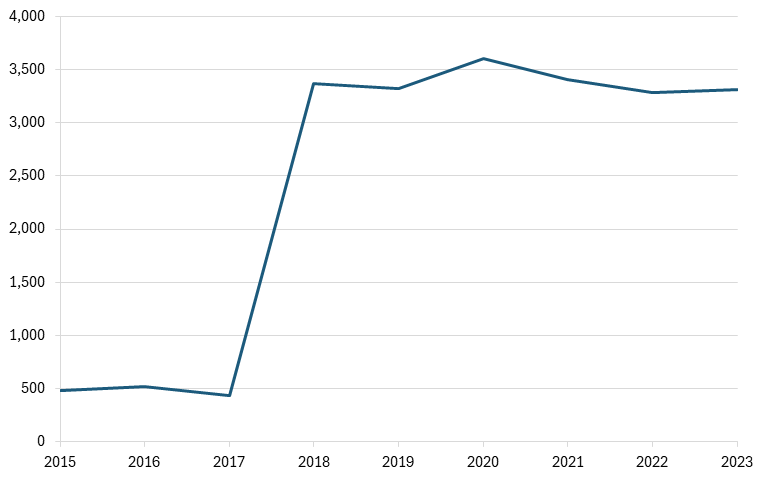
China’s push for dominance in the global semiconductor market poses an imminent threat to U.S. manufacturers, and China’s growth is not expected to slow.[[311]](#_edn311) As Chinese producers replace U.S. suppliers domestically and expand aggressively into competitive export markets, U.S. semiconductor firms will face sustained erosion in market share, revenue, and profitability. Chinese authorities will continue to aggressively subsidize the semiconductor industry to reach China’s $150 billion target, thereby contributing to overcapacity and artificially low prices for Chinese firms. For New Mexico, where the semiconductor industry has seen rapid growth over the past several years, this loss of global demand and reduced revenue would translate into slower industry growth and weaker job creation, a threat to the future of the state’s economy.
## New York: Electronic Computer Manufacturing (NAICS 334111)
A core industry in New York is the electronic computer manufacturing industry, defined as “establishments primarily engaged in manufacturing and/or assembling electronic computers, such as mainframes, personal computers, workstations, laptops, and computer servers … The manufacture of computers includes the assembly or integration of processors, coprocessors, memory, storage, and input/output devices into a user-programmable final product.”[312](#_edn312) The electronic computer manufacturing industry companies in New York include Addex, Inc., International Electronic Machines Corporation, and Main Stream Computing, Inc.[313](#_edn313) The primary products produced by these companies include digital adaptive machines comprising (in the same housing) at least a CPU and an input and output unit (whether or not combined) without a cathode ray tube (CRT), nesoi (SITC: 75230), process units with a CRT, whether or not containing in the same housing one or two of the following: storage units, input units, or output units (SITC: 75230), and portable digital automatic data processing machines, weight not more than 10 kg, consisting of at least a central processing unit, keyboard, and display (SITC: 75220), and others.[NK2](#_msocom_2)[314](#_edn314)
Over the past nine years (available data), the electronic computer manufacturing industry in New York has expanded. Indeed, from 2015 to 2023, New York’s industry’s employees expanded 592 percent from 479 to 3,313 employees while the overall U.S. manufacturing sector only grew 6.3 percent[ra3](#_msocom_3). As such, this indicates that New[RA4](#_msocom_4) York’s industry grew faster than the U.S. manufacturing industry did and encompassed a larger share of the manufacturing industry’s employees in 2023. New York’s industry experienced its largest growth from 2017 to 2018, when its employees jumped from 434 to 3,313. Although data is limited, this large increase could have been due to a new electronic computer manufacturing establishment opening up in New York or the reclassification of an existing manufacturing plant to the electronic computer manufacturing industry.
**Figure 100: Employment in electronic computer manufacturing in New York**
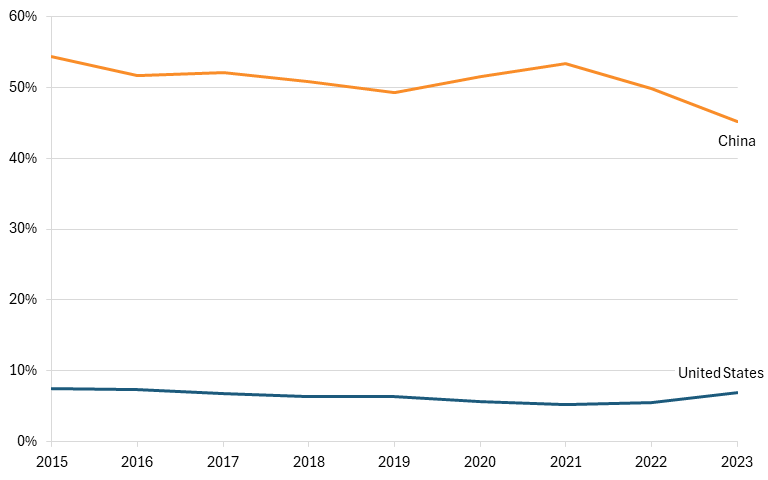
Corresponding with that time period, from 2015 to 2023, China’s exports to the world declined slightly while New York’s electronic computer manufacturing industry was rising. Indeed, while New York’s industry’s employees grew, China’s exports as a share of the global exports declined from 54 percent to 45 percent.[315](#_edn315) In other words, New York’s industry could be competitive with Chinese firms in this industry, as New York’s growth is correlated with Chinese firms’ export decline.
**Figure 101: United States’ and China’s electronic computer manufacturing exports to the world**
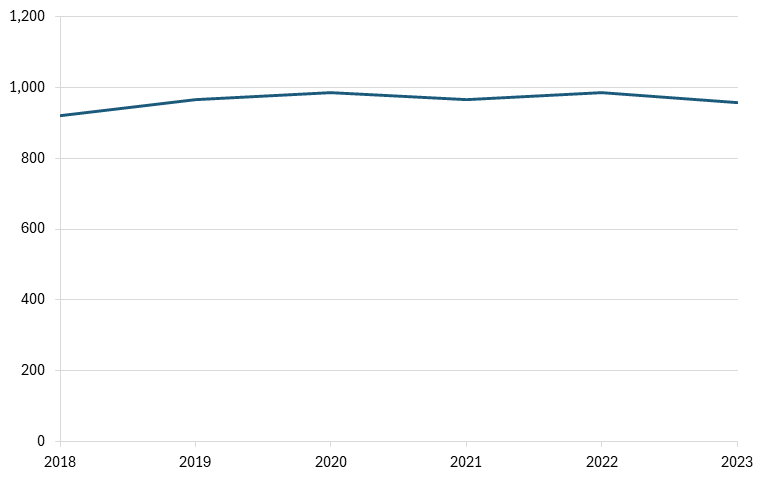
## North Carolina: Fiber Optic Cable Manufacturing Industry (NAICS 335921)
A core industry in North Carolina is the fiber optic cable manufacturing industry. This industry is defined as “establishments primarily engaged in manufacturing insulated fiber optic cable from purchased fiber optic strand.”[316](#_edn316) The fiber optic cable manufacturing industry companies in North Carolina include JCM Telecom Corporation, Roblon U.S. Inc, and Mid-Atlantic Cable Solutions Inc.[317](#_edn317) The primary products produced by these companies include insulated optical fiber cables with individually sheathed fibers (SITC: 77318).[318](#_edn318)
Over the past six years (available data), the fiber optic cable manufacturing industry in North Carolina has expanded. Indeed, from 2018 to 2023, North Carolina’s industry’s employees grew only 4.1 percent from 920 to 958 employees while the overall U.S. manufacturing sector’s employees grew 3.5 percent. As such, this indicates that North Carolina’s industry grew slightly faster than the U.S. manufacturing sector did and subsequently increased its share of the sector.
**Figure 102: Employment in fiber optic cable manufacturing in North Carolina**
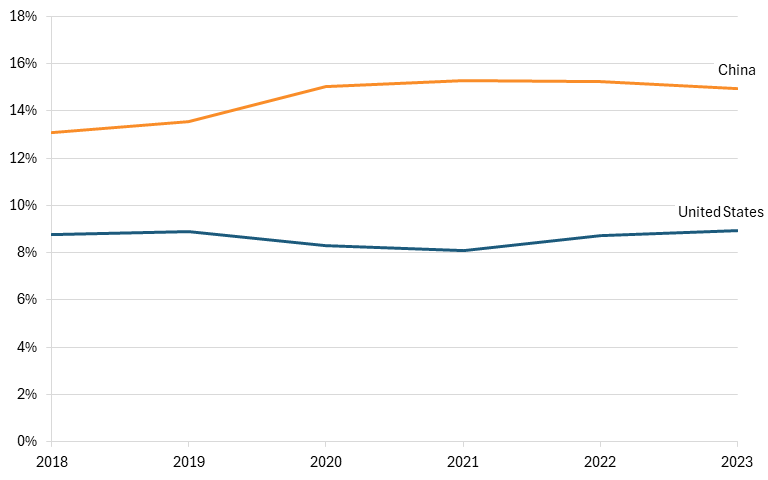
Corresponding with the time period above, from 2018 to 2023, China’s share of exports from the industry to the world rose while North Carolina’s fiber optic cable manufacturing industry was also expanding. Indeed, while the state’s industry’s employees expanded, China’s exports as a share of the global exports rose the most of 187 nations (with available data) from 13.1 percent to 14.9 percent.[319](#_edn319) In other words, China’s industry is unlikely to have influenced North Carolina’s industry, as its exports growth is positively correlated with North Carolina’s industry’s growth.
**Figure 103: United States’ and China’s shares of global exports of fiber optic cables**
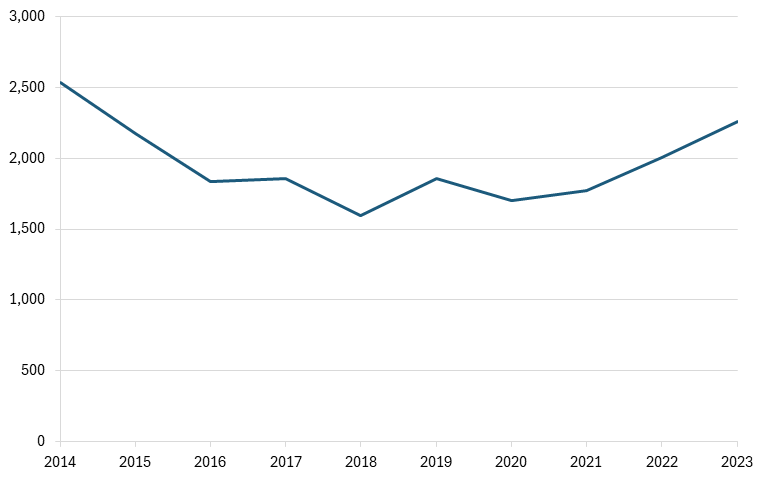
## North Dakota: Farm Machinery and Equipment Manufacturing (NAICS 333111)
A core industry in North Dakota is the farm machinery and equipment manufacturing industry, which is defined as “establishments primarily engaged in manufacturing agricultural and farm machinery and equipment, and other turf and grounds care equipment, including planting, harvesting, and grass mowing equipment (except lawn and garden-type).”[320](#_edn320) The farm machinery and equipment manufacturing companies in North Dakota include Degelman Industries USA Ltd., Hausers Farm Supply, and Lange Supply Inc.[321](#_edn321) The primary products produced by these companies are greens mowers (SITC: 72121), harvesting machinery or threshing machinery, nesoi (SITC: 72123), cotton gins (SITC: 72442), and others.[322](#_edn322)
Over the past 10 years, the farm machinery and equipment manufacturing industry in North Dakota has contracted. Indeed, from 2014 to 2023, North Dakota’s industry’s employees declined 11 percent from 2,533 to 2,258 employees while the U.S. manufacturing sector expanded by 8 percent. As such, North Dakota’s industry has not kept up with the manufacturing sector’s growth and was a smaller share of the sector in 2023 than in 2015. When examined more closely, from 2014 to 2018, North Dakota’s industry experienced an even larger decline of 37 percent while the overall U.S. manufacturing industry rose 4.3 percent. However, in the subsequent years, North Dakota’s industry grew 41 percent while U.S. manufacturing grew 3.5 percent, reducing the overall contraction North Dakota’s industry could have experienced from 2014 to 2023.
**Figure 104: Employment in farm machinery and equipment manufacturing in North Dakota**
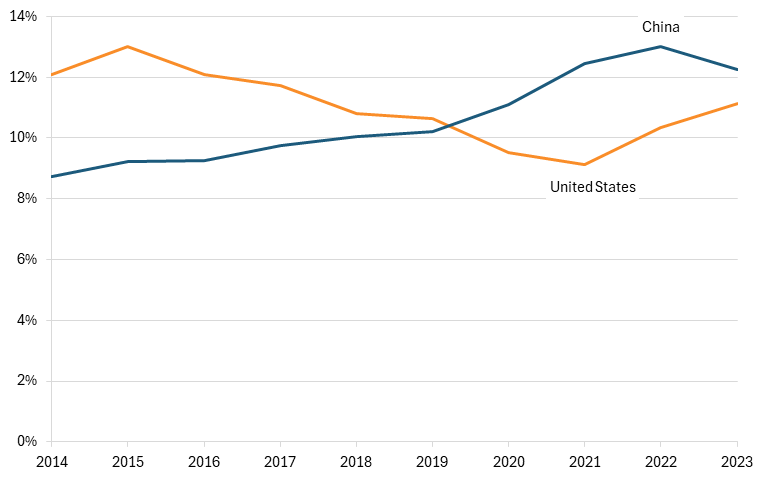
Corresponding with the time period above, from 2014 to 2023, China’s exports to the world grew while North Dakota’s farm machinery and equipment industry was contracting. Indeed, during this period, while North Dakota’s employees contracted, Chinese exports’ share in the industry grew from 8.7 percent to 12.3 percent, indicating that Chinese competition could have an impact on North Dakota’s industry. Moreover, when North Dakota’s industry’s employees contracted from 2014 to 2018, China’s exports as a share of the global exports rose from 8.7 percent to 10 percent, indicating that China’s growth could have influenced North Dakota’s industry’s decline.[323](#_edn323) While North Dakota’s employees rose again from 2018 to 2023, China’s exports also continued to rise from 10 percent to 12.3 percent, indicating that Chinese competition could have only impacted North Dakota’s industry by slowing its growth but could also have had no impact.[324](#_edn324) In general, North Dakota’s industry’s success is negatively correlated with China’s exports growth when a longer period is considered, indicating that Chinese competition could have some impact on North Dakota’s industry.
**Figure 105: United States’ and China’s shares of global exports of farm machinery and equipment**
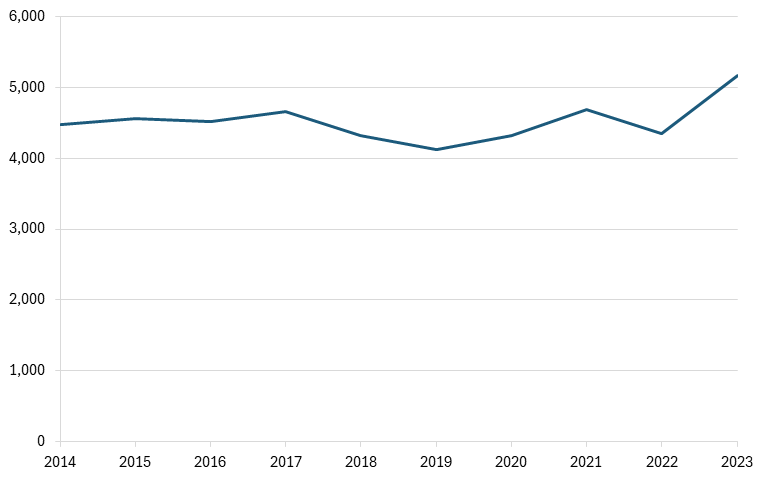
China’s farm machinery and equipment industry competes unfairly against global competitors. Although not direct subsidies to companies, subsidies provided by the Chinese government for the purchase of agricultural machinery and tools have bolstered the industry, increasing companies’ revenue, ability to increase R&D, and global competitiveness. For instance, the Chinese government provides subsidies for replacing cotton pickers at up to ~$11,750 per unit.[325](#_edn325) In 2012, the Chinese government also provided subsidies of up to $2.9 billion for the purchase of agricultural machinery.[326](#_edn326) In sum, the data combined with Chinese government subsidies indicates that China has influenced Nebraska’s farm machinery and equipment industry decline.
## Ohio: Welding and Soldering Equipment Manufacturing Industry (NAICS 333992)
A core industry in Ohio is the welding and soldering equipment manufacturing industry, defined as “establishments primarily engaged in manufacturing welding and soldering equipment and accessories (except transformers), such as arc, resistance, gas, plasma, laser, electron beam, and ultrasonic welding equipment; welding electrodes; coated or cored welding wire; and soldering equipment (except handheld).”[327](#_edn327) The welding and soldering equipment manufacturing companies in Ohio include Advance Industrial Manufacturing Inc., Apex Welding Incorporated, and Arcweld, Inc.[328](#_edn328) The primary products produced by these companies include handheld blow torches (SITC: 73741), core wired of base metal for electric arc-welding (SITC: 69955), and welding machine parts and parts of apparatus (SITC: 73739).[329](#_edn329)
Over the past 10 years (available data), the welding and soldering equipment manufacturing industry in Ohio has expanded. Indeed, from 2014 to 2023, Ohio’s industry’s employees grew 15 percent from 4,479 to 5,162 employees while the U.S. manufacturing sector’s employees grew 8 percent. As such, this indicates that Ohio’s industry surpassed the manufacturing sector’s growth and now encompasses a larger share of the manufacturing sector. When examined more closely, Ohio’s industry’s employees remained relatively stable and had a sharp growth from 2022 to 2023 when its employees jumped from 4,351 to 5,162. Without this growth, Ohio’s industry would have declined 2.9 percent while the U.S. manufacturing sector grew 6.7 percent, meaning that Ohio’s industry was declining until 2022.
**Figure 106: Employment in the welding and soldering equipment industry in Ohio**
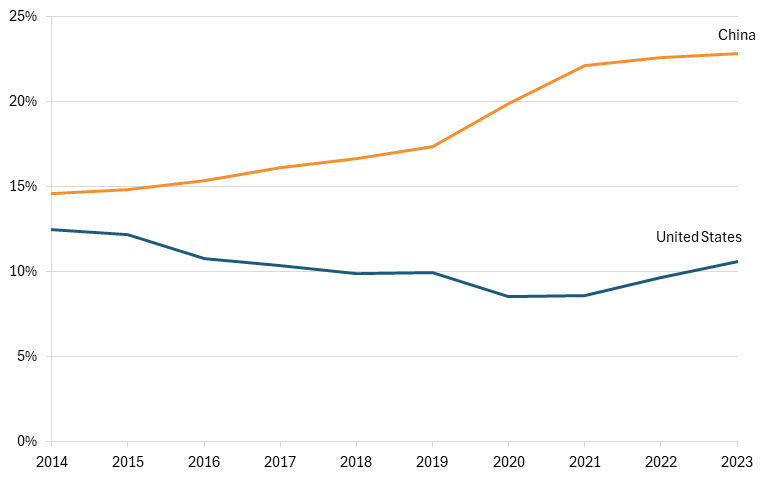
Corresponding with the time period above, from 2014 to 2023, China’s exports to the world rose while Ohio’s welding and soldering equipment manufacturing industry also grew. Indeed, while Ohio’s industry’s employees grew, China’s exports as a share of the global exports had the highest percentage point growth of 182 nations with available data—Chinese exports share grew from 14.6 percent to 22.8 percent.[330](#_edn330) However, when the 2022 to 2023 period is removed (giving its outlier status in growth), the data suggest that Chinese competition could have indeed impacted Ohio’s industry. While Ohio’s industry employees declined 2.9 percent from 2014 to 2022, Chinese exports rose from 14.6 percent to 22.6 percent. In sum, when outliers are removed from the data, Chinese competition could have influenced Ohio’s industry trends.
**Figure 107: United States’ and China’s shares of global exports of welding and soldering equipment**
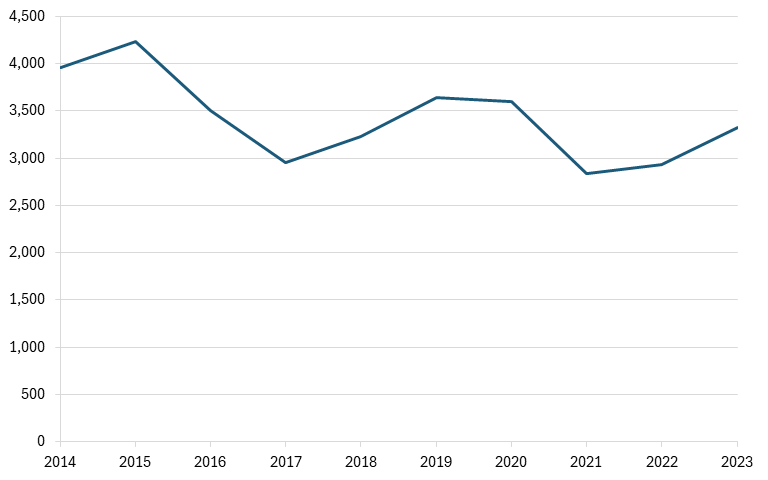
China’s welding and soldering equipment industry unfairly competes with its global competitors. Although the Chinese government does not provide direct subsidies to the industry, the Chinese government does actively bolster the industry by incentivizing consumers to upgrade their industrial equipment. Indeed, in recent years, the Chinese government has promoted industrial equipment upgrading and has called for a 25 percent increase in capital investments in equipment by 2027.[331](#_edn331) Moreover, historically, China has implemented the Made in China 2025 plan to upgrade Chinese manufacturing industries, including the electrical equipment industry, which includes welding and soldering equipment.[332](#_edn332) As such, the industry would benefit from the subsidies, tax breaks, financial incentives, and other benefits that come from the plan.[333](#_edn333) In sum, Chinese welding and soldering equipment manufacturing firms have benefitted from some government assistance, thereby negatively impacting U.S. firms’ ability to compete and grow.
## Oklahoma: Power Boiler and Heat Exchanger Manufacturing (NAICS 332410)
A core industry in Oklahoma is the power boiler and heat exchanger manufacturing industry. It is defined as “establishments primarily engaged in manufacturing power boilers and heat exchangers. Establishments in this industry may perform installation in addition to manufacturing power boilers and heat exchangers.”[334](#_edn334) The power boiler and heat exchanger manufacturing companies in Oklahoma include 3D Manufacturing, Inc., Born Inc., and Cooling Products, Inc.[335](#_edn335) The primary products produced by these companies include nuclear reactors (SITC: 71871), super-heated water boilers (SITC: 71112), heat exchangers (SITC: 71191), and others.[336](#_edn336)
Over the past 10 years (available data), the power boiler and heat exchanger manufacturing industry in Oklahoma has contracted. Indeed, from 2014 to 2023, Oklahoma’s industry’s employees declined 16 percent from 3,957 to 3,324 while U.S. manufacturing sector employees grew 8 percent. As such, Oklahoma’s industry has not kept up with the U.S. manufacturing sector’s growth and is a smaller share of the manufacturing sector. Although Oklahoma’s industry’s employees have experienced a series of growth and declines, the industry has overall trended downward.
**Figure 108: Number of employees in the power boiler and heat exchanger industry in Oklahoma**
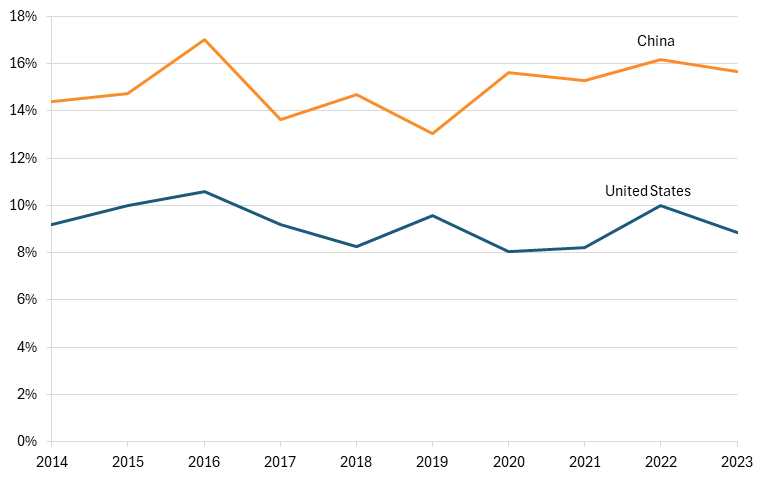
Corresponding with the time period above, from 2014 to 2023, China’s exports to the world generally trended upward while Oklahoma’s industry was trending downward. Indeed, while Oklahoma’s power boiler and heat exchanger manufacturing industry’s employees declined, China’s exports as a share of the global exports rose from 14.4 percent to 15.7 percent, indicating that Chinese companies could be gaining Oklahoma’s market shares and influencing its trends.[337](#_edn337) In sum, Chinese exports and Oklahoma’s industry’s growth are negatively correlated, indicating that China could have some influence over Oklahoma’s industry success.
**Figure 109: United States’ and China’s shares of global exports of the power boiler and heat exchanger industry**
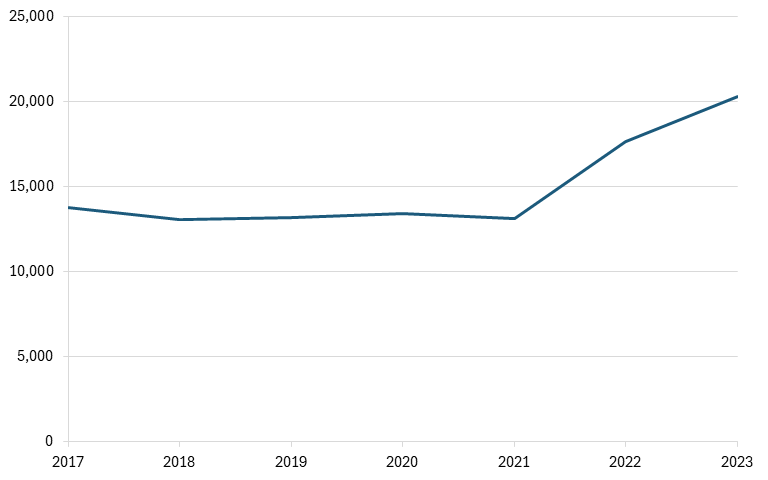
China’s power boiler and heat exchanger industry unfairly competes with other global competitors. The Chinese government provides the Chinese power boiler and heat exchanger industry with subsidies. According to a report by Operate AI, the Chinese government provides device purchase incentives of 35 percent back for high-efficiency gas boilers, thereby bolstering the industry’s revenue and competitiveness as more businesses invest in these boilers.[338](#_edn338) Corroborating this, China has also promoted boiler renewals and the elimination of older oil-fired boilers and coal-fired boilers that do not meet low emissions standards.[339](#_edn339) In addition, the Chinese government has also stated that it would provide subsidies—2.5 percent interest subsidy for two years—for renovation projects and equipment purchases for heat pump systems.[340](#_edn340) In spite of these subsidies, there is minimal information on direct subsidies to the Chinese power boiler and heat exchanger industry.
## Oregon: Semiconductor and Related Device Manufacturing (334413)
Oregon is highly specialized in semiconductor manufacturing, a cornerstone of its advanced manufacturing economy that operates in an intensely competitive global market. However, China’s rapid expansion of semiconductor manufacturing capacity, supported by extensive subsidies and powerful industrial policies, pose a growing challenge to the long-term competitiveness of Oregon’s semiconductor sector.
Oregon employs one of the largest and growing semiconductor manufacturing workforces in the country. From 2017 to 2023, employment increased from over 13,700 to over 20,000 workers.[341](#_edn341) (See figure 110.) The state is also one of the most important hubs for the semiconductor industry in the country, home to industry leaders such as Intel, whose largest and most advanced research and manufacturing facilities are located in the Portland metropolitan area, as well as smaller firms such as Microchip Technology and ON Semiconductor.[342](#_edn342) Semiconductor manufacturing is one of Oregon’s largest export industries, with exports in 2022 valued at over $14.5 billion.[343](#_edn343)
**Figure 110: Employment in the semiconductor manufacturing industry in Oregon**
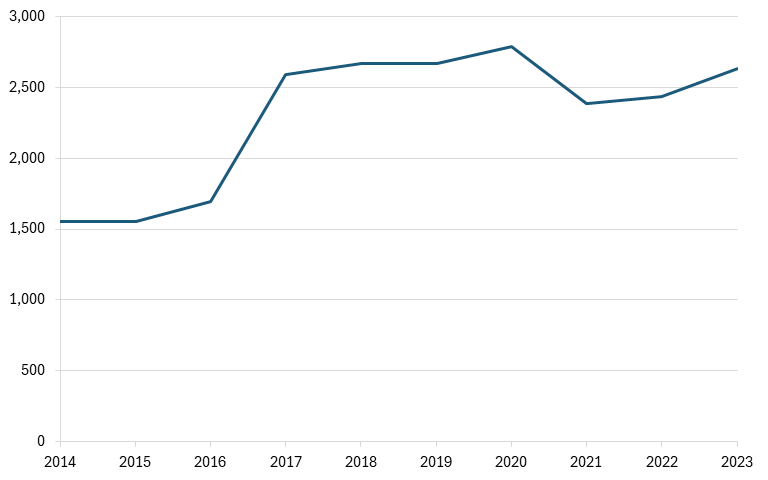
However, while U.S. firms have continued to invest heavily in domestic manufacturing, including in Oregon—supported in part by the CHIPS and Science Act—China has invested even more aggressively in its own semiconductor industry.[344](#_edn344) Through a combination of subsidies, industrial policy, and strategic investment, Chinese firms are expanding production capacity at a pace that threatens to erode U.S. market share. China plans to invest more than $150 billion in semiconductors by 2030, nearly three times the $52 billion allocated under the CHIPS Act.[[345]](#_edn345) In the first half of 2025 alone, Chinese investment reached $63.3 billion.[346](#_edn346)
China’s push for semiconductor dominance is particularly evident in legacy chip manufacturing, where state-backed firms have expanded rapidly. Between 2015 and 2023, Chinese legacy chip production capacity grew more than four times faster than global demand.[347](#_edn347) This imbalance has contributed to overcapacity, placing downward pressure on global semiconductor prices and reducing profitability for U.S. producers, including those operating in Oregon. Meanwhile, China’s share of global semiconductor manufacturing capacity has risen significantly, by 20 percentage points, while the U.S. share has declined by 8.[[348]](#_edn348) (See figure 111.)
**Figure 111: Share of global semiconductor production capacity (projected from 2025)**

Further emphasizing China’s rise, for much of the early 2000s, the United States exported far more semiconductors (HS 8541 and 8542) than did China. However, since 2009, China has overtaken the United States, with exports growing rapidly while U.S. exports have remained relatively stagnant. Between 2014 and 2024, Chinese semiconductor exports increased by 126 percent, compared with just 37 percent growth for the United States.[349](#_edn349) (See figure 112.)
For Oregon, which relies heavily on global demand for semiconductors produced by firms such as Intel, this trend is particularly concerning. Although continued investment in advanced fabrication facilities may boost U.S. exports in the future, the U.S. Commerce Department has warned that China’s expanding chip capacity could reduce utilization rates at U.S. fabs, threatening their long-term profitability.[[350]](#_edn350)
**Figure 112: Semiconductor exports**

China’s extensive subsidies allow its semiconductor firms to sell chips at significantly lower prices than U.S. competitors can—often 30 to 50 percent cheaper.[351](#_edn351) In some cases, Chinese firms have been able to sell products below production cost, enabling them to rapidly gain market share in third-country markets. As a result, U.S. exports to key markets such as Malaysia, Singapore, and Vietnam have grown far more slowly than China’s, with Chinese exports to these countries reaching nearly double those of the United States in 2024.[[352]](#_edn352) (See figure 113.) This growing price competition places pressure on Oregon-based manufacturers, which typically face higher production costs and rely on export markets to sustain growth.
**Figure 113: Semiconductor exports to Malaysia, Singapore, and Vietnam[[353]](#_edn353)**

China’s long-term ambitions in semiconductors are clearly outlined in its Made in China 2025 strategy, which aims for 70 percent self-sufficiency in semiconductor production and global leadership by 2030.[354](#_edn354) While these goals have not yet been fully realized, China’s share of legacy chip manufacturing is projected to grow substantially—from 31 percent in 2023 to 39 percent in 2027—while the U.S. share will remain comparatively small.[355](#_edn355) Additionally, China is expected to bring more new fabrication facilities online than is any other region between 2022 and 2026.[356](#_edn356)
**Figure 114: Global market share in legacy semiconductor manufacturing, 2023 vs. 2027 projection[357](#_edn357)**

China’s continued expansion in the semiconductor industry poses a direct challenge to U.S. producers. As Chinese firms replace foreign suppliers domestically and expand into international markets, U.S. semiconductor exports face increasing pressure on market share, revenue, and profitability. Persistent subsidies and overcapacity are likely to keep global prices artificially low, disadvantaging higher-cost producers.
For Oregon, where semiconductors are a fast-growing and important advanced manufacturing industry and a key source of high-wage employment, these global dynamics present a significant economic risk. Reduced global demand and increased price competition could slow industry growth, weaken job creation, and threaten the long-term vitality of one of the state’s most critical sectors.
## Pennsylvania: Other Lighting Equipment Manufacturing Industry (NAICS 335129)
A core industry in Pennsylvania is the other lighting equipment manufacturing industry, which “comprises establishments primarily engaged in manufacturing electric lighting fixtures (except residential, commercial, industrial, institutional, and vehicular electric lighting fixtures) and nonelectric lighting equipment.”[358](#_edn358) The other lighting equipment manufacturing industry companies in Pennsylvania include Spring City, Penn Global Lighting Design and Manufacturing, and Deval Corporation.[359](#_edn359) The primary products produced by these companies include portable electric lamp parts (SITC: 81380) and light-emitting diode (LED) lamps (SITC: 77878). [360](#_edn360)
Over the past 10 years (available data), the other lighting equipment manufacturing industry in Pennsylvania’s growth has expanded. Indeed, from 2014 to 2023, Pennsylvania’s industry’s employees rose 69 percent from 1,554 to 2,630 employees while the U.S. manufacturing sector’s employees rose 8 percent. As such, this indicates that Pennsylvania’s industry has far surpassed the manufacturing sector in growth and is now a larger share of the manufacturing sector. Of this overall growth, Pennsylvania’s industry’s growth is largely dependent of its increase in employees from 2016 to 2017 of 1,698 to 2,587.
**Figure 115: Employment in other lighting equipment manufacturing in Pennsylvania**
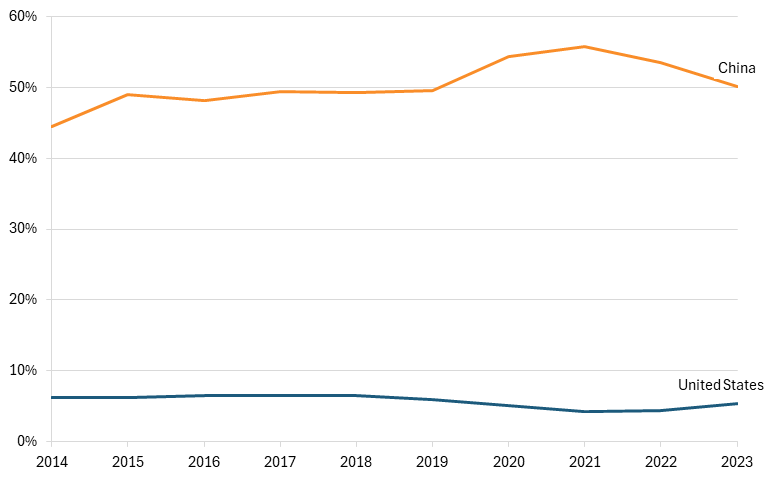
Corresponding with the time period above, from 2014 to 2023, China’s exports to the world rose while Pennsylvania’s industry was also rising. Indeed, while Pennsylvania’s industry’s employees were rising, China’s exports as a share of the global exports for this industry had the highest percentage point growth of 182 nations with available data—China’s exports rose from 44.5 percent to 50.1 percent.[361](#_edn361) Given that both Chinese exports and Pennsylvania’s industry is growing in tandem, Chinese competition is unlikely to be influencing Pennsylvania’s industry trends.
**Figure 116: United States’ and China’s shares of global exports of other lighting equipment**
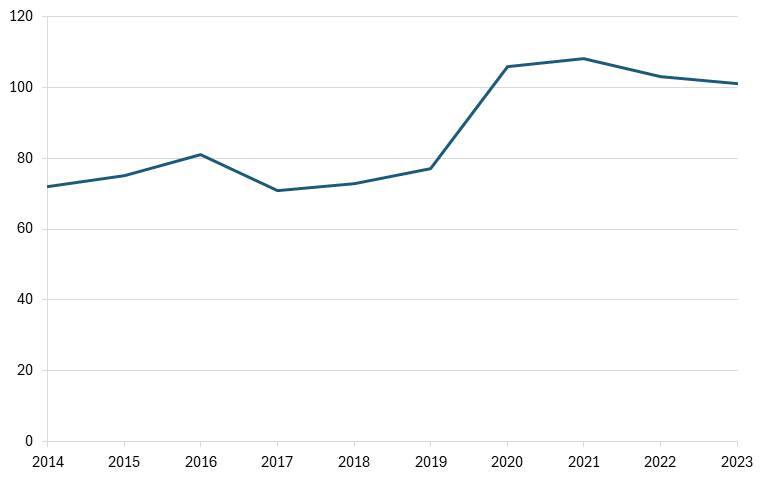
## Rhode Island: Other Metal Container Manufacturing Industry (NAICS 332439)
A core industry in Rhode Island is the other metal container manufacturing industry, which is defined as “establishments primarily engaged in manufacturing metal (light gauge) containers (except cans).”[362](#_edn362) The other metal container manufacturing companies in Rhode Island include Future Case Corp. and R.I. Container Products Inc.[363](#_edn363) The primary products produced by these companies include other aluminum containers capacity 3.8–300 liters (SITC: 69242), flask and other vessels, complete with cases (SITC: 89997), parts of vacuum flasks etc., except glass inners (SITC: 89997), and others.[364](#_edn364)
Over the past 10 years (available data), the other metal container manufacturing industry in Rhode Island has expanded. Indeed, from 2014 to 2023, Rhode Island’s industry’s employees grew 40.3 percent from 72 to 101 while the overall U.S. manufacturing sector only expanded 8 percent.[365](#_edn365) As such, this indicates that Rhode Island’s industry grew faster than the overall manufacturing sector and gained shares in the manufacturing sector during this period. When examined closer, Rhode Island’s industry growth experienced a large spurt from 2019 to 2020 when its employees rose from 77 to 106.[366](#_edn366) Though information is limited, this increase could be due to a structural change, such as a new factory. However, even if this outlier and the subsequent year were removed, Rhode Island’s industry still expanded, as it grew 6.9 percent from 2014 to 2019 while the overall manufacturing sector only grew 6 percent.[367](#_edn367) In general, Rhode Island’s industry has some periods of decline but is generally trending upward.
**Figure 117: Employment in other metal container manufacturing in Rhode Island**
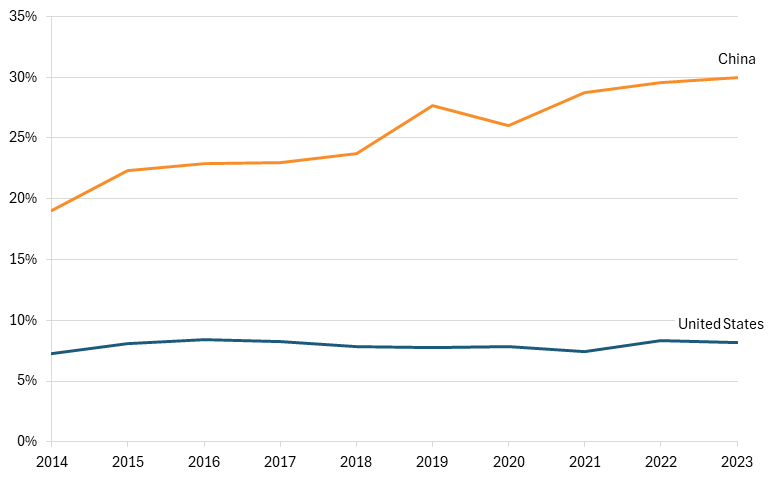
Corresponding with the time period above, from 2014 to 2023, China’s other metal container manufacturing industry exports to the world grew while Rhode Island’s industry was also expanding. Indeed, while Rhode Island’s industry’s employees expanded, China’s exports as a share of the global exports rose from 19 percent to 30 percent, indicating that Chinese competition is unlikely to have influenced Rhode Island’s industry trends, as both are growing concurrently.[368](#_edn368) Even when Rhode Island’s outlier and subsequent years (2019–2023) are removed, both Rhode Island’s industry and Chinese exports share are still growing, further corroborating that Chinese competition may not have an impact on Rhode Island’s industry trends.[369](#_edn369) More generally, Chinese competition is also unlikely to have an impact on the overall U.S. other metal container manufacturing industry. Indeed, while China’s export share have risen, U.S. export share has remained relatively stable at about 7 to 8 percent, indicating that Chinese export shares is not negatively correlated with U.S. export shares.[370](#_edn370)
**Figure 118: United States’ and China’s shares of global exports of the other metal container manufacturing industry**
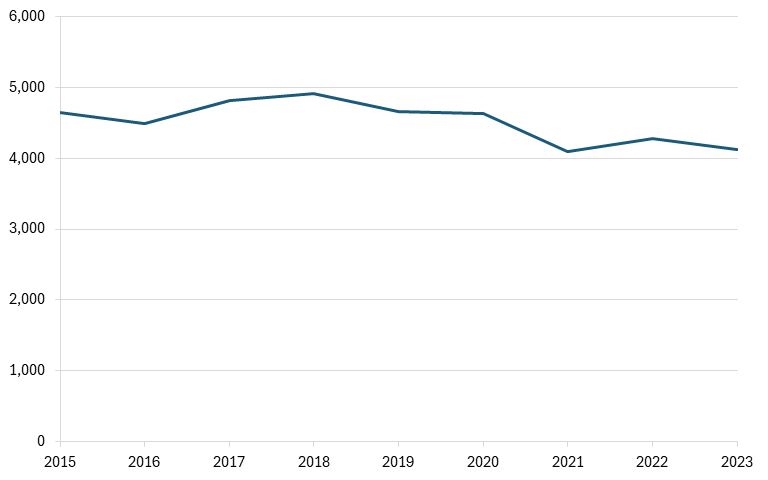
## South Carolina: Ball and Roller Bearing Manufacturing Industry (NAICS 332991)
A core industry in South Carolina is the ball and roller bearing manufacturing industry, which “comprises establishments primarily engaged in manufacturing ball and roller bearings of all materials.”[371](#_edn371) The ball and roller bearing manufacturing industry companies in South Carolina included Fintec, Inc., Simatec Inc., and Wheeler Industries Inc.[372](#_edn372) The primary products produced by these companies include ball bearings with integral shafts (SITC: 74610), spherical roller bearings, single row (SITC: 74630), tapered rollers for roller bearings (SITC: 74691), and others.[373](#_edn373)
Over the past nine years (available data), the ball and roller bearing manufacturing industry in South Carolina has contracted. Indeed, from 2015 to 2023, South Carolina’s industry’s employees generally trended downward, declining 11 percent from 4,643 to 4,123 employees. Meanwhile, U.S. manufacturing sector’s employees increased 6.3 percent. As such, this indicates that South Carolina’s industry has not kept up with the overall manufacturing sector’s growth and is now a smaller share of the manufacturing sector than before.
**Figure 119: Employment in ball and roller bearing manufacturing industry in South Carolina**
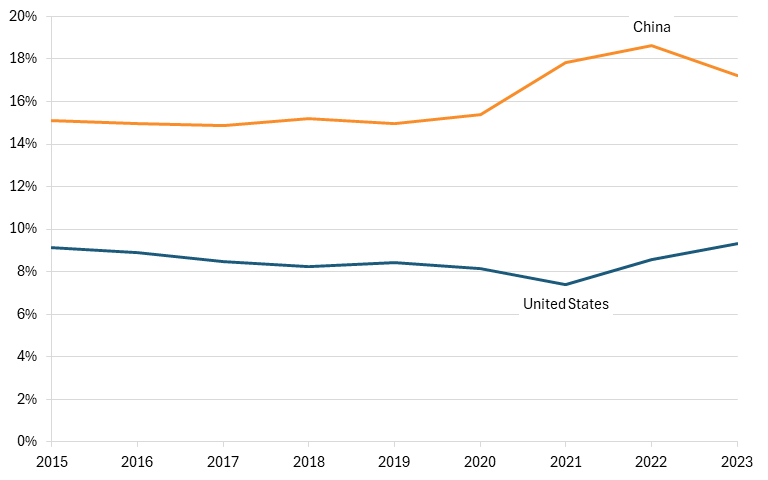
Corresponding with the time period above, from 2015 to 2023, China’s exports to the world rose while South Carolina’s industry contracted. Indeed, while South Carolina’s employees contracted, China’s exports share had the highest percentage point growth of 178 nations with available data—China’s exports share rose from 15.1 percent to 17.2 percent. As such, this indicates that Chinese exports are negatively correlated with South Carolina’s industry’s growth and thus, Chinese competition could influence South Carolina’s industry’s success.
**Figure 120: United States’ and China’s shares of global exports of the ball and roller bearing manufacturing industry**
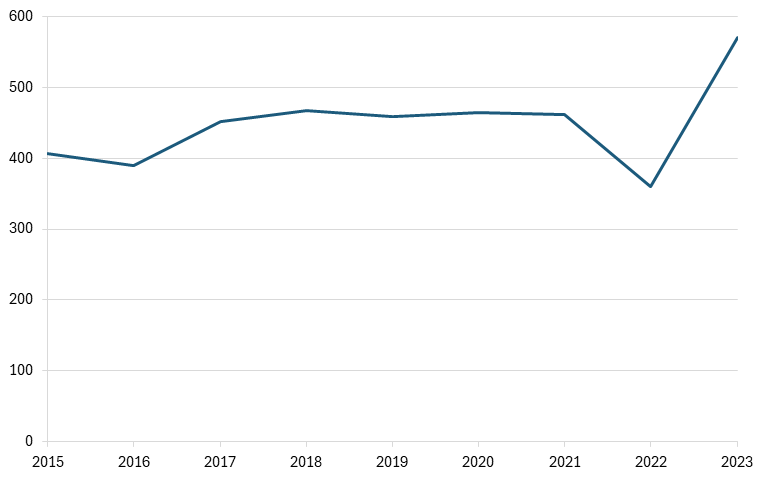
China’s ball and roller bearing industry unfairly competes with other global competitors. Although the Chinese government does not provide the industry with direct subsidies, it likely does provide assistance in bolstering the industry. Indeed, according to a report by the U.S. International Trade Commission (USITC), “Domestic Producers claim that China increased its already large production capacity significantly throughout the period of review, consistent with Chinese government policies promoting the TRBs sector.”[374](#_edn374) In China’s National 12th Five-Year Development Plan, the Chinese government targeted an annual growth rate of 13.3 percent for the industry.[375](#_edn375) Moreover, the USITC report also finds that the Chinese tapered roller bearing industry negatively impacts its U.S. counterparts by underselling its products at a lower price than U.S. companies do. In the most recent antidumping review, the USITC asserted that “if the order were revoked, significant volumes of subject imports would likely undersell the domestic like product, as they did in the original investigations and prior reviews, to gain market share.”[376](#_edn376) As such, China’s ball and roller bearing industry has received assistance from the Chinese government to bolster itself, undersell U.S. competitors, and unfairly gain market shares from those competitors.
## South Dakota: Capacitor, Resistor, Coil, Transformer, and Other Inductor Manufacturing (NAICS 334416)
A core industry in South Dakota is the capacitor, resistor, coil, transformer, and other inductor manufacturing industry, which “comprises establishments primarily engaged in one or more of the following: (1) manufacturing electronic fixed and variable capacitors and condensers; (2) manufacturing electronic resistors, such as fixed and variable resistors, resistor networks, thermistors, and varistors; and (3) manufacturing electronic inductors, such as coils and transformers.”[377](#_edn377) The capacitor, resistor, coil, transformer, and other inductor manufacturing companies in South Dakota include Minntronix, Inc. and Newava Technology.[378](#_edn378) The primary products produced by these companies are electric heating resistors (SITC: 77588), fixed capacitors, tantalum electrolytic, metal case (SITC: 77862), electrical capacitor parts (SITC: 77869), and others.[379](#_edn379)
Over the past nine years (available data), the capacitor, resistor, coil, transformer, and other inductor manufacturing industry in South Dakota has expanded. Indeed, from 2015 to 2023, South Dakota’s industry’s employees grew 40 percent from 407 to 570 while U.S. manufacturing sector’s employees rose 6.3 percent. As such, this indicates that South Dakota’s industry has surpassed the overall manufacturing sector’s expansion and is now a larger share of the sector. When examined closer, South Dakota’s industry’s growth has outliers. Indeed, from 2021 to 2023, South Dakota’s industry saw a large decline of 22 percent (U.S. manufacturing grew 4.1 percent) and then a sudden growth of 58 percent (U.S. manufacturing grew 1.2 percent). When removing these outliers, South Dakota’s industry only grew 13 percent while U.S. manufacturing grew 2.5 percent. Although data is limited, the sudden rise in employees from 2022 to 2023 could have been a combination of recovering from the pandemic and structural change, such as a new factory. Indeed, though not the cause of the spike, Presidio Components, a leader in the manufacturing of ceramic capacitor, selected Sioux Falls to expand to in 2023.[380](#_edn380)
**Figure 121: Employment in capacitor, resistor, coil, transformer, and other inductor manufacturing in South Dakota**
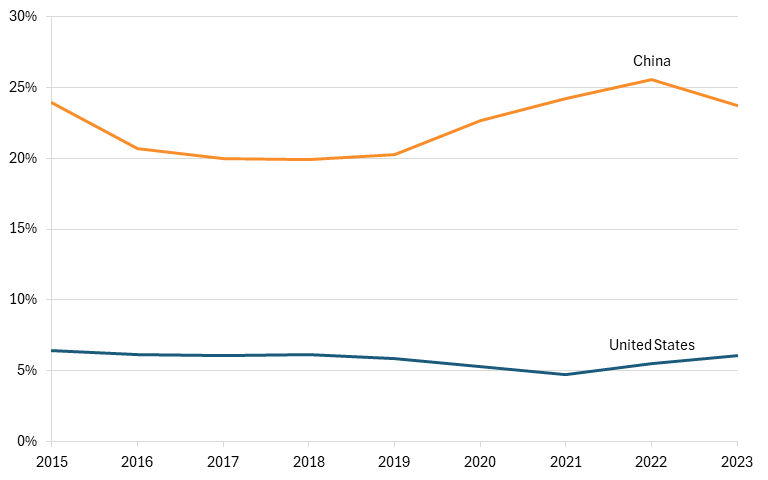
Corresponding with the time period above, from 2015 to 2023, China’s exports to the world remained relatively stagnant while South Dakota’s industry was expanding. Indeed, while South Dakota’s industry was expanding, Chinese export shares remained stagnant at about 24 percent, indicating that China’s industry is unlikely to have influenced South Dakota’s industry. Moreover, from 2019 to 2023, when Chinese export shares grew, South Dakota’s industry saw some of its highest growth, further indicating that Chinese competition is unlikely to influence South Dakota’s industry. Even when South Dakota’s outlier years are removed, Chinese export shares continued to remain stagnant at about 24 percent while South Dakota’s industry grew. In sum, Chinese competition does not seem to have an impact on South Dakota’s industry trends.
**Figure 122: United States’ and China’s shares of global exports of the capacitor, resistor, coil, transformer, and other inductor manufacturing industry**
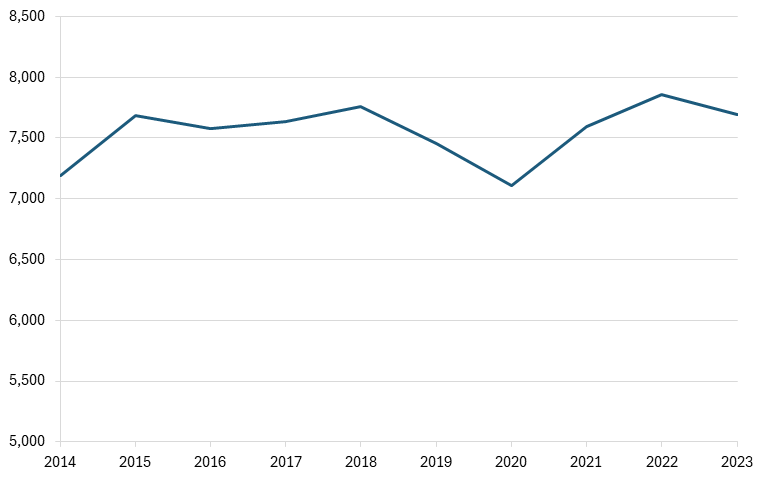
## Tennessee: Major Household Appliance Manufacturing Industry (NAICS 335220)
A core industry in Tennessee is the major household appliance manufacturing industry, defined as “establishments primarily engaged in manufacturing household-type cooking appliances, household-type laundry equipment, household-type refrigerators, upright and chest freezers, and other electrical and nonelectrical major household-type appliances, such as dishwashers, water heaters, and garbage disposal units.”[381](#_edn381) The major household appliance manufacturing companies in Tennessee include Mills Products Inc. and Zip Products, Inc.[382](#_edn382) The primary products produced by these companies include refrigerators, household, absorption type, electrical (SITC: 77521), instantaneous gas water heaters (SITC: 74181), solar water heaters (SITC: 74182), and others.[383](#_edn383)
Over the past 10 years (available data), the major household appliance manufacturing industry in Tennessee has contracted. Indeed, from 2014 to 2023, Tennessee’s industry’s employees grew 7 percent from 7,191 to 7,691 workers while U.S. manufacturing sector’s employees rose 8 percent. As such, this indicates that Tennessee’s industry has not kept up with the manufacturing sector’s growth and was thus a smaller portion of the overall manufacturing sector in 2023 compared with 2014.
**Figure 123: Employment in major household appliance manufacturing in Tennessee**
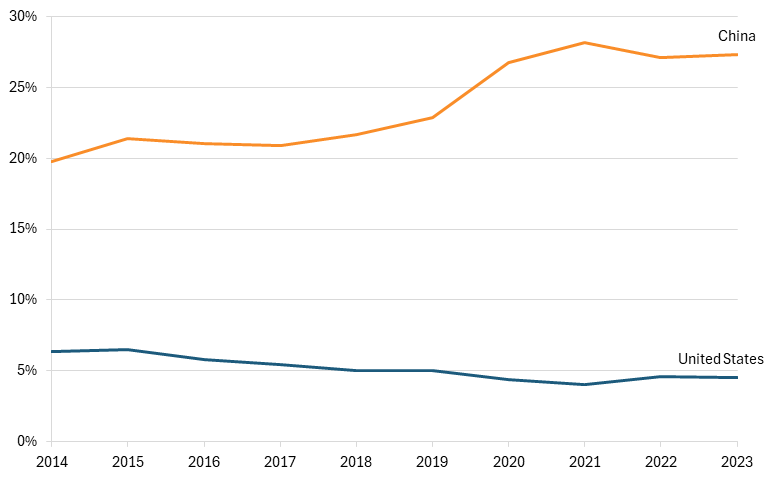
Corresponding with the time period above, from 2014 to 2023, China’s exports to the world rose while Tennessee’s industry experienced a slight contraction. Indeed, while Tennessee’s employees contracted, China’s exports as a share of the global exports also rose from 19.8 percent to 27.3 percent, indicating that Chinese competition could have impacted the Tennessee’s industry’s trends.[384](#_edn384) In sum, Chinese exports in the industry are negatively correlated with Tennessee’s industry growth and thus could have an impact on its future success.
**Figure 124: United States’ and China’s shares of global exports of major household appliances**
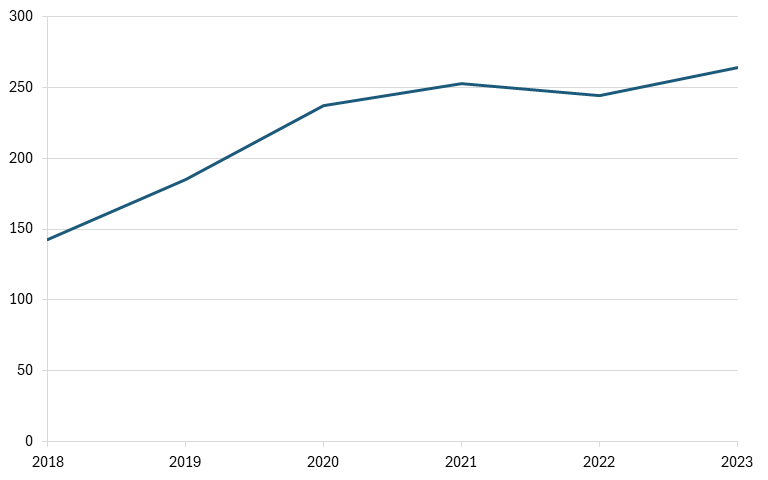
China’s major household appliance manufacturing industry unfairly competes with its global competitors. Indeed, the Chinese government has a history of providing demand-side subsidies that bolster the industry. For instance, in 2009 the Chinese government launched the “Home Appliance to Rural Areas” program that exempted 13 percent of the value-added tax for select room air conditioner models that were sold to rural households as a way to bolster domestic sales in household appliances and counter the country’s decline in exports.[385](#_edn385) Then in 2012, the Chinese government launched a subsidy program with a budget of $3.8 billion for five household appliances: room air conditioners, refrigerators, TVs, washing machines, and water heaters.[386](#_edn386) At the local level, Beijing’s city government also launched a three-year subsidy program for room air conditioners, TVs, and refrigerators that would provide up to $118 per appliance unit.[387](#_edn387) More recently, in 2024, the Chinese government launched a subsidy program worth up to 15 percent of a product’s sales price for consumers purchasing energy and water-efficient household appliances.[388](#_edn388) As such, Tennessee’s industry may not have declined, but these subsidies likely bolstered the Chinese household appliances industry, leading to its ability to become more competitive and stifle the growth of Tennessee’s industry.
## Texas: Electric Lamp Bulb and Part Manufacturing Industry (NAICS: 335110)
A core industry in Texas is the electric lamp bulb and part manufacturing industry (NAICS: 335110), defined as “establishments primarily engaged in manufacturing electric light bulbs and tubes, and parts and components (except glass blanks for electric light bulbs).”[389](#_edn389) The electric lamp bulb and part manufacturing companies in Texas include Luminator Holding L.P., Lighting Science Group Corp., and Light Process Co.[390](#_edn390) The primary products produced by these companies include tungsten halogen filament lamps designed for a voltage not exceeding 100V (SITC: 77821), discharge lamps, (ex ultraviolet), fluorescent, hot cathode (SITC: 77822), arc lamps (SITC: 77824), and others.[391](#_edn391)
Over the past six years (available data), the electric lamp bulb and part manufacturing industry in Texas has expanded. Indeed, Texas’s employees in the industry rose a hefty 85 percent from 143 in 2018 to 264 in 2023 while the overall U.S. manufacturing sector rose only 8 percent.[392](#_edn392) This indicates that Texas’s electric lamp bulb industry grew 10 times faster than did the overall U.S. sector.[393](#_edn393) When examined more closely, Texas’s industry saw a very slight decline from 2021 to 2022, but has generally trended upward.[394](#_edn394)
**Figure 125: Employment in electric lamp bulb and part manufacturing in Texas**
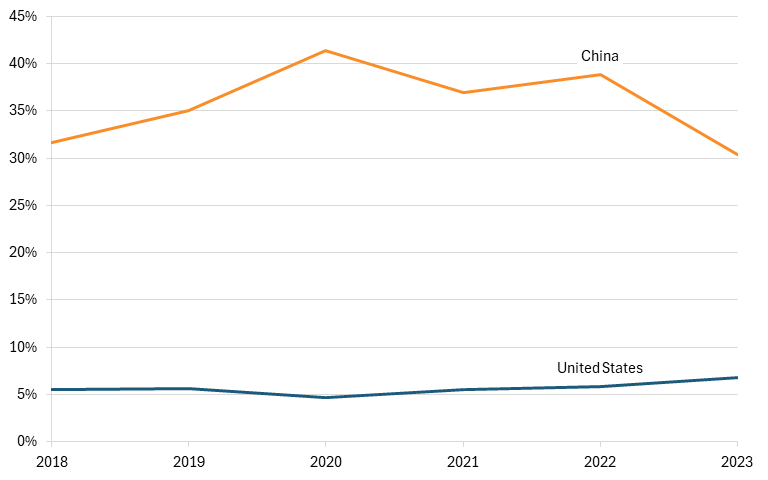
Corresponding with the time period above, from 2018 to 2023, China’s exports to the world declined while Texas’s electric lamp bulb and parts manufacturing was expanding. Indeed, while Texas’ industry’s employees expanded, China’s exports as a share of the global exports declined slightly from 31.6 percent to 30.4 percent, indicating that Chinese competition could have some impact on Texas’s industry.[395](#_edn395) However, when examined closer, when Chinese exports rose from 2018 to 2020, Texas’s industry also rose.[396](#_edn396) And when Chinese exports declined from 2020 to 2023, Texas’s industry continued to rise.[397](#_edn397) As such, Chinese competition may not have any influence over Texas’s industry, as Chinese exports change in both directions regardless of Texas’s rise.
**Figure 126: United States’ and China’s shares of global exports of the electric lamp bulb and part manufacturing industry**
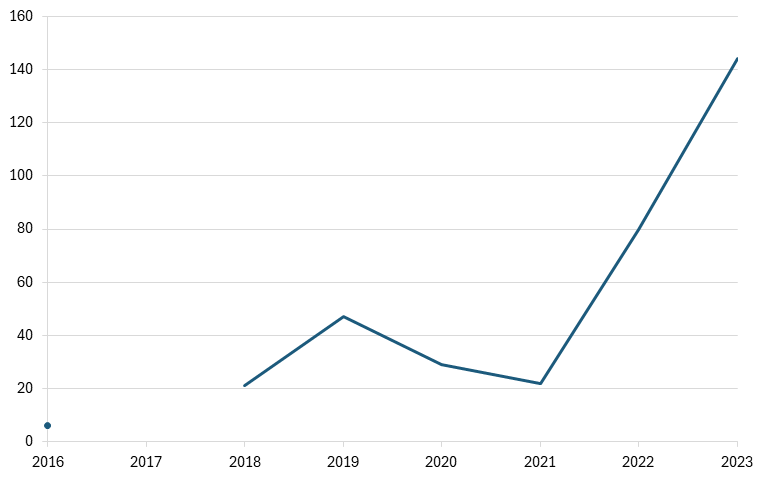
## Utah: Photographic and Photocopying Equipment Manufacturing (NAICS 333316)
A core industry in Utah is the photographic and photocopying equipment manufacturing industry, which “comprises establishments primarily engaged in manufacturing photographic and photocopying equipment, such as cameras (except television and video), projectors, film developing equipment, photocopying equipment, and microfilm equipment.”[398](#_edn398) The photographic and photocopying equipment manufacturing companies in Utah include Royce Imagining Technologies and Cordin Scientific Imaging.[399](#_edn399) The primary products produced by these companies include thermocopying apparatus (SITC: 75196), instant print cameras (SITC: 88111), and projectors for film over 16 mm in width (SITC: 88122).[400](#_edn400)
Over the past eight years (available data), the photographic and photocopying equipment manufacturing industry in Utah has expanded. Indeed, from 2016 to 2023, Utah’s industry grew 24 times (or 2,400 percent) from 6 to 144 employees while the U.S. manufacturing sector’s employees only grew 6.4 percent. As such, this indicates that Utah’s industry has far surpassed U.S. manufacturing sector’s growth and expanded its share of the overall manufacturing sector. However, it should be noted that Utah’s industry’s high growth came from 2021 to 2023 when the industry rose 555 percent from 22 employees to 144 employees. Without these three outlier years, the industry would have still significantly surpassed the U.S. manufacturing sector’s growth (1 percent growth) but at the lower rate of 267 percent. Although information is limited, the sudden growth could have been a combination of recovering from the pandemic and structural changes (i.e., a new factory) in the state’s industry.
**Figure 127: Employment in photographic and photocopying equipment manufacturing in Utah (no data for 2017)**
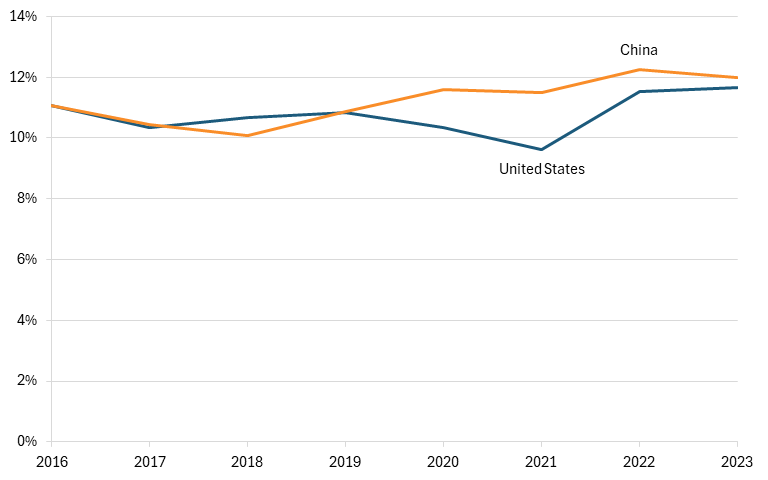
Corresponding with the time period above, from 2016 to 2023, China’s exports to the world rose while Utah’s industry was also rising. Indeed, while Utah’s industry’s employees expanded, China’s exports as a share of the global exports also rose slightly from 11.1 percent to 12 percent, indicating that Chinese competition is unlikely to have impacted Utah’s industry trends, as both are positively correlated.[401](#_edn401) Corroborating this, while Chinese exports as a share of the total world exports rose, U.S. exports in the industry also rose 11.1 percent to 11.7 percent, showing that Chinese companies were unlikely to be taking market shares away from Utah and the United States.[402](#_edn402)
**Figure 128: United States’ and China’s shares of global exports of photographic and photocopying equipment**
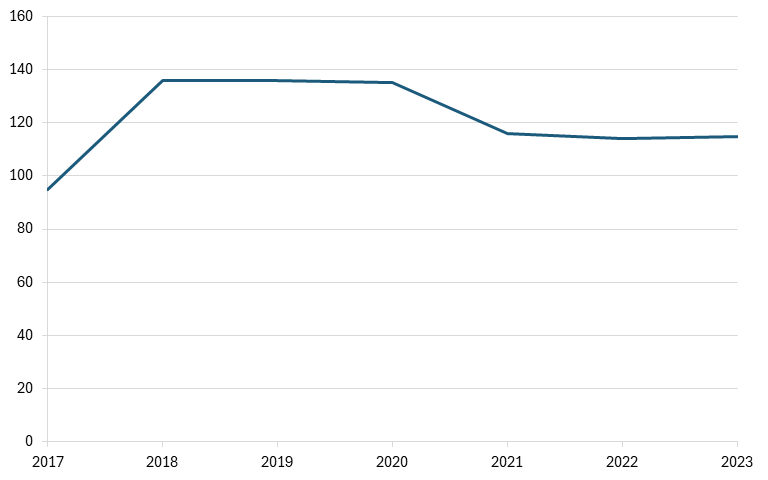
## Vermont: Scale and Balance Manufacturing Industry (NAICS 333997)
A core industry in Vermont is the scale and balance manufacturing industry, which “comprises establishments primarily engaged in manufacturing scales and balances, including those used in laboratories.”[403](#_edn403) The scale and balance manufacturing industry companies in Vermont include Naepac and Logical Machines.[404](#_edn404) The primary products produced by these companies include scales for continuous weighing of goods on conveyors (SITC: 74531), digital weight indicators (SITC: 74539), weighing machines, nesoi (SITC: 74531), and others.[405](#_edn405)
Over the past seven years (available data), the scale and balance manufacturing industry in Vermont has expanded. Indeed, from 2017 to 2023, Vermont’s industry’s employees grew 21 percent from 95 to 115 workers while U.S. manufacturing sector’s employees rose only 5.2 percent. As such, this indicates that Vermont’s industry has surpassed the U.S. manufacturing sector’s growth and is a larger share of the sector than in 2017. When examined more closely, Vermont’s industry has had periods of growth (2017–2020) and decline (2020–2023) but has generally trended upward.
**Figure 129: Employment in scale and balance manufacturing in Vermont**
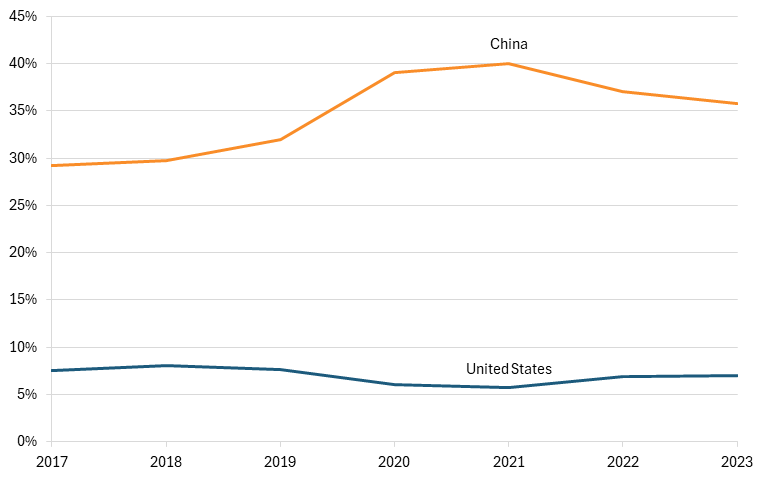
Corresponding with the time period above, from 2017 to 2023, China’s exports to the world in the scale and balance manufacturing industry grew while Vermont’s industry also expanded. Indeed, while Vermont’s industry’s employees grew, China’s exports as a share of the global exports experienced the highest percentage point growth of 178 nations with available data, from 29.3 percent to 35.8 percent. As such, this indicates that Chinese competition is unlikely to have an impact on Vermont’s industry trends, as both Chinese exports and Vermont’s industry are positively correlated. Further corroborating this, as Vermont’s industry expanded from 2017 to 2020—42 percent compared with U.S. manufacturing’s 2.4 percent—Chinese export share also expanded, from 29.3 percent to 39.1 percent. And when Vermont’s industry trended downward (-15 percent vs. U.S. manufacturing’s 2.8 percent growth) afterward, Chinese exports also trended downward from 39.1 percent to 35.8 percent. In sum, Chinese competition is unlikely to have influenced Vermont’s industry trends.
**Figure 130: United States’ and China’s shares of global exports of the scale and balance manufacturing industry**
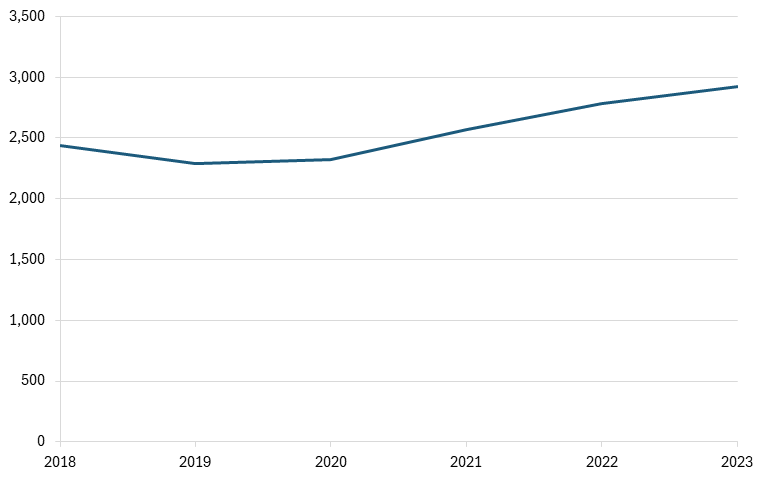
## Virginia: Power-Driven Handtool Manufacturing Industry (NAICS 333991)
A core industry in Virginia is the power-driven hand tool manufacturing industry, defined as “establishments primarily engaged in manufacturing power-driven (e.g., battery, corded, pneumatic) handtools, such as drills, screw guns, circular saws, chain saws, staplers, and nailers.”[406](#_edn406) The power-driven hand tool manufacturing companies in Virginia include Amthor International Inc., Solution Matrix Inc., and Thomas Systems Inc.[407](#_edn407) The primary products produced by these companies include powder-actuated hand tools and parts, base metal (SITC: 69546), sand blasting machines (SITC: 74563), electric hand drills, rotary, battery powered (SITC: 77841), and others.[408](#_edn408)
Over the past six years (available data), the power-driven hand tool manufacturing industry in Virginia has expanded. Indeed, from 2018 to 2023, Virginia’s industry’s employees grew 20 percent from 2,439 to 2,925 employees while U.S. manufacturing sector’s employees grew only 3.5 percent. As such, this indicates that Virginia’s industry’s growth has surpassed the overall manufacturing sector and therefore grown to be a higher share of the manufacturing sector than in 2018.
**Figure 131: Employment in power-driven hand tool manufacturing in Virginia**
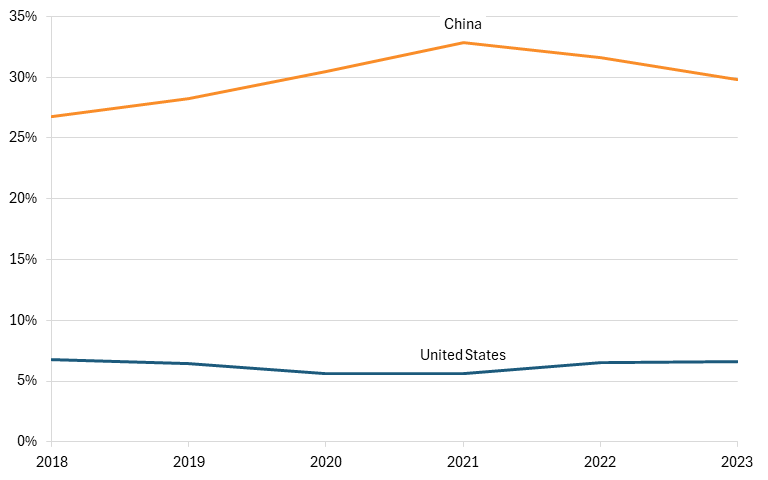
Corresponding with the time period above, from 2018 to 2023, China’s exports to the world rose while Virginia’s power-driven hand tool manufacturing industry was also expanding. Indeed, while Virginia’s industry’s employees rose, China’s exports as a share of the global exports also rose from 26.8 percent to 29.8 percent, indicating that Chinese competition is unlikely to have influenced Virginia’s industry trends.[409](#_edn409) Moreover, while Chinese exports as a share of global exports also grew, U.S. power-driven hand tool manufacturing industry’s exports remained relatively stable at about 6 to 7 percent, further indicating that Chinese competition is unlikely to have an impact on its U.S. counterparts.
**Figure 132: United States’ and China’s shares of global exports of power-driven hand tools**
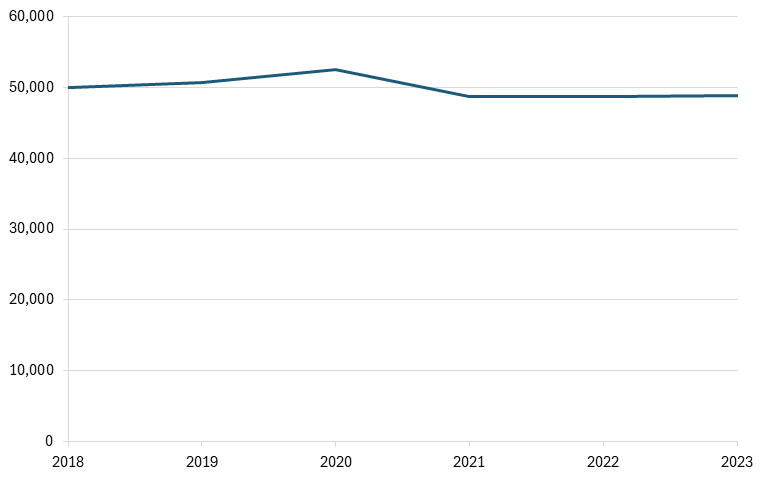
## Washington: Aircraft Manufacturing (NAICS 336411)
A core industry in Washington is the aircraft manufacturing industry (NAICS: 336411), defined as “establishments primarily engaged in one or more of the following: (1) manufacturing or assembling complete aircraft; (2) developing and making aircraft prototypes; (3) aircraft conversion (i.e., major modifications to systems); and (4) complete aircraft overhaul and rebuilding (i.e., periodic restoration of aircraft to original design specifications).”[410](#_edn410) The aircraft manufacturing companies in Washington include Aerospace Defense, Inc., Jetoptera, Inc., and Northwest Dynamics, Inc.[411](#_edn411) Historically, the Boeing Company, the United States’ major aircraft manufacturer, was also headquartered in Washington, from its founding in 1916 until its move to Virginia in 2023. The primary products produced by these companies include hang gliders (SITC: 79284), airplanes and other aircraft, of an unladen weight not exceeding 450 kg (SITC: 79220), unmanned aircraft designed for the carriage of passengers (SITC: 79240), and others.[412](#_edn412)
Over the past six years (available data), the aircraft manufacturing industry in Washington has contracted. Indeed, from 2018 to 2023, Washington’s industry’s employees declined 2.2 percent from 49,923 to 48,843 while U.S. manufacturing sector’s employees grew 3.5 percent.[413](#_edn413) As such, this indicates that Washington’s industry’s growth has fallen below that of the overall manufacturing sector and has therefore shrunk to be a smaller share of the manufacturing sector than in 2018.
**Figure 133: Employment in the aircraft manufacturing industry in Washington**
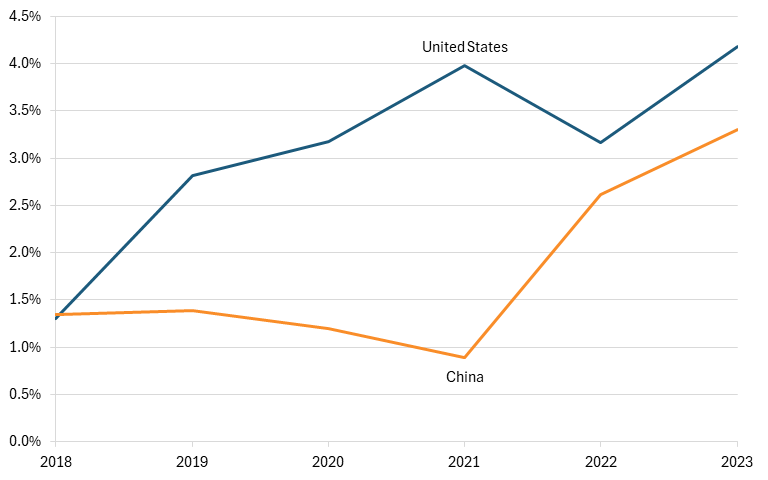
Corresponding with the time period above, from 2018 to 2023, China’s exports to the world rose while Washington’s aircraft manufacturing industry was contracting. Indeed, while Washington’s employees contracted, China’s exports as a share of the global exports rose from 1.3 percent to 3.3 percent.[414](#_edn414) From this perspective, China may have played a role in the contraction of Washington’s aircraft manufacturing industry. However, when examined closer, from 2019 to 2021, Washington’s employees contracted while Chinese exports share also declined from 1.3 percent to 0.9 percent.[415](#_edn415) And from 2021 to 2023, when Washington’s employees remained relatively stagnant, China’s export share rose from 0.9 percent to 3.3 percent.[416](#_edn416) As such, this correlation suggests that competition from Chinese aircraft manufacturers may not have any influence over Washington’s industry trends.
**Figure 134: United States’ and China’s shares of global exports of the aircraft manufacturing industry**
Despite not having much impact on Washington’s aircraft manufacturing industry, China’s main aircraft manufacturer COMAC does not compete fairly with its global competitors. The company is a state-owned enterprise that regularly receives subsidies from the Chinese government. Indeed, in 2025, COMAC received $6.2 billion in capital injections from eight state-owned shareholders to support the production of C919 aircraft.[417](#_edn417) As a result, COMAC’s capital increased to $13.8 billion from $7.4 billion.[418](#_edn418) Historically, COMAC has also received other grants and benefits from the Chinese government to bolster the industry and its exports. A report by the Center for Strategic and International Studies concludes that COMAC received between $49 billion and $72 billion in state-related support through 2020, which has helped it build and sell 148 planes.[419](#_edn419) As a result, COMAC’s global competitors Boeing and Airbus have had to put off the delivery of more than 100 planes to Chinese airlines.[420](#_edn420) In sum, COMAC’s receipt of state support has led to unfair competition with its global competitors Boeing and Airbus.
## West Virginia: Mining Machinery and Equipment Manufacturing Industry (NAICS 333131)
A core industry in West Virginia is the mining machinery and equipment manufacturing industry, defined as “establishments primarily engaged in (1) manufacturing underground mining machinery and equipment, such as coal breakers, mining cars, core drills, coal cutters, and rock drills, and (2) manufacturing mineral beneficiating machinery and equipment used in surface or underground mines.”[421](#_edn421) The mining machinery and equipment manufacturing companies in West Virginia include Cogar Manufacturing, FX Mineral Processing Inc, and Petitto Mine Equipment.[422](#_edn422) The primary products produced by these companies are coal or rock cutters and tunneling machinery, self-propelled (SITC: 72335), boring or sinking machinery, self-propelled (SITC: 72337), parts of coal or rock cutters, and tunneling machinery (SITC: 72399), and others.[423](#_edn423)
Over the past 10 years (available data), the mining machinery and equipment manufacturing industry in West Virginia has contracted. Indeed, from 2014 to 2023, West Virginia’s industry’s employees declined 40 percent while U.S. manufacturing sector’s employees grew 8 percent. As such, this indicates that West Virginia’s industry did not keep up with the manufacturing sector’s growth and has therefore reduced its share of the overall manufacturing sector compared with 2014. When examined closer, West Virginia’s industry has experienced periods of growth and decline, but has generally trended downward.
**Figure 135: Employment in mining machinery and equipment manufacturing in West Virginia**
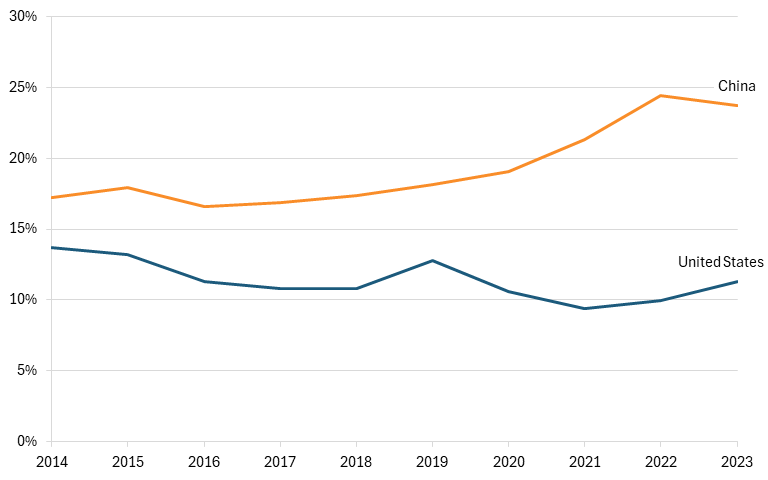
Corresponding with the time period above, from 2014 to 2023, China’s exports to the world rose while West Virginia’s and the overall U.S. mining machinery and equipment manufacturing industry was contracting. Indeed, while West Virginia’s industry’s employees contracted, China’s exports as a share of the global exports had the highest percentage point growth of 184 nations with available data.[424](#_edn424) Accordingly, China’s exports as a share of global exports rose 6.5 percent from 17.3 percent to 23.7 percent.[425](#_edn425) In other words, Chinese firms could have influenced West Virginia’s industry decline. Further corroborating this, while Chinese export shares rose, the overall U.S. mining machinery exports declined from 13.7 percent to 11.3 percent, indicating that Chinese competition could have an impact on its U.S. competitors. However, in the short run, Chinese competition likely does not have an impact on West Virginia’s industry, as Chinese exports have seen a relatively smooth growth despite West Virginia’s industry going through periods of growth and decline.
**Figure 136: United States’ and China’s shares of global exports of mining machinery and equipment**
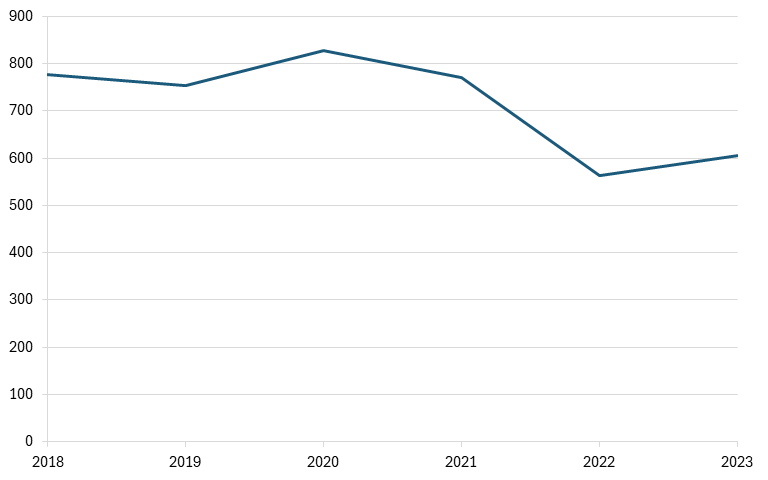
China’s mining machinery and equipment manufacturing industry unfairly competes with its global competitors. The Chinese government has historically provided subsidies to upstream industries that rely on mining machinery that have bolstered not only the upstream industries’ competitiveness but also the demand and competitiveness of the mining machinery industry as well. Indeed, a report by the International Institute for Sustainable Development estimates that the Chinese government provided about $5.8 billion in government support and between $570 million and $5.8 billion in credit support to the coal production industry, which relies on mining machinery to thrive.[[426]](#_edn426) Moreover, China provided $9 billion to $10 billion in government support from 2010 to 2019 to rare earth companies, which also rely on mining machinery.[[427]](#_edn427) As such, this generous subsidy to the coal production industry has likely led to greater demand for mining machinery, thereby bolstering the competitiveness of China’s mining machinery industry.
Moreover, the Chinese government has also provided direct support to its mining machinery industry. For instance, in 2019, the Chinese government provided Zhengzhou Coal Mining Machinery Group Co. Ltd. with $23 billion in government subsidies.[428](#_edn428) A report on the mining machinery industry in China also finds that the Chinese government has offered subsidies and incentives for mining machinery companies investing in R&D initiatives.[429](#_edn429) Finally, the Chinese government has also bolstered its mining machinery industry with demand-side subsidies. Indeed, the Chinese government has provided subsidies and tax incentives for mining machinery equipment upgrades, covering 10 to 20 percent of capital expenditures for qualifying projects.[430](#_edn430) As such, the Chinese government has unfairly bolstered the competitiveness of its mining machinery industry and unfairly taken away market shares from West Virginia’s industry.
## Wisconsin: Scale and Balance Manufacturing Industry (NAICS 333997)
A core industry in Wisconsin is the scale and balance manufacturing industry, which “comprises establishments primarily engaged in manufacturing scales and balances, including those used in laboratories.”[431](#_edn431) The scale and balance manufacturing companies in Wisconsin include Rice Lake Weighing Systems Inc., Badger Scale Inc., and Digit-Star Holdings Inc.[432](#_edn432) The primary products produced by these companies include scales for continuous weighing of goods on conveyors (SITC: 74531), digital weight indicators (SITC: 74539), weighing machines, nesoi (SITC: 74531), and others.[433](#_edn433)
Over the past six years (available data), the scale and balance manufacturing industry in Wisconsin has declined slightly. Indeed, from 2018 to 2023, Wisconsin’s industry’s employees declined 22 percent from 778 to 605 employees while U.S. manufacturing sector’s employees grew 3.5 percent. As such, this indicates that Wisconsin’s industry has not kept up with the manufacturing sector’s growth and therefore reduced its share of the manufacturing sector since 2018. The sector saw its largest decline from 2021 to 2022 with employees dropping from 771 to 564.
**Figure 137: Employment in scale and balance manufacturing in Wisconsin**
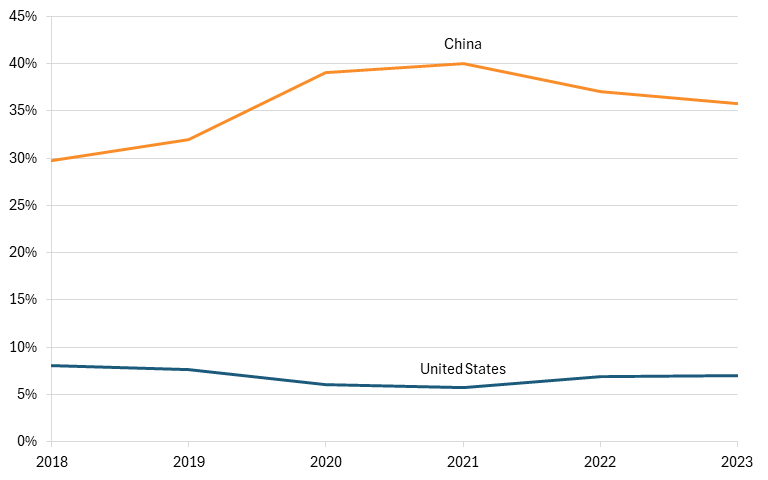
Corresponding with the time period above, from 2018 to 2023, China’s exports to the world rose while Wisconsin’s industry was contracting. Indeed, while Wisconsin’s scale and balance manufacturing employees declined, China’s exports as a share of the global exports experienced the highest percentage point growth of 178 nations with available data. Its exports rose 6.6 percent from 29.8 percent to 35.8 percent, indicating that Chinese competition could have influenced Wisconsin’s industry’s decline.[434](#_edn434) Corroborating this, Chinese competition could have played a role in the overall U.S. scale and balance manufacturing industry, as U.S. exports share in the industry declined while Chinese exports share rose, and vice versa. From 2018 to 2021, while the U.S. industry’s exports share declined from 8 percent to its lowest point of 5.7 percent, Chinese exports rose from 29.8 percent to their highest point of 40 percent.[435](#_edn435) In contrast, from 2021 to 2023, when Chinese exports share declined from 40 percent to 35.8 percent, U.S. exports share rose from 5.7 percent to 7.1 percent.[436](#_edn436) As such, Chinese competition in the scale and balance manufacturing industry could have some influence on Wisconsin and the overall U.S. scale and balance manufacturing industry’s growth.
**Figure 138: United States’ and China’s shares of global exports of the scale and balance manufacturing industry**
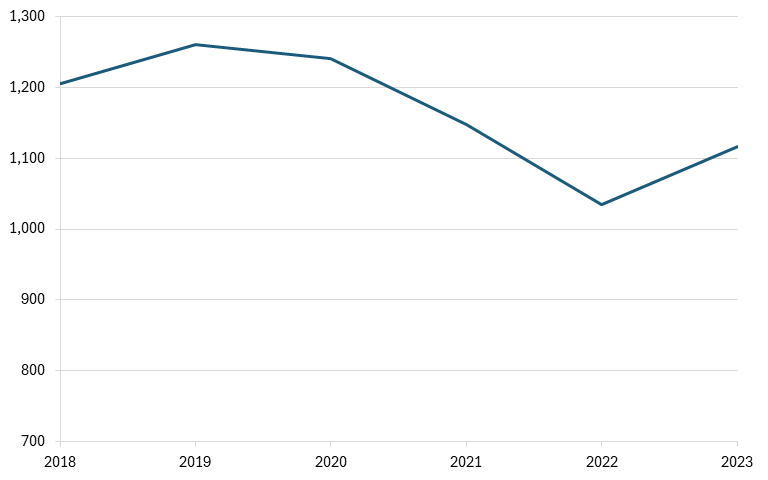
## Wyoming: Other Basic Inorganic Chemical Manufacturing Industry (NAICS 325180)
A core industry in Wyoming is the other basic inorganic chemical manufacturing industry, which is defined as “establishments primarily engaged in manufacturing basic inorganic chemicals (except industrial gases and synthetic dyes and pigments).”[437](#_edn437) The other basic inorganic chemical manufacturing companies in Wyoming include Imerys Perlite USA, Inc., Sisecam Wyoming LLC, and Solvay Chemicals, Inc.[438](#_edn438) The primary products produced by these companies include chlorine (SITC: 52224), bromine (SITC: 52225), mercury (SITC: 52227), and others.[439](#_edn439)
Over the past six years (available data), the other basic inorganic chemical manufacturing industry in Wyoming has contracted. Indeed, from 2018 to 2023, Wyoming’s industry’s employees declined 7 percent from 1,205 to 1,117 employees while U.S. manufacturing sector’s employees grew 3.5 percent. As such, this indicates that Wyoming has not kept up with the U.S. manufacturing sector’s expansion and was therefore a smaller share of the manufacturing sector in 2023 than in 2018.
**Figure 139: Employment in other basic inorganic chemical manufacturing in Wyoming**
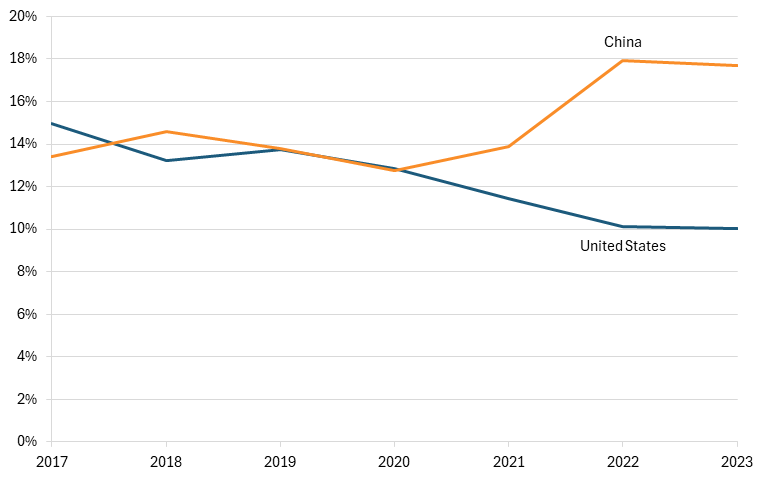
Corresponding with the time period above, from 2017 to 2023, China’s exports to the world rose while Wyoming’s industry was contracting. Indeed, while Wyoming’s industry’s sales revenue and employees contracted, China’s exports as a share of the global exports experienced the second-highest percentage point growth of 4.3 percentage points from 13.4 percent to 17.7 percent—only South Korea’s growth surpassed it at 5.7 percentage points.[440](#_edn440) As such, this indicates that Chinese competition could have impacted Wyoming’s industry trends. Corroborating this, while China’s export share rose from 13.4 percent to 17.7 percent, U.S. export share declined from 15 percent to 10 percent, indicating that Chinese competition could indeed impact its U.S. counterparts.[441](#_edn441) More generally, an ITIF report concludes that China led the world with 29.1 percent of the chemical industry value-added output in 2020, growing from less than 5 percent in 1995.[442](#_edn442) In contrast, the United States’ value-added output in 2020 was 18.3 percent, falling from 23.2 percent since 1995.[443](#_edn443) In sum, the growth of Chinese competitors is correlated with both the U.S. and Wyoming’s other basic inorganic chemical manufacturing industry’s decline and could have an impact on their future growth.
**Figure 140: United States’ and China’s shares of global exports of the other basic inorganic chemical manufacturing industry**
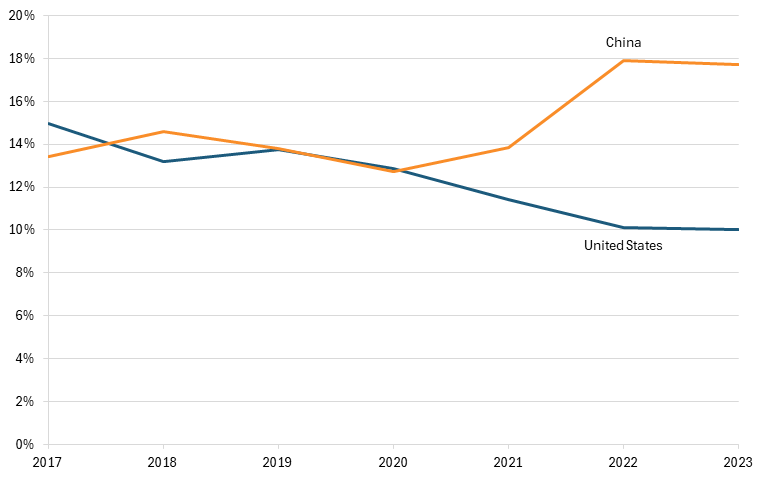
China’s chemical industry unfairly competes with other global competitors. Indeed, China has historically bolstered its chemical industry in order to compete with U.S. and other foreign counterparts. In China’s 12th Five-Year Plan (2011) the government stated that it intended to increase China’s self-sufficiency in chemicals by creating national champions through government support.[444](#_edn444) As a result, according to a report by Kearney, state-owned chemical enterprises and private Chinese businesses have received support from multiple levels of government in the form of direct subsidies, low-cost capital with favorable terms, less-stringent enforcement of regulations, and privileges to land, water, waste treatment energy, and raw material access. For instance, an ITIF report has found that the Wanhua Chemical Group received government subsidies of $91.5 million in 2022 and had accumulated $252 million from government subsidies in prior years.[445](#_edn445) Meanwhile, Rongsheng Petrochemical Co., Ltd. received governmental subsidies of $330 million in 2022.[446](#_edn446) This clear advantage provided to Chinese chemical firms undoubtedly tilts the playing field against competitors in the United States and Wyoming, potentially harming their ability to gain and maintain their market shares.
# Conclusion
The People’s Republic of China is not a normal competitor. It does not play by the rules. And it seeks global domination in most advanced and strategic industries. Absent serious policy changes in the United States and among its allies, China will likely gain that domination, with the effects felt across all 50 states.[447](#_edn447) The evidence shows a consistent pattern: state-backed Chinese firms expand rapidly, capture global market share, and place sustained pressure on U.S. producers. While the degree of impact varies by industry, the broader trend points to a gradual erosion of U.S. industrial capacity in sectors critical to economic growth and national security. Absent a more coordinated and strategic policy response, these pressures are likely to intensify, further weakening the foundations of America’s industrial competitiveness.
### Acknowledgments
This report is part of a series that has been made possible in part by generous support from the Smith Richardson Foundation. (For more, see: [itif.org/power-industries](https://itif.org/power-industries).) ITIF maintains full editorial independence in all its work.
The author would like to thank Robert Atkinson for his guidance and feedback on this report. Any errors or omissions are the author’s responsibility alone.
### About the Authors
Trelysa Long is a policy analyst at ITIF. She was previously an economic policy intern with the U.S. Chamber of Commerce. She earned her bachelor’s degree in economics and political science from the University of California, Irvine.
Meghan Ostertag is a research assistant for economic policy at ITIF. She previously interned with the Federal Deposit Insurance Corporation. She holds a bachelor’s degree in economics from American University.
### About ITIF
The Information Technology and Innovation Foundation (ITIF) is an independent 501(c)(3) nonprofit, nonpartisan research and educational institute that has been recognized repeatedly as the world’s leading think tank for science and technology policy. Its mission is to formulate, evaluate, and promote policy solutions that accelerate innovation and boost productivity to spur growth, opportunity, and progress. For more information, visit [itif.org/about](https://itif.org/about/).
# Endnotes
[1](#_ednref1). Robert D. Atkinson, “Marshaling National Power Industries to Preserve America’s Strength and Thwart China’s Bid for Global Dominance” (ITIF, November 17, 2025), [https://itif.org/publications/2025/11/17/marshaling-national-power-industries-to-preserve-us-strength-and-thwart-china/](https://itif.org/publications/2025/11/17/marshaling-national-power-industries-to-preserve-us-strength-and-thwart-china/); Meghan Ostertag, “National Power Industries Are at Risk” (ITIF, November 17, 2025), [https://itif.org/publications/2025/11/17/us-national-power-industries-are-at-risk/](https://itif.org/publications/2025/11/17/us-national-power-industries-are-at-risk/).
[2](#_ednref2). Ibid.
[3](#_ednref3). Francesco Saltarelli et al., “Is Export a Probe for Domestic Production,” *Frontiers in Physics 8* (2020), [https://www.frontiersin.org/journals/physics/articles/10.3389/fphy.2020.00180/full](https://www.frontiersin.org/journals/physics/articles/10.3389/fphy.2020.00180/full).
[4](#_ednref4). “Lenzing Nonwoven Fibers at SINCE in Shanghai,” Association of Nonwoven Fabrics Industry, [https://www.inda.org/membership/member-news/lenzing-nonwoven-fibers-at-since-in-shanghai/?utm](https://www.inda.org/membership/member-news/lenzing-nonwoven-fibers-at-since-in-shanghai/?utm).
[5](#_ednref5). U.S. Census Bureau (County Business Patterns: 2013-2023, accessed January 15, 2026), [https://www.census.gov/programs-surveys/cbp.html](https://www.census.gov/programs-surveys/cbp.html).
[6](#_ednref6). Fatemeh Ashrafi et al., “Global State of Man-Made Filaments,” *The Journal of the Textile Institute* (January 2026): 1–17, [https://www.tandfonline.com/doi/full/10.1080/00405000.2025.2610799?scroll=top&needAccess=true#d1e1329](https://www.tandfonline.com/doi/full/10.1080/00405000.2025.2610799?scroll=top&needAccess=true#d1e1329).
[7](#_ednref7). Federal Reserve Bank of St. Louis (Industrial production: manufacturing: nondurable goods: artificial and synthetic fibers and filaments (NIACS = 32522), accessed January 15, 2025), [https://fred.stlouisfed.org/series/IPG32522NQ](https://fred.stlouisfed.org/series/IPG32522NQ).
[8](#_ednref8). Harvard Atlas of Economic Complexity (Country trade by product: global market share, accessed January 15, 2026), [https://atlas.hks.harvard.edu/data-downloads](https://atlas.hks.harvard.edu/data-downloads).
[9](#_ednref9). Fatemeh Ashrafi et al., “Global State of Man-Made Filaments.”
[10](#_ednref10). United States International Trade Commission, “Commodity Translation Tool,” accessed January 15, 2026, [https://dataweb.usitc.gov/classification/commodity-translation](https://dataweb.usitc.gov/classification/commodity-translation); Harvard Atlas of Economic Complexity (Country trade by product: exports, accessed January 15, 2026), [https://atlas.hks.harvard.edu/data-downloads](https://atlas.hks.harvard.edu/data-downloads).
[11](#_ednref11). Organization for Economic Cooperation and Development (OECD) (Trade in Value Added (TiVA) 2025 ed.: manufacturing of textiles, wearing apparel, leather and related products, accessed January 15, 2026), [https://data-explorer.oecd.org/vis?pg=0&bp=true&tm=%22%28TIVA%29%202025%20edition%22&snb=5&vw=tb&df[ds]=dsDisseminateFinalDMZ&df[id]=DSD_TIVA_MAINLV%40DF_MAINLV&df[ag]=OECD.STI.PIE&df[vs]=1.1&dq=VALU%2BEXGR%2BFFD_DVA.AUT%2BBEL%2BCAN%2BCHL%2BCOL%2BCRI%2BCZE%2BDNK%2BEST%2BFIN%2BFRA%2BDEU%2BGRC%2BHUN%2BISL%2BIRL%2BISR%2BITA%2BJPN%2BKOR%2BLVA%2BLTU%2BLUX%2BMEX%2BNLD%2BNZL%2BNOR%2BPOL%2BPRT%2BSVK%2BSVN%2BESP%2BSWE%2BCHE%2BTUR%2BGBR%2BUSA%2BAGO%2BARG%2BBGD%2BBLR%2BBRA%2BBRN%2BBGR%2BKHM%2BCMR%2BCHN%2BCOD%2BCIV%2BHRV%2BCYP%2BEGY%2BHKG%2BIND%2BIDN%2BJOR%2BKAZ%2BLAO%2BMYS%2BMLT%2BMAR%2BMMR%2BNGA%2BPAK%2BPER%2BPHL%2BROU%2BRUS%2BSTP%2BSAU%2BSEN%2BSGP%2BZAF%2BTWN%2BTHA%2BTUN%2BUKR%2BARE%2BVNM%2BAUS.C13T15.W..A&pd=2022%2C&to[TIME_PERIOD]=false](https://data-explorer.oecd.org/vis?pg=0&bp=true&tm=%22%28TIVA%29%202025%20edition%22&snb=5&vw=tb&df%5bds%5d=dsDisseminateFinalDMZ&df%5bid%5d=DSD_TIVA_MAINLV%40DF_MAINLV&df%5bag%5d=OECD.STI.PIE&df%5bvs%5d=1.1&dq=VALU%2BEXGR%2BFFD_DVA.AUT%2BBEL%2BCAN%2BCHL%2BCOL%2BCRI%2BCZE%2BDNK%2BEST%2BFIN%2BFRA%2BDEU%2BGRC%2BHUN%2BISL%2BIRL%2BISR%2BITA%2BJPN%2BKOR%2BLVA%2BLTU%2BLUX%2BMEX%2BNLD%2BNZL%2BNOR%2BPOL%2BPRT%2BSVK%2BSVN%2BESP%2BSWE%2BCHE%2BTUR%2BGBR%2BUSA%2BAGO%2BARG%2BBGD%2BBLR%2BBRA%2BBRN%2BBGR%2BKHM%2BCMR%2BCHN%2BCOD%2BCIV%2BHRV%2BCYP%2BEGY%2BHKG%2BIND%2BIDN%2BJOR%2BKAZ%2BLAO%2BMYS%2BMLT%2BMAR%2BMMR%2BNGA%2BPAK%2BPER%2BPHL%2BROU%2BRUS%2BSTP%2BSAU%2BSEN%2BSGP%2BZAF%2BTWN%2BTHA%2BTUN%2BUKR%2BARE%2BVNM%2BAUS.C13T15.W..A&pd=2022%2C&to%5bTIME_PERIOD%5d=false).
[12](#_ednref12). Harvard Atlas of Economic Complexity (Country trade by partner and product: exports, accessed January 15, 2026).
[13](#_ednref13). U.S. Census Bureau (County Business Patterns: 2003, accessed January 15, 2026), [https://www.census.gov/data/datasets/2003/econ/cbp/2003-cbp.html](https://www.census.gov/data/datasets/2003/econ/cbp/2003-cbp.html); U.S. Census Bureau (County Business Patterns: 2023, accessed January 15, 2026), [https://www.census.gov/data/datasets/2023/econ/cbp/2023-cbp.html](https://www.census.gov/data/datasets/2023/econ/cbp/2023-cbp.html).
[14](#_ednref14). U.S. Census Bureau (County Business Patterns: 2013-2023, accessed January 15, 2026).
[15](#_ednref15). Robert D. Atkinson and Ian Tufts, “The Hamilton Index, 2023: China Is Running Away With Strategic Industries” (ITIF, December 13, 2023), [https://itif.org/publications/2023/12/13/2023-hamilton-index/](https://itif.org/publications/2023/12/13/2023-hamilton-index/).
[16](#_ednref16). UN Comtrade Database (Trade Data: Imports and Exports, HS codes 7309, 7311, 7611, 7613, 8609, accessed April 14, 2026), [https://comtradeplus.un.org/TradeFlow](https://comtradeplus.un.org/TradeFlow).
[17](#_ednref17). OECD, “Subsidies to the Steel Industry” (Paris, France: OECD; April 26, 2023), [https://www.oecd.org/en/publications/subsidies-to-the-steel-industry_06e7c89b-en.html](https://www.oecd.org/en/publications/subsidies-to-the-steel-industry_06e7c89b-en.html).
[18](#_ednref18). UN Comtrade Database (Trade Data: Imports and Exports, HS codes 7309, 7311, 7611, 7613, 8609, accessed April 14, 2026).
[19](#_ednref19). Shannon Blood, “Arizona: The Emerging Star of the Semiconductor Industry Boom,” *Kiterocket*, May 23, 2024, [https://www.kiterocket.com/arizona-the-emerging-star-of-the-semiconductor-industry-boom/](https://www.kiterocket.com/arizona-the-emerging-star-of-the-semiconductor-industry-boom/); Arizona Commerce Authority, “New: Arizona’s International Trade Reaches Record Levels,” news release, March 28, 2025, [https://www.azcommerce.com/news-events/news/2025/3/new-arizona-s-international-trade-reaches-record-levels/#:~:text=Record%20exports%20from%20Arizona%20companies,breaking%20$100%20billion%20announcement%20recently](https://www.azcommerce.com/news-events/news/2025/3/new-arizona-s-international-trade-reaches-record-levels/#:~:text=Record%20exports%20from%20Arizona%20companies,breaking%20$100%20billion%20announcement%20recently).
[20](#_ednref20). U.S. Census Bureau (County Business Patterns 2015-2023, accessed January 15, 2026).
[21](#_ednref21). Danielle Popov, “China’s Chip Investment Falls in First Half of 2025 While Equipment Funding Surges: Report,” *SCMP*, August 12, 2025, [https://www.scmp.com/tech/policy/article/3321579/chinas-chip-investment-falls-first-half-2025-while-equipment-funding-surges-report](https://www.scmp.com/tech/policy/article/3321579/chinas-chip-investment-falls-first-half-2025-while-equipment-funding-surges-report).
[22](#_ednref22). Ibid.
[23](#_ednref23). Daniel Blaugher et al., “Made in China 2025: Evaluating China’s Performance” (Washington, D.C.: U.S.-China Economic and Security Review Commission, November 14, 2025), [https://www.uscc.gov/research/made-china-2025-evaluating-chinas-performance](https://www.uscc.gov/research/made-china-2025-evaluating-chinas-performance).
[24](#_ednref24). Raj Varadarajan et al., “Emerging Resilience in the Semiconductor Supply Chain” (industry report, SIA, May 2024), [https://www.semiconductors.org/emerging-resilience-in-the-semiconductor-supply-chain/](https://www.semiconductors.org/emerging-resilience-in-the-semiconductor-supply-chain/).
[25](#_ednref25). UN Comtrade Database (Trade Data: Imports and Exports, HS 8451 and 8542, accessed January 5, 2026).
[26](#_ednref26). “TSMC Intends to Expand Its Investment in the United States to US$165 Billion to Power the Future of AI,” press release, March 4, 2025, https://pr.tsmc.com/english/news/3210; https://www.cfr.org/blog/unpacking-tsmcs-100-billion-investment-united-states.
[27](#_ednref27). Ana Swanson and Paul Mozur, “U.S. Takes Aim at China’s Production of Essential Computer Chips,” *The New York Times*, December 23, 2024, [https://www.nytimes.com/2024/12/23/business/economy/us-china-semiconductor-legacy-chips.html](https://www.nytimes.com/2024/12/23/business/economy/us-china-semiconductor-legacy-chips.html).
[28](#_ednref28). Ibid.
[29](#_ednref29). UN Comtrade Database (Trade Data: Imports and Exports, HS 8451 and 8542, accessed January 5, 2026).
[30](#_ednref30). Stephen Ezell, “How Innovative is China in Semiconductors?” (ITIF, August 19, 2024), [https://itif.org/publications/2024/08/19/how-innovative-is-china-in-semiconductors/](https://itif.org/publications/2024/08/19/how-innovative-is-china-in-semiconductors/).
[31](#_ednref31). Joanne Chiao, “China and US bolster semiconductor independence as Taiwan’s foundry capacity share projected to decline to 41% by 2027, says Trendforce,” news release, *Trendforce*, December 14, 2023, [https://www.trendforce.com/presscenter/news/20231214-11959.html?utm](https://www.trendforce.com/presscenter/news/20231214-11959.html?utm).
[32](#_ednref32). Ezell, “How Innovative is China in Semiconductors?” (ITIF, August 19, 2024).
[33](#_ednref33). Chiao, news release, *Trendforce*, [https://www.trendforce.com/presscenter/news/20231214-11959.html?utm](https://www.trendforce.com/presscenter/news/20231214-11959.html?utm).
[34](#_ednref34). Ardi Janjeva et al., “China’s Quest for Semiconductor Self-Sufficiency” (Centre for Emerging Technology and Security, December 4, 2024), [https://cetas.turing.ac.uk/publications/chinas-quest-semiconductor-self-sufficiency](https://cetas.turing.ac.uk/publications/chinas-quest-semiconductor-self-sufficiency).
[35](#_ednref35). Census Bureau (County Business Patterns 2023, accessed March 18, 2026).
[36](#_ednref36). Atkinson and Tufts, “The Hamilton Index, 2023: China Is Running Away With Strategic Industries.”
[37](#_ednref37). Power Info Today, “Electric Motor & Generator Market – Growth on the Cards,” news release, [https://www.powerinfotoday.com/news-press-releases/electric-motor-generator-market-growth-on-the-cards/](https://www.powerinfotoday.com/news-press-releases/electric-motor-generator-market-growth-on-the-cards/).
[38](#_ednref38). Census Bureau (County Business Patterns 2015-2023, accessed March 18, 2026).
[39](#_ednref39). UN Comtrade (Exports of HS codes 8501, 8502, and 8503, accessed March 26, 2026).
[40](#_ednref40). U.S.-China Economic and Security Review Commission, Made in China 2025: Evaluating China’s Performance (Washington, D.C.: U.S.-China Economic and Security Review Commission, November 2025), [https://www.uscc.gov/sites/default/files/2025-11/Made_in_China_2025--Evaluating_Chinas_Performance.pdf](https://www.uscc.gov/sites/default/files/2025-11/Made_in_China_2025--Evaluating_Chinas_Performance.pdf).
[41](#_ednref41). Trend Economy (Annual International Trade Statistics by Country, accessed March 23, 2025), [https://trendeconomy.com/data/h2/UnitedStatesOfAmerica/85](https://trendeconomy.com/data/h2/UnitedStatesOfAmerica/85).
[42](#_ednref42). UN Comtrade (Exports of HS codes 8501, 8502, and 8503, accessed March 26, 2026).
[43](#_ednref43). U.S. Census Bureau (County Business Patterns, 2003, 2013, 2023, accessed March 24, 2026).
[44](#_ednref44). Ibid.
[45](#_ednref45). UN Comtrade (Exports of HS codes 8471, 8473, and 8523, accessed March 24, 2026).
[46](#_ednref46). Ibid.
[47](#_ednref47). U.S. Trade Representative, *Four-Year Review of Actions Taken In The Section 301 Investigation: China’s Acts, Policies, and Practices Related to Technology Transfer, Intellectual Property, and Innovation* (Washington, D.C.: Office of the U.S. Trade Representative, May 14, 2024), [https://ustr.gov/sites/default/files/05.14.2024%20Four%20Year%20Review%20of%20China%20Tech%20Transfer%20Section%20301%20%28Final%29_0.pdf](https://ustr.gov/sites/default/files/05.14.2024%20Four%20Year%20Review%20of%20China%20Tech%20Transfer%20Section%20301%20%28Final%29_0.pdf).
[48](#_ednref48). Eli Clemens, “Internal Value Chains Remain Dependent on China Even as Multinationals Shift Production to America” (ITIF, February 23, 2026), [https://itif.org/publications/2026/02/23/internal-value-chains-dependent-china-multinationals-shift-production-to-america/](https://itif.org/publications/2026/02/23/internal-value-chains-dependent-china-multinationals-shift-production-to-america/).
[49](#_ednref49). U.S. Census Bureau (County Business Patterns, 2017-2023, accessed March 24, 2026).
[50](#_ednref50). UN Comtrade (Exports of HS codes 8471, 8473, and 8523, accessed April 8, 2026).
[51](#_ednref51). Ibid.
[52](#_ednref52). Ibid.
[53](#_ednref53). Office of the United States Trade Representative (USTR), *Four-Year Review of Actions Taken in the Section 301 Investigation: China’s Acts, Policies, and Practices Related to Technology Transfer, Intellectual Property, and Innovation* (Washington, D.C.: USTR, May 14, 2024), [https://ustr.gov/sites/default/files/05.14.2024%20Four%20Year%20Review%20of%20China%20Tech%20Transfer%20Section%20301%20%28Final%29_0.pdf](https://ustr.gov/sites/default/files/05.14.2024%20Four%20Year%20Review%20of%20China%20Tech%20Transfer%20Section%20301%20%28Final%29_0.pdf).
[54](#_ednref54). Eli Clemens, “Internal Value Chains Remain Dependent on China Even as Multinationals Shift Production to America” (ITIF, February 23, 2026).
[55](#_ednref55). “Aerospace and Defense Industries in Connecticut,” AdvanceCT, accessed April 8, 2026, [https://www.advancect.org/key-industries/aerospace-and-defense](https://www.advancect.org/key-industries/aerospace-and-defense).
[56](#_ednref56). U.S. Census Bureau (County Business Patterns, 2014-2023, accessed April 8, 2026).
[57](#_ednref57). UN Comtrade (Exports of HS codes 840710, 840910, 8411, 841210, accessed April 8, 2026).
[58](#_ednref58). Blaugher et al., “Made in China 2025: Evaluating China’s Performance.
[59](#_ednref59). Scott Kennedy, “China’s COMAC: An Aerospace Minor Leaguer,” CSIS, December 7, 2020, [https://www.csis.org/blogs/trustee-china-hand/chinas-comac-aerospace-minor-leaguer](https://www.csis.org/blogs/trustee-china-hand/chinas-comac-aerospace-minor-leaguer).
[60](#_ednref60). OECD, *Measuring Distortions in International Markets: Below-Market Finance* (Paris, France: OECD, May 2021), [https://www.oecd.org/content/dam/oecd/en/publications/reports/2021/05/measuring-distortions-in-international-markets-below-market-finance_ef463ae3/a1a5aa8a-en.pdf](https://www.oecd.org/content/dam/oecd/en/publications/reports/2021/05/measuring-distortions-in-international-markets-below-market-finance_ef463ae3/a1a5aa8a-en.pdf).
[61](#_ednref61). Harvard Atlas of Economic Complexity (U.S. exports of turbo-jet engines, <25KN in 2024, accessed April 8, 2026), [https://atlas.hks.harvard.edu/explore/treemap?year=2024&exporter=country-840&view=markets&product=product-HS92-8795](https://atlas.hks.harvard.edu/explore/treemap?year=2024&exporter=country-840&view=markets&product=product-HS92-8795).
[62](#_ednref62). UN Comtrade (Exports of (HS codes 840710, 840910. 8411, 841210, accessed April 8, 2026).
[63](#_ednref63). U.S. Census Bureau (County Business Patterns 2019, 2023, accessed March 24, 2026).
[64](#_ednref64). Siemens Healthineers, “Siemens Healthineers to Expand its Newark, DE Laboratory Diagnostics Manufacturing Facility,” press release, September 27, 2021, [https://www.siemens-healthineers.com/en-us/press-room/press-releases/glasgowexpansion2021](https://www.siemens-healthineers.com/en-us/press-room/press-releases/glasgowexpansion2021).
[65](#_ednref65). U.S.-China Economic and Security Review Commission, “Made in China 2025: Evaluating China’s Performance” (Washington, D.C.: U.S. China Economic and Security Review Commission, November 2025).
[66](#_ednref66). UN Comtrade (Exports of HS codes 3002 and 3822, accessed March 24, 2026).
[67](#_ednref67). US International Trade Commission, DataWeb (Exports of HS codes 3002 and 3822, accessed March 24, 2026), [https://dataweb.usitc.gov/trade/search/TotExp/HTS](https://dataweb.usitc.gov/trade/search/TotExp/HTS).
[68](#_ednref68). UN Comtrade (Exports of HS codes 3002 and 3822, accessed March 24, 2026).
[69](#_ednref69). U.S.-China Economic and Security Review Commission, “Made in China 2025: Evaluating China’s Performance.”
[70](#_ednref70). Ibid.
[71](#_ednref71). Alexander Brown et al., “Investigating State Support For China’s Medical Technology Companies,” *MERICS*, November 2023, [https://merics.org/sites/default/files/2023-11/MERICS_Report_MedTech%20State%20Support_November%202023_final.pdf](https://merics.org/sites/default/files/2023-11/MERICS_Report_MedTech%20State%20Support_November%202023_final.pdf).
[72](#_ednref72). U.S. Census Bureau (County Business Patterns 2017-2023, accessed March 27, 2026).
[73](#_ednref73). U.S. Trade Representative, *Four-Year Review of Actions Taken In The Section 301 Investigation: China’s Acts, Policies, and Practices Related to Technology Transfer, Intellectual Property, and Innovation*.
[74](#_ednref74). Eli Clemens, “Internal Value Chains Remain Dependent on China Even as Multinationals Shift Production to America” (ITIF, February 23, 2026).
[75](#_ednref75). Gartner, “Gartner Says Worldwide PC Shipments Increased 0.3% in Fourth Quarter of 2023 but Declined 14.8% for the Year,” January 10, 2024, press release, [https://www.gartner.com/en/newsroom/press-releases/01-10-2024-gartner-says-worldwide-pc-shipments-increased-zero-point-three-percent-in-fourth-quarter-of-2023-but-declined-fourteen-point-eight-percent-for-the-year](https://www.gartner.com/en/newsroom/press-releases/01-10-2024-gartner-says-worldwide-pc-shipments-increased-zero-point-three-percent-in-fourth-quarter-of-2023-but-declined-fourteen-point-eight-percent-for-the-year).
[76](#_ednref76). UN Comtrade (Exports of HS codes 8471 and 8473, accessed March 24, 2026).
[77](#_ednref77). Ibid.
[78](#_ednref78). Zachary Hansen, “How the Inflation Reduction Act Impacts Georgia’s EV Industry,” *Governing*, August 15, 2022, [https://www.governing.com/next/how-the-inflation-reduction-act-impacts-georgias-ev-industry](https://www.governing.com/next/how-the-inflation-reduction-act-impacts-georgias-ev-industry).
[79](#_ednref79). Census Bureau (County Business Patterns 2023, accessed March 18, 2026).
[80](#_ednref80). Office of Senator Jon Ossoff, “Sen. Ossoff: LG Energy Solution & Hyundai to Build $4.3 Billion EV Battery Plant in Georgia, Create 3,000 Jobs,” news release, May 25, 2023, [https://www.ossoff.senate.gov/press-releases/sen-ossoff-lg-energy-solutions-hyundai-to-build-4-3-billion-ev-battery-plant-in-georgia-create-3000-jobs/](https://www.ossoff.senate.gov/press-releases/sen-ossoff-lg-energy-solutions-hyundai-to-build-4-3-billion-ev-battery-plant-in-georgia-create-3000-jobs/).
[81](#_ednref81). “Impacts of IRA Repeal,” International Council on Clean Transportation, April 2025, [https://theicct.org/wp-content/uploads/2025/04/Impacts-of-IRA-Repeal-GA-Factsheet.pdf](https://theicct.org/wp-content/uploads/2025/04/Impacts-of-IRA-Repeal-GA-Factsheet.pdf).
[82](#_ednref82). International Energy Agency (IEA), “Executive Summary” (Paris, France: IEA, 2024), [https://www.iea.org/reports/batteries-and-secure-energy-transitions/executive-summary](https://www.iea.org/reports/batteries-and-secure-energy-transitions/executive-summary).
[83](#_ednref83). Shannon Osaka and Naema Ahmed, “How the U.S. Lost Its Lead in Electric Vehicles and Other Clean Energy Inventions,” *The Washington Post*, July 31, 2025, [https://www.washingtonpost.com/climate-environment/2025/07/31/china-clean-energy-united-states-inventions/](https://www.washingtonpost.com/climate-environment/2025/07/31/china-clean-energy-united-states-inventions/).
[84](#_ednref84). Stephen Ezell, “How Innovative is China in the Electric Vehicle and Battery Industries?” (ITIF, July 29, 2024), [https://itif.org/publications/2024/07/29/how-innovative-is-china-in-the-electric-vehicle-and-battery-industries/#_edn88](https://itif.org/publications/2024/07/29/how-innovative-is-china-in-the-electric-vehicle-and-battery-industries/#_edn88).
[85](#_ednref85). Ibid.
[86](#_ednref86). Ibid.
[87](#_ednref87). Ibid.
[88](#_ednref88). Ibid.
[89](#_ednref89). Shannon Osaka and Naema Ahmed, “How the U.S. Lost Its Lead in Electric Vehicles and Other Clean Energy Inventions.”
[90](#_ednref90). IEA, “Lithium-Ion Battery Manufacturing Capacity, 2022-2030” (Paris, France: IEA, May 22, 2023), [https://www.iea.org/data-and-statistics/charts/lithium-ion-battery-manufacturing-capacity-2022-2030](https://www.iea.org/data-and-statistics/charts/lithium-ion-battery-manufacturing-capacity-2022-2030).
[91](#_ednref91). “University of Hawaii: Institute for Astronomy,” accessed April 14, 2026, [https://www.ifa.hawaii.edu/](https://www.ifa.hawaii.edu/).
[92](#_ednref92). “Oceanit,” accessed April 14, 2026, [https://www.oceanit.com/](https://www.oceanit.com/).
[93](#_ednref93). Census Bureau (County Business Patterns 2018-2023, accessed April 14, 2026).
[94](#_ednref94). UN Comtrade (Exports of HS code 9001, 9002, 9005, 9011, 9013, accessed April 14, 2026).
[95](#_ednref95). U.S.-China Economic and Security Review Commission, “Made in China 2025: Evaluating China’s Performance.”
[96](#_ednref96). OECD, *Measuring Distortions in International Markets: Below-Market Finance*.
[97](#_ednref97). “Sunny Group,” accessed April 14, 2026, [https://www.sunnyoptical.com/en/default.html](https://www.sunnyoptical.com/en/default.html); OFilm, accessed April 14, 2026, [http://www.ofilm.com/en/](http://www.ofilm.com/en/).
[98](#_ednref98). “Teledyne Technologies,” accessed April 14, 2026, [https://www.teledyne.com/en-us](https://www.teledyne.com/en-us).
[99](#_ednref99). “Semiconductors in Idaho” (factbook, Semiconductor Industry Association (SIA), Washington, D.C.), [https://www.semiconductors.org/wp-content/uploads/2022/05/Idaho-2022.pdf](https://www.semiconductors.org/wp-content/uploads/2022/05/Idaho-2022.pdf); “Idaho’s Semiconductor Industry,” Idaho Commerce, [https://commerce.idaho.gov/semiconductor/](https://commerce.idaho.gov/semiconductor/).
[100](#_ednref100). U.S. Census Bureau (County Business Patterns, 2018-2023, accessed April 1, 2026).
[101](#_ednref101). Semiconductor Industry,” Idaho Commerce; “Top 10 Manufacturing Companies in Idaho” (IndustrySelect, December 8, 2025), [https://www.industryselect.com/blog/top-10-manufacturing-companies-in-idaho](https://www.industryselect.com/blog/top-10-manufacturing-companies-in-idaho).
[102](#_ednref102). Yang Jie, “The Chinese Company Taking On the World’s Memory-Chip Giants,” *The Wall Street Journal*, January 11, 2026, [https://www.wsj.com/tech/the-chinese-company-taking-on-the-worlds-memory-chip-giants-78dfea55?st=UhqVRo&reflink=article_email_share](https://www.wsj.com/tech/the-chinese-company-taking-on-the-worlds-memory-chip-giants-78dfea55?st=UhqVRo&reflink=article_email_share).
[103](#_ednref103). Ibid.
[104](#_ednref104). “Global DRAM Market Share by Revenue (Q3 2024 – Q3 2025), Counterpoint, December 18, 2025, [https://counterpointresearch.com/en/insights/global-dram-and-hbm-market-share](https://counterpointresearch.com/en/insights/global-dram-and-hbm-market-share).
[105](#_ednref105). Ibid.
[106](#_ednref106). Popov, “China’s Chip Investment Falls in First Half of 2025 While Equipment Funding Surges: Report.”
[107](#_ednref107). Lee Deokjoo, “China Spent 70 Trillion Won on Semiconductor Subsidies and Plans to Double That—Meanwhile, K-Semiconductors Stand Alone,” *Maeil Business Newspaper*, December 29, 2025, [https://www.mk.co.kr/en/business/11917168#:~:text=This%20is%20not%20the%20end,semiconductor%20subsidies%20are%20proving%20effective](https://www.mk.co.kr/en/business/11917168#:~:text=This%20is%20not%20the%20end,semiconductor%20subsidies%20are%20proving%20effective).
[108](#_ednref108). Ibid.
[109](#_ednref109). Micron, “Micron and Trump Administration Announce Expanded U.S. Investments in Leading-Edge DRAM Manufacturing and R&D,” news release, June 12, 2025, [https://investors.micron.com/news-releases/news-release-details/micron-and-trump-administration-announce-expanded-us-investments](https://investors.micron.com/news-releases/news-release-details/micron-and-trump-administration-announce-expanded-us-investments).
[110](#_ednref110). Ana Swanson and Paul Mozur, “U.S. Takes Aim at China’s Production of Essential Computer Chips,” *The New York Times*, December 23, 2024, [https://www.nytimes.com/2024/12/23/business/economy/us-china-semiconductor-legacy-chips.html](https://www.nytimes.com/2024/12/23/business/economy/us-china-semiconductor-legacy-chips.html).
[111](#_ednref111). Ezell, “How Innovative is China in Semiconductors?” (ITIF, August 19, 2024).
[112](#_ednref112). Andrew David et al., “Foundational Fabs: China’s Use of Non-Market Policies to Expand Its Role in the Semiconductor Supply Chain” (Silverado Policy Accelerators, October 2023), 15, [https://silverado.org/news/report-foundational-fabs-chinas-use-of-non-market-policies/](https://silverado.org/news/report-foundational-fabs-chinas-use-of-non-market-policies/).
[113](#_ednref113). Ibid.
[114](#_ednref114). Ezell, “How Innovative is China in Semiconductors?” (ITIF, August 19, 2024).
[115](#_ednref115). Ardi Janjeva et al., “China’s Quest for Semiconductor Self-Sufficiency” (Centre for Emerging Technology and Security, December 4, 2024), [https://cetas.turing.ac.uk/publications/chinas-quest-semiconductor-self-sufficiency](https://cetas.turing.ac.uk/publications/chinas-quest-semiconductor-self-sufficiency).
[116](#_ednref116). “Illinois,” Office of the United States Trade Representative, accessed January 20, 2026, [https://ustr.gov/map/state-benefits/il](https://ustr.gov/map/state-benefits/il).
[117](#_ednref117). United States Census Bureau, USA Trade (State export data, HS 8427, 8429, 8430, 8431, accessed January 20, 2026), [https://usatrade.census.gov/data/Perspective60/View/dispview.aspx](https://usatrade.census.gov/data/Perspective60/View/dispview.aspx).
[118](#_ednref118). U.S. Census Bureau (County Business Patterns 2017-2023, accessed April 1, 2026).
[119](#_ednref119). “Heavy Equipment Manufacturers: Trends Shaping the Industry’s Future,” Illinois Manufacturers’ Association, accessed January 20, 2026, [https://ima-net.org/heavy-equipment-manufacturers/](https://ima-net.org/heavy-equipment-manufacturers/).
[120](#_ednref120). “Global Construction Guide 2026,” Construction Briefing, December 11, 2025, [https://www.constructionbriefing.com/magazines/international-construction/latest-issue](https://www.constructionbriefing.com/magazines/international-construction/latest-issue).
[121](#_ednref121). Global Trade Alert, “China: Government subsidies for listed company Xcmg Construction Machinery Co., Ltd. in year 2023,” [https://globaltradealert.org/intervention/136968-china-government-subsidies-for-listed-company-xcmg-construction-machinery-co-ltd-in-year-2023](https://globaltradealert.org/intervention/136968-china-government-subsidies-for-listed-company-xcmg-construction-machinery-co-ltd-in-year-2023); Global Trade Alert, “China: Government subsidies for listed company Xcmg Construction Machinery Co., Ltd. in year 2022,” [https://globaltradealert.org/state-act/85153](https://globaltradealert.org/state-act/85153).
[122](#_ednref122). European Commission, “Commission acts against unfairly subsidized imports of mobile access equipment from China,” news release, April 28, 2025, [https://policy.trade.ec.europa.eu/news/commission-acts-against-unfairly-subsidised-imports-mobile-access-equipment-china-2025-04-28_en](https://policy.trade.ec.europa.eu/news/commission-acts-against-unfairly-subsidised-imports-mobile-access-equipment-china-2025-04-28_en).
[123](#_ednref123). International Trade Administration, “China industrial Equipment Upgrading,” July 10, 2024, [https://www.trade.gov/market-intelligence/china-industrial-equipment-upgrading](https://www.trade.gov/market-intelligence/china-industrial-equipment-upgrading).
[124](#_ednref124). Neil Gerrard, “Yellow Table 2025 in 4 Charts: Market Share, Growth, and Regional Power Shifts,” *Construction Briefing*, June 11, 2025, [https://www.constructionbriefing.com/news/yellow-table-2025-in-4-charts-market-share-cagr-and-regional-power-shift/8062551.article?zephr_sso_ott=DjBjBu](https://www.constructionbriefing.com/news/yellow-table-2025-in-4-charts-market-share-cagr-and-regional-power-shift/8062551.article?zephr_sso_ott=DjBjBu).
[125](#_ednref125). UN Comtrade Database (Trade Data: Exports, HS 8427, 8429, 8430, 8431, accessed January 20, 2026).
[126](#_ednref126). Ibid.
[127](#_ednref127). “China Construction Machinery Industry Eyes Global Markets Amid Domestic Slowdown,” imachine, June 11, 2025, [https://www.imachinemall.com/news/china-construction-machinery-industry-eyes-global-markets-amid-domestic-slowdown/](https://www.imachinemall.com/news/china-construction-machinery-industry-eyes-global-markets-amid-domestic-slowdown/).
[128](#_ednref128). Caterpillar, “Caterpillar Reports Third-Quarter 2025 Results,” news release, October 29, 2025, [https://investors.caterpillar.com/news/news-details/2025/Caterpillar-Reports-Third-Quarter-2025-Results/default.aspx](https://investors.caterpillar.com/news/news-details/2025/Caterpillar-Reports-Third-Quarter-2025-Results/default.aspx).
[129](#_ednref129). U.S. Geological Survey, Mineral Commodity Summaries, “Iron and Steel” (U.S. Geological Survey: Washington, D.C., January 2025), [https://pubs.usgs.gov/periodicals/mcs2025/mcs2025-iron-steel.pdf](https://pubs.usgs.gov/periodicals/mcs2025/mcs2025-iron-steel.pdf); U.S. Census Bureau (County Business Patterns 2017-2023, accessed March 27, 2026).
[130](#_ednref130). “Indiana Harbor,” Cleveland Cliffs, accessed March 31, 2026, [https://www.clevelandcliffs.com/operations/steelmaking/indiana-harbor](https://www.clevelandcliffs.com/operations/steelmaking/indiana-harbor); “United States Steel,” accessed March 31, 2026, [https://www.ussteel.com/](https://www.ussteel.com/).
[131](#_ednref131). U.S. Census Bureau (County Business Patterns 2017-2023, accessed March 27, 2026).
[132](#_ednref132). OECD, “Subsidies to the Steel Industry” (Paris, France: OECD; April 26, 2023), [https://www.oecd.org/en/publications/subsidies-to-the-steel-industry_06e7c89b-en.html](https://www.oecd.org/en/publications/subsidies-to-the-steel-industry_06e7c89b-en.html).
[133](#_ednref133). Ibid.
[134](#_ednref134). “World Steel in Figures 2025,” World Steel Association, accessed March 31, 2026, [https://worldsteel.org/data/world-steel-in-figures/world-steel-in-figures-2025/](https://worldsteel.org/data/world-steel-in-figures/world-steel-in-figures-2025/).
[135](#_ednref135). OECD, “Surging Excess Capacity Threatens Steel Market Stability, Employment, and Decarbonization Plans,” May 27, 2025, press release, [https://www.oecd.org/en/about/news/press-releases/2025/05/surging-excess-capacity-threatens-steel-market-stability-employment-and-decarbonisation-plans.html](https://www.oecd.org/en/about/news/press-releases/2025/05/surging-excess-capacity-threatens-steel-market-stability-employment-and-decarbonisation-plans.html).
[136](#_ednref136). “World Steel in Figures 2025,” World Steel Association, accessed March 31, 2026.
[137](#_ednref137). UN Comtrade Database (Trade Data: Imports and Exports, HS 72, accessed March 30, 2026).
[138](#_ednref138). International Trade Administration (ITA), “Global Steel Trade Monitor: Steel Exports Report: United States” (Washington, D.C.: ITA, August 2019), [https://legacy.trade.gov/steel/countries/pdfs/2019/q1/exports-us.pdf](https://legacy.trade.gov/steel/countries/pdfs/2019/q1/exports-us.pdf).
[139](#_ednref139). UN Comtrade Database (Trade Data: Imports and Exports, HS 72, accessed March 30, 2026).
[140](#_ednref140). OECD, “Surging Excess Capacity Threatens Steel Market Stability, Employment, and Decarbonization Plans,” May 27, 2025.
[141](#_ednref141). U.S. Census Bureau (County Business Patterns 2023; June 26, 2025).
[142](#_ednref142). “Our American Factories & Facilities,” John Deere, [https://about.deere.com/en-us/locations/us-locations](https://about.deere.com/en-us/locations/us-locations).
[143](#_ednref143). “Global Construction Guide 2026,” Construction Briefing, December 11, 2025, [https://www.constructionbriefing.com/magazines/international-construction/latest-issue](https://www.constructionbriefing.com/magazines/international-construction/latest-issue).
[144](#_ednref144). Ibid.
[145](#_ednref145). UN Comtrade Database (Trade Data: Exports, HS 8427, 8429, 8430, 8431, accessed January 20, 2026), [https://comtradeplus.un.org/TradeFlow](https://comtradeplus.un.org/TradeFlow).
[146](#_ednref146). Global Trade Alert, “China: Government subsidies for listed company Xcmg Construction Machinery Co., Ltd. in year 2023,” [https://globaltradealert.org/intervention/136968-china-government-subsidies-for-listed-company-xcmg-construction-machinery-co-ltd-in-year-2023](https://globaltradealert.org/intervention/136968-china-government-subsidies-for-listed-company-xcmg-construction-machinery-co-ltd-in-year-2023); Global Trade Alert, “China: Government subsidies for listed company Xcmg Construction Machinery Co., Ltd. in year 2022,” [https://globaltradealert.org/state-act/85153](https://globaltradealert.org/state-act/85153).
[147](#_ednref147). International Trade Administration, “China industrial Equipment Upgrading,” July 10, 2024, [https://www.trade.gov/market-intelligence/china-industrial-equipment-upgrading](https://www.trade.gov/market-intelligence/china-industrial-equipment-upgrading).
[148](#_ednref148). Ibid.
[149](#_ednref149). Gerrard, “Yellow Table 2025 in 4 Charts: Market Share, Growth, and Regional Power Shifts.”
[150](#_ednref150). Ibid.
[151](#_ednref151). European Commission, “Commission acts against unfairly subsidized imports of mobile access equipment from China,” news release, April 28, 2025, [https://policy.trade.ec.europa.eu/news/commission-acts-against-unfairly-subsidised-imports-mobile-access-equipment-china-2025-04-28_en](https://policy.trade.ec.europa.eu/news/commission-acts-against-unfairly-subsidised-imports-mobile-access-equipment-china-2025-04-28_en).
[152](#_ednref152). UN Comtrade Database (Trade Data: Exports, HS 8427, 8429, 8430, 8431, accessed January 20, 2026).
[153](#_ednref153). Ibid.
[154](#_ednref154). U.S. Census Bureau (County Business Patterns, accessed April 1, 2026).
[155](#_ednref155). BLS (Employment and Wages Data Viewer, NAICS 3331, accessed March 18, 2026), [https://data.bls.gov/cew/apps/table_maker/v4/table_maker.htm#type=18&from=2020&to=2024&qtr=1&own=5&ind=3331&area=20000&supp=1](https://data.bls.gov/cew/apps/table_maker/v4/table_maker.htm#type=18&from=2020&to=2024&qtr=1&own=5&ind=3331&area=20000&supp=1).
[156](#_ednref156). Census Bureau (County Business Patterns 2014, 2023, accessed March 18, 2026).
[157](#_ednref157). UN Comtrade (Exports of HS Codes 8432, 8433, 8434, 8435, 8436, 8437, 8701 to world, accessed March 17, 2026).
[158](#_ednref158). Ibid.
[159](#_ednref159). “Global Export of Agricultural, Horticultural or Forestry Machinery Share by Country (US Dollars),” ReportLinker, [https://www.reportlinker.com/dataset/004a42bfe45ee49e9855d982f6116ed0637e1d77](https://www.reportlinker.com/dataset/004a42bfe45ee49e9855d982f6116ed0637e1d77).
[160](#_ednref160). Wang Xiaotong, “Empowering the Global South: Chinese Agricultural Machinery in Motion,” *China Economic Net*, [http://en.ce.cn/Insight/202603/t20260307_2811505.shtml](http://en.ce.cn/Insight/202603/t20260307_2811505.shtml).
[161](#_ednref161). “Global Export of Agricultural, Horticultural or Forestry Machinery Share by Country (US Dollars),” ReportLinker.
[162](#_ednref162). Yajuan Zhou et al., “Impact of Agricultural Machinery Purchase Subsidies on the Sustainable and Intensive Utilization of Cultivated Land: A Perspective on Agricultural Machinery Socialization Services,” *Journal of Rural Studies*, vol 119 (October 2025), [https://www.sciencedirect.com/science/article/pii/S0743016725002396](https://www.sciencedirect.com/science/article/pii/S0743016725002396).
[163](#_ednref163). International Trade Administration (ITA), “China Agricultural Machinery Market” (Washington, D.C.: ITA, 2021), [https://www.trade.gov/market-intelligence/china-agricultural-machinery-market](https://www.trade.gov/market-intelligence/china-agricultural-machinery-market).
[164](#_ednref164). UN Comtrade (Exports of HS Codes 8432, 8433, 8434, 8435, 8436, 8437, 8701 to Indonesia, the Philippines, and Vietnam, accessed March 17, 2026).
[165](#_ednref165). “U.S. and Global Operations,” GE Appliances, accessed April 1, 2026, [https://geappliancesco.com/operations/](https://geappliancesco.com/operations/).
[166](#_ednref166). U.S. Census Bureau (County Business Patterns 2018-2023, accessed April 1, 2026).
[167](#_ednref167). Team Kentucky, “Gov. Beshear: GE Appliances To Invest $490 Million, Create 800 Full-Time Jobs at Global Corporate Headquarters in Louisville,” news release, June 26, 2025, [https://newkentuckyhome.ky.gov/Newsroom/NewsPage/20250626_GEAppliances](https://newkentuckyhome.ky.gov/Newsroom/NewsPage/20250626_GEAppliances).
[168](#_ednref168). Ibid.
[169](#_ednref169). Ibid.
[170](#_ednref170). UN Comtrade (U.S. and China Exports of HS codes 8418, 8422, 8450, 8508, 8516, accessed March 19, 2026).
[171](#_ednref171). Ibid.
[172](#_ednref172). Ibid.
[173](#_ednref173). Ibid.
[174](#_ednref174). Midea, “Financial Reports” [https://www.midea.com.cn/en/Investors/Financial_Reports](https://www.midea.com.cn/en/Investors/Financial_Reports); Haier, “Financial Reports,” [https://smart-home.haier.com/en/investor-relations/#financial-reports](https://smart-home.haier.com/en/investor-relations/#financial-reports).
[175](#_ednref175). Junhui Shi et al., “The Effect of Household Technology on Child Health: Evidence from China’s “Home Appliances Going to the Countryside” Policy,” *International Journal of Environmental Research and Public Health*, no. 19 (2022), [http://pmc.ncbi.nlm.nih.gov/articles/PMC9565273/](http://pmc.ncbi.nlm.nih.gov/articles/PMC9565273/); Ryan Featherston, “Is Your Refrigerator Running? China’s Trade-In Programs and Plans to Boost Consumption” (CSIS, March 27, 2025), [https://www.csis.org/blogs/trustee-china-hand/your-refrigerator-running-chinas-trade-programs-and-plans-boost](https://www.csis.org/blogs/trustee-china-hand/your-refrigerator-running-chinas-trade-programs-and-plans-boost).
[176](#_ednref176). Ibid.
[177](#_ednref177). Midea, “2024 Annual Report,” [https://www.midea.com.cn/en/Investors/Financial_Reports](https://www.midea.com.cn/en/Investors/Financial_Reports).
[178](#_ednref178). U.S. Census Bureau (County Business Patterns 2017-2023, accessed March 27, 2026).
[179](#_ednref179). “Atalco,” Atalco, accessed March 30, 2026, [https://www.atalco.com/](https://www.atalco.com/).
[180](#_ednref180). U.S. Census Bureau (County Business Patterns 2017-2023, accessed March 27, 2026).
[181](#_ednref181). U.S. Geological Survey, Mineral Commodity Summaries, “Aluminum” (U.S. Geological Survey: Washington, D.C., January 2024), [https://pubs.usgs.gov/periodicals/mcs2024/mcs2024-aluminum.pdf](https://pubs.usgs.gov/periodicals/mcs2024/mcs2024-aluminum.pdf).
[182](#_ednref182). OECD, “Measuring Distortions in International Markets: The Aluminum Value Chain” (OECD: Paris, France, January 7, 2019), [https://www.oecd.org/content/dam/oecd/en/publications/reports/2019/01/measuring-distortions-in-international-markets-the-aluminium-value-chain_058cb425/c82911ab-en.pdf](https://www.oecd.org/content/dam/oecd/en/publications/reports/2019/01/measuring-distortions-in-international-markets-the-aluminium-value-chain_058cb425/c82911ab-en.pdf).
[183](#_ednref183). Ibid.
[184](#_ednref184). Robert E. Scott, “Testimony Before the U.S. Department of Commerce on Aluminum Imports” (Economic Policy Institute, June 22, 2017), [https://www.epi.org/publication/testimony-before-the-u-s-department-of-commerce-on-aluminum-imports/](https://www.epi.org/publication/testimony-before-the-u-s-department-of-commerce-on-aluminum-imports/).
[185](#_ednref185). UN Comtrade Database (Trade Data: Imports and Exports, HS 2818, 7601, 7603-7607, accessed January 5, 2026).
[186](#_ednref186). “Minerals and Metals,” U.S. International Trade Commission, February 15, 2022, [https://www.usitc.gov/research_and_analysis/tradeshifts/2021/minerals](https://www.usitc.gov/research_and_analysis/tradeshifts/2021/minerals).
[187](#_ednref187). UN Comtrade Database (Trade Data: Imports and Exports, HS 2818, 7601, 7603-7607, accessed January 5, 2026).
[188](#_ednref188). OECD (Trade in Value Added, accessed March 27, 2026), [https://data-explorer.oecd.org/vis?pg=0&bp=true&tm=%22%28TIVA%29%202025%20edition%22&snb=5&df[ds]=dsDisseminateFinalDMZ&df[id]=DSD_TIVA_MAINLV%40DF_MAINLV&df[ag]=OECD.STI.PIE&df[vs]=1.1&dq=VALU.AUS.C21.W..A&pd=1995%2C2022&to[TIME_PERIOD]=false](https://data-explorer.oecd.org/vis?pg=0&bp=true&tm=%22%28TIVA%29%202025%20edition%22&snb=5&df%5bds%5d=dsDisseminateFinalDMZ&df%5bid%5d=DSD_TIVA_MAINLV%40DF_MAINLV&df%5bag%5d=OECD.STI.PIE&df%5bvs%5d=1.1&dq=VALU.AUS.C21.W..A&pd=1995%2C2022&to%5bTIME_PERIOD%5d=false).
[189](#_ednref189). U.S. Census Bureau (County Business Patterns 2013, 2018, 2023, accessed March 24, 2026).
[190](#_ednref190). IDEXX, “About Us,” [https://www.idexx.com/en/about-idexx/](https://www.idexx.com/en/about-idexx/).
[191](#_ednref191). Ocean Optics, “About Ocean Optics,” [https://www.oceanoptics.com/about/](https://www.oceanoptics.com/about/).
[192](#_ednref192). U.S.-China Economic and Security Review Commission, “Made in China 2025: Evaluating China’s Performance.”
[193](#_ednref193). Ibid.
[194](#_ednref194). Alexander Brown et al., “Investigating State Support For China’s Medical Technology Companies,” *MERICS*, November 2023, [https://merics.org/sites/default/files/2023-11/MERICS_Report_MedTech%20State%20Support_November%202023_final.pdf](https://merics.org/sites/default/files/2023-11/MERICS_Report_MedTech%20State%20Support_November%202023_final.pdf).
[195](#_ednref195). UN Comtrade (Exports of HS codes 9012, 9025, 9027, 9030, 9031, accessed March 24, 2026).
[196](#_ednref196). Ibid.
[197](#_ednref197). NAICS Association, “325414 – Biological Product (except Diagnostic) Manufacturing,” website, [https://www.naics.com/naics-code-description/?code=325414](https://www.naics.com/naics-code-description/?code=325414).
[198](#_ednref198). NAICS List, “Maryland companies engaged in Biological Product (except Diagnostic) Manufacturing with NAICS 325414,” website, [https://naicslist.com/company-directory/state-md?industry=325414](https://naicslist.com/company-directory/state-md?industry=325414).
[199](#_ednref199). U.S. International Trade Commission, Commodity Translation Tool (NAICS to SITC code for 2022, accessed February 2026), [https://dataweb.usitc.gov/classification/commodity-translation](https://dataweb.usitc.gov/classification/commodity-translation)
[200](#_ednref200). U.S. Census Bureau, County Business Patterns (NAICS 325414 from 2014 to 2023, accessed April 2026).
[201](#_ednref201). Ibid.
[202](#_ednref202). UN Comtrade Database, Trade Data (exports for all nations for NAICS 325110, accessed February 2026).
[203](#_ednref203). Ibid.
[204](#_ednref204). Ibid.
[205](#_ednref205). NAICS Association, “334517 – Irradiation Apparatus Manufacturing.”
[206](#_ednref206). NAICS List, “Massachusetts companies engaged in Irradiation Apparatus Manufacturing with NAICS 334517.”
[207](#_ednref207). U.S. International Trade Commission, Commodity Translation Tool (NAICS to SITC code for 2022, accessed February 2026).
[208](#_ednref208). U.S. Census Bureau, County Business Patterns (NAICS 3334517 from 2014 to 2023, accessed March 2026).
[209](#_ednref209). Ibid.
[210](#_ednref210). Ibid.
[211](#_ednref211). “2023 Industry Snapshot,” MassBio, 2023, [https://www.massbio.org/wp-content/uploads/2023/09/FINAL-2023_IndustrySnapshot.pdf](https://www.massbio.org/wp-content/uploads/2023/09/FINAL-2023_IndustrySnapshot.pdf).
[212](#_ednref212). UN Comtrade Database, Trade Data (exports for all nations for NAICS 325110, accessed February 2026).
[213](#_ednref213). Ibid.
[214](#_ednref214). Ibid.
[215](#_ednref215). Fredrik Erixon et al., “China’s Public Procurement Protectionism and Europe’s Response: The Case of Medical Technology,” European Centre for International Political Economy, September 2021, [https://ecipe.org/publications/chinas-public-procurement-protectionism/](https://ecipe.org/publications/chinas-public-procurement-protectionism/).
[216](#_ednref216). Ibid.
[217](#_ednref217). Alexander Brown et al., “Investigating state support for China’s medical technology companies,” Mercator Institute for China Studies, November 20, 2023, [https://merics.org/en/report/investigating-state-support-chinas-medical-technology-companies](https://merics.org/en/report/investigating-state-support-chinas-medical-technology-companies).
[218](#_ednref218). Ibid.
[219](#_ednref219). NAICS Association, “336112 – Light Truck and Utility Vehicle Manufacturing.”
[220](#_ednref220). U.S. International Trade Commission, Commodity Translation Tool (NAICS to SITC code for 2022, accessed February 2026).
[221](#_ednref221). U.S. Census Bureau, County Business Patterns (NAICS 336112 from 2014 to 2023, accessed March 2026).
[222](#_ednref222). Ibid.
[223](#_ednref223). Ibid.
[224](#_ednref224). UN Comtrade Database, Trade Data (exports for all nations for NAICS 333111, accessed February 2026).
[225](#_ednref225). Ibid.
[226](#_ednref226). Ibid.
[227](#_ednref227). Usha C.V. Haley, “Putting the pedal to the metal” (Economic Policy Institute January 2012), [https://www.epi.org/publication/bp316-china-auto-parts-industry/](https://www.epi.org/publication/bp316-china-auto-parts-industry/).
[228](#_ednref228). NAICS Association, “333997 – Scale and Balance Manufacturing.”
[229](#_ednref229). NAICS Association, “NAICS Profile Page,” website, [https://www.naics.com/company-profile-page/?co=6411](https://www.naics.com/company-profile-page/?co=6411); “Service information: Avery Weigh-Tronix LLC,” document, [https://rsp.pca.state.mn.us/TEMPO_RSP/pages/getCOR.jsp?serviceId=69543](https://rsp.pca.state.mn.us/TEMPO_RSP/pages/getCOR.jsp?serviceId=69543).
[230](#_ednref230). U.S. International Trade Commission, Commodity Translation Tool (NAICS to SITC code for 2022, accessed February 2026).
[231](#_ednref231). U.S. Census of Bureau, County Business Patterns (NAICS 333997 from 2018 to 2023, accessed March 2026).
[232](#_ednref232). Ibid.
[233](#_ednref233). Ibid.
[234](#_ednref234). UN Comtrade Database, Trade Data (exports for all nations for NAICS 333111, accessed February 2026).
[235](#_ednref235). Ibid.
[236](#_ednref236). Ibid.
[237](#_ednref237). NAICS Association, “335311 - Power, Distribution, and Specialty Transformer Manufacturing.”
[238](#_ednref238). NAICS List, “Mississippi companies engaged in Power, Distribution, and Specialty Transformer Manufacturing with NAICS 335311.”
[239](#_ednref239). U.S. International Trade Commission, Commodity Translation Tool (NAICS to SITC code for 2022, accessed February 2026).
[240](#_ednref240). U.S. Census Bureau, County Business Patterns (NAICS 335311 from 2018 to 2023, accessed March 2026).
[241](#_ednref241). Ibid.
[242](#_ednref242). Ibid.
[243](#_ednref243). UN Comtrade Database, Trade Data (exports for all nations for NAICS 333111, accessed February 2026).
[244](#_ednref244). Ibid.
[245](#_ednref245). Ibid.
[246](#_ednref246). NAICS Association, “335932 - Noncurrent-Carrying Wiring Device Manufacturing.”
[247](#_ednref247). NAICS List, “Missouri companies engaged in Noncurrent-Carrying Wiring Device Manufacturing with NAICS 335932.”
[248](#_ednref248). U.S. International Trade Commission, Commodity Translation Tool (NAICS to SITC code for 2022, accessed February 2026).
[249](#_ednref249). U.S. Census Bureau, County Business Patterns (NAICS 335932 from 2015 to 2023, accessed March 2026).
[250](#_ednref250). Ibid.
[251](#_ednref251). Ibid.
[252](#_ednref252). UN Comtrade Database, Trade Data (exports for all nations for NAICS 333111, accessed February 2026).
[253](#_ednref253). Ibid.
[254](#_ednref254). Ibid.
[255](#_ednref255). NAICS Association, “331410 – Nonferrous Metal (except Aluminum) Smelting and Refining.”
[256](#_ednref256). NAICS List, “Montana companies engaged in Nonferrous Metal (except Aluminum) Smelting and Refining with NAICS 331410.”
[257](#_ednref257). U.S. International Trade Commission, Commodity Translation Tool (NAICS to SITC code for 2022, accessed February 2026).
[258](#_ednref258). U.S. Census Bureau, County Business Patterns (NAICS 331410 from 2016 to 2023, accessed March 2026).
[259](#_ednref259). Ibid.
[260](#_ednref260). UN Comtrade Database, Trade Data (exports for all nations for NAICS 333111, accessed February 2026).
[261](#_ednref261). Ibid.
[262](#_ednref262). “China’s Rare Earth Industry: Subsidies and State Control Over the Last Decade,” Rare Earth Exchanges, August 14, 2025, [https://rareearthexchanges.com/news/chinas-rare-earth-industry-subsidies-and-state-control-over-the-last-decade/](https://rareearthexchanges.com/news/chinas-rare-earth-industry-subsidies-and-state-control-over-the-last-decade/).
[263](#_ednref263). Ibid.
[264](#_ednref264). Ibid.
[265](#_ednref265). Ibid.
[266](#_ednref266). “China unveils plan to support growth of non-ferrous metals industry,” The State Council of The People’s Republic of China, September 28, 2025, [https://english.www.gov.cn/news/202509/28/content_WS68d92363c6d00ca5f9a06832.html](https://english.www.gov.cn/news/202509/28/content_WS68d92363c6d00ca5f9a06832.html).
[267](#_ednref267). NAICS Association, “333111 - Farm Machinery and Equipment Manufacturing.”
[268](#_ednref268). U.S. International Trade Commission, Commodity Translation Tool (NAICS to SITC code for 2022, accessed February 2026).
[269](#_ednref269). U.S. Census Bureau, County Business Patterns (NAICS 333111 from 2013 to 2023, accessed February 2026).
[270](#_ednref270). Ibid.
[271](#_ednref271). Ibid.
[272](#_ednref272). UN Comtrade Database, Trade Data (exports for all nations for NAICS 333111, accessed February 2026).
[273](#_ednref273). Ibid.
[274](#_ednref274). NAICS Association, “334511 - Search, Detection, Navigation, Guidance, Aeronautical, and Nautical System and Instrument Manufacturing.”
[275](#_ednref275). Ibid.
[276](#_ednref276). NAICS List, “Nevada companies engaged in Search, Detection, Navigation, Guidance, Aeronautical, and Nautical System and Instrument Manufacturing with NAICS 334511.”
[277](#_ednref277). U.S. International Trade Commission, Commodity Translation Tool (NAICS to SITC code for 2022, accessed February 2026).
[278](#_ednref278). U.S. Census Bureau, County Business Patterns (NAICS 334511 from 2018 to 2023, accessed February 2026).
[279](#_ednref279). Ibid.
[280](#_ednref280). UN Comtrade Database, Trade Data (exports for all nations for NAICS 334511, accessed February 2026).
[281](#_ednref281). Ibid.
[282](#_ednref282). NAICS Association, “334118 - Computer Terminal and Other Computer Peripheral Equipment Manufacturing.”
[283](#_ednref283). Ibid.
[284](#_ednref284). NAICS List, “New Hampshire companies engaged in Electronic Computer Manufacturing with NAICS 334118.”
[285](#_ednref285). U.S. International Trade Commission, Commodity Translation Tool (NAICS to SITC code for 2022, accessed February 2026).
[286](#_ednref286). U.S. Census Bureau, County Business Patterns (NAICS 334118 from 2013 to 2023, accessed February 2026).
[287](#_ednref287). UN Comtrade Database, Trade Data (exports for all nations for NAICS 334118, accessed February 2026).
[288](#_ednref288). Ibid.
[289](#_ednref289). UN Comtrade Database, Trade Data (exports for all nations for NAICS 334118, accessed February 2026).
[290](#_ednref290). NAICS Association, “325412 - Pharmaceutical Preparation Manufacturing.”
[291](#_ednref291). NAICS List, “New Jersey companies engaged in Pharmaceutical Preparation Manufacturing with NAICS 325412.”
[292](#_ednref292). U.S. International Trade Commission, Commodity Translation Tool (NAICS to SITC code for 2022, accessed February 2026).
[293](#_ednref293). UN Comtrade Database, Trade Data (exports for all nations for NAICS 325412, accessed February 2026).
[294](#_ednref294). Ibid.
[295](#_ednref295). Intel, “Intel in New Mexico,” [https://www.intel.com/content/www/us/en/corporate-responsibility/intel-in-new-mexico.html](https://www.intel.com/content/www/us/en/corporate-responsibility/intel-in-new-mexico.html).
[296](#_ednref296). Kim Vallez Quintana, “Sandia to Help Propel US Semiconductor Manufacturing,” *Sandia Lab News*, [https://www.sandia.gov/microelectronics/](https://www.sandia.gov/microelectronics/); Los Alamos National Laboratory, “New Centers Set To Transform Microelectronics Technologies” news release, February 4, 2025, [https://www.lanl.gov/media/news/0130-microelectronics-technologies](https://www.lanl.gov/media/news/0130-microelectronics-technologies).
[297](#_ednref297). U.S. Census Bureau (County Business Patterns 2018-2023, accessed April 1, 2026).
[298](#_ednref298). Popov, “China’s Chip Investment Falls in First Half of 2025 While Equipment Funding Surges: Report.”
[299](#_ednref299). U.S. Census Bureau (County Business Patterns 2023, accessed March 24, 2026); SIA, “Semiconductors in New Mexico,” 2022, [https://www.semiconductors.org/wp-content/uploads/2022/05/New-Mexico-2022.pdf](https://www.semiconductors.org/wp-content/uploads/2022/05/New-Mexico-2022.pdf).
[300](#_ednref300). Popov, “China’s Chip Investment Falls in First Half of 2025 While Equipment Funding Surges: Report.”
[301](#_ednref301). Blaugher et al., “Made in China 2025: Evaluating China’s Performance.”
[302](#_ednref302). Varadarajan et al., “Emerging Resilience in the Semiconductor Supply Chain.”
[303](#_ednref303). UN Comtrade Database (Trade Data: Imports and Exports, HS 8451 and 8542, accessed January 5, 2026).
[304](#_ednref304). Ana Swanson and Paul Mozur, “U.S. Takes Aim at China’s Production of Essential Computer Chips,” *The New York Times*, December 23, 2024, [https://www.nytimes.com/2024/12/23/business/economy/us-china-semiconductor-legacy-chips.html](https://www.nytimes.com/2024/12/23/business/economy/us-china-semiconductor-legacy-chips.html).
[305](#_ednref305). Ibid.
[306](#_ednref306). UN Comtrade Database (Trade Data: Imports and Exports, HS 8451 and 8542, accessed January 5, 2026).
[307](#_ednref307). Ezell, “How Innovative is China in Semiconductors?” (ITIF, August 19, 2024).
[308](#_ednref308). Chiao, “China and US bolster semiconductor independence as Taiwan’s foundry capacity share projected to decline to 41% by 2027, says Trendforce.”
[309](#_ednref309). Ezell, “How Innovative is China in Semiconductors?” (ITIF, August 19, 2024).
[310](#_ednref310). Chiao, news release, *Trendforce*, [https://www.trendforce.com/presscenter/news/20231214-11959.html?utm](https://www.trendforce.com/presscenter/news/20231214-11959.html?utm).
[311](#_ednref311). Ardi Janjeva et al., “China’s Quest for Semiconductor Self-Sufficiency” (Centre for Emerging Technology and Security, December 4, 2024), [https://cetas.turing.ac.uk/publications/chinas-quest-semiconductor-self-sufficiency](https://cetas.turing.ac.uk/publications/chinas-quest-semiconductor-self-sufficiency).
[312](#_ednref312). NAICS Association, “334111 - Electronic Computer Manufacturing.”
[313](#_ednref313). NAICS List, “New York companies engaged in Electronic Computer Manufacturing with NAICS 334111.”
[314](#_ednref314). U.S. International Trade Commission, Commodity Translation Tool (NAICS to SITC code for 2022, accessed February 2026).
[315](#_ednref315). UN Comtrade Database, Trade Data (exports for all nations for NAICS 334111, accessed February 2026).
[316](#_ednref316). NAICS Association, “335921 - Fiber Optic Cable Manufacturing.”
[317](#_ednref317). NAICS List, “North Carolina companies engaged in Fiber Optic Cable Manufacturing with NAICS 335921.”
[318](#_ednref318). U.S. International Trade Commission, Commodity Translation Tool (NAICS to SITC code for 2022, accessed February 2026).
[319](#_ednref319). UN Comtrade Database, Trade Data (exports for all nations for NAICS 335921, accessed February 2026).
[320](#_ednref320). NAICS Association, “333111 – Farm Machinery and Equipment Manufacturing.”
[321](#_ednref321). NAICS List, “North Dakota companies engaged in Farm Machinery and Equipment Manufacturing with NAICS 333111.”
[322](#_ednref322). U.S. International Trade Commission, Commodity Translation Tool (NAICS to SITC code for 2022, accessed February 2026).
[323](#_ednref323). UN Comtrade Database, Trade Data (exports for all nations for NAICS 333111, accessed February 2026).
[324](#_ednref324). Ibid.
[325](#_ednref325). Ministry of Agriculture and Rurak affairs of the People’s Republic of China, “China expands subsidy program for replacing old agricultural machinery,” February 26, 2025, [https://english.moa.gov.cn/news_522/202502/t20250227_301464.html](https://english.moa.gov.cn/news_522/202502/t20250227_301464.html)
[326](#_ednref326). Ibid.
[327](#_ednref327). NAICS Association, “333992 - Welding and Soldering Equipment Manufacturing.”
[328](#_ednref328). NAICS List, “Ohio companies engaged in Fabricated Structural Metal Manufacturing with NAICS 333992.”
[329](#_ednref329). U.S. International Trade Commission, Commodity Translation Tool (NAICS to SITC code for 2022, accessed February 2026).
[330](#_ednref330). UN Comtrade Database, Trade Data (exports for all nations for NAICS 333992, accessed February 2026).
[331](#_ednref331). Internation Trade Administration, “China Industrial Equipment Upgrading,” July 10, 2024, [https://www.trade.gov/market-intelligence/china-industrial-equipment-upgrading](https://www.trade.gov/market-intelligence/china-industrial-equipment-upgrading).
[332](#_ednref332). U.S.- China Economic and Security Review Commission, “Made in China 2025: Evaluating China’s Performance,” November 14, 2025, [https://www.uscc.gov/research/made-china-2025-evaluating-chinas-performance#:~:text=MIC2025%20aimed%20to%20move%20China,and%20high%2Dperformance%20medical%20devices](https://www.uscc.gov/research/made-china-2025-evaluating-chinas-performance#:~:text=MIC2025%20aimed%20to%20move%20China,and%20high%2Dperformance%20medical%20devices)..
[333](#_ednref333). Ibid.
[334](#_ednref334). NAICS Association, “332410 - Power Boiler and Heat Exchanger Manufacturing.”
[335](#_ednref335). NAICS List, “Oklahoma companies engaged in Fabricated Structural Metal Manufacturing with NAICS 332410.”
[336](#_ednref336). U.S. International Trade Commission, Commodity Translation Tool (NAICS to SITC code for 2022, accessed February 2026).
[337](#_ednref337). UN Comtrade Database, Trade Data (exports for all nations for NAICS 333111, accessed February 2026).
[338](#_ednref338). Oreate AI, “In-Depth Research Report on Boiler Policies and Subsidy Systems in China’s Border Regions for 2024,” January 7, 2026, [https://www.oreateai.com/blog/indepth-research-report-on-boiler-policies-and-subsidy-systems-in-chinas-border-regions-for-2024/ae971ed46b3e8f726dbf064a5378ce89](https://www.oreateai.com/blog/indepth-research-report-on-boiler-policies-and-subsidy-systems-in-chinas-border-regions-for-2024/ae971ed46b3e8f726dbf064a5378ce89).
[339](#_ednref339). Quantherm, “China boiler renewal and heat pump replacement,” July 25, 2024, [https://www.quantherm.com/news/1078/](https://www.quantherm.com/news/1078/).
[340](#_ednref340). Ibid.
[341](#_ednref341). U.S. Census Bureau (County Business Patterns 2018-2023, accessed April 1, 2026).
[342](#_ednref342). “Semiconductor Companies in Oregon,” *Chips ETC*, [https://www.chipsetc.com/semiconductor-companies-in-oregon.html](https://www.chipsetc.com/semiconductor-companies-in-oregon.html).
[343](#_ednref343). “The Future’s CHIPS Are Made in Oregon,” Business Oregon, [https://www.oregon.gov/biz/programs/semiconductor_chips/pages/default.aspx](https://www.oregon.gov/biz/programs/semiconductor_chips/pages/default.aspx).
[344](#_ednref344). Ibid.
[345](#_ednref345). Popov, “China’s Chip Investment Falls in First Half of 2025 While Equipment Funding Surges: Report.”
[346](#_ednref346). Ibid.
[347](#_ednref347). Blaugher et al., “Made in China 2025: Evaluating China’s Performance.”
[348](#_ednref348). Varadarajan et al., “Emerging Resilience in the Semiconductor Supply Chain.”
[349](#_ednref349). UN Comtrade Database (Trade Data: Imports and Exports, HS 8451 and 8542, accessed January 5, 2026).
[350](#_ednref350). Ana Swanson and Paul Mozur, “U.S. Takes Aim at China’s Production of Essential Computer Chips,” *The New York Times*, December 23, 2024, [https://www.nytimes.com/2024/12/23/business/economy/us-china-semiconductor-legacy-chips.html](https://www.nytimes.com/2024/12/23/business/economy/us-china-semiconductor-legacy-chips.html).
[351](#_ednref351). Ibid.
[352](#_ednref352). UN Comtrade Database (Trade Data: Imports and Exports, HS 8451 and 8542, accessed January 5, 2026).
[353](#_ednref353). Ibid.
[354](#_ednref354). Ezell, “How Innovative is China in Semiconductors?” (ITIF, August 19, 2024).
[355](#_ednref355). Chiao, “China and US bolster semiconductor independence as Taiwan’s foundry capacity share projected to decline to 41% by 2027, says Trendforce.”
[356](#_ednref356). Ezell, “How Innovative is China in Semiconductors?” (ITIF, August 19, 2024).
[357](#_ednref357). Chiao, news release, *Trendforce*, [https://www.trendforce.com/presscenter/news/20231214-11959.html?utm](https://www.trendforce.com/presscenter/news/20231214-11959.html?utm).
[358](#_ednref358). NAICS Association, “335129 – Other Lighting Equipment Manufacturing.”
[359](#_ednref359). Spring City, website, [https://streetlighting.springcity.com/luminaires.html](https://streetlighting.springcity.com/luminaires.html); Penn Globe Lighting Design and Manufacturing, website, [https://www.pennglobe.com/products](https://www.pennglobe.com/products); Govcon in a Box, “Deval Corporation,” website, [https://www.govconinabox.com/explore/contractors/profile/deval-corporation-ls4pm7](https://www.govconinabox.com/explore/contractors/profile/deval-corporation-ls4pm7).
[360](#_ednref360). U.S. International Trade Commission, Commodity Translation Tool (NAICS to SITC code for 2022, accessed February 2026).
[361](#_ednref361). UN Comtrade Database, Trade Data (exports for all nations for NAICS 333111, accessed February 2026).
[362](#_ednref362). NAICS Association, “332439 - Other Metal Container Manufacturing.”
[363](#_ednref363). NAICS List, “Rhode Island companies engaged in Other Metal Container Manufacturing with NAICS 332439.”
[364](#_ednref364). U.S. International Trade Commission, Commodity Translation Tool (NAICS to SITC code for 2022, accessed February 2026).
[365](#_ednref365). U.S. Census Bureau, County Business Patterns (NAICS 332439 from 2014 to 2023, accessed March 25, 2026).
[366](#_ednref366). Ibid.
[367](#_ednref367). Ibid.
[368](#_ednref368). UN Comtrade Database, Trade Data (exports for all nations for NAICS 332439, accessed March 2026).
[369](#_ednref369). Ibid.
[370](#_ednref370). Ibid.
[371](#_ednref371). NAICS Association, “332991 - Ball and Roller Bearing Manufacturing.”
[372](#_ednref372). NAICS List, “South Carolina companies engaged in Ball and Roller Bearing Manufacturing with NAICS 332991.”
[373](#_ednref373). U.S. International Trade Commission, Commodity Translation Tool (NAICS to SITC code for 2022, accessed March 2026).
[374](#_ednref374). U.S. International Trade Commission, “Tapered Roller Bearings from China – Investigation No. 731-TA-344 (Fifth Review),” March 2024, [https://www.usitc.gov/publications/701_731/pub5497.pdf](https://www.usitc.gov/publications/701_731/pub5497.pdf).
[375](#_ednref375). Ibid.
[376](#_ednref376). Ibid.
[377](#_ednref377). NAICS Association, “334416 - Capacitor, Resistor, Coil, Transformer, and Other Inductor Manufacturing.”
[378](#_ednref378). NAICS List, “South Dakota companies engaged in Capacitor, Resistor, Coil, Transformer, and Other Inductor Manufacturing with NAICS 334416.”
[379](#_ednref379). U.S. International Trade Commission, Commodity Translation Tool (NAICS to SITC code for 2022, accessed February 2026).
[380](#_ednref380). “Two manufacturers select Sioux Falls to expand,” Sioux Falls Development Foundation, March 29, 2023, [https://siouxfallsdevelopment.com/two-manufacturers-select-sioux-falls-to-expand/](https://siouxfallsdevelopment.com/two-manufacturers-select-sioux-falls-to-expand/).
[381](#_ednref381). NAICS Association, “335220 - Major Household Appliance Manufacturing.”
[382](#_ednref382). NAICS List, “Tennessee companies engaged in Small Electrical Appliance Manufacturing with NAICS 335220.”
[383](#_ednref383). U.S. International Trade Commission, Commodity Translation Tool (NAICS to SITC code for 2022, accessed February 2026).
[384](#_ednref384). UN Comtrade Database, Trade Data (exports for all nations for NAICS 333111, accessed February 2026).
[385](#_ednref385). Fei Guo et al., “Cost-effective subsidy incentives for room air conditioners in China: An analysis based on a McFadden-type discrete choice model,” Energy Policy 110 (2017), 375-385, [https://www.sciencedirect.com/science/article/abs/pii/S0301421517305426](https://www.sciencedirect.com/science/article/abs/pii/S0301421517305426).
[386](#_ednref386). Ibid.
[387](#_ednref387). Ibid.
[388](#_ednref388). Fan Feifei, “Trade-in push to boost sales of green energy devices,” *China Daily*, January 14, 2026, [https://www.chinadaily.com.cn/a/202601/14/WS69670345a310d6866eb33a6d.html](https://www.chinadaily.com.cn/a/202601/14/WS69670345a310d6866eb33a6d.html).
[389](#_ednref389). NAICS Association, “335110 – Electric Lamp Bulb and Part Manufacturing.”
[390](#_ednref390). “NAICS 335110 - Electric Lamp Bulb and Parts Manufacturing,” Encylcopedia.com, website, [https://www.encyclopedia.com/manufacturing/news-wires-white-papers-and-books/naics-335110-electric-lamp-bulb-and-parts-manufacturing](https://www.encyclopedia.com/manufacturing/news-wires-white-papers-and-books/naics-335110-electric-lamp-bulb-and-parts-manufacturing).
[391](#_ednref391). U.S. International Trade Commission, Commodity Translation Tool (NAICS to SITC code for 2022, accessed February 2026).
[392](#_ednref392). U.S. Census Bureau, County Business Patterns (NAICS 335110 from 2018 to 2023, accessed April 2026).
[393](#_ednref393). Ibid.
[394](#_ednref394). Ibid.
[395](#_ednref395). UN Comtrade Database, Trade Data (exports for all nations for NAICS 325110, accessed February 2026).
[396](#_ednref396). Ibid.
[397](#_ednref397). Ibid.
[398](#_ednref398). NAICS Association, “333316 - Photographic and Photocopying Equipment Manufacturing.”
[399](#_ednref399). Cordin Scientific Imaging, website, [https://cordin.com/](https://cordin.com/); “Photographic Processing Equipment,” Manta, website, [https://www.manta.com/mb_45_A402B02S_45/photographic_processing_equipment/utah](https://www.manta.com/mb_45_A402B02S_45/photographic_processing_equipment/utah).
[400](#_ednref400). U.S. International Trade Commission, Commodity Translation Tool (NAICS to SITC code for 2022, accessed February 2026).
[401](#_ednref401). UN Comtrade Database, Trade Data (exports for all nations for NAICS 333316, accessed March 2026).
[402](#_ednref402). Ibid.
[403](#_ednref403). NAICS Association, “333997 – Scale and Balance Manufacturing.”
[404](#_ednref404). Logical Machines, website, [https://logicalmachines.com/what-are-logical-machines/](https://logicalmachines.com/what-are-logical-machines/); “Companies for NAICS Code 333997 - Scale and balance manufacturing,” SIC Code, website, [https://siccode.com/search-business/naics%3A333997](https://siccode.com/search-business/naics%3A333997).
[405](#_ednref405). U.S. International Trade Commission, Commodity Translation Tool (NAICS to SITC code for 2022, accessed February 2026).
[406](#_ednref406). NAICS Association, “333991 - Power-Driven Handtool Manufacturing.”
[407](#_ednref407). NAICS List, “Virginia companies engaged in Power-Driven Handtool Manufacturing with NAICS 333991.”
[408](#_ednref408). U.S. International Trade Commission, Commodity Translation Tool (NAICS to SITC code for 2022, accessed February 2026).
[409](#_ednref409). UN Comtrade Database, Trade Data (exports for all nations for NAICS 333991, accessed March 2026).
[410](#_ednref410). NAICS Association, “336411 – Aircraft Manufacturing.”
[411](#_ednref411). NAICS List, “Washington companies engaged in Aircraft Manufacturing with NAICS 336411.”
[412](#_ednref412). U.S. International Trade Commission, Commodity Translation Tool (NAICS to SITC code for 2022, accessed February 2026).
[413](#_ednref413). U.S. Census Bureau, County Business Patterns (NAICS 332439 from 2014 to 2023, accessed March 25, 2026).
[414](#_ednref414). UN Comtrade Database, Trade Data (exports for all nations for NAICS 336411, accessed March 2026).
[415](#_ednref415). Ibid.
[416](#_ednref416). Ibid.
[417](#_ednref417). Dou Shicong, “China’s C919 Jet Maker Get USD6.2 Billion Capital Injection From State-Owned Backers,” *YiCai Global*, November 27, 2025, [https://www.yicaiglobal.com/news/comac-receives-usd62-billion-capital-injection-from-eight-state-owned-shareholders](https://www.yicaiglobal.com/news/comac-receives-usd62-billion-capital-injection-from-eight-state-owned-shareholders).
[418](#_ednref418). Ibid.
[419](#_ednref419). Kevin Gawora, “Fact of the Week: China Has Provided Its State-Owned National Champion in Commercial Aviation as Much as $72 Billion in Development Subsidies” (ITIF, February 8, 2021), [https://itif.org/publications/2021/02/08/fact-week-china-has-provided-its-state-owned-national-champion-commercial/](https://itif.org/publications/2021/02/08/fact-week-china-has-provided-its-state-owned-national-champion-commercial/); Scott Kennedy, “China’s COMAC: An Aerospace Minor League,” Center for Strategic and International Studies, December 7, 2020, [https://csis-website-prod.s3.amazonaws.com/s3fs-public/201204_Kennedy_COMAC.pdf](https://csis-website-prod.s3.amazonaws.com/s3fs-public/201204_Kennedy_COMAC.pdf).
[420](#_ednref420). Ibid.
[421](#_ednref421). NAICS Association, “333131 – Mining Machinery and Equipment Manufacturing.”
[422](#_ednref422). NAICS List, “West Virginia companies engaged in Surface Coal Mining with NAICS 333131.”
[423](#_ednref423). U.S. International Trade Commission, Commodity Translation Tool (NAICS to SITC code for 2022, accessed February 2026).
[424](#_ednref424). UN Comtrade Database, Trade Data (exports for all nations for NAICS 333111, accessed February 2026).
[425](#_ednref425). Ibid.
[426](#_ednref426). Richard Bridle et al., “Subsidies to Coal Production in China” (International Institute for Sustainable Development, December 2015), [https://www.iisd.org/publications/report/subsidies-coal-production-china](https://www.iisd.org/publications/report/subsidies-coal-production-china).
[427](#_ednref427). Daniel, “China’s Rare Earth Industry: Subsidies and State Control Over the Last Decade,” Rare Earth Exchange, August 14, 2025, [https://rareearthexchanges.com/news/chinas-rare-earth-industry-subsidies-and-state-control-over-the-last-decade/](https://rareearthexchanges.com/news/chinas-rare-earth-industry-subsidies-and-state-control-over-the-last-decade/).
[428](#_ednref428). “China: Government subsidy changes for listed company Zhengzhou Coal Mining Machinery Group Co., Ltd in year 2019,” Global Trade Alert, [https://globaltradealert.org/state-act/54927-china-government-subsidy-changes-for-listed-company-zhengzhou-coal-mining-machinery-group-co-ltd-in-year-2019](https://globaltradealert.org/state-act/54927-china-government-subsidy-changes-for-listed-company-zhengzhou-coal-mining-machinery-group-co-ltd-in-year-2019).
[429](#_ednref429). Shubham Padhi, “China Mining Machinery Market (2025-2031) Outlook | Growth, Companies, Size, Revenue, Value, Analysis, Trends, Industry, Share & Forecast,” 6wresearch, [https://www.6wresearch.com/industry-report/china-mining-machinery-market](https://www.6wresearch.com/industry-report/china-mining-machinery-market).
[430](#_ednref430). “Shandong Mining Machinery Group Co., Ltd (002526.SZ): PESTLE Analysis [Dec-2025 Updated],” [https://www.dcfmodeling.com/products/002526sz-pestel-analysis](https://www.dcfmodeling.com/products/002526sz-pestel-analysis).
[431](#_ednref431). NAICS Association, “333997 – Scale and Balance Manufacturing.”
[432](#_ednref432). “Rice Lake Weighing Systems, Inc.,” Buzzfile, [https://www.buzzfile.com/business/Rice-Lake-Weighing-Systems%2C-Inc.-775-575-1023](https://www.buzzfile.com/business/Rice-Lake-Weighing-Systems%2C-Inc.-775-575-1023); “All PPP Loans in Fond du Lac County, WI,” PPP Directory, [https://ppp.directory/wisconsin/fond-du-lac-county](https://ppp.directory/wisconsin/fond-du-lac-county); “NAICS Profile Page for Digi-Star Holdings Inc,” NAICS Association, [https://www.naics.com/company-profile-page/?co=624](https://www.naics.com/company-profile-page/?co=624); Rice Lake Weighing Systems, website, [https://www.ricelake.com/](https://www.ricelake.com/).
[433](#_ednref433). U.S. International Trade Commission, Commodity Translation Tool (NAICS to SITC code for 2022, accessed February 2026).
[434](#_ednref434). UN Comtrade Database, Trade Data (exports for all nations for NAICS 333111, accessed February 2026).
[435](#_ednref435). Ibid.
[436](#_ednref436). Ibid.
[437](#_ednref437). NAICS Association, “325180 – Other basic Inorganic Chemical Manufacturing.”
[438](#_ednref438). “Imerys Perlite USA, Inc.,” Buzzfile, website, [https://www.buzzfile.com/business/Imerys-Perlite-Usa%2C-Inc.-307-875-8505](https://www.buzzfile.com/business/Imerys-Perlite-Usa%2C-Inc.-307-875-8505); “Sisecam Wyoming LLC,” Buzzfile, website, [https://www.buzzfile.com/business/Sisecam-Wyoming-LLC-307-875-2600](https://www.buzzfile.com/business/Sisecam-Wyoming-LLC-307-875-2600); “Solvay Chemicals, Inc.,” Buzzfile, website, [https://www.buzzfile.com/business/Solvay-Soda-Ash-307-872-6500](https://www.buzzfile.com/business/Solvay-Soda-Ash-307-872-6500).
[439](#_ednref439). U.S. International Trade Commission, Commodity Translation Tool (NAICS to SITC code for 2022, accessed February 2026).
[440](#_ednref440). UN Comtrade Database, Trade Data (exports for all nations for NAICS 333111, accessed February 2026).
[441](#_ednref441). Ibid.
[442](#_ednref442). Robert Atkinson, “How Innovative Is China in the Chemicals Industry?” (ITIF, April 2024), [https://itif.org/publications/2024/04/15/how-innovative-is-china-in-the-chemicals-industry/](https://itif.org/publications/2024/04/15/how-innovative-is-china-in-the-chemicals-industry/).
[443](#_ednref443). Ibid.
[444](#_ednref444). “China’s Chemical Industry: Flying Blind?” (ATKearney), [https://www.kearney.com/documents/291362523/291364877/Chinas-Chemical-Industry---Flying-Blind.pdf/a3bb9398-fb58-1096-46c1-d518e0b19665](https://www.kearney.com/documents/291362523/291364877/Chinas-Chemical-Industry---Flying-Blind.pdf/a3bb9398-fb58-1096-46c1-d518e0b19665).
[445](#_ednref445). Atkinson, “How Innovative Is China in the Chemicals Industry?”
[446](#_ednref446). Ibid.
[447](#_ednref447). See [https://itif.org/publication-brands/power-industries](https://itif.org/publication-brands/power-industries) for a series of policy reports on how to respond to the China challenge.
---
*Source: Information Technology & Innovation Foundation (ITIF)*
*URL: https://itif.org/publications/2026/06/01/targeted-pressure-how-chinese-manufacturing-competition-impacts-us-states/*