
Short Circuited: Electrical Engineering Degrees in the United States
Innovation in electrical engineering (EE) powers the U.S. economy, yet the share of students graduating with EE degrees has declined. This reduces EE innovation and production in the United States. Congress should act.
KEY TAKEAWAYS
Key Takeaways
Contents
Electrical Engineering Degrees in the United States 2
Who Holds Electrical Engineering Degrees in the United States? 4
Institutions Awarding Electrical Engineering Degrees 10
Why Are Electrical Engineering Graduation Rates Disappointing? 12
Introduction
Many areas of science and engineering help power innovation, growth, and competitiveness, but electrical engineering (EE) is one of the most critical, given the importance of electronics and computing. This is why it is concerning that U.S. bachelor’s, master’s, and doctorate EE degrees have declined as a share of all degrees, while the number of American citizens and permanent residents obtaining EE degrees has grown only slightly.
Moreover, the CHIPS and Science Act will likely lead to an increase in the demand for EE jobs. If the United States wants to fill these and future jobs, it will need to produce more graduates in EE. In addition, if the United States wishes to outcompete China in advanced industries, it will require strong EE capabilities. Absent changes in policy and administration of research universities to generate more EE degrees, the United States will likely continue to fall behind in EE-related industries.
Electrical Engineering Degrees in the United States
In 2020, U.S. universities awarded 29,860 EE bachelor’s, master’s, and doctorate degrees.[1] These accounted for about 1 percent of total degrees awarded.[2]
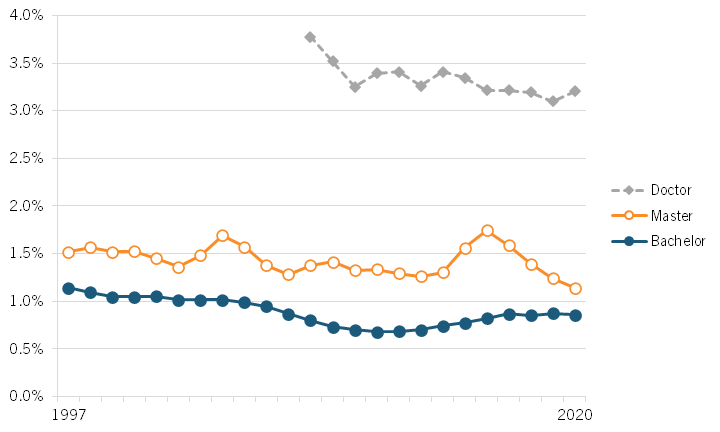
Moreover, EE degrees awarded as a share of all degrees have declined. From 1997 to 2020, bachelor’s EE degrees awarded declined from 1.1 percent to 0.9 percent of all bachelor’s degrees.[3] Master’s degrees declined from 1.5 percent to 1.1 percent.[4] And from 2008 to 2020, doctorate research degrees’ share declined from 3.8 percent to 3.2 percent.[5] (See figure 1.) In other words, EE degrees are not keeping up with other majors.
Figure 1: Electrical, electronics, and communications engineering degrees awarded as a share of all degrees[6]
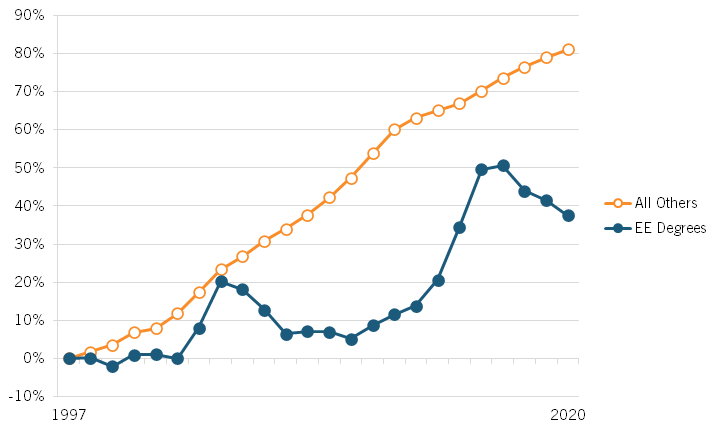
From 1997 to 2020, all other bachelor’s and master’s degrees conferred rose 81.1 percent, while EE degrees only rose 37.5 percent.[7] (See figure 2.) As a result, the growth in the population ages 18 to 30 holding EE degrees in the United States has fallen behind all other degrees in the last decades. From 2009 to 2021, the U.S. population ages 18 to 30 holding EE degrees rose only 22.1 percent compared with 35.8 percent for all other degrees.[8] In other words, the young adults that will drive the economy in the coming years are studying something other than EE.
Figure 2: Percentage change in the number of bachelor’s and master’s degrees conferred in electrical, electronics, and communications engineering vs. all other bachelor’s and master’s degrees[9]
Box 1: U.S. Engineering Degree International Standing
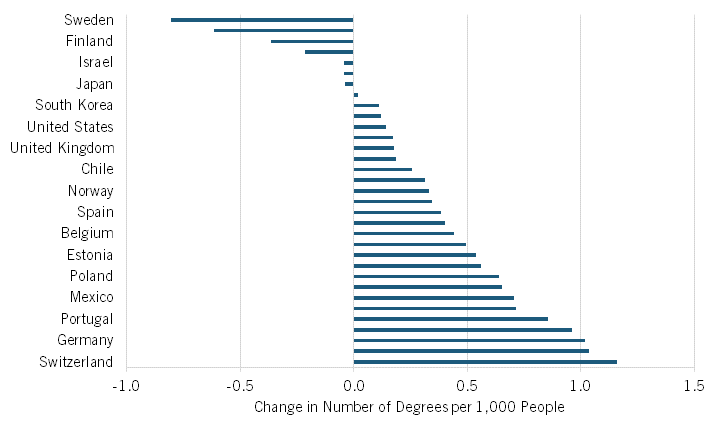
The United States is falling behind many nations in EE degrees. From 2005 to 2015, the United States’ share of engineering degrees per 1,000 people ages 15 to 64 grew more slowly than for many other nations. In that period, the United States grew 0.14 engineering degrees per 1,000 people ages 15 to 64—and from 0.48 to 0.63 engineering degrees per 1,000 people.[10] In contrast, Switzerland’s engineering degrees per 1,000 people ages 15 to 64 grew 1.16 degrees, Germany’s increased 1.02, the United Kingdom’s grew 0.18, and China’s grew 0.65.[11] The United States did outpace 10 of 33 countries, such as Australia, South Korea, and Japan.[12] (See figure 3.)
Figure 3: Growth in engineering degrees per 1,000 people (2005–2015)[13]
Who Holds Electrical Engineering Degrees in the United States?
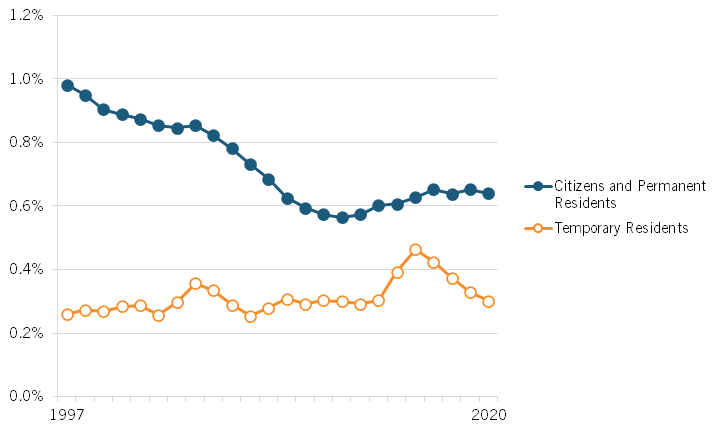
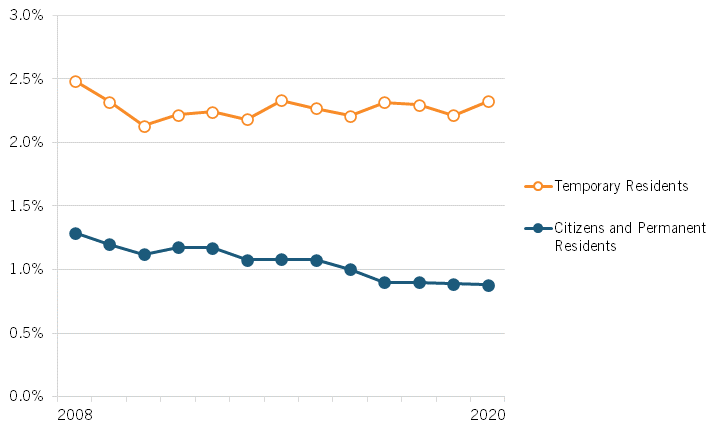
Not only are a declining share of students graduating with EE degrees, but the decline is even more significant for U.S. citizens and permanent residents. From 1997 to 2020, EE bachelor’s degrees awarded as a share of all degrees for U.S. citizens and permanent residents declined from 1 percent to 0.7 percent, while the share for temporary residents remained a steady 0.1 percent.[14] The share of EE master’s degrees awarded to U.S. citizens and permanent residents declined from 0.9 percent to 0.4 percent, while the share for temporary residents rose from 0.6 percent to 0.7 percent.[15] In other words, the ratio of domestic to foreign EE master’s degrees awarded went from 1.5 to 0.57. (See figure 4.)
Figure 4: Bachelor’s and master’s degrees awarded in electrical, electronics, and communications engineering as a share of all degrees, by citizenship status[16]
This matters for two reasons. First, many jobs in EE relate to military or other national security application areas that require the holder to be a U.S. citizen. Second, many foreign students who obtain EE degrees here return to their home nation, boosting their domestic industry, not America’s. This is partially because of U.S. immigration rules regarding STEM (science, technology, engineering, and math) workers.
According to the National Science Foundation (NSF), 77 percent of international students want to stay and work in the United States after completing their Optional Training Program, which lets eligible international students and graduates work for one to three years in the United States.[17] However, only 46 percent are able to stay, meaning 54 percent of international graduates return to their home countries.[18] One reason many graduates return home is the challenging U.S. immigration process.[19] FWD.us found that “on average over the next decade, as many as 100,000 international student graduates each year—including 66,000 in business management, health, and STEM-related fields—would like to stay and work in the U.S. for the long term if a straightforward process for permanent residency were available to them.”[20]
From 2008 to 2020, the share of EE research doctorate degrees awarded to U.S. citizens and permanent residents showed similar trends. The share of doctorate degrees awarded to both groups declined from 1.3 percent of all degrees to 0.9 percent. Although the share for temporary residents also declined, a larger share of EE degrees was awarded to them, meaning their decline still resulted in more engineering graduates that are temporary residents than U.S. citizens.[21] (See figure 5.) In other words, a smaller share of U.S. citizens is choosing to pursue a Ph.D. EE degree compared with other majors. Moreover, a good portion of the highest level of EE degrees goes to temporary residents who are more likely to take their knowledge to a foreign country rather than stay and contribute to the U.S. economy.
Figure 5: Doctorate degrees awarded in electrical, electronics, and communications engineering research as a share of all doctoral degrees, by citizenship status[22]
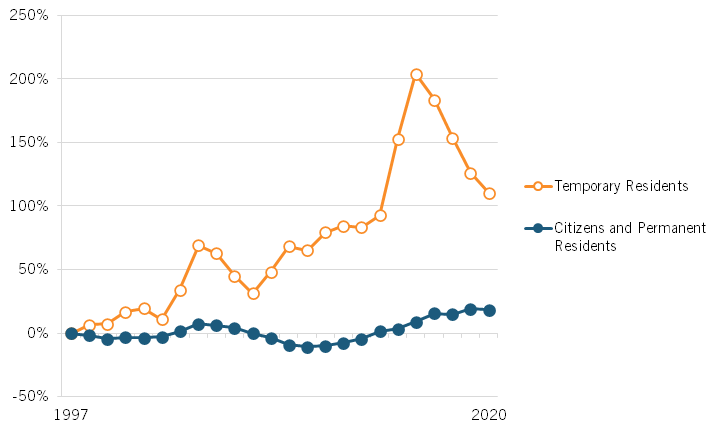
The share of temporary residents pursuing EE degrees has increased. From 1997 to 2020, the number of EE bachelor’s and master’s degrees awarded to U.S. citizens and permanent residents only grew 18.2 percent compared with a 110.4 percent growth for temporary residents.[23] (See figure 6.) The disparity would be even more pronounced if President Trump’s immigration restrictions were not considered.[24]
Figure 6: Growth in bachelor’s and master’s degrees awarded in electrical, electronics, and communications engineering since 1997, by citizenship status[25]
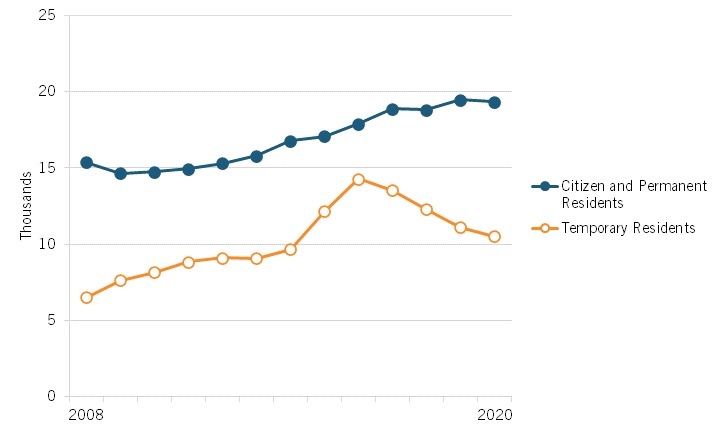
The number of U.S. citizens and permanent residents pursuing EE degrees continues to grow more slowly than that of temporary residents. From 2008 to 2020, the number of U.S. citizens pursuing an EE bachelor’s, master’s, or doctorate degree rose from 15,362 to 19,331—a 25.8 percent growth.[26] In contrast, the number of temporary citizens pursuing an EE degree grew 61.6 percent.[27] (See figure 7.)
Figure 7: Electrical, electronics, and communications engineering degrees awarded[28]
The slow growth of EE degrees awarded to U.S. citizens and permanent residents means the United States will increasingly rely on foreign nationals to stay in the country after graduation to power some of its most crucial technologies. Although data is limited for degree levels below a Ph.D., the Center for Security and Emerging Technology found that “roughly 77 percent of the more than 178,000 international STEM Ph.D. graduates from U.S. universities between 2000 and 2015 were still living in the country.”[29] Moreover, they found that the United States’ retention rate of international Ph.D. STEM graduates has not fallen below 73 percent since 2004.[30]
Even at the master’s degree level, many international STEM graduates choose to stay and work in the United States. According to the Pew Research Center, 34 percent of all authorized Optional Practical Training (OPT) enrollees were STEM graduates with master’s degrees.[31] Moreover, 27 percent of these master’s degree graduates staying in the United States studied engineering, making this area of study the most popular among OPT participants with master’s degrees.
The United States’ retention rate of international Ph.D. STEM graduates has not fallen below 73 percent since 2004.
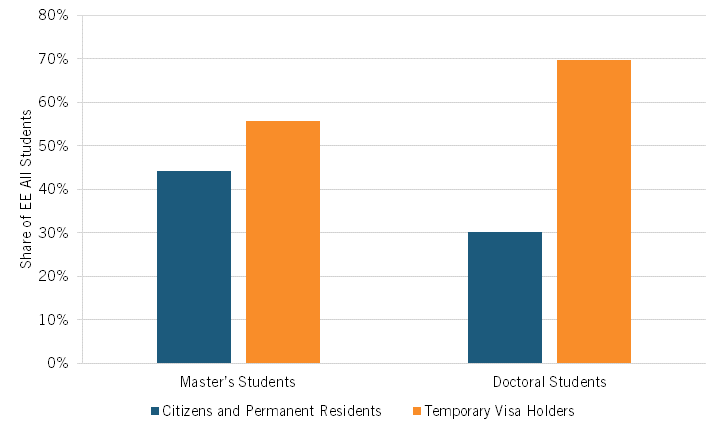
The trajectory of EE degrees awarded to U.S. citizens is not promising. In 2021, more foreign nationals pursued EE graduate degrees than did U.S. citizens and permanent residents.[32] At the master’s degree level, 55.7 percent of EE students were temporary visa holders.[33] And only 30.3 percent of EE Ph.D. students were U.S. citizens or permanent residents, meaning some of the most skilled electrical engineers to graduate in the coming years could leave the United States.[34] (See figure 8.)
Figure 8: Graduate students in electrical, electronics, communications and computer engineering by citizenship status (2021)[35]
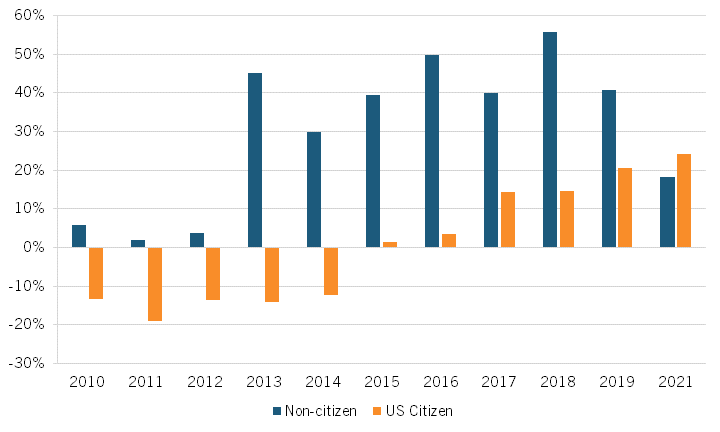
The United States is increasingly relying on non-U.S. citizens with EE degrees. Since 2009, the growth in non-U.S. citizens ages 18 to 30 in the United States holding an EE degree has outpaced the growth of U.S. citizens every year, except in 2021.[36] However, the data for 2021 is skewed due to the COVID-19 pandemic and countries, including the United States, only recently opening their borders. From 2009 to pre-pandemic 2019, non-U.S. citizens ages 18 to 30 holding an EE degree in the United States rose 40.7 percent compared with 20.5 percent for U.S. citizens.[37] (See figure 9.)
Moreover, more non-U.S. citizens ages 18 to 30 hold graduate EE degrees than do U.S. citizens since 2009—except in 2012, 2017, and 2019 for doctorate degrees.[38] In other words, the United States is shifting its workforce with EE degrees toward non-U.S. citizens. From 2009 to 2019, the share of U.S. citizens ages 18 to 30 holding EE degrees declined from 65.5 percent to 62 percent.[39]
Figure 9: Change in electrical, electronics, and communications engineering degrees since 2009, ages 18–30[40]
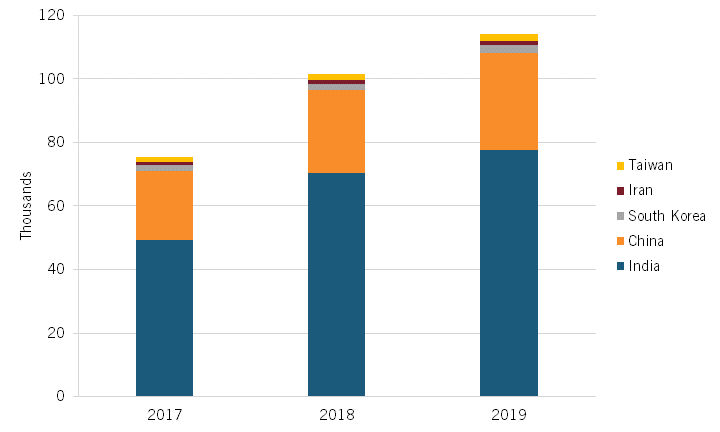
In particular, the United States increasingly relies on EE graduate students from India and China (and to a much lesser extent Iran, Taiwan, and South Korea). From 2017 to 2019, STEM students from these countries studying in the United States had the highest number of authorizations for the STEM Optional Practical Training Program (STEM OPT), which allows foreign nationals to continue employment in the United States for an additional 24 months after completing their OPT stay.[41] India has consistently ranked the highest in the number of applicants, making up 57.2 percent of STEM OPT authorizations in 2019.[42] China also consistently ranks second in the number of STEM OPT authorizations, making up 22.3 percent in 2019.[43] (See figure 10.)
Moreover, STEM OPT and employment authorizations have also grown at an increasing rate since 2008, rising from an increase of 2,128 authorizations from 2008 to 2009 to an increase of 63,906 from 2019 to 2020.[44] In other words, the United States is retaining, at least temporarily, more foreign nationals graduating with STEM degrees but also becoming more reliant on a foreign workforce with EE degrees. NSF’s State of U.S. Science and Engineering 2020 study finds that “more than one-half of doctorate holders in engineering … occupations … are foreign born.”[45]
The United States increasingly relies on EE graduate students from India and China (and to a much lesser extent Iran, Taiwan, and South Korea).
Figure 10: Top five countries with the highest number of STEM OPT authorizations[46]
Institutions Awarding Electrical Engineering Degrees
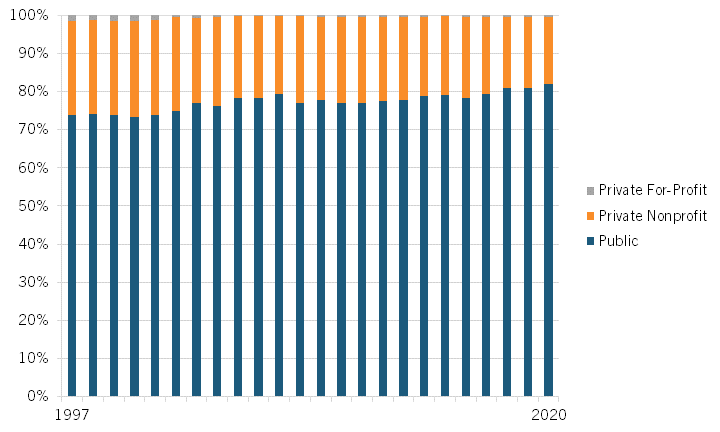
The growth of EE bachelor’s degrees awarded to U.S. citizens is important because it is often the lowest degree required to become an electrical engineer. Public universities have historically awarded a majority of EE bachelor’s degrees, as the lower tuition costs mean more students, including those majoring in EE, generally choose to attend these schools. As a result, public universities awarded more than 70 percent of EE bachelor’s degrees from 1997 to 2020.[47]
Public universities awarded an increasingly larger share of EE bachelor’s degrees in that period.[48] In 1997, public universities awarded 73.9 percent of EE bachelor’s degrees, increasing to 82.1 percent in 2020.[49] (See figure 11.) An American Society for Engineering Education survey of 254 U.S. universities in 2020 finds that the top three universities awarding the most EE bachelor’s degrees were public universities.[50]
Figure 11: Shares of electrical, electronics, and communications engineering bachelor’s degrees awarded by institution type[51]
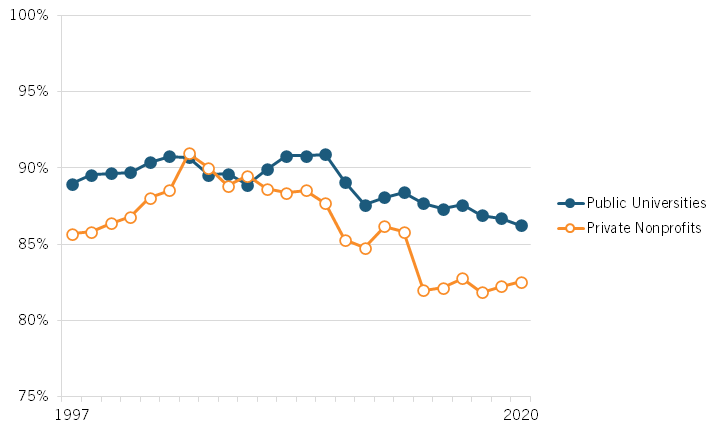
Moreover, public schools award a higher share of their EE degrees to U.S citizens and permanent residents than do private schools. Although both institution types are awarding a declining share of EE degrees to U.S. citizens and permanent residents, public universities have outperformed private universities in the share of EE degrees awarded to U.S. citizens for most of the years from 1997 to 2020.[52] In 2020, public universities awarded 86.2 percent of their EE degrees to U.S. citizens and permanent residents, while private not-for-profit universities awarded 82.5 percent.[53] (See figure 12.) In other words, public universities award more EE degrees, and a slightly higher share goes to U.S. citizens and permanent residents.
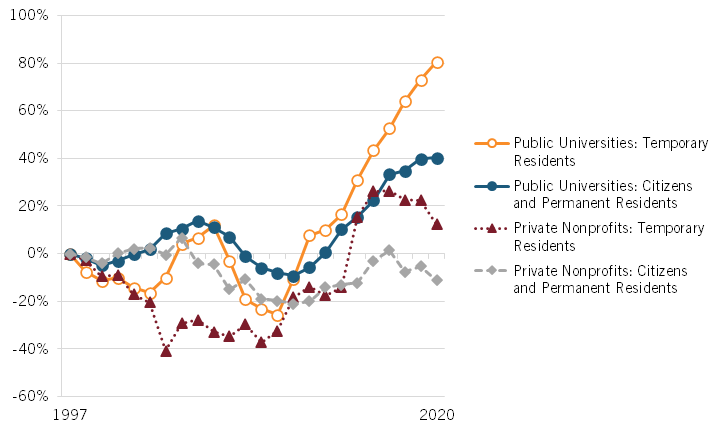
Figure 12: Shares of electrical, electronics, and communications engineering degrees awarded to U.S. citizens and permanent residents by type of institution[54]
Although public universities award only a slightly higher share of their EE degrees than do private universities, it nevertheless signals that high school and transfer students who are U.S. citizens or permanent residents interested in pursuing an EE major generally prefer to attend public schools. From 1997 to 2020, public universities increased the number of EE degrees awarded to U.S. citizens and permanent residents by 40.3 percent.[55] In contrast, private not-for-profit universities have decreased the number of EE degrees awarded to U.S. citizens and permanent residents by 11.3 percent.[56] (See figure 13.)
Figure 13: Growth in electrical, electronics, and communications engineering bachelor’s degrees since 1997[57]
Why Are Electrical Engineering Graduation Rates Disappointing?
It’s not immediately clear why EE degree performance, especially among U.S. citizens and permanent residents, has been lagging behind. It clearly is not compensation. The average salary for electrical and electronics engineers in 2021 was $110,670 per year, 90 percent higher than the average salary for all jobs in the United States.[58]
One reason could be the degrees are simply harder and involve more work, as EE is a challenging subject for most. Even for those with a knack for it, studying and preparing for classes can be long and difficult. According to the National Survey of Student Engagement, engineering majors spend the most time preparing for class, with 42 percent spending at least 20 hours a week, compared with 31 percent for arts and humanities (arts and humanities had the highest rate for non-STEM majors).[59]
Despite long hours of studying, these students also face “stricter grading standards” that often result in grades “lower than non-STEM departments.”[60] Moreover, one study finds that EE majors face one of the highest proportions of C’s compared with other engineering majors.[61] As a result, a study on Tulane University’s School of Engineering finds that one of the most frequently cited reasons for switching out of engineering was “I want to finish college with a better GPA than I will have in engineering.”[62] Due to EE’s difficulty and strict grading, many students prefer to study something else.
Some will argue that the K–12 STEM pipeline needs to prepare students better. But while K–12 STEM education can always improve, the fact is it has been a priority nationally and locally for over two decades. Yet, EE degrees as a share of all degrees have declined.
A second reason for the poor performance is engineering student retention rates are low relative to other majors. According to a research study by Yoder, about 20 percent of students dropped out of engineering within the first year in 2012.[63] Moreover, the U.S. Department of Education found that 32 percent of engineering and engineering technology majors changed their field of study, compared with 29 percent for non-STEM majors.[64] Moreover, in 2011, fewer than 35 percent of engineering majors graduated in four years, versus 41.6 percent for all majors.[65]
The combination of higher standards, strict grading, and often poor teaching means students have strong incentives to either not enter the EE major or switch majors.
Studies have found that nearly 98 percent of students switching out of engineering cited “poor teaching,” resulting in boring classes and a challenging first year.[66] Moreover, universities save the “more interesting and/or experiential classes until later grades.”[67] For example, a sample EE study program at California State University, Fullerton recommends first-year students take fewer hands-on general introductory math, physics, and engineering courses and only take a more hands-on course (EGEE 245: Computer Logic and Architecture) in their final semester of the first year.[68] In addition, most programs focus extensively on math rather than actual EE application areas. (See table 1.) As a result, students become frustrated with the lack of “hands-on experiences with electronics … [and] often decide that electrical engineering is not for them.”[69] The combination of higher standards, strict grading, and often poor teaching means students have strong incentives to either not enter the EE major or switch majors.
Table 1: Sample four-year electrical engineering study plan for California State University, Fullerton[70]
|
Area (as Listed on TDA) |
Course |
Units |
|
First Semester |
||
|
▪ Math and Science Courses |
MATH 150A |
4 |
|
▪ Math and Science Courses |
CHEM 123 |
3 |
|
▪ Required EE Courses |
CPSC 120 |
3 |
|
▪ GE Subarea A.2: Written Communication |
3 |
|
|
▪ GE Subarea A.1: Oral Communication |
3 |
|
|
Subtotal |
16 |
|
|
Second Semester |
||
|
▪ Math and Science Courses |
MATH 150B |
4 |
|
▪ Math and Science Courses |
PHYS 225 & 225L |
4 |
|
▪ GE Subarea C.1: Intro to the Arts |
3 |
|
|
▪ Required EE Courses |
EEGE 245 |
3 |
|
Subtotal |
14 |
|
|
Total |
30 |
|
Finally, the lower share of students graduating with EE degrees is partially attributed to the lower acceptance rate into top engineering programs compared with other areas of study. For example, Veritas Essay found that Harvard University admitted almost double the rate of students applying for humanities majors than for engineering majors.[71] Similar statistics were also found for some top-ranking public universities. The University of California, Berkeley’s College of Engineering “makes it extremely difficult if not impossible” to transfer into an engineering major after students have matriculated into the university.[72] The University of California, Los Angeles’s acceptance rate for transfer students into its engineering program is also exceptionally low at 15 percent compared with multiple majors in its arts and sciences school.[73]
Moreover, public universities that receive more applications are more likely to have impacted majors. The California State University (CSU) describes impacted majors as “a program or campus receives more eligible applicants during the initial application filing period than can be accommodated … [CSU] engineering programs also tend to be impacted.”[74] The lower acceptance rate into engineering programs due to high applicant volume in the nation’s largest four-year public university system also partially contributes to the lower shares of students graduating with EE degrees than for other majors.
The declining share of the young adult population holding an EE degree will make filling the new jobs the CHIPS and Science Act will create challenging, hurting the economy’s productivity.
But of course, this is a somewhat straightforward issue, as the solution is to increase the slots in EE programs while reducing them in programs with high acceptance rates. This kind of internal reallocation based on consumer demand is common among for-profit companies, but because of the institutional resistance in universities, it is usually quite difficult, as faculty in lower-demand programs fight vociferously against downsizing.
The poor retention rates of engineering degrees combined with the low acceptance rates into top engineering programs have economic implications. The passing of the CHIPS and Science Act last year has called for educating more students in engineering to fill the “tens of thousands of new semiconductor manufacturing and R&D jobs expected to be created over the next few years,” according to UC Berkeley’s dean.[75] The declining share of the young adult population holding an EE degree will make filling the new jobs the CHIPS and Science Act will create challenging, hurting the economy’s productivity.
Policy Recommendations
The STEM education debate often defaults to “pipeline issues” such as getting more elementary and middle school kids interested in STEM. It’s time to move beyond such a simple approach, partly because governments have tried to do that since the early 1980s and it’s unclear why additional efforts would lead to better outcomes—and also because it is clear that there are major opportunities to boost STEM and EE enrollment and graduation, in particular, at universities. To do that, policymakers need to provide incentives for colleges and universities to keep expanding enrollment in EE for U.S. citizens and permanent residents while also increasing retention rates.
Congress should require all public universities to report engineering enrollment statistics, including the share of applications from in-state, out-of-state, and international students, acceptance rates for each, switch-out and drop-out rates, and graduation rates. In the absence of congressional action, state legislatures should enact state-specific information-reporting requirements.
The STEM education debate often defaults to “pipeline issues” such as getting more elementary and middle school kids interested in STEM. It’s time to move beyond such a simple approach.
Moreover, state legislatures should increase the per-student funding for in-state engineering students to reduce the tuition difference, while Congress should pass legislation establishing a program at NSF to provide payments to state universities for every in-state engineering student to help reduce the difference in revenue. Without these measures, public universities will choose to accept more international students due to the higher tuition they pay. According to the Foundation for Economic Education, “Colleges are keen to enroll international students since they generally receive much less financial aid … [and are] a key source of additional revenue for universities.”[76] This is a rational response to decades of state government funding cuts to higher education, but it is an irrational response for the nation as a whole.
States and the federal government need to incentivize public universities to reduce engineering attrition rates because these institutions produce the most EE bachelor’s degrees. The trajectory of the data suggests that students will continue to seek EE bachelor’s degrees from these institutions in the coming years. The lower costs of public universities will continue to entice students, especially those from low- and middle-income families, to choose to pursue their degrees in these institutions. The best way to increase engineering retention rates “is to supply external incentives that provide hard backing to good intentions.”[77] Hence, Congress should appropriate funds to NSF for five years to be awarded as prizes to colleges and universities that increase and sustain the rate at which their first-year EE students graduate with EE degrees.
Conclusion
Students are less interested in pursuing EE degrees compared with other fields of study. The share of EE degrees awarded as a share of all degrees has declined in recent decades. This has economic implications because the economy relies on electrical engineers to power and manufacture some of its most important technologies, such as the communications systems that enable cell phones to function. Moreover, the declining share is even more concerning when the data points to U.S. citizens and permanent residents who are less interested in pursuing EE degrees. Whereas temporary residents are more likely to take their knowledge abroad, it is the U.S. citizens and permanent residents that will likely stay and power the U.S. economy.
Policymakers need a strategy that will keep retention rates high, especially for public universities that award a majority of EE bachelor’s degrees to U.S. citizens and permanent residents. This would help prevent the United States from becoming overly reliant on foreign nationals to power its technologies. Policymakers need to act now. The CHIPS and Science Act will create tens of thousands of jobs in the coming years that need graduates with EE degrees to fill.
Acknowledgments
The author would like to thank Robert Atkinson for his guidance on this report. Any errors or omissions are the author’s responsibility alone.
About the Author
Trelysa Long is a research assistant for antitrust policy with ITIF’s Schumpeter Project on Competition Policy. She was previously an economic policy intern with the U.S. Chamber of Commerce. She earned her bachelor’s degree in economics and political science from the University of California, Irvine.
About ITIF
The Information Technology and Innovation Foundation (ITIF) is an independent, nonprofit, nonpartisan research and educational institute focusing on the intersection of technological innovation and public policy. Recognized by its peers in the think tank community as the global center of excellence for science and technology policy, ITIF’s mission is to formulate and promote policy solutions that accelerate innovation and boost productivity to spur growth, opportunity, and progress. For more information, visit us at itif.org.
Endnotes
[1]. U.S. Department of Education, IPEDS Completions Survey (electrical, electronics, and communications engineering degree and all degrees awarded/conferred from 1997 to 2020), accessed January 18, 2023, https://ncsesdata.nsf.gov/builder/ipeds_c?dim=fieldCIP6.
[2]. Ibid.
[3]. Ibid.
[4]. Ibid.
[5]. Ibid.
[6]. Ibid.
[7]. Ibid.
[8]. US Census Bureau, ACS 1-Year Estimates Public Use Microdata Sample (number of electrical engineering degrees and all other degrees by age category and level of degree from 2009 to 2019 and 2021), accessed January 20, 2023, https://data.census.gov/mdat/#/search?.
[9]. U.S. Department of Education, IPEDS Completions Survey.
[10]. World Bank, World Development Indicators (Population ages 15–64, total), accessed February 2, 2023, https://databank.worldbank.org/reports.aspx?source=2&series=SP.POP.TOTL&country=#.; National Science Foundation, Higher Education in Science and Engineering Supplemental Table S2-15 (S&E first university degrees, by selected region, country, or economy and field for 2000 to 2016), https://ncses.nsf.gov/pubs/nsb20197/data.; National Science Foundation, Higher Education in Science and Engineering Supplemental Table S2-16 (S&E doctoral degrees, by selected region, country, or economy and field for 2000 to 2016), https://ncses.nsf.gov/pubs/nsb20197/data.
[11]. Ibid.
[12]. Ibid.
[13]. Ibid.
[14]. U.S. Department of Education, IPEDS Completions Survey.
[15]. Ibid.
[16]. U.S. Department of Education, IPEDS Completions Survey.
[17]. Madeline Armstrong, “Why do so many international students leave the US?” The Nation, December 2, 2022, https://www.thenation.com/article/society/international-students-f1-visa-immigration-reform/#:~:text=But%20once%20their%20time%20is,were%20able%20to%20do%20so.
[18]. Madeline Armstrong, “Why do so many international students leave the US?” The Nation, December 2, 2022, https://www.thenation.com/article/society/international-students-f1-visa-immigration-reform/#:~:text=But%20once%20their%20time%20is,were%20able%20to%20do%20so.
[19]. Ibid.
[20]. Phillip Connor, “Retaining U.S. International Student Graduates” (FWD.us, February 3, 2022), https://www.fwd.us/news/us-international-students/.
[21]. Ibid.
[22]. Ibid.
[23]. Ibid.
[24]. Stuart Anderson, “New International Student Enrollment in U.S. Has Fallen 10% Since 2015,” Forbes, November 19, 2019, https://www.forbes.com/sites/stuartanderson/2019/11/19/new-international-student-enrollment-in-us-has-fallen-10-since-2015/?sh=424cd2a01ae9. According to the author, “new enrollment of international students at U.S. universities declined by more than 10% between the 2015-16 and 2018-2019 academic years … At the same time, the enrollment of international students in other countries, particularly Australia and Canada, has skyrocketed … New immigration restrictions are likely to blame for the poor performance.”
[25]. U.S. Department of Education, IPEDS Completions Survey.
[26]. Ibid.
[27]. Ibid.
[28]. Ibid.
[29]. Jack Corrigan, James Dunham, and Remco Zwetsloot, “The Long-Term Stay Rates of International STEM PhD graduates” (Center for Security and Emerging Technology, April 2020), https://cset.georgetown.edu/publication/the-long-term-stay-rates-of-international-stem-phd-graduates/.
[30]. Ibid.
[31]. Neil Ruiz and Abby Budiman, “Number of Foreign College Students Staying and Working in U.S. After Graduation Surges” (Pew Research Center, May 10, 2018), https://www.pewresearch.org/global/2018/05/10/number-of-foreign-college-students-staying-and-working-in-u-s-after-graduation-surges/.
[32]. National Science Foundation, Survey of Graduate Students and Postdoctorates in Science and Engineering: Fall 2021 (Table 4-20a: graduate students in electrical engineering), accessed January 17, 2023, https://ncses.nsf.gov/pubs/nsf23312?utm_medium=email&utm_source=govdelivery.
[33]. Ibid.
[34]. Ibid.
[35]. Ibid.
[36]. US Census Bureau, ACS 1-Year Estimates Public Use Microdata Sample.
[37]. Ibid.
[38]. Ibid.
[39]. Ibid.
[40]. Ibid.
[41]. “Optional Practical Training (OPT) for F-1 Students,” U.S. Citizenship and Immigration Services, accessed January 26, 2023, https://www.uscis.gov/working-in-the-united-states/students-and-exchange-visitors/optional-practical-training-opt-for-f-1-students.; U.S. immigration and Customs Enforcement, “2017 All Countries of Citizenship by Number of SEVIS Records with Authorizations to Participate in STEM OPT” (Washington D.C.), https://www.ice.gov/doclib/sevis/pdf/data-CitizenshipSTEMOPT_2017.pdf.; U.S. immigration and Customs Enforcement, “2018 All Countries of Citizenship by Number of SEVIS Records with Authorizations to Participate in STEM OPT,” (Washington D.C.), https://www.ice.gov/doclib/sevis/pdf/data-CitizenshipSTEMOPT_2018.pdf.; U.S. immigration and Customs Enforcement, “2019 All Countries of Citizenship by Number of SEVIS Records with Authorizations to Participate in STEM OPT,” (Washington, D.C.), https://www.ice.gov/doclib/sevis/pdf/data-CitizenshipSTEMOPT_2019.pdf.
[42]. U.S. immigration and Customs Enforcement, ”2017 All Countries of Citizenship by Number of SEVIS Records with Authorizations to Participate in STEM OPT”.; U.S. immigration and Customs Enforcement, “2018 All Countries of Citizenship by Number of SEVIS Records with Authorizations to Participate in STEM OPT”U.S. immigration and Customs Enforcement, “2019 All Countries of Citizenship by Number of SEVIS Records with Authorizations to Participate in STEM OPT.”
[43]. Ibid.
[44]. U.S. immigration and Customs Enforcement, “2007 to 2020 Annual Growth in OPT, STEM OPT, and CPT Authorizations and Employment Authorization Document (EAD) Issuances,” (Washington, D.C.), https://www.ice.gov/doclib/sevis/pdf/data-ApprovedEmploymentAuthorizations2007-2020.pdf.
[45]. National Science Foundation, The State of U.S. Science and Engineering 2020 (Alexandria, 2020), https://ncses.nsf.gov/pubs/nsb20201/u-s-s-e-workforce#figureCtr875.
[46]. U.S. immigration and Customs Enforcement, “2017 All Countries of Citizenship by Number of SEVIS Records with Authorizations to Participate in STEM OPT”; U.S. immigration and Customs Enforcement, “2018 All Countries of Citizenship by Number of SEVIS Records with Authorizations to Participate in STEM OPT”; U.S. immigration and Customs Enforcement, “2019 All Countries of Citizenship by Number of SEVIS Records with Authorizations to Participate in STEM OPT.”
[47]. U.S. Department of Education, IPEDS Completions Survey.
[48]. Ibid.
[49]. Ibid.
[50]. American Society for Engineering Education, “2021 Engineering & Engineering Technology: By the Numbers” (institution report, Washington D.C., 2022), https://ira.asee.org/wp-content/uploads/2022/11/Engineering-and-Engineering-Technology-by-the-Numbers-2021.pdf.
[51]. U.S. Department of Education, IPEDS Completions Survey.
[52]. Ibid.
[53]. Ibid.
[54]. Ibid.
[55]. Ibid.
[56]. Ibid.
[57]. Ibid.
[58]. “May 2021 National Occupational Employment and Wage Estimates,” U.S. Bureau of Labor Statistics, accessed January 27, 2023, https://www.bls.gov/oes/current/oes_nat.htm#00-0000.
[59]. Tyler Charboneau, “What Prevents many EE Students from ‘Making It’ to Professional Careers?” All About Circuits, April 8, 2020, https://www.allaboutcircuits.com/news/what-prevents-many-ee-students-from-making-it-to-professional-careers/.
[60]. Joyce Main et al., “Examining the Influence of Engineering Students’ Course Grades on Major Choice and Major Switching Behavior,” International Journal of Engineering Education 31, no.6 (2015): 1469, https://krannert.purdue.edu/faculty/kjmumfor/papers/engineering-grades-and-major-switching-2015.pdf.
[61]. Ibid.
[62]. Kay Dee and Glen Livesay, “First-Year Students Who Leave Engineering: learning Styles and Self-Reported Perceptions” (American Society for Engineering Education conference paper, 2004).
[63]. Brian Yoder, “Engineering by the Numbers: ASEE Retention and Time-to-Graduation Benchmarks for Undergraduate Engineering Schools, Departments and Programs” (Washington, D.C.: American Society for Engineering Education, 2016), https://ira.asee.org/wp-content/uploads/2017/07/2017-Engineering-by-the-Numbers-3.pdf.
[64]. U.S. Department of Education, “Beginning College Students Who Change Their Major Within 3 Years of Enrollment” (Washington D.C., December 2017), https://nces.ed.gov/pubs2018/2018434.pdf.
[65]. Madison Andrews et al., “Engineering students’ attitudinal beliefs by gender and student division: a methodological comparison of changes over time,” International Journal of STEM Education 8, no. 13 (2021): 2, https://stemeducationjournal.springeropen.com/articles/10.1186/s40594-020-00269-6.; National Center for Education Statistics, Table 326.10, accessed January 31, 2023, https://nces.ed.gov/programs/digest/d21/tables/dt21_326.10.asp?current=yes. Graduation rate from first institution attended for first-time, full-time bachelor's degree-seeking students at four-year postsecondary institutions, by race/ethnicity, time to completion, sex, control of institution, and percentage of applications accepted: Selected cohort entry years, 1996 through 2014 (graduation rates for bachelor’s degrees).
[66]. Robert Atkinson, “Why the Current Education Reform Strategy Won’t Work,” National Academy’s Issues in Science and Technology, April 11, 2012, https://www2.itif.org/2012-current-edu-reform-wont-work.pdf.
[67]. Ibid.
[68]. California State University, Fullerton, “Electrical Engineering, B.S.,” General Education at CSUF, accessed March 28, 2023, https://www.fullerton.edu/undergraduate/academic_roadmaps/roadmaps-2019/2019/ecs/electrical-eng-2019.php.
[69]. Robert Bowman, “Electrical Engineering Freshman Practicum” (American Society for Engineering Education conference, 2003).
[70]. California State University, Fullerton, “Electrical Engineering, B.S.”
[71]. Veritas Essays Team, “Does Your Choice of Major Impact Your College Admissions Chances," Veritas Essays, July 4, 2020, https://veritasessays.org/college-admissions-blog/posts/declaring-intended-chosen-major-undecided-acceptance-rate.
[72]. Catherine Koshland and Tsu-Jae Liu, “Addressing Capped and Restricted Majors at UC Berkeley: Analysis and Recommendations from the Undergraduate Council,” letter, June 8, 2018, https://academic-senate.berkeley.edu/sites/default/files/divco_on_capped_and_restricted_majors_recommendations_w-_encl.pdf
[73]. “Transfer Profile by Major,” University of California, Los Angeles, accessed January 30, 2023, https://admission.ucla.edu/apply/transfer/transfer-profile/major.
[74]. Mary Jane Horton, “What is ‘Impaction’?” The California State University, February 6, 2017, https://www.calstate.edu/csu-system/news/Pages/What-is-%E2%80%98Impaction%E2%80%99.aspx.
[75]. Tsu-Jae King Liu, “Dean’s note: the CHIPS Act: A call to action,” Berkeley Engineering, November 7, 2022, https://engineering.berkeley.edu/news/2022/11/deans-note-the-chips-act-a-call-to-action/.
[76]. Preston Cooper, “Why International Students Are Giving Up on US Colleges,” Foundation for Economic Education, November 20, 2018, https://fee.org/articles/why-international-students-are-giving-up-on-us-colleges/#:~:text=Colleges%20are%20keen%20to%20enroll,domestic%20students%20are%20tapped%20out.
[77]. Atkinson, “Why the Current Education Reform Strategy Won’t Work.”
Editors’ Recommendations
December 29, 2016
Pentagon Told to Boost Manufacturing Engineering Education
Related
April 24, 2023
Declining Electrical Engineering Degrees Risk Undermining U.S. Competitiveness, New ITIF Report Warns
January 22, 2026
Declining Science and Engineering R&D in Higher Education Threatens US Competitiveness
September 11, 2013
