
How an Information Technology Agreement 3.0 Would Bolster Global Economic Growth and Opportunity
Expanding the 25-year-old trade agreement that eliminates tariffs on ICT goods would spur broad-based growth for countries that sign on, because lowering prices increases ICT adoption, which spurs productivity and innovation throughout the economy.
KEY TAKEAWAYS
Key Takeaways
How ICT Drives Economic Growth. 7
How ITA Participation Benefits Countries 10
The Logic for Bringing Additional ICT Goods Under ITA-3 Coverage. 18
Analyzing the Economic Impacts of a Proposed ITA-3 Expansion. 25
Analyzing the Impact of ITA-3 Expansion on the United States 41
Appendix A: List of Countries by Current ITA Membership. 43
Appendix B: Growth-Revenue Estimates Methodology 45
Appendix C: Methodology of Econometric Exercise. 47
Appendix D: ITA Product Codes (HS2017 Six-Digit Level) 48
Executive Summary
The Information Technology Agreement (ITA) has been one of the World Trade Organization’s (WTO’s) most successful plurilateral trade agreements. The agreement, originally signed in 1996 and to which 82 countries are now signatories, eliminates tariffs on trade in hundreds of information and communications technology (ICT) products. In 2015, 53 countries joined together in completing (and in 2016, implementing) an ITA expansion (ITA-2) that eliminated tariffs on an additional $1.3 trillion in annual global trade in 201 ICT parts, components, and products.[1] By eliminating tariffs on trade across hundreds of ICT products, the ITA has played an indispensable role in creating “zero-in/zero-out” tariff environments that have fostered the development of ICT global value chains (GVCs). Moreover, by reducing prices through tariff elimination, the ITA has facilitated greater adoption of the ICT products that lie at the core of the global digital economy and power the downstream innovative and competitive capacity of every industry that deploys them. This ITA-engendered increase in nations’ ICT capital stock leads directly to greater economic growth in developed and developing nations alike.
Yet, technologies continue to evolve, and now ICT is found at the core of an ever-increasing range of products, from energy-efficient green technologies such as storage batteries to personal fitness monitors to the industrial robots and 3D printers that are driving the global smart-manufacturing revolution. As such, an initial group of companies has come together to identify over 250 additional ICT six-digit product codes under the Harmonized Commodity Description and Coding System as candidates for potential ITA inclusion. This report examines the economic and tariff revenue impacts such an “ITA-3” would have for 14 nations: Brazil, China, Costa Rica, Indonesia, Japan, Kenya, Malaysia, Nigeria, Pakistan, South Korea, Taiwan, Thailand, the United States, and Vietnam.[2] The analysis finds that ITA-3 accession would generate tangible economic growth for all nations assessed, and that for many nations, tax revenues generated from enhanced economic growth would more than make up for tariff revenues forgone. This report begins with an overview of the ITA and global trade in ICT products before moving on to examine how ICT drives economic growth, articulating the logic behind bringing the proposed ICT products into an ITA-3 and then turning to the analysis of the economic impact of ITA-3 accession for the study countries.
Key Findings
Participation in the ITA provides an impetus for countries to reduce tariffs, thereby lowering the prices for, and expanding the consumption of, productivity-enhancing ICT, while deepening countries’ participation in global value chains for the production of ICT goods and services. Moreover, joining the ITA can engender faster economic growth and higher living standards because it gives businesses and individuals access to more affordable and higher-quality ICT, which are the modern economy’s chief drivers of productivity, innovation, and economic growth.
ITA-3 expansion could help grow U.S. GDP by over $200 billion over a decade, increase U.S. exports of ICT products by $3.5 billion, boost revenues of U.S. ICT firms by $12 billion, and support the creation of over 78,000 new U.S. jobs.
Leveraging these dynamics, the Information Technology and Innovation Foundation (ITIF) found that the proposed ITA-3 expansion would generate positive economic impacts by the 10th year post ITA-3 expansion for all 14 study countries. In percentage terms, ITIF found that Pakistan, Kenya, Brazil, and Nigeria would enjoy the largest economic growth in the 10th year post ITA-3 accession, with cumulative economic growth over that 10-year period equivalent to 3.2 percent of Pakistani, 2.15 percent of Kenyan, and 1.6 percent of Brazilian and Nigerian gross domestic product (GDP), respectively. (See table 1.) Moreover, if all 82 ITA-1 signatory countries were to join the proposed ITA-3, global GDP could cumulatively grow by $784 billion over the ensuing 10 years. In absolute terms the United States and China would be the biggest beneficiaries. ITA-3 expansion would be poised to deliver a cumulative $208 billion in U.S. GDP growth over 10 years, equivalent to 0.83 percent greater U.S. GDP growth than would otherwise be expected. Moreover, ITIF found that ITA-3 expansion would increase U.S. exports of ICT products by $3.5 billion, boost revenues of U.S. ICT firms by $12 billion, and support the creation of approximately 78,000 new U.S. jobs. China’s economy would cumulatively grow by 0.59 percent to be approximately $175 billion greater than would otherwise be the case as a result of ITA-3 expansion. The economic growth generated by an ITA-3 expansion would produce tax income that for at least six study countries would well exceed tariff revenues forgone, and for three more countries would close nearly 70 percent of the revenue gap after 10 years post ITA-3 accession.
Table 1: Summary of economic and revenue impacts over 10 years post ITA-3 accession
|
Cumulative 10-Year GDP Growth Attributable to ITA-3 Expansion (U.S. Billions) |
Cumulative 10-Year GDP Growth Attributable to ITA-3 Expansion |
Income Tax Revenue Gained (U.S. Millions) |
Revenue Gained as a Share of Revenue Forgone |
|
|
Brazil |
$33.7 |
1.6% |
$2,492 |
184% |
|
China |
$175.6 |
0.6% |
$9,657 |
118% |
|
Costa Rica |
$0.4 |
0.5% |
$20 |
56% |
|
Indonesia |
$7.9 |
0.4% |
$387 |
77% |
|
Japan |
$17.6 |
0.3% |
$1,795 |
147% |
|
Kenya |
$3.0 |
2.2% |
$232 |
184% |
|
Malaysia |
$1.3 |
0.2% |
$108 |
52% |
|
Nigeria |
$11.7 |
1.6% |
$446 |
69% |
|
Pakistan |
$15.7 |
3.2% |
$550 |
125% |
|
South Korea |
$8.2 |
0.4% |
$746 |
70% |
|
Taiwan |
$8.8 |
0.9% |
$754 |
59% |
|
Thailand |
$3.9 |
0.6% |
$239 |
32% |
|
United States |
$208.6 |
0.8% |
$23,159 |
161% |
|
Vietnam |
$2.5 |
0.5% |
$159 |
14% |
Introduction
In December 1996, 29 WTO member nations launched the ITA, a novel trade agreement in which participating nations eliminated tariffs on eight broad categories of ICT products (e.g., semiconductors, computers, telecommunications equipment, etc.). The ITA-1 now counts 82 nations—which collectively account for approximately 97 percent of global trade in ITA-covered goods—as signatories. Countries that have thus far neglected to join the ITA have missed out on tremendous growth opportunities. First, countries not joining the ITA harm themselves by retaining tariffs that add to the cost of key productivity- and innovation-enhancing ICT products, thus constraining their consumption and adoption. Second, those tariffs only serve to diminish the competitiveness of countries’ goods that depend on intermediate ICT inputs. Third, countries not participating in the ITA have seen their participation in GVCs for the production of ICT goods plummet since the ITA was introduced. Indeed, the evidence shows that ITA accession is beneficial for both countries’ domestic industries and their broader economy.
In 2012, owing to the tremendous success of the original ITA, member nations initiated negotiations toward expanding the ITA to add innovative ICT products commercialized since 1996 as well as some categories of ICT goods not included in the original agreement. ITA-expansion negotiations concluded in December 2015, and additional tariff eliminations began on July 1, 2016.[3] The expansion, which the WTO estimated would eliminate tariffs on an additional $1.3 trillion in annual global trade of ICT parts and products, represented the first major tariff-cutting deal completed at the WTO in 19 years.[4] The ITA-2 has produced annual global tariff savings of at least $13.8 billion.[5]
It’s important to remember that the entire global digital economy is underpinned by ICT goods—semiconductors, servers, routers, computers, smartphones, tablets, etc.—that fundamentally power it.
Digital technologies are increasingly powering the global economy. For instance, analysts at Oxford Economics estimated that by 2016 the digital economy had already accounted for 22.5 percent of global GDP.[6] Analysts at the research firm IDC have estimated that, going forward, as much as 60 percent of global GDP will be digitized (meaning largely impacted by the introduction of digital tools) by 2022.[7] That aligns with estimates that as much as half of all value created in the global economy over the next decade will be created digitally.[8] And while certainly the digitalization of the global economy has brought entirely new industries and enterprises to the fore—web search, social media, artificial intelligence (AI), cloud, etc.—at least 75 percent of the value of data flows over the Internet actually accrue to traditional industries such as agriculture, manufacturing, finance, hospitality, and transportation.[9]
Moreover, it’s important to remember that the entire global digital economy is underpinned by the ICT goods—semiconductors, servers, routers, computers, smartphones, tablets, etc.—that fundamentally power it. And by helping to reduce the price of ICT goods by eliminating tariffs on them, the ITA has played a not-inconsequential role in the growth of global production and trade in the very ICT products powering the global digital economy. For instance, the U.S. Bureau of Labor Statistics estimated that the U.S. consumer price index for “personal computers and peripheral equipment declined 96 percent” between 1997 and 2015.[10] And while certainly Moore’s Law (i.e., semiconductors’ capabilities doubling as their costs halve) and other technological innovations played a key role there, ITA-inspired tariff reductions and the evolution of efficient ICT GVCs certainly contributed as well.
Figure 1: Value of two-way global trade in ICT products, 1996–2019[11]
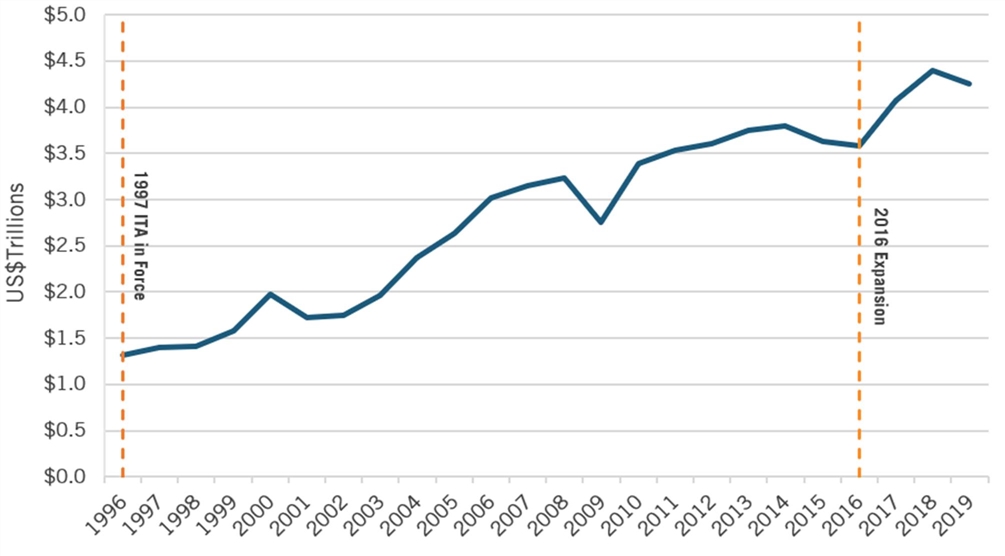
Indeed, global two-way trade in ICT products has grown more than threefold since the ITA entered force in 1997, increasing from $1.4 trillion in 1997 to $4.25 trillion in 2019 (the most recent year data is available). (See figure 1.) Further, global two-way trade in ICT products increased 15 percent since the 2015 ITA expansion. While global imports of ICT products did decrease 3 percent from 2018 to 2019, and decreased again with the start of the COVID-19 pandemic, preliminary 2020 ICT trade data for Germany, Hong Kong, and the United States suggests a growing reliance on digital technologies to subsist through global lockdowns. In fact, sales for semiconductors, a foundational technology enabling all other ICT products, unexpectedly grew in 2020 and is forecast to grow significantly in 2021 (e.g., global semiconductor sales were actually 29.2 percent larger in Q2 2021 than Q2 2020) due in large measure to the added demand for such ICT products brought on by the pandemic.[12]
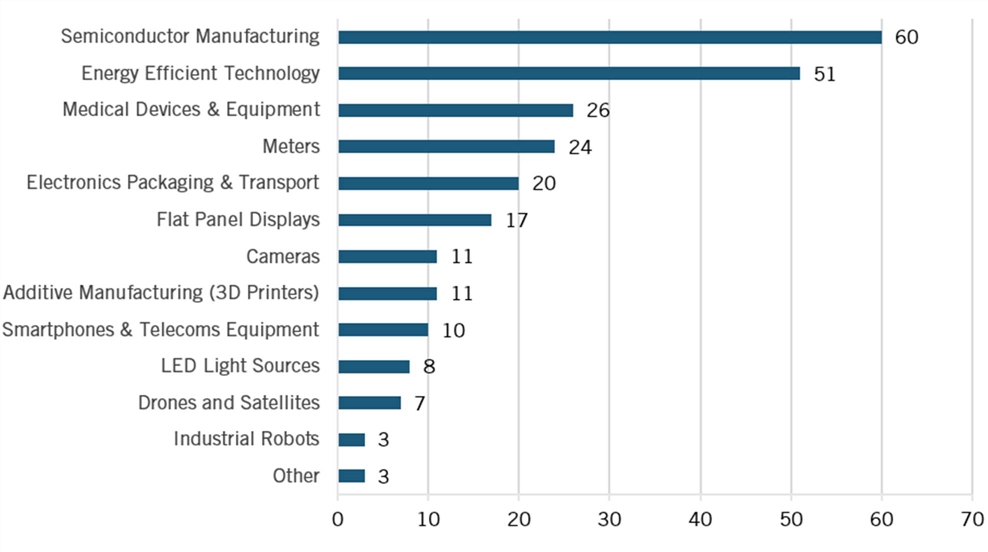
Recognizing that ICT continues to evolve and underpin a much greater range of products—from medical devices and industrial robots to drones and energy-efficient technologies—than they did a decade ago, an initial group of companies has come together to propose an ITA-3 that would bring over 250 additional six-digit HS2017 product codes under ITA coverage. An ITA-3 would ensure that new technologies of ICT goods are included: for instance, printers were included in the original ITA, but between the ITA-E and ITA-3 the full slate of modern 3D (additive manufacturing) printers should be covered. Similarly, just as the ITA-2 included next-generation multi-component semiconductors (MCOs) that were not part of the original ITA, an ITA-3 would include semiconductor-based transducers and other next-generation semiconductor technologies.[13] An ITA-3 initially contemplates over 250 discrete ICT products or components for inclusion, concentrated in the following categories: semiconductor manufacturing, energy-efficient technologies, medical devices and equipment, meters, electronics packaging and transport, flat panel displays, high-speed digital cameras, 3D printers, smartphones, drones and satellites, and industrial robots. (See figure 2.) Subsequent sections of this report articulate the rationale for including these ICT products in an ITA-3 expansion and evaluate the economic impacts of the proposed expansion on the 14 aforementioned countries. First, the report briefly turns to exploring how ICT drives economic growth and explaining why ITA membership is beneficial for developed and developing countries alike.
Figure 2: Counts of proposed ITA-3 products by ICT category[14]
How ICT Drives Economic Growth
Increasing productivity—that is, economic output per unit of input, whether that input is capital, labor, data, or technology—is the principal way economies grow over time.[15] Those productivity gains can come from all enterprises in a country (e.g., banks, farms, manufacturers) becoming more productive or from countries shifting the mix of enterprises in their economy (e.g., replacing lower-value-added sectors with higher-value-added ones, such as call centers with ICT services providers).[16] While both mechanisms are important, as the McKinsey Global Institute (MGI) found in its report, “How to Compete and Grow: A Sector Guide to Policy,” the overwhelming source of a country’s productivity growth, and thus economic growth, comes from bolstering the productivity of all the enterprises and industries that already predominantly comprise an economy.[17]
And the principal way economies can increase their productivity arises from leveraging the power of ICT. ICTs are such powerful tools precisely because they represent a general-purpose technology that enhances the productivity and innovative capacity of every individual, enterprise, and industry they touch throughout an economy—something that holds true for both developed and developing countries.
Indeed, ICT represents “super capital” that has a much larger impact on productivity than do other forms of capital. As research performed by Oxford Economics confirms, ICT generates a bigger return to productivity growth than do most other forms of capital investment.[18] For instance, ICT capital has a three to seven times greater impact on firm productivity than does non-ICT capital. ICT workers also contribute three to five times more productivity than non-ICT workers do.[19] In their report, “The Impact of ICT on East Asian Economic Growth,” Ahmed and Ridzuan explained this dynamic, “The ICT revolution has contributed significantly to the whole economy by raising productivity. First, ICT increases labor productivity in ICT-using industries by making labor produce more or work more efficiently. Second, ICT makes physical capital become more productive.”[20] As a result, revenue collection by nations that tax this ICT “super capital” through tariffs and other means is particularly damaging.
It’s vital to emphasize that the central way ICT drives a country’s economic growth is not through the production of ICT goods (e.g., the manufacturing of computers or smartphones). Rather, the vast majority of the economic benefits generated from ICT, especially in developing countries, stem from greater adoption of ICT across an economy.[21] Ultimately, ICTs’ productivity-enhancing and innovation-enabling benefits at the individual, firm, and industry levels aggregate to drive productivity and economic growth at an economy level.[22]
The vast majority of the economic benefits generated from ICT, especially in developing countries, stem from greater adoption of ICT across an economy.
This explains why multiple academic studies find strong linkages between ICT consumption (i.e., usage) and economic growth. For example, a December 2010 World Bank report, “Kenya Economic Update,” finds that “ICT has been the main driver of Kenya’s economic growth over the last decade.”[23] Specifically, the report finds that ICTs were responsible for roughly one-quarter of Kenya’s GDP growth during the 2000s. Moreover, ICTs’ contribution to Kenyan economic growth only grew over time, with the ICT sector providing a more than six-times-greater contribution to Kenyan GDP in 2009 compared with 1999.[24] Similarly, ICT accounted for 38 percent of Chinese total factor productivity (TFP) growth and as much as 21 percent of Chinese GDP growth from 1980 to 2001.[25] Likewise, Ahmed and Ridzuan further found “a positive contribution of ICT to economic growth” across eight East Asian countries: China, Japan, Korea, Indonesia, Malaysia, Philippines, Singapore, and Thailand.[26] As Richard Heeks, professor of development informatics at the University of Manchester estimated, “ICTs will have contributed something like one-quarter of GDP growth in many developing countries during the first decade of the 21st century.”[27]
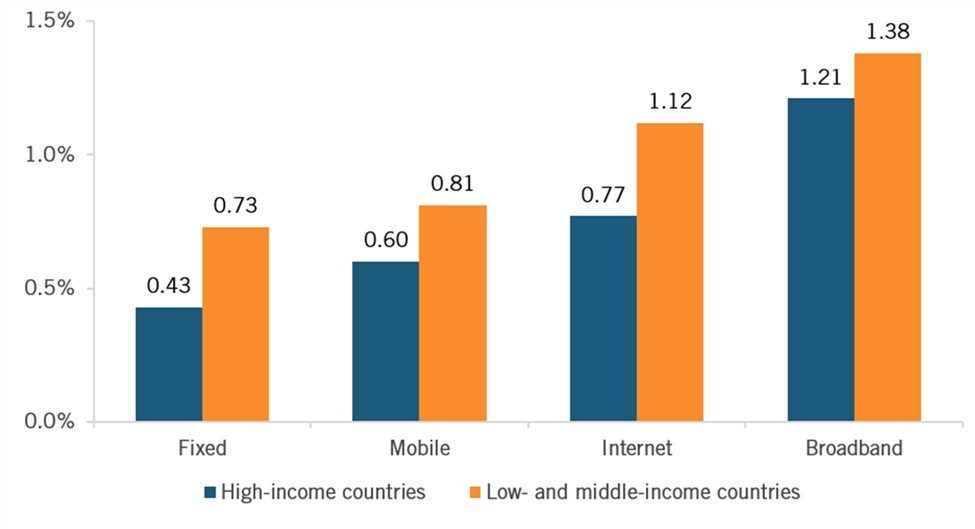
Indeed, as Farhadi, Ismail, and Fooladi wrote in their report, “Information and Communication Technology Use and Economic Growth,” “The more a country use[s] ICT, the greater is its economic growth.”[28] The authors found that if countries improve their score on the “ICT Use Index” (which measures a country’s number of Internet users, fixed broadband Internet subscribers, and mobile-phone subscriptions per 100 inhabitants), then their economic growth increases by 0.17 percent.[29] The World Bank has likewise documented this effect, finding that a 10 percent increase in high-speed broadband Internet penetration adds 1.38 percent to annual per capita GDP growth in developing countries. Likewise, a 10 percent increase in mobile-phone penetration adds 0.81 percent to annual per capita GDP growth in developing countries.[30] (See figure 3.) That research has been corroborated by a study by Czernich et al. which analyzes the effects of broadband infrastructure on economic growth for 25 Organization for Economic Cooperation and Development (OECD) countries from 1996 to 2007 and found that a 10 percent increase in a country’s broadband penetration rate drives annual GDP per capita growth of 0.9 to 1.5 percent.[31] More recently, studies have found that a 10 percent increase in mobile-device penetration increases productivity by 4.2 percentage points.[32]
Figure 3: Impact of a 10 percent increase in key ICT penetration on annual percent GDP growth[33]
Indeed, evidence that an expanding base of ICT capital stock powers countries’ economic growth increasingly comes from all quarters of the world.[34] For the Mideast, Nasab and Aghaei investigated the impact of ICT investments on economic growth in seven Organization of the Petroleum Exporting Countries (OPEC) nations from 1990 to 2007, finding that ICT “has a significant positive impact on economic growth in the sampled countries,” and underlining the need for countries to adopt proactive policies to encourage ICT investments to boost economic growth.[35] Veeramacheneni, Ekanayake, and Vogel analyzed 10 Latin American countries from 1975–2003 seeking a causal relationship between ICT and economic growth, and found a two-way causality between ICT and economic growth in two-thirds of the countries and, moreover, that ICT contributed to economic growth in 8 of the 10 countries included in the sample.[36] Zagorchev, Vasconcellos, and Bae, in a study of eight Central and Eastern European countries from 1997–2004, found that financial development and increased investment in telecommunications technology contributed significantly to GDP growth per capita.[37] Toader et al. analyzed the effect of using ICT infrastructure on economic growth in European Union countries over 18 years from 2000 to 2017 and found that an increase of 1 percent in the use of ICT infrastructure contributed to GDP per capita growth of between 0.0767 percent (fixed-broadband subscriptions) and 0.396 percent (mobile cell subscriptions).[38] On average, a 1 percent increase in ICT capital stock leads to a 0.06 percent increase in a country’s GDP. This elasticity is crucial in modeling GDP growth associated with countries joining the ITA.
The Latest Evidence Regarding the Economic Growth Impacts From ICT
Despite this impressive body of evidence documenting the powerful impact of ICT on economic growth, some skeptics have questioned the extent to which ICT adoption can increase economic growth in developing nations, arguing that developing countries may lack human capital, governance, or other ICT-complementary factors or that their labor-to-capital cost ratio is too low, making it less economical to add ICT capital.[39] And some research conducted during the late 1990s and early 2000s does appear to suggest as much, or at least that ICTs’ benefits were greater for developed economies. For instance, in 2004, economist Khuong Vu, in analyzing economic growth data between 1990 and 2000, suggested that “the results indicate that ICT plays a more important role in determining the output growth for the developed economies than for the developing ones.”[40] Similarly, Ayoub Yousefi investigated whether ICT contributed to economic growth across 62 countries with different levels of development from 2000 to 2006, finding that ICT exerted a greater impact on GDP growth in upper-middle-income countries than in lower-income countries.[41]
Developing nations’ investments in telecommunications infrastructure are 10 to 40 percent more effective in generating economic growth than are similar investments made by developed countries.
However, while it may have been the case that, in earlier decades, developed countries realized higher rates of return from ICT investments than did developing countries, that is clearly no longer true. Analyzing ICT investments and economic growth from 1995 to 2010 for 59 countries across various stages of development, economist Thomas Niebel concluded that “the regressions for the subsamples of developing, emerging, and developed countries do not reveal a statistically significant difference of the output elasticity of ICT between these three country groups.”[42] Niebel’s estimates indicate that, on average, regardless of a country’s development status, a 1 percent increase in ICT investment increases economic growth by 0.05 to 0.09 percent annually.[43] Similarly, Majeed and Ayub explored how different ICT indicators influenced economic growth in 149 countries from1980 to 2015, with the empirical results suggesting the use of ICT infrastructure had a positive and significant impact on economic growth.[44]
And, in fact, it appears that ICT investments now generate higher returns than ever before. In analyzing 29 economic studies that isolate the rate of returns to ICT investment, Cardona, Kretschmer, and Strobel revealed that “ordering the studies by their average year of the data used for the estimation, we find a positive time trend.”[45] Further evidence supports the contention that, going forward, developing countries stand to gain even more from adopting greater levels of ICT than do developed countries. For example, as the European Commission found, developing nations’ investments in telecommunications infrastructure are 10 to 40 percent more effective in generating economic growth than are similar investments made by developed countries.[46]
Put simply, a growing body of evidence documents the positive effects ICT has on economic growth, for both developed and developing countries. Summarizing 58 empirical studies estimating the economic impact of ICT, Stanley, Doucouliagos, and Steel found that “on average, these technologies have contributed positively to growth.”[47] In terms of the magnitude to which ICT spurs economic growth, a review of econometric literature by Cardona, Kretschmer, and Strobel finds that, on average, an increase in ICT capital stock of 1 percent leads to a 0.06 percent increase in a country’s GDP.[48]
How ITA Participation Benefits Countries
The ITA has benefitted participating—and especially developing—countries considerably.[49] In 2010, developing countries accounted for 64 percent of global exports of ICT products.[50] As Xiaobing Tang, a counsellor in the Market Access Division of the WTO, noted, the experiences of ASEAN (Association of Southeast Asian Nations) countries such as Malaysia and Thailand “show that the ITA has helped their development and economic growth.”[51] ITA participation benefits countries in three principal ways, by 1) lowering costs for and thus spurring adoption of productivity-enhancing ICT, which boosts the productivity, innovative, and competitive capacity of a country’s enterprises and industries (which further creates new job opportunities); 2) deepening countries’ participation in GVCs for the production of ICT goods and services; and 3) bolstering countries’ broader global trade participation.
Deepening Countries’ Participation in ICT GVCs
GVCs represent an increasingly important feature of international trade. In fact, 85 percent of global trade can now be characterized as occurring with the GVC framework.[52] Keeping ICT prices low is paramount if countries wish to participate in GVCs for the production of ICT parts, components, and final products. In contrast, maintaining high ICT tariffs (in part, by not joining the ITA) harms both countries’ ICT-producing and ICT-consuming sectors.[53] In particular, failure to join the ITA has caused nations to be left out of global production networks for ICT products (and services), causing them to miss out on tremendous growth opportunities.
To elaborate, in the 1970s, and with renewed interest over the past 15 years, countries such as Argentina, Brazil, and India have experimented with import substitution industrialization (ISI) policies that impose high tariffs (among other trade barriers) on imported ICT products in an effort to spur development of their own nascent ICT-producing industries. Yet, in the interest of favoring one sector (ICT producers) these policies have had the unintended effect of harming the entire economy, as enterprises (large and small alike) in other industries—from finance and education to hospitality, health, and retail—are forced to use fewer, inferior, or more-expensive ICT products, thus hampering their own productivity, innovation potential, and global competitiveness. What’s worse, high tariffs have proven largely ineffective at achieving these countries’ aim of spurring the development of indigenous ICT-producing sectors. By being shielded from best-of-breed international competitors, domestic firms lack a vital impetus for innovation that competition engenders. For instance, small business owners in Argentina have complained about the country’s high ICT tariffs, noting that “the lack of competition gives manufacturers an incentive to produce low-quality products and charge high prices.”[54]
Further, high ICT tariffs have precluded many ICT-producing enterprises from effectively participating in GVCs for the production of ICT products. Because of the interlinkage of global supply chains, manufacturers scour the globe searching for the highest-quality and most cost-competitive production locations. This means global production networks consist of highly fragmented but specialized units of production, predicated on countries being open to trade. To illustrate, in 1962, intermediate goods accounted for 30 percent of total trade within the same industry globally—a percentage that doubled to 60 percent by 2006.[55] (A 2020 United Nations Conference on Trade and Development (UNCTAD) report estimates that intermediate products represented approximately half of world trade in goods, just under $8 trillion, in 2019).[56]
Failure to join the ITA has caused nations to be left out of global production networks for ICT products, causing them to miss out on tremendous growth opportunities.
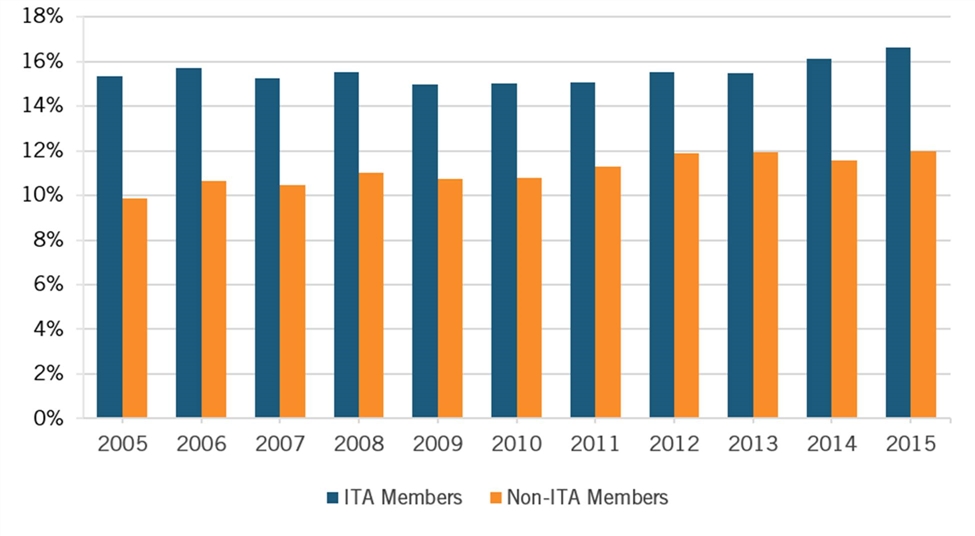
Put simply, countries imposing high tariffs on ICT parts and products only make themselves unattractive to multinational enterprises wishing to seamlessly integrate into global production chains. This explains why the OECD has found that countries not participating in the ITA saw their participation in global ICT value chains decline by more than 60 percent from 1995 (two years before the ITA went into effect) to 2009. (See Figure 4.)[57] Similarly, the OECD provides data on countries’ participation in ICT GVCs (considering their forward and backward participation rates in those value chains), and the evidence clearly shows that, from 2005 to 2015, ITA-member nations enjoyed nearly one-third greater participation in ICT GVCs than did non-ITA-member nations. (See figure 5.)
Figure 4: Participation in global ICT value chains, indexed as a share of gross ICT exports[58]
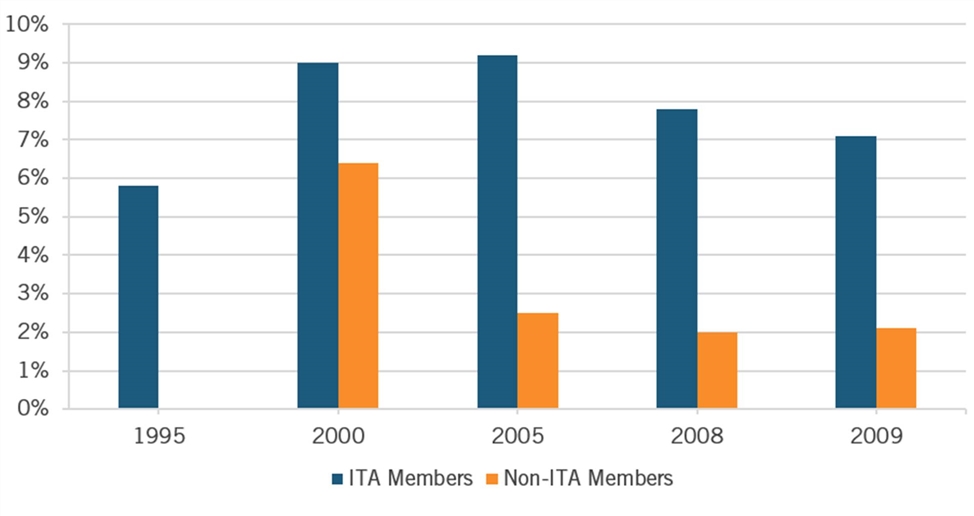
Figure 5: Participation in global ICT value chains, indexed as a share of gross ICT output[59]
Brazil provides a good example: Brazilian innovation in ICT has lagged behind that of the rest of the world primarily because the country hasn’t been involved in ICT GVCs and has enjoyed limited market-based technology and skills transfer in the ICT sector. Put simply, if countries wish to participate in GVCs for ICT products, they have to remove the barriers. As the OECD’s “Measuring Trade in Value Added” research finds:
The growing fragmentation of production across borders has important policy implications. It highlights the need for countries wanting to reap the gains from value chain participation to have open, predictable and transparent trade and investment regimes as tariffs and other unnecessarily restrictive non-tariff measures impact foreign suppliers, international investors, and domestic producers.[60]
It’s also important to note that it’s not just about producing final goods; countries can derive significant value added from the production of intermediate inputs. A zero-in/zero-out tariff environment can help countries attract production for a wide range of goods; and over time, as countries’ enterprises and their employees develop knowledge, skills, and relationships with international partners, they can move up the value chain to the production of higher-value-added goods.
Another benefit of the ITA, for developed and developing nations alike, is that it has furthered the development of more diversified global supply chains, which can facilitate resilience and resistance to supply chain shocks. As MGI found in its report, “Risk, resilience, and rebalancing global supply chains,” that matters, “Changes in the environment and in the global economy are increasing the frequency and magnitude of shocks. Forty weather disasters in 2019 caused damages exceeding $1 billion each—and in recent years, the economic toll caused by the most extreme events has been escalating.”[61] The report estimates that companies today should expect supply chain disruptions of one to two weeks occurring at least once every two years; two to four weeks occurring once every 2.8 years; one to two months every 3.7 years; and two months or more every 4.9 years. By fostering more diversified and resilient global ICT supply chains, the ITA can help address this challenge.
Countries that don’t participate in open, cross-border flows of ICT products (by imposing high tariffs on ICT or other restrictive measures such as localization barriers to trade) only end up excising themselves from GVCs and production networks for ICT products, and services.
But the message is clear: Countries that don’t participate in open, cross-border flows of ICT products (by imposing high tariffs on ICT or other restrictive measures such as localization barriers to trade) only end up excising themselves from GVCs and production networks for ICT products, and services.[62]
Boosting Countries’ Exports of ICT Goods and Services
The ITA has helped boost countries’ levels of exports of both ICT goods and services.
For instance, from 1996 to 2008, developing-country ITA exports expanded at an annual rate of 33.6 percent, compared with 7.2 percent for developed countries.[63] And the evidence shows that countries that have systematically reduced barriers to trade in ICT goods—including by eliminating tariffs, embracing trade facilitation, and eschewing other nontariff barriers such as localization requirements—have experienced increased ICT goods exports, both as a share of their total goods exports and in absolute value terms.
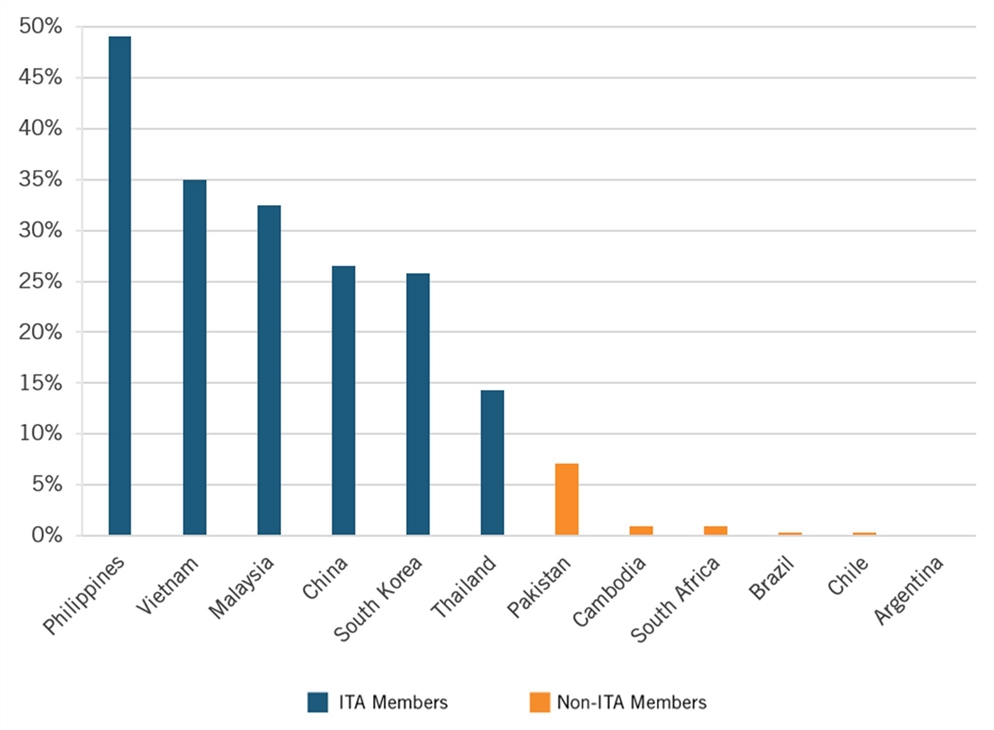
In fact, ICT goods exports as a share of total goods exports are consistently and significantly higher in ITA-member than in non-ITA-member countries. For instance, ICT goods exports account for almost 49 percent of the Philippines’ goods exports, 35 percent of Vietnam’s, 32.5 percent of Malaysia’s, 26.5 percent of China’s, 25.8 percent of South Korea’s, and 14 percent of Thailand’s. In contrast, ICT goods exports account for a much-lower share of goods exports for non-ITA countries, including for just 7 percent of Pakistan’s exports and less than 1 percent for Cambodia, South Africa, Brazil, Chile, and Argentina. (See figure 6.) And it’s not that the first six countries shown in figure 6 are in the ITA because they are strong ICT goods exporters; rather, they are robust ICT goods exporters in considerable part because they have become members of the ITA.
Figure 6: ICT goods exports as a share of total goods exports, select ITA and non-ITA members, 2019[64]
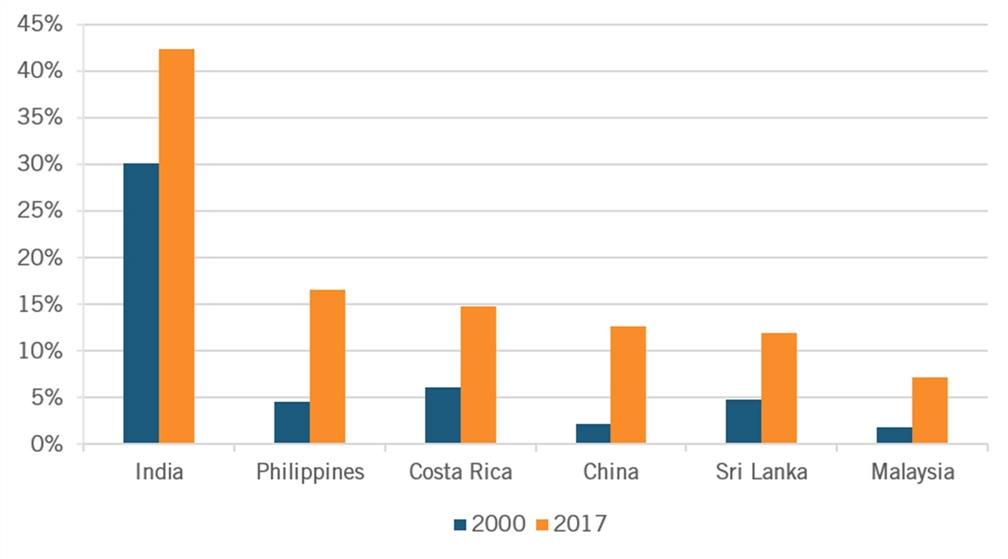
Beyond ICT goods exports, a similar story plays out in ICT services. Today, ICT services exports account for over 40 percent of India’s total services exports, 16.5 percent of the Philippines’, 15 percent of Costa Rica’s, 13 percent of China’s, and 12 percent of Sri Lanka’s. (See figure 7.) In 2020, India’s ICT services sector contributed 8 percent of GDP, a significant increase from the just 1.2 percent it did in 1998, shortly after India joined the ITA.[65] All these countries have experienced significant increases in ICT services exports’ share of total services exports since 2000, and part of the dynamic here is that ITA membership helped to lower prices for key ICT hardware inputs that ICT services enterprises depend on, helping them to innovate and become more globally competitive.
Figure 7: ICT services exports as a share of total services exports, select countries, 2017[66]
Joining the ITA Boosts Countries’ Trade Participation
Two comprehensive econometric studies have analyzed the trade-creation effects of the ITA. For instance, Bora and Liu analyzed the imports of 217 countries from 1988 to 2003. Because the ITA took effect during this period, the study includes imports before and after a country entered the ITA. Their analysis finds that, specific to the average developing nation, joining the ITA increases overall trade by 13 percent.[67]
A more-recent econometric study by Christian Henn and Arevik Gnutzmann-Mkrtchyan evaluates the economic impact of the ITA by assessing the exports and imports of 234 countries over the period of 1996 to 2012. The authors found that joining the ITA leads to higher ITA exports on average, in large part through an increase in importing ITA intermediate goods. They showed the importance of the ITA in integrating developing countries into GVCs, finding that, on average, ITA exports increase by 37 percent post ITA implementation.[68]
Eliminating tariffs creates a “commitment effect” that sends a signal to firms across all industries that a country provides a robust environment for both imports and exports.
Henn and Gnutzmann-Mkrtchyan further found that, post ITA-accession, countries that experience sizable increases in ITA exports also tend to invest strongly in education, policies favorable toward conducting business, and efficient legal institutions.[69] Importantly, the authors found that “reducing tariffs to zero may have an additional impact on imports beyond tariff reduction.”[70] This means fully eliminating tariffs has a tremendously powerful effect—much more than marginal tariff reductions.
Building on Henn and Gnutzmann-Mkrtchyan’s work, ITIF found corroborating evidence from its own econometric analysis. Using World Bank time-series data on ICT import profiles, ITIF formed ordinary least squares (OLS) regression models identifying the statistical relationship between ITA membership and ICT intensity of imports and exports.
This econometric exercise reviews four regression models: two modeling the original 1996 ITA membership and two for the 2015 ITA expansion. The dependent variable regressed in the first two is ICT import intensity, measured as a nation’s ICT imports as a share of total goods imported. The dependent variable in the latter two is ICT export intensity, measured as a nation’s ICT exports as a share of total goods exported. All models include the control covariates of GDP per capita and fixed effects for country and year. This combination of controls helps best isolate the actual impact ITA membership places on ICT trade intensity.[71] Equations 1 through 4 in appendix D detail the full model equations estimated by each OLS regression. Table 2 details the coefficients estimated by each model.
Table 2: Regression results for ICT import intensity[72]
|
Dependent Variable |
Independent Variable |
Coefficient Estimate |
Pr(>|t|) |
Standard Error |
Number of Observations |
R-Squared |
Base Year |
|
ICT_Import_pct |
ITA-1_Member |
5.44 |
1.13e-08 |
0.95 |
3184 |
0.816 |
1997 |
|
ICT_Import_pct |
ITA-2_Member |
7.21 |
2.05e-11 |
1.05 |
607 |
0.970 |
2016 |
|
ICT_Export_pct |
ITA-1_Member |
11.73 |
2e-16 |
1.381 |
3054 |
0.819 |
1997 |
|
ICT_Export_pct |
ITA-2_Member |
3.06 |
0.0466 |
1.534 |
594 |
0.973 |
2016 |
Assessing the regression table, both binary variables (denoting membership of ITA-1 and ITA-2) are statistically significant above the 99 percent confidence level and are positively associated with ICT import intensity. They are both also statistically significant above the 95 percent confidence level and positively associated with ICT export intensity.
Interpreting coefficient estimates for ITA-1_Member and ITA_E-Member yields four clear findings.
Following 1996 and controlling for GDP per capita and fixed effects for country and year:
▪ ITA-1 member-countries were on average 5.4 percent more ICT import-intensive than countries not in the ITA-1.
▪ ITA-1 member-countries were on average 11.7 percent more ICT export-intensive than countries not in the ITA-1.
Likewise, following 2015 and controlling for GDP per capita and fixed effects for country and year:
▪ ITA-2 member-countries were on average 7.2 percent more ICT import-intensive than countries not in the ITA-2.
▪ ITA-2 member-countries were on average 3.1 percent more ICT export-intensive than countries not in the ITA-2.
ICT import intensity expectedly improves with ITA membership because of the reasons detailed in this report. Eliminating tariffs on ITA products incentivizes increased imports of ITA goods due to a de facto price cut, stimulating demand. This growth in ITA imports raises the share of a nation’s ICT or ICT-related product imports. Countries’ ICT exports rise alongside ITA membership because global ICT markets grow through higher demand of ITA-covered products due to ITA accession. Regression modeling estimates a higher percentage increase in ICT import intensity associated with ITA-2 membership than ITA-1 membership, likely because the 2015 expansion eliminated tariffs on more products than the original ITA did. On the other hand, regression analysis shows ICT export intensity rose more with ITA-1 membership than with ITA-2 membership, likely due to the fact that ITA-1 included many more final goods than ITA-2, which would grow global demand for products more than the ITA’s discounting of intermediate goods. ITIF’s econometric findings support the relationship between ITA membership and growth in ICT imports and exports, which grow a nation’s ICT capital stock and GVC participation as a direct result. By confirming this first essential link between ITA membership and ICT trade intensity, growth-revenue estimates per country based on the proposed ITA-3 carry greater accuracy and identify benefits uniquely impactful to developing countries.
ITA-1 member countries were on average 5.4 percent more ICT import intensive than countries not in the ITA-1, while ITA-2 member countries were on average 7.2 percent more import intensive than countries not in the ITA-2.
In summary, the empirical results are quite clear: After eliminating tariffs on ITA products, countries—developed and developing alike—experience a decrease in ICT prices for consumers and producers, adopt ICT products more readily, integrate domestic ICT industries into global ICT value chains more seamlessly, and expand exports of ITA products. In other words, the econometric studies completed to date show that ITA membership delivers considerable benefits to member countries, something further borne out in the analysis presented in the economic analysis section of this report.
The Logic for Bringing Additional ICT Goods Under ITA-3 Coverage
An ITA-3 would bring a number of emerging (as well as more-modern versions of existing) technologies driving the global digital economy under ITA-coverage. As noted, an ITA-3 would include goods such as next-generation semiconductors, energy-efficient technologies such as storage batteries and LED “light sources,” digital manufacturing technologies such as industrial robots and 3D printers, certain medical technologies such as photographic X-ray plates, and some unmanned aerial vehicles (UAVs), among other products. The following section explores the logic of why several of these specific product categories merit ITA coverage, focusing especially on semiconductors, digital (or “smart”) manufacturing technologies, energy-efficiency technologies, drones, medical devices, and flat panel displays.
Semiconductors, Semiconductor Manufacturing Equipment, and Related Components
To be sure, semiconductors have been included as ITA products since the original agreement. But semiconductors continue to evolve, which is one reason why multicomponent semiconductors—a single semiconductor device that performs complex or multiple functions previously performed by two or more semiconductor devices, thanks to a variety of components integrated into a single unit—were an important part of the ITA-2 agreement.[73] Similarly, an ITA-3 would ensure that the latest next-generation semiconductor technologies, such as semiconductor-based transducers, are part of the agreement. The proposed ITA-3 would also bring a litany of products and materials involved in the manufacture of semiconductors under ITA coverage. These include for instance:
▪ Materials for manufacturing printed circuits (HS 3921.90)
▪ Cleanroom equipment (i.e., high-performance air filters/purifiers) (HS 8421.39)
▪ Injection and compression molds for the manufacture of semiconductor devices
(HS 8480.71)
▪ Machine tools operated by lasers/photobeam (HS 8456.10) or ultrasonic processes
(HS 8456.20)
▪ Circular polishing pads for the manufacture of semiconductor wafers (HS 3919.90)
ITA membership helped to lower prices for key ICT hardware inputs ICT services enterprises depend on, helping them to innovate and become more globally competitive.
Ensuring inclusion of the vast majority of inputs that comprise semiconductor manufacturing equipment—the machines that make the actual semiconductors—matters because semiconductors are foundational to the modern global economy. Semiconductors underpin everything from AI systems, cloud computing, and the Internet of Things to advanced wireless networks, smart grids, smart buildings, smart cities, digital healthcare devices, and even the next generation of quantum computing.[74] Moreover, semiconductors lie not only at the heart of every piece of ICT equipment—from desktop or laptop computers to tablets, servers, and smartphones—but to an increasingly wide variety of consumer goods from automobiles to home appliances to fitness monitors, something vividly illustrated by the global semiconductor shortage that hit in the wake of the COVID-19 pandemic.[75] The semiconductor sector itself represents a $470 billion highly globalized industry that helps create $7 trillion in global economic activity and is directly responsible for $2.7 trillion in total annual global GDP.[76] Broadening the set of semiconductor production inputs and end products covered by the ITA would help lower semiconductor prices—and makes perfect sense for the global economy.
Energy-Efficient Technologies
The ITA-3 expansion proposal includes numerous ICT-powered energy-efficiency technologies, such as:
▪ Storage batteries (HS 8507.20, 8507.30, 8507.40)
▪ Boards/panels, consoles, etc. for the electrical control or the distribution of energy (HS 8537.10, 8537.20)
▪ Solar water heaters (HS 8419.12)
▪ Gas and liquid meters (HS 9028.10, 9028.20)
▪ Light-emitting diode (LED) light sources (HS 8539.50, 8539.51, 8539.52)
Semiconductors not only move bits (1s and 0s), they also help control flows of electricity (i.e., power). Whether it comes to a nation’s power grid or the electrical flow within a factory, computer, smartphone, or even a single LED light bulb, they all rely on microchip systems that control, measure, and convert electricity. In fact, 80 percent of the energy generated globally passes through some kind of power electronics.[77] And in the United States, more than half of all electricity flows through some form of semiconductor-controlled motor.[78]
As semiconductors—and thus the devices they power and control—have become more powerful and more energy efficient, they portend the ability to deliver significant energy efficiencies across not only a variety of industries but even entire national economies. Indeed, ICT such as semiconductors represent a powerful technology that enables other sectors of an economy to become more energy efficient.[79] For instance, a 2009 study by the American Council for an Energy Efficient Economy (ACEEE) estimates that the United States could realize 1.2 trillion kilowatt-hours (kWH) in energy savings by accelerating the adoption of semiconductor-enabled technologies by just 1 percentage point per year.[80] According to ACEEE estimates, that would translate into 22 percent less electricity consumed than the then-prevailing U.S. Department of Commerce Reference Case, resulting in 733 million metric tons less carbon dioxide (CO2) emitted in 2030, as many as 296 energy plants that wouldn’t need to be built to deliver that power, and $1.3 trillion in cumulative savings from 2010 to 2030.[81] Driving these gains, ACEEE identified more than two dozen semiconductor-enabled technologies, including commercial and residential lighting, high-efficiency industrial motors and motor systems, programmable thermostats, and residential water heaters.[82] Several of these items are now proposed for ITA-3 expansion.
Semiconductors not only move bits (1s and 0s), they also help control flows of electricity (i.e., power).
Semiconductors are driving power efficiencies across a wide range of products, enabling computing efficiency (the number of computations per kilowatt hours (kWh) of electricity) to double approximately every 1.6 years, a phenomenon known as “Koomey’s law.”[83] For instance, data centers can reduce energy demand by 56 percent by using semiconductor-enabled technologies such as efficient uninterruptible power supplies, variable speed fans and pumps, and server virtualization.[84] In 2010, data centers consumed 194 terawatt hours (TWh) of electricity, about 1 percent of global electricity consumption. Since then, the global installed base of servers has increased by 30 percent; compute instances have increased more than sixfold; data center Internet protocol traffic has increased by a factor of 11; and data center storage capacity has experienced a 25-fold increase.[85] However, over this time, greater storage-drive efficiencies and densities have reduced storage energy use by nearly 90 percent. Overall, the energy intensity of data centers has decreased about 20 percent annually since 2010.[86] Elsewhere, semiconductors enable solar panels to harvest up to 57 percent of power normally lost to real-world conditions such as clouds, dirt, and animal interference.[87]
Semiconductor-powered sensors, controllers, and meters—several specific types of which are herein proposed for ITA-3 inclusion—will have a tremendous impact on the energy efficiency of commercial buildings and residential homes. For instance, one study finds that integrating smart sensors and controls throughout the commercial building stock has the potential to save as much as 29 percent of building energy consumption.[88] Smart sensors and controls can enable buildings to reduce their peak electricity load by 10 to 20 percent, for example, by shifting some energy services to times of day when energy demand is low.[89] Likewise, smart thermostats that help households and building managers monitor and regulate heating and cooling can reduce electricity demand by 15 to 50 percent, depending on the building and control technology.[90] Overall, the U.S. Department of Energy estimated that sensor and control technologies alone could reduce building energy consumption in the United States by 1.7 quads (~500 billion kilowatt-hours) by 2030, generating $18 billion in annual energy savings.[91]
As semiconductors—and thus the devices they power and control—have become more powerful and more energy efficient, they portend the ability to deliver significant energy efficiencies across not only a variety of industries but even entire national economies.
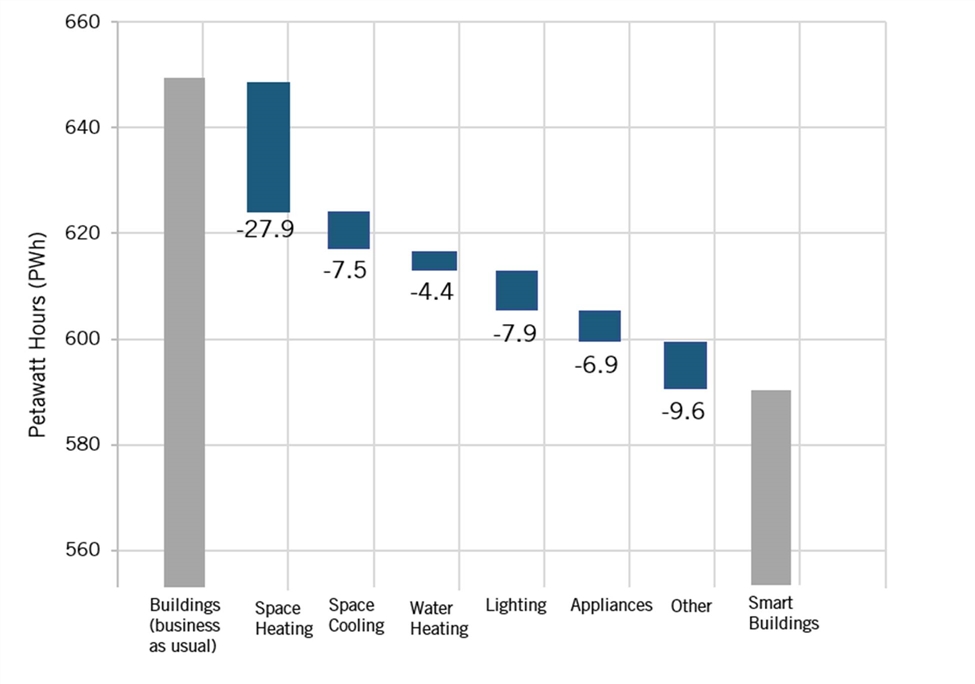
Similarly, the International Energy Agency’s 2017 report, Digitalization & Energy, identifies the global potential energy savings from smarter energy use in buildings, finding that ICT integration can reduce annual electricity use by up to 4.65 petawatt hours (PWh), or nearly 25 percent, over the next two decades with energy savings realized across a range of applications including lighting, water heating, metering, application of smart thermostats, etc. (See Figure 8.) Given their potential to save energy, save costs, and help the environment, especially as the world tries to meet Paris Agreement goals, the energy-efficient technologies identified as candidates for ITA-3 coverage certainly merit inclusion.
Figure 8: Cumulative energy savings in buildings from widespread digitalization, by energy use (2017–2040)[92]
Smart Manufacturing Technologies
Smart manufacturing—the application of ICT (such as industrial robots, 3D printers, the Internet of Things, AI, big data, etc.) to every facet of modern manufacturing—is in the midst of transforming how products are designed, fabricated, used, operated, and serviced post sale, just as it’s transforming the operations, processes, and energy footprint of factories and the management of manufacturing supply chains.[93] MGI estimated that this advent of manufacturing digitalization may increase global manufacturing productivity by 10 to 25 percent, with the potential to create as much as $1.8 trillion in new value per year across the world’s factories by 2025.[94] This concords reasonably well with a General Electric report, “Industrial Internet: Pushing the Boundaries of Minds and Machines,” that estimates the Industrial Internet could boost annual U.S. productivity growth by 1 to 1.5 percentage points and add $10 trillion to $15 trillion to global GDP over the next 20 years.[95] The ITA would promote global manufacturing digitalization by bringing more products, such as industrial robots and 3D printers, under ITA coverage. Adding up global imports in 2020 for both the components and end products representing industrial robots and 3D printers that are proposed for ITA-3 inclusion shows the total import value for such products exceeds $70 billion.[96]
Industrial Robotics
Industrial robots will be a key driver of this transformation. There are currently 2.7 million industrial robots operating across the world’s factories. That number increased 85 percent from 2014 to 2019.[97] China leads the world in annual installation of industrial robots, introducing some 140,000 new units each year, compared with 50,000 in Japan, 33,300 in the United States, 28,000 in South Korea, and 20,500 in Germany.[98] The global industrial robot marketplace was valued at $14.6 billion in 2020 and is expected to grow to $31.1 billion by 2028 at a compound annual growth rate (CAGR) of 10.4 percent.[99]
The ITA would promote global manufacturing digitalization by bringing more products, such as industrial robots and 3D printers, under ITA coverage.
Robots improve productivity when applied to tasks wherein they can reduce error and execute tasks at high levels of efficiency and consistency. In this way, robots help produce goods more economically, expanding the range of global access to a wide variety of manufactured goods—from automobiles to refrigerators to smartphones—and thus have played an instrumental role in enhancing global standards of living and driving global economic growth more broadly.[100] Their impact has been enormous. Georg Graetz and Guy Michaels of the Centre for Economic Performance concluded that robot densification increased annual growth of GDP and labor productivity between 1993 and 2007 by about 0.37 and 0.36 percentage points, respectively, across 17 countries studied.[101] Their study finds that robots accounted for 10 percent of GDP growth in studied countries, and productivity in robot-enabled industries in these countries increased by 13.6 percent.[102] As the authors concluded, “For the industries in our sample, robot adoption may indeed have been the main driver of labor productivity growth.”[103] They also found that robot densification is associated with increases in both TFP and wages, and reductions in output prices.[104] To put the power of industrial robots in context, Graetz and Michaels estimated that industrial robots exerted a greater economic impact over that 14-year study period than did the steam engine from 1850 to 1910, a harbinger of the impact the newest generation of far more capable industrial robots—and indeed digital manufacturing technologies more broadly—may have in the future.[105] To that end, MGI has predicted that up to half of the total productivity growth needed to ensure a 2.8 percent growth in global GDP over the next 50 years will need to be driven by automation.[106] And in that regard, the Boston Consulting Group has forecasted productivity improvements of 30 percent over the next 10 years, spurred particularly by the uptake of robots in small to medium-sized enterprises as robots become more affordable, more adaptable and easier to program.[107]
In other words, the competitiveness of a nation’s manufacturing enterprises—both large and small—will increasingly hinge on their ability to deploy and leverage industrial robots. And, if industrial robots are included in an ITA-3, then countries joining such an agreement will be at an advantage because eliminating tariffs on these productivity-enhancing goods will lower their prices and put domestic manufacturers at a competitive advantage. Industrial robots represent an obvious choice for ITA-3 inclusion.
3D Printing
Additive manufacturing, or 3D printing, refers to a manufacturing process in which successive layers of material are built up to synthesize a three-dimensional solid object composed in a digital file, with each layer a thinly sliced horizontal cross-section of the eventual object.[108] 3D printing enables fundamentally new shapes and even mechanical linkages that simply can’t be achieved through traditional subtractive manufacturing techniques, while offering many applications for improving speed and efficiency, reducing errors, and eliminating as much as 70 percent of waste generated from traditional subtractive manufacturing processes.[109]
3D printing played an important role in responding to the COVID-19 pandemic. For instance, HP, a maker of 3D printers, established a Digital Manufacturing Network leveraged by 55 companies across 30 U.S. states that established a weekly U.S. capacity of 75,000 reusable face shields, 10,000 face masks, and 1.8 million nasal swabs.[110] Based on data collected from America Makes—one of America’s 16 Manufacturing USA Network Institutes of Manufacturing Innovation, focused on additive manufacturing—from February 15 to July 15, 2020, alone, an estimated 38 million face-shield parts, 12 million nasal swabs, 2.5 million ear savers, 241,000 mask parts, and 116,000 ventilator parts were additively manufactured in the United States.[111]
Countries joining an ITA-3 expansion would give their domestic manufacturing enterprises a competitive advantage by reducing the prices of capital goods such as industrial robots and 3D printers that powerfully drive industrial productivity.
The current $12.6 billion global marketplace for 3D printers is expected to grow to $62.8 billion by 2028, at a 21 percent CAGR.[112] Especially as 3D printing becomes cost competitive across a range of materials—from plastic to metals such as titanium—it heralds the potential to transform manufacturing by “democratizing it” (i.e., making it more globally achievable), enabling the production of goods closer to final markets, and permitting mass customization (i.e., production lot sizes of one, as opposed to one million). A recent report from ING Bank estimates that the rise of 3D printing could see the share of 3D printed goods in global manufacturing rise to 5 percent over the next two decades—a significant increase from the current share of 0.1 percent—and that the greater extent of manufacturing closer to final consumption would at most decrease global trade flows by a modest rate of 0.2 percentage points less trade growth per year.[113] A growing market for 3D printing therefore would bring positive economic benefits to importing countries but would not impose a disincentive to trade flows at large. Moreover, digital manufacturing technologies such as 3D printing could actually cause international trade flows to increase by enabling the creation of new and innovative products for export. For instance, a 2019 study by the World Bank’s Caroline Freund, Alen Mulabdic, and Michele Ruta finds that the use of 3D printing in the hearing aid industry increased trade in that field by 58 percent over nearly a decade compared with what would otherwise have been expected.
As with industrial robots, 3D printers represent a device ripe for ITA-3 inclusion, and the manufacturers that have access to the lowest-cost, most-innovative 3D printers will find themselves at a competitive advantage.
Drones for Commercial and Personal Use
The global UAV marketplace stands at $27.4 billion and is projected to reach $58.4 billion by 2026, at a 16.4 percent CAGR. But far from being playful toys, drones represent a productivity-enhancing tool that is already delivering beneficial impacts across a range of industries, from agriculture to energy to medicine.
The United Nations Food and Agricultural Organization has projected that global food production will need to increase by 70 percent by 2050 to meet the world's food needs.[114] Precision agriculture leverages a variety of ICT including GPS-enabled UAVs, Internet of Things, AI, and big data to enable targeted interventions designed to enhance agricultural output and quality.[115] Indeed, UAVs are increasingly enabling a sustainable agriculture-management approach that allows agronomists, agricultural engineers, and farmers to help streamline their operations, using robust data analytics to gain effective insights into their crops. For instance, drones can facilitate the monitoring of large areas of farmland, considering factors such as slope and elevation, for instance, to identify the most suitable seeding prescriptions or to identify regions where irrigation needs to be provided, fertilizer applied, or crops pruned.[116] Drones are much more efficient and cheaper than the satellites or manned aircraft traditionally used to monitor agriculture, and can produce high-quality imagery over a wide expanse of terrain more safely, efficiently, and regularly. As such, analysts expect the agriculture drone market alone to reach $32.4 billion by 2025, indicating a growing global technology platform ripe for ITA inclusion.
Drones have also proven instrumental in the real-time delivery of urgent medical supplies. In October 2016, the start-up Zipline partnered with the Rwandan government to facilitate the real-time delivery of urgent medical supplies, such as blood and vaccines, to patients in remote locations via drones (named “Zips”).[117] The Zips, which have a 75-kilometer service radius and can carry 1.5 kilograms of payload per sortie and operate in most weather conditions, seamlessly fly over treacherous terrain in as little as 30 minutes—a trip that traditionally took as much as four hours to cover in a vehicle.[118] By May 2017, Zipline averaged over 20 weekly deliveries, providing near-real-time access to life-saving medical supplies for over 8 million Rwandans, or nearly two-thirds of the country’s total population of 12 million.[119]
Drones also played an important role in combatting COVID-19. In 2020, Zipline partnered with a North Carolina hospital to become the first emergency drone logistics operation to help U.S. hospitals respond to the pandemic.[120] Elsewhere, America’s United Parcel Service teamed up with the CVS drugstores to begin delivery of prescription medicine via Matternet’s M2 drones to Florida residents.[121] Similarly, the Alphabet subsidiary Wing and Nevada-based start-up Flirtey are working to pioneer drone delivery of groceries and household goods, with customer demand for the service increasing 350 percent during the pandemic.[122] A June 2021 GlobeNewswire report noted that “rising demand for contactless deliveries of medical supplies and other essentials using drones owing to COVID-19 are some of the factors driving the growth of the UAV market [in 2020].”[123] Drones are playing increasingly important roles in ensuring individuals’ health, improving quality of life, and enhancing the productivity and innovation capacity of a wide variety of industries, and therefore certainly merit ITA-3 inclusion.
Medical Technologies
Medical devices play critical roles in healthcare, from devices that directly protect patient health (e.g., implantable cardiac devices) to those that facilitate diagnosis (e.g., magnetic resonance imaging (MRI) machines) to remote patient monitoring devices (e.g., fall monitors) or ones that improve quality of life (e.g., personal fitness trackers). Medical devices contribute to improved quality of life, to a greater ability to productively work, and to longer lives, all of which contribute to nations’ economic growth. For instance, economists Kevin Murphy and Robert Topel estimated that increases in life expectancy between 1970 and 1990 contributed $57 trillion, or $2.8 trillion per year, to the U.S. economy, with the average additional year of life estimated to be worth $150,000 per person (although this varies with age).[124] Moreover, in the United States, advanced medical technology helped reduce the number of days spent in hospitals by 59 percent from 1980 to 2010, and the use of key medical technologies in four disease areas alone (diabetes, colorectal cancer, musculoskeletal disease, and cardiovascular disease) expanded U.S. GDP by $106.2 billion, providing a net annual benefit of $23.6 billion to the economy due to better treatment, reduced disability, and increased productivity.[125] No doubt, nations around the world similarly realize both patient health and broader economic benefits from the greater availability and cost efficiency of medical devices.
The 2016 ITA-2 introduced for the first time a variety of medical devices, including MRI machines and computed tomography (CT) scanners, into ITA coverage.[126] The ITA-3 expansion again proposes widening the range of medical devices and equipment receiving coverage, including, among others:
▪ Microfluidics (HS 8479.79 and 9027.80); and
▪ Photographic plates for X-rays (HS 3701.10).
These items should be included in an ITA-3. Moreover, with the world still reeling from the COVID-19 pandemic, nations should be considering doing all they can to reduce the costs of medical goods and equipment—and by bringing those with heavy ICT components under ITA coverage, they can further such aims.
Analyzing the Economic Impacts of a Proposed ITA-3 Expansion
For most countries that have joined it, ITA participation has succeeded in fostering ICT-driven economic growth. ICT boosts productivity, supports innovations, and expands access to digital services that improve quality of life. Since less-economically developed nations may suffer a shortfall in their stock of ICT capital and ability to produce such goods domestically, an effective way to grow their ICT capital stock is by joining the ITA. As noted, this report examines the economic impact of 14 countries—Brazil, China, Costa Rica, Indonesia, Japan, Kenya, Malaysia, Nigeria, Pakistan, South Korea, Taiwan, Thailand, the United States, and Vietnam—joining the ITA-3. (A subsequent section of this report will examine the economic impact for countries not in the ITA-1 or ITA-2 joining the ITA all the way through the first two agreements as well as this proposed ITA-3.) ITIF selected these countries both because they are among the most important in ICT goods production and trade and because they provide a sample set of large and small economies to model impacts of the proposed ITA-3 expansion. This section proceeds by briefly describing the economic framework and methodology used in the analysis, applying the model in order to estimate the anticipated 1-year and 10-year economic impacts of full ITA accession for study countries, and then assessing the impact ITA accession would likely have on government income.
Summary Explanation of Methodology and Data Sources
Data for calculating trade in ITA goods comes from the UN Comtrade Database. International trade accounts for products using HS2017 codes detailing imports with the specificity of six digits to categorize items. A six-digit code, however, still encompasses multiple items. Many countries, including the United States, distinguish product codes based on the HS categorization beyond six digits. The United States maintains HS codes at the eight-digit level, allowing ITIF to approximate the percentage of products within an HS6 code incorporated into the proposed ITA-3 expansion. Applied tariff rates at the six-digit level per country for each trading partner are available via the World Bank’s World Integrated Trade Solution (WITS) database. By multiplying the corresponding effective tariff rates (while accounting for Most Favored Nation and preference agreements) with a given country’s import value data (excluding reimports) for the 251 proposed HS6 codes comprising the proposed ITA-3, ITIF calculated a country’s average effective applied tariff rate on ITA-3 goods by dividing the sum of effective ITA-3 tariff revenue by the sum of ITA-3 total import value. This average tariff rate under the ITA-3 expansion would be reduced to zero for participating countries. The removal of tariffs on ITA-3 products would effectively function as a price cut on ICT products to the benefit of domestic consumers (organizations and individuals alike) that can then afford more ICT at a reduced price.
Moreover, economists have found that demand for ICT products is price elastic, whereby ICT consumption rises by a factor greater than its price reduction. ITIF’s model for estimating the economic impacts of ITA-3 accession uses a price elasticity of 1.3 for ICT products based on research findings pioneered by Cette et al. in 2012.[127] A country’s imports, however, could be inhibited in part by domestic producers’ ability to respond competitively by lowering costs and maintaining an advantage against imports when tariffs are eliminated. ITIF opted for this estimate regarding the price elasticity of ICT imports because it was estimated controlling for a substitution effect on imports that comes from competing domestic firms after ITA accession. This resulting price elasticity for ICT demand allows one to estimate the annual growth in imports of ICT goods anticipated by eliminating tariffs on ITA-3 products, whereby a 1.0 percent decrease in ICT price (via removed tariffs) induces a 1.3 percent increase in consumption of those goods, with this heightened consumption further increasing the extent of a country’s ICT capital stock.
Economists have found that demand for ICT products is price elastic, with a 1 percent decrease in ICT price inducing on average a 1.3 percent increase in consumption of ICT products.
Over time, increased ICT consumption and the resulting growth in a nation’s ICT capital stock creates widespread positive externalities. A proliferation of ICT allows workers to provide services more efficiently and businesses to innovate their products and operations, thus raising overall productivity and economic growth. Leveraging Cardona et al.’s research, ITIF applied the growth factor suggesting that a 1 percent increase in a nation’s net ICT capital stock generates a 0.06 percent increase in a nation’s real GDP.[128] Multiplying a country’s estimated annual net growth in ICT capital stock by this growth factor provides an estimate of the potential GDP growth from extending ITA coverage onto proposed ITA-3 products. ITIF computed 10-year average growth rates for real GDP and imports specific to each country. Yearly net ICT capital stock and GDP growth estimates enable forecasting of the total cumulative GDP growth a nation may experience over 10 years due to joining the proposed ITA-3 expansion. The following flowchart summarizes the analytical framework ITIF’s model uses to estimate the economic impacts of ITA-3 on the study countries. (See figure 9.)
Figure 9: ITIF’s analytical framework for modeling the benefits of ITA accession
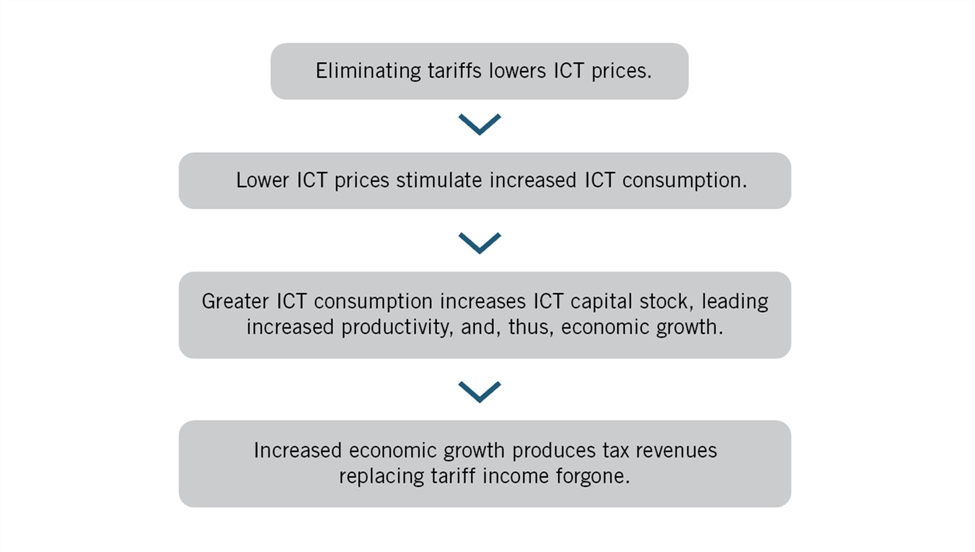
As the model illustrates, while tax revenues fall in the short run (e.g., one year post ITA-3 accession) due to tariffs on products that would come under ITA coverage reducing to zero, additional tax revenue is recovered in the long run (e.g., 10 years post ITA-3 accession) through standard means of taxation as economies grow. A growing economy means businesses increase revenues and workers earn higher incomes (thus consuming more goods and services), a dynamic that helps countries’ recover some, if not all, tariff revenues initially lost due to joining the ITA.
Modeling the Economic Impacts of ITA-3 Accession
ICT Import Profile of Countries
Despite global digitalization trends, many countries still vary widely in their ICT import profile. Using the common base year for available import data of 2019, ITIF calculated the total value of ITA-3 imports per country. Table 3 provides the ICT import profile of each country, showing the full value of ITA-3 imports per country as well as total tariff revenue raised from ITA-3 imports, alongside officially reported trade statistics to control for any unobservable inconsistencies between model and official reporting of import findings.
Table 3: ICT import profile for ITA-3 products[129]
|
Country |
Total Sum of ITA-3 Imports (U.S. Millions) |
Total Sum of All Imports (U.S. Millions) |
ITA-3 Share of Total Imports |
Total Sum of ITA-3 Tariff Revenue (U.S. Millions) |
Official Sum of Tariff Revenue Across All Imports (U.S. Millions) |
Average Effective Applied Tariff Rate on ITA-3 Imports |
|
Brazil |
$15,394 |
$177,348 |
8.68% |
$1,697 |
$10,857 |
6.12% |
|
China |
$193,142 |
$2,068,950 |
9.34% |
$5,680 |
$41,820 |
2.02% |
|
Costa Rica |
$1,589 |
$16,106 |
9.86% |
$11 |
$281 |
1.75% |
|
Indonesia |
$16,828 |
$171,276 |
9.82% |
$134 |
$2,655 |
1.55% |
|
Japan |
$70,630 |
$720,895 |
9.80% |
$274 |
$9,106 |
1.26% |
|
Kenya |
$893 |
$17,210 |
5.19% |
$76 |
$1,390 |
8.07% |
|
Malaysia |
$16,287 |
$204,906 |
7.95% |
$120 |
$660 |
0.74% |
|
Nigeria |
$5,602 |
$47,369 |
11.83% |
$381 |
$2,729 |
5.76% |
|
Pakistan |
$2,500 |
$50,063 |
4.99% |
$276 |
$6,292 |
12.57% |
|
South Korea |
$51,842 |
$503,263 |
10.30% |
$1,018 |
$6,538 |
1.30% |
|
Taiwan |
$24,871 |
$285,906 |
8.70% |
$370 |
$9,183 |
3.21% |
|
Thailand |
$21,064 |
$240,139 |
8.77% |
$442 |
$3,151 |
2.10% |
|
United States |
$291,952 |
$2,567,492 |
11.37% |
$7,683 |
$78,162 |
3.04% |
|
Vietnam |
$39,847 |
$253,442 |
15.72% |
$246 |
$4,294 |
1.69% |
Economic Impact of the Elimination of ITA-3 Tariffs
By confirming our estimates against total officially reported tariff revenues in the OECD’s Global Revenue Statistics (GRS) Database, ITIF calculated the average effective applied tariff rate on ITA-3 imports for study countries. Of the 14 countries, Pakistan maintained the highest average effective tariff rate applied to ITA-3 goods at 12.6 percent. Kenya followed Pakistan at 8.1 percent, with Brazil next at 6.1 percent, and Nigeria at 5.8 percent. (See table 4.) Many nations—such as Costa Rica, Indonesia, Malaysia, South Korea, Taiwan, Thailand, and Vietnam—have substantially high ITA-3 shares of total imports but maintain low average tariff rates, near or below 3 percent. These nations seek to capitalize on a steady inflow of ICT imports with low average tariffs on those products to produce some revenue without heavily distorting sensitive technology markets that comprise ICT trade. But this still fails to maximize the total economic benefits to be gained from importing ICT. This tariff rate is indicative of the corresponding price decrease ITA-3 products would effectively enjoy when imported under the proposed ITA-3 expansion. If signatories set tariff rates to zero under ITA coverage, eliminating such tariffs would increase consumption of ITA-3 imports even further due to the high price elasticity of ICT.
Table 4: Impact of tariff elimination on ITA-3 product imports[130]
|
Country |
Average Effective Applied Tariff Rate on ITA-3 Imports |
Increase in ITA-3 Imports |
Increase in ITA-3 Imports (U.S. Millions) |
Growth in Total Imports Post ITA-3 Accession |
|
Brazil |
6.12% |
7.96% |
$1,225 |
0.69% |
|
China |
2.02% |
2.63% |
$5,075 |
0.25% |
|
Costa Rica |
1.75% |
2.27% |
$36 |
0.22% |
|
Indonesia |
1.55% |
2.02% |
$339 |
0.20% |
|
Japan |
1.26% |
1.64% |
$1,160 |
0.16% |
|
Kenya |
8.07% |
10.50% |
$94 |
0.54% |
|
Malaysia |
0.74% |
0.96% |
$156 |
0.08% |
|
Nigeria |
5.76% |
7.49% |
$420 |
0.89% |
|
Pakistan |
12.57% |
16.34% |
$408 |
0.82% |
|
South Korea |
1.30% |
1.69% |
$876 |
0.17% |
|
Taiwan |
3.21% |
4.18% |
$1,038 |
0.36% |
|
Thailand |
2.10% |
2.73% |
$575 |
0.24% |
|
United States |
3.04% |
3.96% |
$11,554 |
0.45% |
|
Vietnam |
1.69% |
2.20% |
$878 |
0.35% |
Based on the price elasticity of 1.3 for ICT goods demanded, ITIF estimated an expansion of ITA-3 imports of between 1 and 16.3 percent among countries sampled, dependent on those countries’ current tariff rates. (See table 4.) Pakistan, the nation with the highest applied tariff rate on ITA-3 imports (12.6 percent), could expect a 16.3 percent increase in ITA-3 imports. Conversely, Malaysia would expect a 1 percent increase in ITA-3 imports, given it has the lowest average applied tariff rate on ITA-3 imports (0.74 percent).
While eight countries—the majority in the study—would expect an increase of ITA-3 imports less than 3 percent, a few percentage points increase in ITA imports swiftly grows those nations’ stocks of ICT capital. In one year following ITA-3 accession, all countries’ net ICT capital stock would grow between 0.36 and 6 percent due to increased ITA imports. (See table 5.) Using an unweighted average derived from depreciation rates from the Conference Board, ITIF estimated an average depreciation rate of ICT capital of 32.8 percent.[131] This expansion in ICT capital stock occurs even with the high rate of depreciation common to ICT. Since this model ties ICT capital stock growth to increased ICT consumption due to eliminating tariffs, countries expecting the highest net growth in ICT capital stock are the same nations with the highest average effective applied tariff rates. Table 5 provides details regarding each country’s expected growth in ICT capital stock in one year from joining the ITA-3. Pakistan, for example, would experience the highest growth in ICT capital stock at 6 percent, since its tariff rate is the highest in the set. Conversely, with the lowest average tariff rate on ICT, Malaysia would have the lowest growth in ICT capital stock at 0.36 percent.
Table 5: Nations’ ICT capital stock growth from joining an ITA-3[132]
|
Country |
Current ICT Capital Stock (U.S. Millions) |
ITA-3 Attributable Contribution to ICT Capital Stock (U.S. Millions) |
Percent of ITA-3 Attributable Growth in ICT Capital Stock |
|
Brazil |
$45,559 |
$1,225 |
2.69% |
|
China |
$482,020 |
$5,075 |
1.05% |
|
Costa Rica |
$4,409 |
$36 |
0.82% |
|
Indonesia |
$44,498 |
$339 |
0.76% |
|
Japan |
$209,674 |
$1,160 |
0.55% |
|
Kenya |
$2,336 |
$94 |
4.01% |
|
Malaysia |
$43,166 |
$156 |
0.36% |
|
Nigeria |
$15,540 |
$420 |
2.70% |
|
Pakistan |
$6,831 |
$408 |
5.98% |
|
South Korea |
$145,165 |
$876 |
0.60% |
|
Taiwan |
$69,079 |
$1,038 |
1.50% |
|
Thailand |
$58,464 |
$575 |
0.98% |
|
United States |
$841,338 |
$11,554 |
1.37% |
|
Vietnam |
$102,935 |
$878 |
0.85% |
ICT Capital Stock and Economic Growth
This report’s model for calculating ITA-spurred growth closely follows the methodology developed in ITIF’s 2017 report, “How Joining the Information Technology Agreement Spurs Growth in Developing Nations,” which was ultimately based on modeling best practices from Bora et al. in 2010 and Henn et al. in 2015.[133] However, the growth-revenue estimation model employed in this paper brings nuance to the literature by providing more-precise estimates of ITA imports traded between countries using HS6 adjustment factors. The model accounts solely for consumption and capital imports to exclude any reimports that would distort growth estimates and calculates adjustment factors as the share of eight/ten-digit codes within a single six-digit code covered under ITA-3 treatment via UN Comtrade data. These adjustment factors serve as proxies applied to other countries to account for the share of goods traded within a six-digit code to be fully covered by the proposed ITA-3 expansion.
Following the expansion of a nation’s ICT capital stock, ITIF’s model connects it to other countries’ economic growth. As noted, several papers document this linkage. Niebel found that, on average, a 1 percent increase in ICT capital stock is associated with 0.05 to 0.09 percent GDP growth in a given year, regardless of a country’s level of economic development.[134] Cardona et al. found, after extensive review of econometric literature covering the statistical relationship between ICT capital stock and economic growth, that a 1 percent increase in ICT capital stock associates with a 0.06 percent increase in GDP growth.[135] Here, ITIF defaulted to a conservative estimate of 0.06 percent both to intentionally prevent overstating findings and to maintain consistency with prior ITIF studies modeling economic impacts of countries’ ITA accession. Due to this conservative growth factor, GDP growth estimated from ITA-3 accession is likely even higher than reflected here.
Table 6 provides GDP growth estimates in the first year following ITA-3 accession. Again, this methodology finds that countries with the highest tariffs imposed on ITA-3 goods stand to gain the most. Pakistan, Kenya, Nigeria, and Brazil are the countries that could anticipate the greatest economic growth in a given year as a result of ITA-3 accession. By reducing its average effective tariff rate of 12.6 percent applied to ITA-3 goods to zero, Pakistan could expect an estimated 0.36 percent GDP growth just one year after an ITA-3 accession. Kenya would expect a 0.24 percent increase in GDP growth in the first year after eliminating its 8.1 percent average ITA-3 tariff rate. Nigeria and Brazil, imposing very similar average effective tariff rates on ITA-3 goods, could both expect a 0.16 percent increase in GDP a year after having accepted the
ITA-3 proposal.
All study countries could experience notable annual GDP growth from joining an ITA-3, with Pakistan, Kenya, Nigeria, and Brazil potentially the most-significant beneficiaries.
All study countries could experience notable annual GDP growth from joining an ITA-3. Even the lowest-tariff-imposing country, Malaysia, still experiences a 0.02 percent growth in GDP in the first year of joining. While 0.02 percent may sound negligible, the additional GDP growth attributable to ITA-3 accession after 10 years would be undeniable.
Table 6: Projected one-year economic growth resulting from ITA-3 accession
|
Country |
Annual Real GDP Growth |
ITA-3 Attributable GDP Growth (Year One) |
|
Brazil |
1.39% |
0.16% |
|
China |
7.67% |
0.06% |
|
Costa Rica |
3.63% |
0.05% |
|
Indonesia |
5.42% |
0.05% |
|
Japan |
1.29% |
0.03% |
|
Kenya |
5.84% |
0.24% |
|
Malaysia |
5.33% |
0.02% |
|
Nigeria |
3.65% |
0.16% |
|
Pakistan |
4.19% |
0.36% |
|
South Korea |
3.31% |
0.04% |
|
Taiwan |
3.60% |
0.09% |
|
Thailand |
3.63% |
0.06% |
|
United States |
2.30% |
0.08% |
|
Vietnam |
6.31% |
0.05% |
Table 7 details the long-term economic growth countries could enjoy as a result of ITA-3 expansion. Even though it would have the lowest percentage growth rate, ITA-3 accession could still add nearly $1.3 billion to Malaysia’s economy over 10 years. Beyond the example of the minimum-tariff country, Japan and South Korea could expect 10-year cumulative growth of 0.34 and 0.36 percent, respectively. The remaining 11 countries would expect near or above a 0.5 percent increase in GDP attributable to ITA-3 expansion. The countries poised to realize the greatest GDP growth (as a share of their original 2019 GDP) by joining the ITA-3 are Pakistan, Kenya, Brazil, and Nigeria. Over 10 years, as noted, Pakistan’s economy could cumulatively grow by 3.2 percent, Kenya’s by 2.15 percent, and Brazil and Nigeria each by about 1.6 percent. In absolute terms, the top four highest-growing economies due to ITA-3 accession (in order) are the United States, China, Brazil, and Japan, simply due to their already far-higher GDP and populations than other (largely developing) nations in the study.
Table 7: Projected long-run economic growth benefits from joining an ITA-3
|
Country |
GDP (2019, U.S. Billions) |
Average Annual Real GDP Growth |
Cumulative 10-Year GDP Growth Attributable to ITA-3 Expansion (%) |
Cumulative 10-Year GDP Growth Attributable to ITA-3 Expansion (U.S. Billions) |
|
Brazil |
$1,810 |
1.39% |
1.62% |
$33.68 |
|
China |
$14,318 |
7.67% |
0.59% |
$175.59 |
|
Costa Rica |
$62 |
3.63% |
0.47% |
$0.42 |
|
Indonesia |
$1,049 |
5.42% |
0.44% |
$7.90 |
|
Japan |
$4,553 |
1.29% |
0.34% |
$17.60 |
|
Kenya |
$80 |
5.84% |
2.15% |
$3.01 |
|
Malaysia |
$364 |
5.33% |
0.21% |
$1.27 |
|
Nigeria |
$511 |
3.65% |
1.61% |
$11.74 |
|
Pakistan |
$325 |
4.19% |
3.20% |
$15.71 |
|
South Korea |
$1,635 |
3.31% |
0.36% |
$8.19 |
|
Taiwan |
$691 |
3.60% |
0.89% |
$8.76 |
|
Thailand |
$460 |
3.63% |
0.60% |
$3.92 |
|
United States |
$19,975 |
2.30% |
0.83% |
$208.64 |
|
Vietnam |
$251 |
6.31% |
0.54% |
$2.52 |
Figure 10: Projected economic growth attributable to ITA-3, cumulatively over 10 years[136]
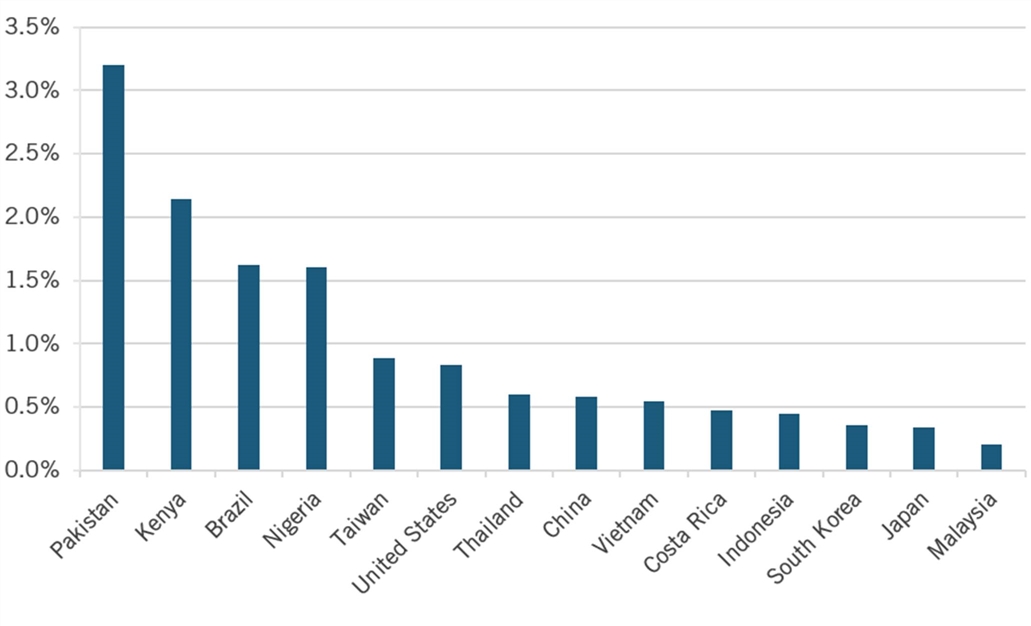
Figure 10 provides a ranking of all 14 nations’ 10-year cumulative growth anticipated from joining the proposed ITA-3. Here, Pakistan, Kenya, Brazil, Nigeria, Taiwan, the United States, and Thailand are the largest beneficiaries of an ITA-3. While all nations benefit considerably, these seven nations experience the highest relative growth in real GDP due to an ITA-3 expansion.
Over 10 years from their accession to this proposed ITA-3, this set of 14 countries could expect to generate a combined cumulative increase to global GDP of nearly $500 billion. This set of 14 countries comprised about 62 percent of global ICT imports in 2019, and as noted, the WTO found that the 82 ITA-1 signatories account for 97 percent of global trade in ITA-covered products. Using these two statistics to scale total global GDP impacts between modeled countries, ITIF found that global GDP would be expected to cumulatively rise by $784 billion over 10 years if all 82 signatories of ITA-1 were to join the proposed ITA-3.
If all 82 ITA-1 signatory countries were to join the proposed ITA-3, global GDP could cumulatively grow by $784 billion over the ensuing 10 years.
Addressing Developing Countries’ Potential Concerns Regarding ITA Accession
While the potential economic benefits for developing countries are evident in joining an ITA-3, some concerns may remain for policymakers. Multiple developing nations, some modeled in this study, still have not joined the ITA in any capacity. Such countries usually justify their non-participation in the ITA on the fear of losing revenues from tariffs on ICT goods or on protectionist grounds of seeking to preserve domestic ICT industries and employment. However, ITIF’s model finds robust evidence on tax revenues recovered elsewhere from a growing economy that further justifies ITA membership among developing nations.
ITA Tariffs and Government Finances
Some developing-nation policymakers have argued against joining the ITA believing that tariff revenue from ICT goods imports is too essential to forgo. Tariff revenues on ICT in developing countries are often easily collected and may comprise a considerable share of government revenue, thereby seeming like a stable revenue stream to policymakers. However, ITIF’s growth-revenue estimation model finds this policy rationale flawed. While in the short run tariffs forgone as a result of ITA accession could create a revenue shortfall, the ICT-fueled growth created from joining the ITA provides alternative sources for additional taxes to be raised. Most developing countries do rely more on tariffs to raise government funds than do developed ones. Figure 11 depicts this, showing that for the 14-country sample, developing countries such as Pakistan, Kenya, and Vietnam are the most tariff revenue-intensive nations. Further, developed and emerging countries such as South Korea, the United States, China, and Japan are the least tariff revenue intensive, after Malaysia. (Malaysia is an outlier here due to its especially low effective applied rates.)
Figure 11: Tariff revenue as a share of GDP, 2019[137]
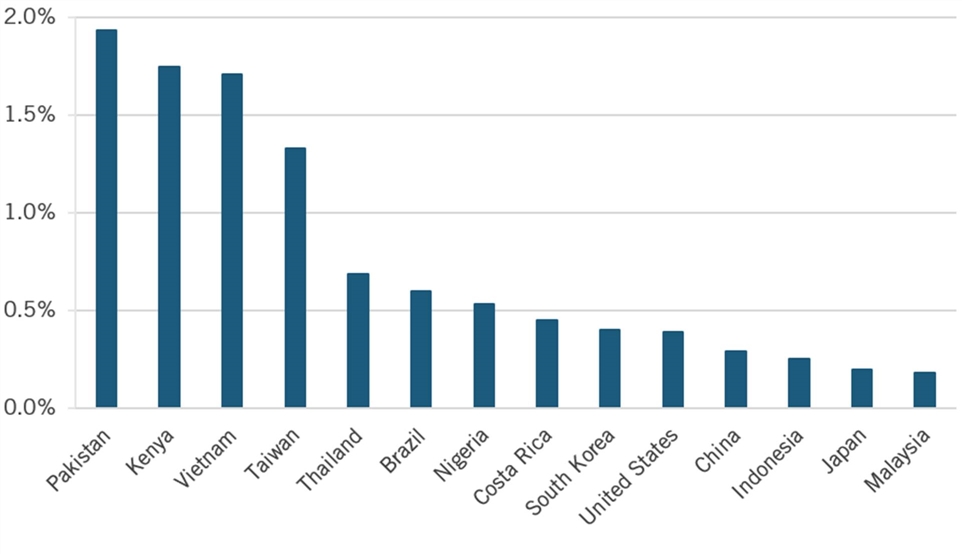
Figure 12 illustrates a similar trend in countries’ taxation compositions. Nigeria, Kenya, Vietnam, Pakistan, and Taiwan maintained the highest tariff shares of total government taxation during 2019. Nigeria collected 10.8 percent of its taxes via tariffs, whereas Japan, the least tariff reliant, had only 0.6 percent of its taxes collected from tariffs. Wealthier nations such as Japan, China, Malaysia, and the United States were less tariff reliant in their taxation.
Figure 12: Tariff revenue as a share of total taxation, 2019[138]
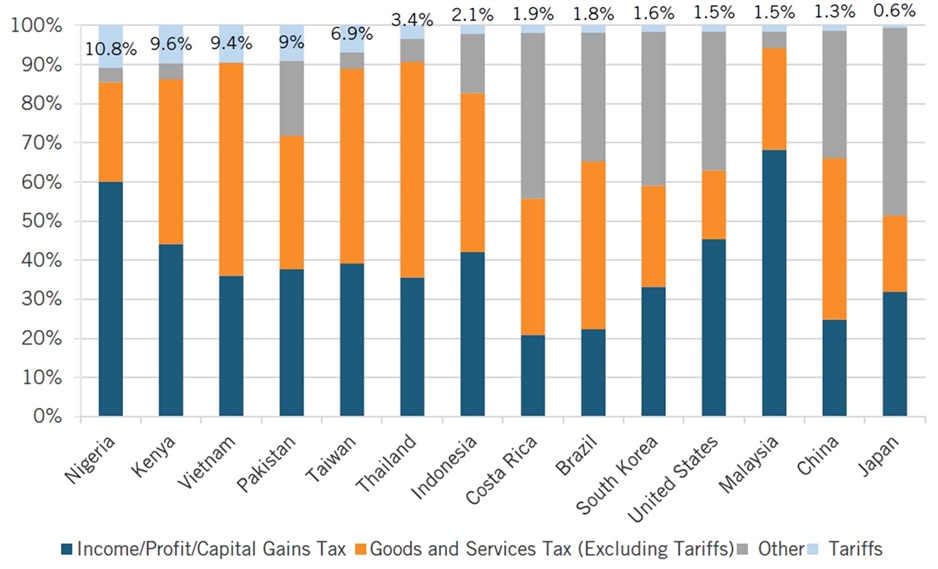
Tax Revenue Analysis Post ITA Accession
To provide complete analysis of the net economic benefits of ITA-3 accession, ITIF analyzed projected tax revenues resulting from each country’s entrance into an ITA-3. Combining tax rate data with ITA-3 import data and the growth estimates provided in this paper’s previous section, ITIF quantified losses in tariff revenue forgone and the collection of tax revenues made by countries thanks to the ICT-driven growth they experience from an ITA-3. As a nation’s economy grows, businesses increase revenues and workers take home higher incomes and thus increase their consumption. These two main channels—income and consumption—increase tax revenue when the economy is growing. To approximate average tax rates for income and consumption by country, ITIF used OECD data from its GRS database.[139] Income tax (attempting to aggregate national income) is approximated by the GRS database’s indicator “Taxes on Income, Profits, and Capital Gains.” Consumption tax (aggregating consumer activity nationwide) is proxied by the GRS indicator “General Taxes on Goods and Services.” Table 8 summarizes the tax rates used to assess each country’s growth-revenue estimates attributable to ITA-3 accession.
Table 8: Generalized effective tax rates[140]
|
Country |
ITA-3 Tariff Rate |
Income Tax Rate |
Consumption Tax Rate on Goods and Services |
|
Brazil |
6.12% |
7.40% |
12.1% |
|
China |
2.02% |
5.50% |
6.7% |
|
Costa Rica |
1.75% |
4.90% |
4.4% |
|
Indonesia |
1.55% |
4.90% |
3.4% |
|
Japan |
1.26% |
10.20% |
4.1% |
|
Kenya |
8.07% |
7.70% |
4.2% |
|
Malaysia |
0.74% |
8.50% |
1.0% |
|
Nigeria |
5.76% |
3.80% |
0.9% |
|
Pakistan |
12.57% |
3.50% |
17.0% |
|
South Korea |
1.30% |
9.10% |
4.3% |
|
Taiwan |
3.21% |
8.60% |
5.0% |
|
Thailand |
2.10% |
6.10% |
3.6% |
|
United States |
3.04% |
11.10% |
2.0% |
|
Vietnam |
1.69% |
6.30% |
6.0% |
The model applies these generalized effective tax rates onto ITIF’s estimations of GDP growth attributable to the ITA-3. Table 9 summarizes both the short- and long-run revenue implications of ITA accession. In all short-run cases, removing tariffs on ITA-3 products indeed creates a revenue shortfall. Even countries with the highest share of revenues recovered, such as Pakistan and Brazil, whose high tariff rates and low import growth rates cause them to recover an estimated 42.5 percent and 38.7 percent of revenue forgone, respectively, still experience a short-term loss. Despite this, Pakistan already recovers nearly half of the revenue lost in the first year, and Brazil recovers over one-third. Conversely, Nigeria, South Korea, Thailand, and Vietnam would be impacted the most in the short term, as these four countries would recover no more than 9 percent of revenue lost in the first year.
Table 9: Tax revenue impact from joining an ITA-3[141]
|
Year-1 Estimate |
Tariff Revenue Forgone (U.S. Millions) |
Consumption Tax Revenue Gained (U.S. Millions) |
Income Tax Revenue Gained |
Revenue Gained as Percentage of Revenue Forgone |
|
Brazil |
$942 |
$148 |
$216 |
38.7% |
|
China |
$3,904 |
$340 |
$497 |
21.5% |
|
Costa Rica |
$28 |
$2 |
$1 |
11.1% |
|
Indonesia |
$261 |
$12 |
$24 |
13.4% |
|
Japan |
$892 |
$48 |
$154 |
22.6% |
|
Kenya |
$72 |
$4 |
$15 |
25.9% |
|
Malaysia |
$120 |
$2 |
$30 |
26.4% |
|
Nigeria |
$323 |
$4 |
$22 |
8.1% |
|
Pakistan |
$314 |
$69 |
$64 |
42.5% |
|
South Korea |
$674 |
$38 |
$11 |
7.2% |
|
Taiwan |
$799 |
$52 |
$54 |
13.2% |
|
Thailand |
$442 |
$21 |
$17 |
8.4% |
|
United States |
$8,888 |
$231 |
$1,827 |
23.2% |
|
Vietnam |
$675 |
$53 |
$8 |
9.0% |
|
Year-10 Estimate |
Tariff Revenue Forgone (US$ Millions) |
Consumption Tax Revenue Gained (US$ Millions) |
Income Tax Revenue Gained (US$ Millions) |
Revenue Gained as Percentage of Revenue Forgone |
|
Brazil |
$1,486 |
$234 |
$2,492 |
183.5% |
|
China |
$8,810 |
$767 |
$9,657 |
118.3% |
|
Costa Rica |
$41 |
$2 |
$20 |
55.6% |
|
Indonesia |
$531 |
$23 |
$387 |
77.4% |
|
Japan |
$1,270 |
$68 |
$1,795 |
146.7% |
|
Kenya |
$130 |
$7 |
$232 |
184.0% |
|
Malaysia |
$214 |
$3 |
$108 |
51.6% |
|
Nigeria |
$659 |
$8 |
$446 |
68.9% |
|
Pakistan |
$530 |
$117 |
$550 |
125.8% |
|
South Korea |
$1,150 |
$64 |
$746 |
70.4% |
|
Taiwan |
$1,439 |
$94 |
$754 |
58.9% |
|
Thailand |
$869 |
$41 |
$239 |
32.2% |
|
United States |
$14,663 |
$381 |
$23,159 |
160.5% |
|
Vietnam |
$2,488 |
$194 |
$159 |
14.2% |
However, significant losses in the short run don’t necessitate large losses over the long run. These macroeconomic net effects recover as time passes and as ICT bolsters the economy. By Year 10, Nigeria and South Korea both recover more than two-thirds of the annual revenue hole created from eliminating ITA-3 tariffs. In year one, Nigeria and South Korea recover smaller shares of revenue forgone than Vietnam, but by Year 10, Vietnam’s share of taxes recovered only rises by about 5 percentage points.
ITA-3 accession is an especially win-win trade policy for nations estimated to experience growth while fully closing the tariff revenue hole by Year 10. Pakistan grows its economy by 3.2 percent after 10 years of cumulative ICT-induced growth. It recovers 126 percent of tariff revenue forgone during its 10th year after joining the ITA-3, more than completely filling the revenue shortfall created from eliminating the tariffs. Kenya, after 10 years, grows its economy by over 2.2 percent and recovers a higher share of Year-10 revenue than any other country in the model, at 184 percent of revenue forgone. Kenya’s new tax revenue in Year 10 nearly doubles the value of tariff revenues forgone in Year 10 due simply to the fact that its expected GDP growth substantially raises income and consumption taxes collected. Similarly, Brazil, which could anticipate a 1.6 percent cumulative growth in GDP over 10 years, would expect a near-identical share of recovered revenues in the 10th year, at 183 percent.
Tariff losses in the short run from ITA-3 accession don’t necessarily indicate large revenue losses over the long run, thanks to the increased economic growth ITA participation engenders.
While Brazil and Kenya differ in their ITA-3 tariff rates and total GDP growth attributable to ITA-3, they experience roughly the same shares of revenue recovered in Year 10 because of Brazil’s larger absolute GDP but slower GDP growth rate in the status quo before joining the ITA-3. Brazil’s 2019 real GDP was over 20 times larger than Kenya’s, so the nation raises higher total revenues that makes its share of recovered revenue in Year 10 similar to Kenya’s. Pakistan’s generalized effective tax rates are also unique to the set. It’s the only country in the model whose consumption tax is more than twice as high as its income rate. Pakistan’s low income tax rate of 3.5 percent means that its government may expect a lower rate of return than would other countries on taxable growth. Even so, it remains a top beneficiary of an ITA-3 in both growth and revenue recovery. Brazil, China, Japan, Kenya, Pakistan, and the United States create more tax revenue than they forgo by the 10th year after ITA-3 accession. Further, 12 of the 14 countries in the study all recover over half of their tariff revenue shortfall by Year 10.
Thailand and Vietnam remain outliers in their low share of forgone revenue recovered in Year 10. Thailand recovers about 32 percent while Vietnam recovers just 14 percent. Their outlier status is due mainly to three factors. First, they are developing nations with lower absolute GDP than most other countries in the set. Second, they both have exceptionally high annual import growth rates in the status quo with no ITA-3 accession, at rates near double their average yearly GDP growth rates. And third, both Thailand and Vietnam have low average tariff rates on ITA-3 goods. These three economic characteristics lower the marginal value of taxing GDP growth instead of import growth. With high import growth rates (7 percent for Thailand and 14 percent for Vietnam) in the status quo, and low tariff rates, these countries are rare exceptions wherein imports are relatively price inelastic. Import growth remains high even with minor tariffs imposed, so their marginal increase in imports by lifting ITA-3 tariffs is less valuable for revenue creation than for other countries in the study. These circumstances, however, do not indicate that Thailand and Vietnam, nor any other country in the model, lack clear economic benefits from joining the ITA-3. All countries still experience valuable GDP growth in 10 years attributable to an ITA-3. However, some countries would still face long-run trade-offs in their revenue policy when considering joining the ITA-3. But for almost every country examined in this model, that trade-off is clear: ITA-3 accession promotes increased consumption of ICT imports, which grows a nation’s ICT capital stock. A growing ICT capital stock exerts numerous positive economic benefits by raising productivity and expanding access to digital services. Productivity-enhancing ICT expansion therefore ultimately drives at-large economic growth.
Further Implications for Developing Nations
Bridging the Digital Divide
Joining the ITA provides a pro-growth alternative for nations to collect tax revenues more efficiently, while helping developing countries bridge the digital divide and improve quality of life under a larger and more-productive economy. Among study countries, all but two nations (Japan and the United States) identify as developing economies under the WTO (although China should now certainly be accounted for as a developed economy, especially with respect to the ICT sector). While members of the WTO declare their development status because the WTO provides no formal definition between developed and developing countries, some general disparities still prevail between the two. Developing nations typically have lower GDP per capita and lower overall standards of living.[142]
Increasing levels of ICT capital stock represents a particular benefit of ITA accession for developing nations, ones that, in this study, can anticipate a 10-year growth of 61 percent due to ITA-3 expansion.
One particular line observed between developed and developing countries is the growing digital divide between them. Developing nations, lagging behind the developed world’s level of digital services, technology innovations, and overall ICT capital stock, have a unique advantage in joining the ITA. As detailed in the previous section, joining the ITA-3 proposal provides clear economic growth and recovers a large share of tax revenue forgone in eliminating tariffs for both developed and developing nations. In addition, an expansion in ICT capital stock achieved by joining the ITA is a benefit all its own for developing nations. Beyond implications of growth and revenue, developing countries improving access to equal technologies used by global leaders improves their competitive edge and produces other unexpected positive externalities through the proliferation of new ICT-powered digital services.
In most cases, developing nations experience more significant cumulative growth in their ICT capital stock over 10 years than do developed ones. While developed nations would create more considerable additions to their ICT capital stock in absolute terms, their percentage growth is heavily outweighed by developing partners. On average, in this sample, developing nations can anticipate a 10-year growth in their net ICT capital stock of 61 percent due to ITA-3, whereas developed ones only 30 percent. (See table 10.)
Table 10: Nations’ ICT capital stock growth resulting from an ITA-3 expansion[143]
|
Real GDP per Capita, 2019 |
Annual Real GDP Growth Rate |
Net ICT Capital Stock, Year 1 (U.S. Millions) |
Cumulative 10-Year % Growth in Net ICT Capital Stock Attributable to ITA-3 |
Cumulative 10-Year Growth in Net ICT Capital Stock Attributable to ITA-3 (in U.S. Millions) |
|
|
Brazil |
$8,575 |
1.39% |
$45,559 |
36.8% |
$16,746 |
|
China |
$9,986 |
7.67% |
$482,020 |
82.6% |
$398,002 |
|
Costa Rica |
$12,313 |
3.63% |
$4,409 |
32.3% |
$1,486 |
|
Indonesia |
$3,877 |
5.42% |
$44,498 |
62.9% |
$28,004 |
|
Japan |
$35,890 |
1.29% |
$209,674 |
22.7% |
$47,565 |
|
Kenya |
$1,513 |
5.84% |
$2,336 |
68.1% |
$1,592 |
|
Malaysia |
$11,392 |
5.33% |
$43,166 |
51.1% |
$22,073 |
|
Nigeria |
$2,543 |
3.65% |
$15,540 |
63.9% |
$9,932 |
|
Pakistan |
$1,502 |
4.19% |
$6,831 |
64.4% |
$4,397 |
|
South Korea |
$31,909 |
3.31% |
$145,165 |
41.3% |
$59,900 |
|
Taiwan |
$29,066 |
3.60% |
$69,079 |
49.5% |
$34,195 |
|
Thailand |
$6,606 |
3.63% |
$58,464 |
53.8% |
$31,444 |
|
United States |
$60,701 |
2.30% |
$841,338 |
38.1% |
$320,598 |
|
Vietnam |
$2,604 |
6.31% |
$102,935 |
126.6% |
$130,305 |
Assessment of Full ITA Membership for Non-ITA or ITA-1-Only Nations
In addition to analyzing the economic impacts of the proposed ITA-3, ITIF’s study also examines the economic impact of full ITA accession for the study countries that aren’t yet fully in either the ITA-1 or ITA-2, which for this analysis meant analyzing Brail, Kenya, Nigeria, and Pakistan’s full accession to the ITA (ITA-1, ITA-2, and ITA-3) and for Indonesia and Vietnam, their joining the ITA-2 and ITA-3 (which is one reason why, for them, the growth effects are lower than for the other four countries listed here).[144]
If Brazil and Pakistan joined the ITA all the way through the here-proposed ITA-3, they could expect their economies to be 3.2 percent and 3.8 percent larger, respectively, after 10 years than would otherwise be the case.
Table 11 summarizes key findings from an economic analysis of these countries’ potential full ITA accession. The analysis finds that if Brazil and Pakistan joined the ITA in full, each could expect their economy to cumulatively grow to be approximately 3.2 and 3.8 percent higher, respectively, than would otherwise be the case over the 10 years post ITA-3 accession. Kenya and Nigeria could expect 2.9 and 2.7 percent economic growth, respectively, over the baseline scenario. Brazil, Kenya, and Pakistan would more than fully recover their tariffs forgone after 10 years, while Indonesia and Nigeria would come close, more than two-thirds of the way there (77 and 69 percent, respectively), while Vietnam (due to its unique tax structure as subsequently explained) would need to seek revenue alternatives.
Under full ITA accession, all nations modeled would experience some additional improvement in long-run growth than in the scenario for just joining the ITA-3. These estimates vary in their marginal improvements based on a country’s intensity of tariffs and volume of trade for products included under ITA-1 and ITA-2. But extending the methodology for ITA-3 estimates onto full ITA membership bears some modeling limitations. For instance, calculating net ICT capital stock in the status quo when tracking all products covered in full ITA membership gives a larger estimate for a nation’s base value of ICT capital stock in the status quo (before any ITA adoption) than would be estimated with just ITA-3 products. So to maintain consistency when analyzing countries within the model, the same estimates for base ICT capital stock in the ITA-3 model are applied to full ITA models.
Table 11: The economic and tariff impact of full ITA membership, select nations[145]
|
Brazil |
Indonesia |
Kenya |
Nigeria |
Pakistan |
Vietnam |
|
|
GDP (2019, U.S. Billions) |
$1,810 |
$1,049 |
$80 |
$511 |
$325 |
$251 |
|
Weighted Average Effective Applied ITA Tariff Rate |
6.33% |
1.46% |
7.09% |
6.89% |
8.80% |
1.17% |
|
Year-1 GDP Growth Attributable to Full ITA Membership |
0.32% |
0.05% |
0.33% |
0.27% |
0.42% |
0.05% |
|
Cumulative 10-Year GDP Growth Attributable to Full ITA Membership |
3.20% |
0.52% |
2.91% |
2.73% |
3.77% |
0.58% |
|
Cumulative 10-Year GDP Growth from ITA Membership (In U.S. Billions) |
$66.4 |
$9.2 |
$4.1 |
$20.0 |
$18.5 |
$2.7 |
|
Year-10 Tax Revenue Generated, as Share of Tariff Revenue Forgone |
178.13% |
77.40% |
184.57% |
69.21% |
126.00% |
9.38% |
|
Difference in Tax Revenue during Year 10 of ITA Accession (U.S. Millions) |
$2,355 |
-$140 |
$148 |
-$343 |
$162 |
-$2,387 |
Second, average effective applied tariff rates between products in full ITA coverage may be lower than rates calculated solely for ITA-3 in some countries if they simply have lower average effective tariffs applied on ITA-1 and ITA-2 products than they do on ITA-3 goods. With a lower average effective tariff rate on full ITA membership, growth could be underestimated compared with ITA-3 estimates, even when full ITA membership accounts for more imports. To help correct for this, ITIF calculated trade volume-weighted average tariff rates per country to more accurately average tariff rates applied to ITA-3 goods and previous ITA goods. Despite these limitations, the results regarding the economic impacts of full ITA accession add robustness to the findings reported by the general ITA-3 model. Smaller developing nations such as Vietnam and Kenya still find their ICT capital stock growing at much faster rates than developed ones from joining the ITA. Moreover, all countries, regardless of their development status, enjoy higher economic growth cumulatively over 10 years and, through regular taxation on consumption and income, recover some or all of their tariff revenue forgone to spur ICT-driven growth.
Analyzing the Impact of ITA-3 Expansion on the United States
Evidence suggests that the ITA has been beneficial for the United States, both in terms of fostering the competitiveness of U.S. ICT industries and (as noted earlier) in reducing prices for ICT products that bolster productivity and enhance quality of life, such as personal computers and TVs. Regarding enhancing the competitiveness of the U.S. ICT sector, a 2016 study by the U.S. International Trade Commission “suggests that the ITA had a positive and statistically significant impact on U.S. exports of the covered products to the ITA member countries. The estimated impact on U.S. exports was $34.4 billion in 2010 (a 56.7 percent increase relative to the baseline).”[146]
ITIF found that an ITA-3 would also produce considerable benefits for the U.S. economy, including by contributing over $200 billion in economic growth, boosting U.S. exports of ICT products by $3.5 billion, increasing revenues of U.S. ICT firms by $12 billion, and supporting the creation of over 78,000 new U.S. jobs.
U.S. exports of proposed ITA-3 products to the 13 other nations in this study tallied $59.7 billion in 2019.[147] Noting that these 13 nations account for 77.1 percent of global ICT imports, ITIF applied a scaling factor of 1.29 to account for the exports of ITA-3 products U.S. firms make to other nations not in the study, leaving an estimate that total U.S. exports of proposed ITA-3 products to the world equals $77.3 billion. The country-weighted average of tariffs imposed on ITA-3 products by the 13 other countries in this report (plus EU 27 countries) is 3.4 percent (which ITIF here used as a rough proxy for a global average) so applying this and the aforementioned 1.3 elasticity multiplier suggests that the increase in global import demand for U.S. exports of ITA-3 products would be $3.45 billion.
An ITA-3 would contribute over $200 billion in U.S. economic growth, boost exports of ICT products by $3.5 billion, increase revenues of U.S. ICT firms by $12 billion, and support the creation of over 78,000 new U.S. jobs.
Given that the U.S. Department of Commerce reports that for every $1 billion in manufacturing exports, 6,250 jobs in manufacturing companies are created or supported, ITA-3 expansion would directly support the creation of approximately 21,575 jobs.[148] In January 2019, the Economic Policy Institute (EPI) provided updated employment multipliers for certain jobs in the U.S. economy, finding that each 100 jobs in durable manufacturing support an additional 289.1 jobs; that is, they have a multiplier of 2.89.[149] Applying this factor to 21,575 jobs created from the increased exports of ITA-3 products yields 62,350 new U.S. jobs created.
However, new American jobs would also be created through an additional dynamic. ITIF estimated, based on applying the previously described dynamics of decreasing tariff rates and the elasticity multiplier, that a fully implemented ITA-3 would result in a $35 billion increase in global imports of such ITA-3 products. Since U.S.-headquartered ICT enterprises account for about 34 percent of global ICT market share as of 2021, this means a significant share of this increased global demand will be filled by U.S. ICT-headquartered enterprises, even if those U.S. ICT goods manufacturers assemble certain products in Taiwan or China that are destined for sale in Germany or South Africa.[150] In other words, it’s not just about exports from within U.S. borders. Making the ITA larger would expand the overall global ICT market, making the U.S. ICT industry stronger in the process.[151] Thus, U.S. headquartered-enterprises, even if filling export orders from foreign affiliates, subsidiaries, or factories, may capture as much as $12.2 billion of this market. Indeed, even when some of those jobs are filled abroad, they often support U.S. employment at home, because employment in U.S. parents is likely to increase with increases in U.S. affiliate activity. In fact, one study finds that an increase in U.S. affiliate employment of 1 percent is associated with an increase in parent employment of 0.2 percent.[152] In other words, U.S. affiliate activity abroad is often a complement to, rather than a substitute for, the activity of parent companies in the United States.[153]
Considering that the average revenue per employee of the top 10 U.S. ICT goods manufacturers is about $500,000, this suggests that about 24,350 new workers will be needed to meet this demand. And with the average ratio of U.S. to foreign employees for the top 10 U.S. ICT goods manufacturers being about 0.47, this suggests that about 11,450 new jobs would be located in the United States. Presuming that many of these jobs would likely be in supportive research and development (R&D), supply chain, logistics, or other administrative roles, ITIF applied the very modest EPI multiplier of 1.42 for jobs in professional, scientific, and technical services fields to arrive at a total number of about 16,000 new jobs created through this dynamic, thus arriving at the total of 78,375 U.S. jobs created from a possible ITA-3 expansion.[154]
Conclusion
The ITA represents one of the world’s most successful plurilateral trade agreements. By creating zero-in/zero-out tariff environments, it has played a catalytic role in contributing to the evolution of global ICT GVCs that have enabled countries and enterprises to specialize in market segments wherein they enjoy a competitive advantage for the production of ICT goods. This, for instance, has led to semiconductors becoming the world’s fourth most traded product.[155] At the same time, by reducing their prices through tariff elimination, the ITA has facilitated greater global consumption of the ICT goods that lie at the heart of and fundamentally make possible the global digital economy. This increasing ICT capital stock within nations bolsters the productivity and innovation capacity of businesses (large and small alike), households, and individuals, translating to increased economic growth for all participants.
Embracing an ITA-3 would expand the range of productivity- and innovation-enhancing ICT products under ITA coverage, ensuring that the most novel, cutting-edge ICT products (including the most-current-generation forms of these technologies) are included. As noted, these products are already delivering significant environmental, health, and production benefits—and nations would be wise to include such products in an ITA-3 both to bolster the competitiveness of their own domestic industries and in the interest of achieving greater domestic, and global, economic growth. Moreover, an ITA-3 would produce considerable economic, export, and employment growth for the United States and the world. Now nearly a decade from when global stakeholders began to consider the initial ITA expansion, and five years on from ITA-2 implementation, it is time for nations to start thinking about an ITA-3, and carrying forward the robust momentum produced by the original ITA and its 2016 expansion.
Appendix A: List of Countries by Current ITA Membership[156]
|
ITA Signatory |
Joined ITA-2? |
ITA Signatory |
Joined ITA-2? |
|
Afghanistan |
No |
Lithuania |
Yes |
|
Albania |
Yes |
Luxembourg |
Yes |
|
Australia |
Yes |
Macao |
Yes |
|
Austria |
Yes |
Malaysia |
Yes |
|
Bahrain |
No |
Malta |
Yes |
|
Belgium |
Yes |
Mauritius |
Yes |
|
Bulgaria |
Yes |
Moldova |
No |
|
Canada |
Yes |
Montenegro |
Yes |
|
China |
Yes |
Morocco |
No |
|
Colombia |
Yes |
Netherlands |
Yes |
|
Costa Rica |
Yes |
New Zealand |
Yes |
|
Croatia |
Yes |
Nicaragua |
No |
|
Cyprus |
Yes |
Norway |
Yes |
|
Czech Republic |
Yes |
Oman |
No |
|
Denmark |
Yes |
Panama |
No |
|
Dominican Republic |
No |
Peru |
No |
|
Egypt |
No |
Philippines |
Yes |
|
El Salvador |
No |
Poland |
Yes |
|
Estonia |
Yes |
Portugal |
Yes |
|
Finland |
Yes |
Qatar |
No |
|
France |
Yes |
Romania |
Yes |
|
Georgia |
No |
Russia |
No |
|
Germany |
Yes |
Saudi Arabia |
No |
|
Greece |
Yes |
Seychelles |
No |
|
Guatemala |
Yes |
Singapore |
Yes |
|
Honduras |
No |
Slovakia |
Yes |
|
Hong Kong |
Yes |
Slovenia |
Yes |
|
Hungary |
Yes |
South Korea |
Yes |
|
Iceland |
Yes |
Spain |
Yes |
|
India |
No |
Sweden |
Yes |
|
Indonesia |
No |
Switzerland |
Yes |
|
Ireland |
Yes |
Taiwan |
Yes |
|
Israel |
Yes |
Tajikistan |
No |
|
Italy |
Yes |
Thailand |
Yes |
|
Japan |
Yes |
Turkey |
No |
|
Jordan |
No |
Ukraine |
No |
|
Kazakhstan |
No |
United Arab Emirates |
No |
|
Kuwait |
No |
United Kingdom |
Yes |
|
Kyrgyz Republic |
No |
United States |
Yes |
|
Latvia |
Yes |
Vietnam |
No |
|
Liechtenstein |
Yes |
Appendix B: Growth-Revenue Estimates Methodology
Calculating ITA Trade Flows
Data for calculating trade in ITA goods comes from the UN Comtrade Database. The database provides the value and weight of imports and exports between each country and its trading partners broken down by year and commodity type. Of the three classification systems provided by UN Comtrade, ITIF identified commodities codes covered under the ITA through the Harmonized Commodity Description and Coding System (HS). Since signatories first formed the ITA in 1996, HS1996 codes have identified product classification of ITA-covered imports. Similarly, negotiating countries of the 2015 ITA expansion identified ITA-covered goods using HS2007 codes. While the Harmonized System is extensive, some commodities covered under the ITA lack a relevant HS code. ITA clauses refer to these imports as “Attachment B” products.
As new iterations of the Harmonized System are released, more Attachment B products become accounted for under HS6 codes. Whereas ITIF’s 2017 analysis on the ITA utilizing HS2007 six-digit codes counted 144 product codes in the ITA-1 and 201 in the ITA-2, recounting them for this paper’s analysis on full ITA accession (plus ITA 3 Proposal) under their HS2017 six-digit codes identifies 149 codes included by ITA-1 and 192 codes in ITA-2. Beyond products recognized by the HS2017 update, ITIF’s analysis excludes those remaining Attachment B products for consistency purposes across countries.
From a list of more than 700 recommended product descriptions produced by industry leaders in international ICT trade, ITIF formed a set of 251 unique six-digit product codes according to the HS2017 classification system. To maintain consistency between modeling the ITA-3 with HS2017 codes versus modeling ITA membership in full (including ITA 3 Proposal), HS2007 codes for ITA-1 and ITA-2 identified by ITIF’s 2017 study, “How Joining the Information Technology Agreement Spurs Growth in Developing Nations,” are transposed to corresponding codes under HS2017.[157] Since the HS classification makes significant changes to its product groupings with each update, ITIF changed ITA-1 and ITA-2 codes from HS2007 first to HS2012 and then to HS2017 counterparts to ensure accuracy when comparing present import data for originally identified ITA-1 and ITA-2 products alongside proposed ITA-3 products.
While the most-specific product-coding maintained between all countries is at the six-digit level, only some HS six-digit codes listed under ITA coverage have all commodities within their coding included under the enacted/proposed agreement’s coverage. To capture the share of items per HS6 codes that are covered, ITIF used adjustment factors calculated from the UN Comtrade Database’s harmonized tariff schedule codes (HTS) for the United States, which further designate commodity classifications by 8-digit (HTS8) and even 10-digit (HTS10) codes. Adjustment factors are the shares of U.S. HTS8/HTS10 codes included by ITA coverage out of all products contained by a given HS6 code. Adjustment factors calculated this way are then applied as proxies to adjust import values for all countries in the model set.
In transposing ITA-1 and ITA-2 codes into the HS2017 six-digit level, some codes appear as duplicates appearing in two or even all lists. Duplicate codes appear due to either the six-digit commodity group only being partially covered in one agreement and then partially covered again in the other(s) or due to updates from HS2007 to HS2017 changing the types of commodities within that six-digit commodity line. Because the completed list of ITA products underwent multiple transformations, and in each of those transformations, some commodity codes did not fully translate onto its updated code, our finalized data on traded goods contains some degree of unavoidable error. UN Comtrade provides trade flows at the HS2017 six-digit level, and each country’s total value of ITA imports is summed based on each HS2017 six-digit line covered in ITIF’s list of ITA products. By multiplying these import-value sums per HS2017 six-digit code in every country by their corresponding proxy adjustment factor, ITIF accounted for the total value of HS codes partially covered by the ITA agreement.
Some products, however, within a commodity code may be similar enough to one another to be substituted for certain ICT products. As countries eliminate tariffs on ITA-covered products within a commodity, some consumers of non-ITA-covered substitutes within the same commodity code could expect to switch their demand to the product included by ITA coverage. This substitution effect would induce additional demand beyond what ITIF calculated using import demand elasticities, thus making capital stock growth from ITA accession more significant than what ITIF can compute from its growth-revenue model.
Calculating ITA Tariffs
Data for estimating the value of tariffs comes from the World Bank’s World Integrated Trade Solution (WITS) TRAINS database. ITIF’s model takes tariff line rates from the database and collapses that data to an HS6 basis using a simple average for each country. WITS TRAINS imports data provides most favored nation rates and preference rates between countries, allowing ITIF to produce trade-value-weighted average tariff rates applied to ITA products. The value of ITA tariff revenues are derived from the relative share of reported tariff revenues collected by the government. Data on the total reported tariff revenues collected by each country’s government comes from the OECD’s GRS Database. Since OECD data does not include Taiwan, the entry for Asia-Pacific approximates it instead. World Bank indicators on tariff/taxation revenue replace data for Pakistan. Therefore, the model assumes all international trade tax revenues are equivalent to tariff revenues. When extending this assumption, other tax-revenue sources collapse into broader categories to target specific tax effects when eliminating ITA tariffs.
ITIF calculated tariff revenue obtained from ITA imports by multiplying the import value of each ITA HS six-digit commodity by its corresponding most favored nation/preference-adjusted tariff derived from the WITS database. Next, the model takes the total reported WITS tariff revenue for all ITA imports. The first estimate expresses the unadjusted value of ITA tariff revenue as a share of total unadjusted tariff revenue. The model likely overestimates unadjusted tariff revenue because it does not discriminate against the country expectedly importing more from partners with which it has existing trade agreements. However, by adjusting this share by the actual tariff revenue obtained from the government, a suitable estimate for tariff revenue gained through ITA imports is derived, which partially accounts for the heterogeneity of tariffs across products and acknowledges ITA trade agreements’ tariff revenue-distorting effects.
Some further friction may occur within the adjusted ITA tariff revenues due to countries reporting their tax revenues by fiscal year compared with trade data reported by calendar year. Once adjusted by the actual tariff revenue, ITIF calculated the real effective tariff rate on ITA products by dividing the total value of ITA imports by the adjusted tariff revenue from ITA imports.
Appendix C: Methodology of Econometric Exercise
Estimated Regression Equations
Equation 1 details regression-model estimates on the relationship between 1996 ITA membership and ICT import intensity. Equation 2 details regression assessing the estimated relationship between 2015 ITA membership and ICT import intensity. Equation 3 details regression-model estimates of the relationship between 1996 ITA membership and ICT export intensity. Equation 4 details regression-model estimates of the relationship between 2015 ITA membership and ICT export intensity.
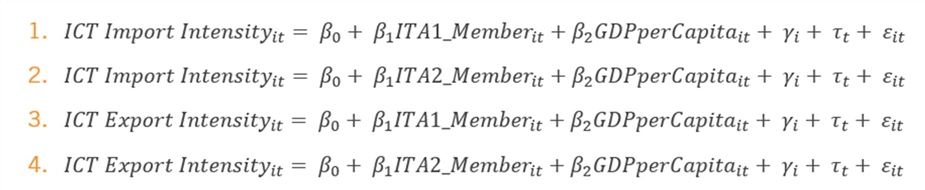
ICT Import Intensity is the dependent variable of the first two regressions, measured as the percentage of a nation’s imports in a given year comprising ICT or ICT-related products. ICT Export Intensity is the dependent variable of the last two, measured as the percentage of a nation’s exports in a given year comprising ICT or ICT-related products. These data series are taken from the World Bank Open Data indicators, “ICT Goods Imports (percent of total goods imports)” and “ICT Goods Exports (percent of total goods exports),” which have data from 2000 to 2019 for 216 countries, territories, and regions. “ITA1_Member” is a binary variable that assigns a value of 1 to countries that are presently members of the first ITA in a given year in the time series regressed and a value of 0 to countries that are not members of the first ITA during a given year. “ITA2_Member” is a binary variable coded the same way, except for membership to the 2015 ITA expansion. GDP per capita is a control covariate included in both regressions to approximately measure and control for changes in a nation’s level in development. These controls ensure that the regression models isolate impacts of the binary variables detailing levels of ITA membership. Data for GDP per capita is also taken from World Bank Open Data under the indicator “GDP per capita (current US$).” They symbol “γi” represents fixed effects attributable to a given country; “τt”represents fixed effects attributable to a given year; and “εit” is the error term. Table 12 provides summary statistics regarding the dataset used for the regression analysis.
Table 12: Summary statistics for dataset assessing ITA membership and ICT trade intensity[158]
|
Period |
Mean |
Std. Dev. |
Min. |
Max. |
No. of Observations |
|
|
ICT Import Intensity |
2000–2019 |
6.71 |
5.58 |
0.001 |
51.47 |
3220 |
|
ICT Export Intensity |
2000–2019 |
4.21 |
8.14 |
0.000 |
63.64 |
3088 |
|
GDP per Capita |
1960–2020 |
8535.40 |
17079.08 |
22.800 |
190512.70 |
9865 |
|
ITA-1_Member |
1996–2020 |
0.37 |
0.48 |
0.000 |
1.00 |
216 |
|
ITA-2_Member |
2015–2020 |
0.24 |
0.43 |
0.000 |
1.00 |
216 |
Appendix D: ITA Product Codes (HS2017 Six-Digit Level)[159]
|
ITA-2 Expansion |
ITA-3 Proposed Expansion |
||||||||||
|
381800 |
854470 |
851769 |
842490 |
852580 |
852712 |
902590 |
281290 |
630790 |
847989 |
852580 |
900490 |
|
841990 |
901710 |
851770 |
844331 |
852871 |
852713 |
902830 |
282739 |
680530 |
847990 |
852692 |
900691 |
|
846691 |
901720 |
851810 |
844339 |
852990 |
852719 |
902890 |
284590 |
681510 |
848071 |
852721 |
900699 |
|
846694 |
901790 |
851829 |
846693 |
853180 |
852729 |
903010 |
285000 |
690390 |
848180 |
852791 |
900850 |
|
846900 |
902680 |
851890 |
847290 |
854370 |
852792 |
903020 |
285390 |
690911 |
848410 |
852852 |
901090 |
|
847010 |
902730 |
852341 |
847310 |
901090 |
852799 |
903031 |
292090 |
690919 |
850110 |
852859 |
901110 |
|
847021 |
903040 |
852349 |
847340 |
901190 |
852849 |
903032 |
292111 |
700719 |
850131 |
852862 |
901180 |
|
847029 |
903082 |
852351 |
848610 |
901290 |
853630 |
903039 |
293139 |
701710 |
850132 |
852869 |
901190 |
|
847030 |
842490 |
852580 |
848620 |
901390 |
853810 |
903084 |
293190 |
702000 |
850133 |
852871 |
901210 |
|
847050 |
844331 |
852871 |
848630 |
902780 |
853939 |
903089 |
321590 |
731815 |
850134 |
852872 |
901290 |
|
847090 |
844339 |
852990 |
848640 |
902790 |
854320 |
903110 |
340220 |
741521 |
850161 |
852873 |
901320 |
|
847160 |
846693 |
853180 |
848690 |
350691 |
854330 |
903220 |
340290 |
741533 |
850162 |
852990 |
901380 |
|
847170 |
847290 |
854370 |
851490 |
370130 |
880390 |
903281 |
340590 |
760611 |
850163 |
853180 |
901390 |
|
847190 |
847310 |
901090 |
851590 |
370199 |
880521 |
950410 |
370110 |
761699 |
850164 |
853530 |
901814 |
|
847321 |
847340 |
901190 |
851761 |
370500 |
880529 |
950430 |
370242 |
820320 |
850431 |
853540 |
901819 |
|
847329 |
848610 |
901290 |
851830 |
370590 |
900120 |
950450 |
370244 |
820540 |
850440 |
853590 |
901890 |
|
847350 |
848620 |
901390 |
851840 |
370790 |
900190 |
950490 |
370710 |
830220 |
850450 |
853610 |
901910 |
|
850870 |
848630 |
902780 |
852290 |
390799 |
900220 |
842129 |
380110 |
830249 |
850490 |
853641 |
902580 |
|
851440 |
848640 |
902790 |
852329 |
841459 |
900290 |
842139 |
382499 |
841330 |
850511 |
853669 |
902610 |
|
851711 |
848690 |
702000 |
852340 |
841950 |
901050 |
842199 |
390230 |
841410 |
850519 |
853670 |
902620 |
|
851718 |
851490 |
842191 |
852352 |
842010 |
901060 |
847590 |
390290 |
841490 |
850520 |
853710 |
902690 |
|
851950 |
851590 |
843139 |
852359 |
842320 |
901310 |
847989 |
390469 |
841810 |
850590 |
853720 |
902710 |
|
852841 |
851761 |
847130 |
852380 |
842330 |
901410 |
850590 |
390599 |
841869 |
850610 |
853890 |
902720 |
|
852842 |
851830 |
847141 |
852910 |
842381 |
901420 |
851430 |
390730 |
841919 |
850640 |
853950 |
902750 |
|
852851 |
851840 |
847149 |
853190 |
842382 |
901480 |
851822 |
390740 |
841989 |
850650 |
853990 |
902780 |
|
852861 |
852290 |
847150 |
853650 |
842389 |
901490 |
852692 |
391000 |
842119 |
850660 |
854079 |
902790 |
|
853120 |
852329 |
847180 |
853690 |
842390 |
901510 |
852721 |
391732 |
842121 |
850680 |
854089 |
902810 |
|
853210 |
852340 |
847330 |
854231 |
842489 |
901520 |
852791 |
391740 |
842129 |
850720 |
854150 |
902820 |
|
853221 |
852352 |
847790 |
854232 |
844230 |
901540 |
880260 |
391910 |
842139 |
850730 |
854310 |
903033 |
|
853222 |
852359 |
851712 |
854233 |
844240 |
901580 |
900219 |
391990 |
842191 |
850740 |
854370 |
903120 |
|
853223 |
852380 |
852852 |
854239 |
844250 |
901590 |
901110 |
392049 |
842199 |
850750 |
854411 |
903141 |
|
853224 |
852910 |
852862 |
854290 |
844391 |
901811 |
901180 |
392099 |
842890 |
850760 |
854419 |
903180 |
|
853225 |
853190 |
852869 |
854390 |
845610 |
901812 |
901210 |
392119 |
843139 |
850780 |
854420 |
903289 |
|
853229 |
853650 |
852872 |
903090 |
845611 |
901813 |
901320 |
392190 |
844332 |
850790 |
854430 |
903290 |
|
853230 |
853690 |
853669 |
903149 |
845612 |
901820 |
901819 |
392310 |
844399 |
851130 |
854442 |
903300 |
|
853290 |
854231 |
853890 |
903190 |
847210 |
901850 |
901890 |
392321 |
845011 |
851180 |
854449 |
910291 |
|
853310 |
854232 |
854150 |
844332 |
847521 |
902150 |
902710 |
392329 |
845620 |
851190 |
854519 |
910511 |
|
853321 |
854233 |
854442 |
844399 |
847689 |
902190 |
903033 |
392610 |
845650 |
851410 |
854690 |
910591 |
|
853329 |
854239 |
854449 |
847990 |
847690 |
902212 |
903180 |
392690 |
845690 |
851430 |
854710 |
911320 |
|
853331 |
854290 |
854890 |
850440 |
851519 |
902213 |
401699 |
847130 |
851679 |
854720 |
911390 |
|
|
853339 |
854390 |
901380 |
850450 |
851821 |
902214 |
420212 |
847141 |
851712 |
854790 |
940310 |
|
|
853340 |
903090 |
902610 |
850490 |
851850 |
902219 |
420222 |
847149 |
851762 |
854890 |
940320 |
|
|
853390 |
903149 |
902620 |
851762 |
851981 |
902221 |
420291 |
847150 |
851769 |
870830 |
940390 |
|
|
853400 |
903190 |
902690 |
851769 |
851989 |
902229 |
420292 |
847180 |
851770 |
880211 |
940540 |
|
|
854110 |
844332 |
902720 |
851770 |
852110 |
902230 |
420299 |
847330 |
851810 |
880212 |
950691 |
|
|
854121 |
844399 |
902750 |
851810 |
852190 |
902290 |
420500 |
847480 |
851822 |
880220 |
960830 |
|
|
854129 |
847990 |
903141 |
851829 |
852321 |
902300 |
481940 |
847529 |
851829 |
880230 |
962000 |
|
|
854130 |
850440 |
851890 |
852550 |
902410 |
482190 |
847590 |
851890 |
880240 |
|||
|
854140 |
850450 |
852341 |
852560 |
902480 |
540771 |
847780 |
852341 |
880260 |
|||
|
854160 |
850490 |
852349 |
852610 |
902490 |
560311 |
847790 |
852349 |
900211 |
|||
|
854190 |
851762 |
852351 |
852691 |
902519 |
591140 |
847950 |
852351 |
900219 |
|||
*Note: ITA-1 and ITA-2 codes are converted to HS2017 codes from previous HS versions. This means some HS codes may appear in more than one list, given that product-code classifications change substantially between years. As a result, ITA-1 has a count of 149 product codes and ITA-2 has a count of 192 product codes, whereas their original counts from the HS version in the year such trade agreements were formed are 144 and 201, respectively.
Acknowledgments
The authors would like to thank Robert Atkinson and Alex Key for their assistance with this report.
About the Authors
ITIF Vice President, Global Innovation Policy Stephen J. Ezell focuses on science, technology, and innovation policy as well as international competitiveness and trade policy issues. He is the coauthor of Innovating in a Service Driven Economy: Insights Application, and Practice (Palgrave McMillan, 2015) and Innovation Economics: The Race for Global Advantage (Yale 2012).
About ITIF
The Information Technology and Innovation Foundation (ITIF) is an independent, nonprofit, nonpartisan research and educational institute focusing on the intersection of technological innovation and public policy. Recognized by its peers in the think tank community as the global center of excellence for science and technology policy, ITIF’s mission is to formulate and promote policy solutions that accelerate innovation and boost productivity to spur growth, opportunity, and progress.
For more information, visit us at www.itif.org.
Endnotes
[1]. Office of the United States Trade Representative (USTR), “U.S. and WTO Partners Begin Implementation of the Expansion of the Information Technology Agreement,” news release, July 2016, https://ustr.gov/about-us/policy-offices/press-office/press-releases/2016/july/us-and-wto-partners-begin.
[2]. For the purposes of this report, ITA-1 = The original 1996 ITA agreement; ITA-2 = the 2015 ITA expansion; and ITA-3 = future possible expansion to ITA-1 and -2. Moreover, for those nations not yet in the ITA-1 or ITA-2, this report examines the impact of their full ITA accession, all the way through the proposed ITA-3.
[3]. “Information Technology Agreement,” World Trade Organization, accessed November 1, 2016, https://www.wto.org/english/tratop_e/inftec_e/inftec_e.htm.
[4]. USTR, “U.S. and WTO Partners Begin Implementation of the Expansion of the Information Technology Agreement.”
[5]. Katherine Tepper, “Trade in ICT—An Important Pillar of Economic Growth and Prosperity” (BDI, 2019), https://english.bdi.eu/article/news/trade-in-ict-an-important-pillar-for-economic-growth-and-prosperity/.
[6]. Mark Knickrehm, Bruno Berthon, and Paul Daugherty, “Digital Disruption: The Growth Multiplier” (Accenture and Oxford Economics, 2016), 2, https://www.anupartha.com/wp-content/uploads/2016/01/Accenture-Strategy-Digital-Disruption-Growth-Multiplier.pdf.
[7]. Frank Gens et al., “IDC FutureScape: Worldwide IT Industry 2019 Predictions” (International Data Corporation, 2018), https://www.idc.com/getdoc.jsp?containerId=US44403818.
[8]. Information Technology Industry Council, “USMCA Brings Businesses into the 21st Century,” TechWonk, December 17, 2019, https://www.itic.org/news-events/techwonk-blog/usmca-brings-businesses-into-the-21st-century.
[9]. James Manyika et al., “Digital Globalization: The New Era of Global Flows” (McKinsey Global Institute, 2016), https://www.mckinsey.com/business-functions/mckinsey-digital/our-insights/digital-globalization-the-new-era-of-global-flows.
[10]. U.S. Bureau of Labor Statistics, “Long-term price trends for computers, TVs, and related items,” October 13, 2015, https://www.bls.gov/opub/ted/2015/long-term-price-trends-for-computers-tvs-and-related-items.htm.
[11]. World Trade Organization (WTO), “Merchandise Imports by Product Group, Annual,” accessed August 9, 2021, https://data.wto.org/.
[12]. Semiconductor Industry Association, “Global Semiconductor Sales Increase 29.2% Year-to-Year in June; Q2 Sales Up 8.3% Over Q1,” news release, August 2, 2021, https://www.semiconductors.org/global-semiconductor-sales-increase-29-2-year-to-year-in-june-q2-sales-up-8-3-over-q1/. For example, before the pandemic in Fall 2019, the World Semiconductor Trade Statistics (WSTS) program forecasted 2020 annual semiconductor sales to grow by 5.9 percent and 2021 annual sales to grow by 6.3 percent. Due to added demand from the pandemic, total sales in 2020 grew by 6.8 percent, and 2021 growth is forecast to grow by 19.7 percent. WSTS Fall 2019 and Spring 2021 Forecasts.
[13]. Stephen Ezell, “Boosting Exports, Jobs, and Economic Growth by Expanding the ITA” (Information Technology and Innovation Foundation, March 2012), https://itif.org/publications/2012/03/15/boosting-exports-jobs-and-economic-growth-expanding-ita.
[14]. Product categories for consideration under an expanded Information Technology Agreement. List created by representatives of global ICT enterprises and industries.
[15]. Robert D. Atkinson, “Competitiveness, Innovation and Productivity: Clearing Up the Confusion” (Information Technology and Innovation Foundation, August 2013), http://www2.itif.org/2013-competitiveness-innovation-productivity-clearing-up-confusion.pdf.
[16]. Robert D. Atkinson and Ben Miller, “A Policymaker’s Guide to Spurring ICT Adoption” (Information Technology and Innovation Foundation, June 2015), http://www2.itif.org/2015-policymaker-ict-adoption.pdf.
[17]. James Manyika et al., “How to Compete and Grow: A Sector Guide to Policy” (McKinsey Global Institute, March 2010), http://www.mckinsey.com/industries/public-sector/our-insights/how-to-compete-and-grow.
[18]. Oxford Economics, “Capturing the ICT Dividend: Using Technology to Drive Productivity and Growth in the EU” (Oxford Economics, September 2011), http://danielelepido.blog.ilsole24ore.com/files/oxford-economics.pdf.
[19]. Robert D. Atkinson and Andrew S. McKay, Digital Prosperity: Understanding the Economic Benefits of the Information Technology Revolution (Information Technology and Innovation Foundation, March 2007), 3, http://www.itif.org/files/digital_prosperity.pdf.
[20]. Elsadig Musa Ahmed and Rahim Ridzuan, “The Impact of ICT on East Asian Economic Growth: Panel Estimation Approach,” Journal of the Knowledge Economy, No. 4 (December 2013): 540–55, http://link.springer.com/article/10.1007%2Fs13132-012-0096-5.
[21]. Stephen J. Ezell and Robert D. Atkinson, The Good, the Bad, and the Ugly (and the Self-Destructive) of Innovation Policy: A Policymaker’s Guide to Crafting Effective Innovation Policy (Information Technology and Innovation Foundation, October 2010), https://itif.org/publications/2010/10/07/good-bad-and-ugly-innovation-policy.
[22]. Stephen Ezell, “The Benefits of ITA Expansion for Developing Countries” (Information Technology and Innovation Foundation, December 2012), 5, https://itif.org/publications/2012/12/16/benefits-ita-expansion-developing-countries.
[23]. The World Bank, Poverty Reduction and Economic Management Unit Africa Region, “Kenya Economic Update” (The World Bank, December 2010), http://siteresources.worldbank.org/KENYAEXTN/Resources/KEU-Dec_2010_with_cover_e-version.pdf.
[24]. Ibid.
[25]. Almas Heshmati and Wanshan Yang, “Contribution of ICT to the Chinese Economic Growth” (working paper, RATIO Institute and Techno-Economics and Policy Program, College of Engineering, Seoul National University, February 2006), https://docs.google.com/file/d/1oFItzryXSMXs2UYqYRRRBDONuD4O77q9CyeTB6tYh0T-C93xfDWnHfd1YbZH.
[26]. Ahmed and Ridzuan, “The Impact of ICT on East Asian Economic Growth.”
[27]. Richard Heeks, “ICT and Economic Growth: Evidence From Kenya,” ICTs for Development, June 26, 2011, http://ict4dblog.wordpress.com/2011/06/26/ict-and-economic-growth-evidence-from-kenya/.
[28]. Maryam Farhadi, Rahmah Ismail, and Masood Fooladi, “Information and Communication Technology Use and Economic Growth,” PLoS ONE 7, no. 11 (November 2012): 4–5, http://www.plosone.org/article/fetchObject.action?uri=info%3Adoi%2F10.1371%2Fjournal.pone.0048903&representation=PDF.
[29]. Ibid.
[30]. The International Bank for Reconstruction and Development (IBRD) and The World Bank, “2009 Information and Communications for Development: Extending Reach and Increasing Impact” (IBRD and the World Bank, July 21, 2009), https://openknowledge.worldbank.org/handle/10986/2636.
[31]. Nina Czernich et al., “Broadband Infrastructure and Economic Growth,” In CESifo Working Paper Series, Vol. 2861 (2009), https://papers.ssrn.com/sol3/papers.cfm?abstract_id=1516232.
[32]. Deloitte, GSMA, and Cisco, “What Is the Impact of Mobile Telephony on Economic Growth?” (GSM Association, November 2012), http://www.gsma.com/publicpolicy/wp-content/uploads/2012/11/gsma-deloitte-impact-mobile-telephony-economic-growth.pdf.
[33]. IBRD and The World Bank, “2009 Information and Communications for Development.”
[34]. Elena Toader et al., “Impact of Information and Communication Technology Infrastructure on Economic Growth: An Empirical Assessment for the EU Countries,” Sustainability, Vol. 10, 3750 (2018), https://www.mdpi.com/2071-1050/10/10/3750/pdf.
[35]. Ebrahim Hosseini Nasab and Majid Aghaei, “The effect of ICT on economic growth: Further evidence,” International Bulletin of Business Administration, Vol. 5 (2009): 46–56, https://www.researchgate.net/publication/237227348_The_Effect_of_ICT_on_Economic_Growth_Further_Evidence.
[36]. Bala Veeramacheneni, E.M. Ekanayake, and Richard Vogel, “Information Technology and Economic Growth: A Causal Analysis,” Southwestern Economic Review, Vol. 34 (2011): 75–88, http://swer.wtamu.edu/sites/default/files/Data/75-88-55-202-1-PB.pdf.
[37]. Andrey Zagorchev, Geraldo Vasconcellos, and Youngsoo Bae, “Financial development, technology, growth and performance: Evidence from the accession to the EU,” Journal of International Financial Markets, Institutions and Money, Vol. 21 (2011): 743–759, https://www.researchgate.net/publication/251636823_Financial_development_technology_growth_and_performance_Evidence_from_the_accession_to_the_EU.
[38]. Toader et al., “Impact of Information and Communication Technology Infrastructure on Economic Growth,” 16.
[39]. Thomas Niebel, “ICT and Economic Growth—Comparing Developing, Emerging and Developed Countries” (discussion paper no. 14-117, Centre for European Economic Research (ZEW), December 15, 2014), http://papers.ssrn.com/sol3/papers.cfm?abstract_id=2560771.
[40]. Khuong Vu, “Measuring the Impact of ICT Investments on Economic Growth,” Journal of Economic Growth (2005), https://www.hks.harvard.edu/m-rcbg/ptep/khuongvu/Key%20paper.pdf.
[41]. Ayoub Yousefi, “The Impact of Information and Communication Technology on Economic Growth: Evidence from Developed and Developing Countries,” Economics of Innovation and New Technology, Vol. 20 (2011): 581–596, https://www.tandfonline.com/doi/abs/10.1080/10438599.2010.544470.
[42]. Niebel, “ICT and Economic Growth.”
[43]. Ibid.
[44]. Muhammad Tariq Majeed and Tayba Ayub, “Information and communication technology (ICT) and economic growth nexus: A comparative global analysis,” Pakistan Journal of Commerce and Social Sciences, Vol. 12, Issue 2 (2018): 443–476.
[45]. M. Cardona, T. Kretschmer, and T. Strobel, “ICT and Productivity: Conclusions From the Empirical Literature,” Information Economics and Policy 25 (2013): 109–125.
[46]. European Parliamentary Research Service, ICT in the Developing World (Brussels, Belgium: European Commission, December 2015), http://www.europarl.europa.eu/RegData/etudes/STUD/2015/563482/EPRS_STU(2015)563482_EN.pdf; The World Bank, Information and Communications for Development 2009: Extending Reach and Increasing Impact (The World Bank, May 2009), http://elibrary.worldbank.org/doi/abs/10.1596/978-0-8213-7605-8.
[47]. T.D. Stanley, Chris Doucouliagos, and Piers Steel, “Does ICT Generate Economic Growth? A Meta-Regression Analysis” (working paper, Deakin University, Australia, 2015), https://ideas.repec.org/p/dkn/econwp/eco_2015_9.html.
[48]. Cardona, Kretschmer and Strobel, “ICT and Productivity.”
[49]. Michael Anderson, “The Information Technology Agreement: An Assessment of World Trade in Information Technology Products” (presentation, Joint Symposium of U.S.-China Advanced Technology Trade, Beijing, China, October 23–24, 2009), 7.
[50]. Xiaobing Tang and Roy Santana, “15 Years of the Information Technology Agreement: Trade, Innovation and Global Production Networks” (World Trade Organization, 2012), 3, https://www.wto.org/english/res_e/publications_e/ita15years_2012_e.htm.
[51]. Xiaobing Tang, “Information Technology Agreement (ITA)” (World Trade Organization, accessed May 15, 2017), http://www.miti.gov.my/miti/resources/fileupload/Rev_APEC_Workshop_ITA_TangX.pdf.
[52]. Padmashree Gehl Sampath and Bertha Vallejo, “Trade, Global Value Chains and Upgrading: What, When and How?” The European Journal of Development Research, Vol. 30, Issue 3 (2018): 481–504, https://link.springer.com/article/10.1057/s41287-018-0148-1.
[53]. Stephen Ezell, “Boosting Exports, Jobs, and Economic Growth Through the ITA,” The Innovation Files, March 22, 2012, https://itif.org/publications/2012/03/14/boosting-exports-jobs-and-economic-growth-through-ita.
[54]. Patrick Gillespie, “Argentina Tried a Trump-Like Tariff—and It Went Horribly Wrong,” CNN, December 19, 2016, http://money.cnn.com/2016/12/19/news/economy/tariffs-trump-argentina/.
[55]. Rosanna Pittiglio, “An Essay on Intra-Industry Trade in Intermediate Goods,” Modern Economy 5 (May 2014): 468–488.
[56]. United Nations Conference on Trade and Development, “Key Statistics and Trends in International Trade 2020” (UNCTAD, 2021), 11, https://unctad.org/system/files/official-document/ditctab2020d4_en.pdf.
[57]. Organization for Economic Cooperation and Development (OECD), World Trade Organization (WTO), and United Nations Conference on Trade and Development (UNCTAD), “Implications of Global Value Chains for Trade, Investment, Development, and Jobs” (St. Petersburg: G-20 Leaders Summit, OECD, WTO, and UNCTAD, August 6, 2013), 20, http://www.oecd.org/sti/ind/G20-Global-Value-Chains-2013.pdf.
[58]. Ibid.
[59]. Organization for Economic Cooperation and Development, “Trade in Value Added (TiVA) Indicators: EXGR_FVASH: Foreign value added share of gross exports and EXGR_DVAFXSH: Domestic value added embodied in foreign exports as share of gross exports,” accessed August 9, 2021, https://www.oecd.org/sti/ind/measuring-trade-in-value-added.htm.
[60]. OECD, WTO, and UNCTAD, “Implications of Global Value Chains.”
[61]. Susan Lund et al., “Risk, resilience, and rebalancing global supply chains” (McKinsey Global Institute, August 2020), iv, https://www.mckinsey.com/business-functions/operations/our-insights/risk-resilience-and-rebalancing-in-global-value-chains; Jeff Masters, “Earth’s 40 Billion-Dollar Weather Disasters of 2019: 4th Most Billion-Dollar Events on Record,” Eye of the Storm, Scientific American, January 22, 2020, https://blogs.scientificamerican.com/eye-of-the-storm/earths-40-billion-dollar-weather-disasters-of-2019-4th-most-billion-dollar-events-on-record/; Matteo Coronese et al., “Evidence for sharp increase in the economic damages of extreme natural disasters,” Proceedings of the National Academy of Sciences, Volume 116, Number 43 (October 2019), https://www.pnas.org/content/116/43/21450.
[62]. Hearing on U.S.-India Trade Relations: Opportunities and Challenges, Before the House Committee on Ways and Means Subcommittee on Trade, 113th Cong. (2013) (written statement of Stephen J. Ezell, ITIF), http://www2.itif.org/2013-us-india-trade-relations-opportunities-challenges.pdf.
[63]. Michael Anderson and Jacob Mohs, “The Information Technology Agreement: An Assessment of World Trade in Information Technology Products,” United States International Trade Commission Journal of International Commerce and Economics (International Trade Commission, January 2010), 19, https://www.usitc.gov/publications/332/journals/05_andersonmohs_itagreement.pdf.
[64]. The World Bank (ICT goods exports as a % of goods exports; accessed August 6, 2021), http://data.worldbank.org/indicator/TX.VAL.ICTG.ZS.UN.
[65]. India Brand and Equity Foundation, “IT & BPM Industry in India,” July 28, 2021, https://www.ibef.org/industry/information-technology-india.aspx.
[66]. The World Bank (ICT services exports; accessed August 6, 2021), http://data.worldbank.org/indicator/BX.GSR.CCIS.ZS.
[67]. Bijit Bora and Xuepeng Liu, “Evaluating the Impact of the WTO Information Agreement,” in Light the Lamp: Papers on World Trade and Investment in Memory of Bijit Bora, edited by Christopher Findlay, Mari Pangestu, and David Parsons (World Scientific, 2010).
[68]. Christian Henn and Arevik Gnutzmann-Mkrtchyan, “The Layers of the IT Agreement’s Trade Impact” (working paper no. ERSD-2015-01, World Trade Organization, February 2015), https://www.wto.org/english/res_e/reser_e/ersd201501_e.htm.
[69]. Ibid.
[70]. Ibid.
[71]. GDP per capita is selected as a control, as it approximates changes in a country’s level of development in the overall economy observable over time. Country fixed effects account for the many other country-specific factors, such as human capital and policy stances, that undoubtedly impact ICT trade. Year fixed effects account for all other shocks and changes in the global trade environment occurring in a given year since it would be impossible to identify all such factors individually in the models.
[72]. Authors’ econometric analysis on World Bank Open Data indicator, “ICT goods imports (% total goods imports).”
[73]. Semiconductor Industry Association, “The Benefits of Including Multi-Component Semiconductors in an Expanded Information Technology Agreement,” December 8, 2014, https://www.semiconductors.org/the-benefits-of-including-multi-component-semiconductors-in-an-expanded-information-technology-agreement/.
[74]. Stephen Ezell, “An Allied Approach to Semiconductor Leadership” (Information Technology and Innovation Foundation, September 2020), https://itif.org/publications/2020/09/17/allied-approach-semiconductor-leadership.
[75]. Stephen Ezell, “Short-term Chip Shortages Don’t Merit Government Intervention; Long-term Competitiveness in the Semiconductor Industry Does,” Innovation Files, February 18, 2021, https://itif.org/publications/2021/02/18/short-term-chip-shortages-dont-merit-government-intervention-long-term.
[76]. SemisMatter, “Powering the Economy,” http://www.semismatter.com/why/; John Pitzer, Managing Director, Credit Suisse (Remarks at SIA Event: “Big Opportunities, Looming Challenges: The State of the U.S. Semiconductor Industry,” July 9, 2020), https://www.semiconductors.org/events/big-opportunities-looming-challenges-the-state-of-the-u-s-semiconductor-industry/.
[77]. Caroline Messecar, “Power electronics driving new demand for metals,” Argus, August 13, 2021, https://www.argusmedia.com/en/news/2246971-power-electronics-driving-new-demand-for-metals.
[78]. Steven R. Nadel et al., “Energy-Efficient Motor Systems: A Handbook on Technology, Program, and Policy Opportunities, Second Edition” (American Council for an Energy-Efficient Economy, 2009), https://www.aceee.org/ebook/energy-efficient-motor-systems.
[79]. Colin Cunliff, “Beyond the Energy Techlash: The Real Impacts of Information Technology” (Information Technology and Innovation Foundation, July 2020), https://itif.org/sites/default/files/2020-energy-techlash.pdf.
[80]. American Council for an Energy Efficient Economy (ACEEE), “Semiconductor Technologies: The Potential to Revolutionize U.S. Energy Productivity,” (ACEEE, May 2009), https://www.aceee.org/semiconductor-technology-potential-revolutionize-us-energy-productivity.
[81]. Ibid., 32–36.
[82]. Ibid., 33–34.
[83]. Since the 2000s, the doubling in peak computing efficiency—computing efficiency at peak output—has slowed to every 2.7 years. However, most devices run only a fraction of the time at peak output (1 percent for mobile devices and laptops, 10 percent for enterprise data servers). Typical-use efficiency, a metric that considers average efficiency across a year, has continued to double every 1.5 years. Jonathan G. Koomey et al., "Implications of Historical Trends in the Electrical Efficiency of Computing," in IEEE Annals of the History of Computing, vol. 33, no. 3, 46–54, March 2011, https://ieeexplore.ieee.org/document/5440129; Sam Naffziger and Jonathan Koomey, “Energy Efficiency of Computing: What’s Next?” (Electronic Design, 2016), https://www.electronicdesign.com/technologies/microprocessors/article/21802037/energy-efficiency-of-computing-whats-next; Jonathan Koomey and Samuel Naffziger, “Moore’s Law Might be Slowing Down, But Not Energy Efficiency” (IEEE Spectrum, 2015), https://spectrum.ieee.org/computing/hardware/moores-law-might-be-slowing-down-but-not-energy-efficiency.
[84]. U.S. Environmental Protection Agency, “Report to Congress on Server and Data Center Energy Efficiency Public Law 109-431” (U.S. EPA, 2008), https://eta.lbl.gov/publications/report-congress-server-data-center.
[85]. Eric Masanet et al., “Recalibrating global data center energy-use estimates,” Science (2020), https://science.sciencemag.org/content/367/6481/984.
[86]. Ibid.
[87]. Ralph J. Muenster, "Shade Happens," Renewable Energy World, February 2, 2009.
[88]. N. Fernandez et al., “Impacts of Commercial Building Controls on Energy Savings and Peak Load Reduction,” Pacific Northwest National Laboratory, Richland, WA, Vol. 25985, 2017, https://buildingretuning.pnnl.gov/publications/PNNL-25985.pdf.
[89]. Sila Kiliccote et al., “Characterization of Demand Response in Commercial, Industrial, and Residential Sectors in the U.S.,” WIREs Energy Environ., Vol. 5, 2016, 288–304, https://onlinelibrary.wiley.com/doi/full/10.1002/wene.176.
[90]. International Energy Agency (IEA), Digitalisation and Energy (IEA, 2017), 45, https://www.iea.org/reports/digitalisation-and-energy.
[91]. “Innovations in Sensors and Controls for Building Energy Management” (DOE Building Technologies Office, 2020), https://www1.eere.energy.gov/buildings/pdfs/75601.pdf.
[92]. ITIF adaptation of IEA, “Cumulative energy savings in buildings from widespread digitalisation in selected countries, 2017–2040” (IEA, 2020), https://www.iea.org/data-and-statistics/charts/cumulative-energy-savings-in-buildings-from-widespread-digitalisation-in-selected-countries-2017-2040.
[93]. Stephen Ezell, “Why Manufacturing Digitalization Matters and How Countries Are Supporting It” (ITIF, May 2018), 1, https://www2.itif.org/2018-manufacturing-digitalization.pdf.
[94]. James Manyika et al., “The Internet of Things: Mapping the Value Beyond the Hype” (McKinsey Global Institute, June 2015), 68, http://www.mckinsey.com/.
[95]. Peter C. Evans and Marco Annunziata, “Industrial Internet: Pushing the Boundaries of Minds and Machines” (GE, November 26, 2012), 3, www.ge.com/docs/chapters/Industrial_Internet.pdf.
[96]. International Trade Center, “TradeMap: Global Totals of Industrial Robots and 3-D Printers,” https://www.trademap.org/Index.aspx.
[97]. International Federation of Robots, “IFR presents World Robotics Report 2020,” news release, September 24, 2020, https://ifr.org/ifr-press-releases/news/record-2.7-million-robots-work-in-factories-around-the-globe.
[98]. Ibid.
[99]. “Industrial Robots Market Size,” Fortune Business Insight (accessed August 4, 2021), https://www.fortunebusinessinsights.com/industry-reports/industrial-robots-market-100360.
[100]. International Federation of Robotics, “The Impact of Robots on Productivity, Employment and Jobs” (International Federation of Robotics, April 2017), 3, https://ifr.org/img/office/IFR_The_Impact_of_Robots_on_Employment.pdf.
[101]. Georg Graetz and Guy Michaels, “Robots at Work” (Center for Economic Performance, November 11, 2017), http://personal.lse.ac.uk/michaels/Graetz_Michaels_Robots.pdf.
[102]. Ibid.
[103]. Ibid., 22.
[104]. Ibid., 33.
[105]. Ibid., 5, 30.
[106]. James Manyika et al., “A Future That Works: Automation, Employment and Productivity” (McKinsey Global Institute, 2017), 22, https://www.mckinsey.com/~/media/mckinsey/featured%20insights/Digital%20Disruption/Harnessing%20automation%20for%20a%20future%20that%20works/MGI-A-future-that-works-Executive-summary.ashx.
[107]. Michael Zinser, Justin Rose, and Hal Sirkin, “The Robotics Revolution: The Next Great Leap in Manufacturing” (Boston Consulting Group, September 2015), https://www.bcg.com/publications/2015/lean-manufacturing-innovation-robotics-revolution-next-great-leap-manufacturing.
[108]. “What Is 3D Printing?” 3D Printing.com, accessed October 12, 2016, http://3dprinting.com/what-is-3d-printing/.
[109]. Stephen Ezell, “A Policymaker’s Guide to Smart Manufacturing” (ITIF, November 2016), 11–12, https://itif.org/publications/2016/11/30/policymakers-guide-smart-manufacturing.
[110]. HP, “HP Inc. and Partners Mobilize 3D Printing Solutions to Battle COVID‐19,” news release, March 24, 2020, https://press.hp.com/us/en/press-releases/2020/hp-inc--and-partners-mobilize-3d-printing-solutions--to-battle-c.html.
[111]. Advanced Manufacturing Crisis Production Response (AMCPR), “America Makes COVID-19 Response Assessing the Role of Additive Manufacturing in Support of the U.S. COVID-19 Response” (AMCPR, March 2021), https://www.fda.gov/media/150615/download.
[112]. “3D Printing Market Size, Share & Trends Analysis Report By Component, By Printer Type, By Technology, By Software, By Application, By Vertical, By Material, By Region And Segment Forecasts, 2021 – 2028,” Intrado, May 26, 2021, https://www.reportlinker.com/p06075841/?utm_source=GNW.
[113]. Raoul Leering, “3D printing is a threat to world trade but its impact is still limited,” ING Bank, August 5, 2021, https://think.ing.com/articles/the-threat-for-world-trade-is-limited-for-now.
[114]. Don Hofstrand, “Can We Meet the World's Growing Demand for Food?” AgMRC Renewable Energy & Climate Change Newsletter, February 2014, https://www.agmrc.org/.
[115]. “Precision Farming Market Size, Share & Trends Analysis Report By Offering, By Application (Yield Monitoring, Weather Tracking, Field Mapping, Crop Scouting), By Region, And Segment Forecasts, 2021 – 2028,” Grand View Research, March 2021, https://www.grandviewresearch.com/industry-analysis/precision-farming-market; Remi Schmaltz, “What is precision agriculture?” AgFunderNews, April 24, 2017, https://agfundernews.com/what-is-precision-agriculture.html.
[116]. Benjamin Pinguet, “The Role of Drone Technology in Sustainable Agriculture,” Precision Ag, May 25, 2021, https://www.precisionag.com/in-field-technologies/drones-uavs/the-role-of-drone-technology-in-sustainable-agriculture/.
[117]. Stephen Ezell, Mark Schultz, and David Lund, “Innovate4Health: How Innovators Are Solving Global Health Challenges” (ITIF and the Center for the Protection of Intellectual Property, April 2018), 53–54, https://www2.itif.org/2018-innovate-4-health-case-studies.pdf.
[118]. Edward Rwema, “Saving Lives in Rwanda, with US-made Drones,” VOA, October 19, 2016, https://www.voanews.com/a/california-startup-drones-life-saving-medicine-rwanda/3558360.html.
[119]. Ibid.
[120]. Jon Porter, “Zipline’s drones are delivering medical supplies and PPE in North Carolina,” The Verge, May 27, 2020, https://www.theverge.com/2020/5/27/21270351/zipline-drones-novant-health-medical-center-hospital-supplies-ppe.
[121]. Andrew J. Hawkins, “UPS and CVS will use drones to deliver prescriptions in Florida,” April 27, 2020, https://www.theverge.com/2020/4/27/21238196/ups-cvs-drone-delivery-medicine-florida-coronavirus.
[122]. Mike Murphy, “This could be a huge moment for delivery drones. Why aren’t they taking off?” Protocol, April 18, 2020, https://www.protocol.com/alphabet-wing-drone-delivery-coronavirus.
[123]. “Global Unmanned Aerial Vehicle (UAV) Market Report 2021-2026 - Rising Demand for Contactless Deliveries of Medical Supplies and Other Essentials Using Drones Owing to COVID-19,” Research and Markets, June 28, 2021, https://www.globenewswire.com/en/search/organization/Research%2520and%2520Markets.
[124]. National Research Council and Institute of Medicine, Board on Science, Technology, and Economic Policy, “Medical Innovation in the Changing Healthcare Marketplace: Conference Summary” (National Academies Press, 2002), 3, https://www.ncbi.nlm.nih.gov/books/NBK220598/.
[125]. AdvaMed, “Job Creation,” https://www.advamed.org/medical-device-industry-facts/job-creation/.
[126]. Congressional Research Service, “Expansion of WTO Information Technology Agreement Targets December Conclusion” (CRS, July 2015), https://sgp.fas.org/crs/misc/IN10331.pdf.
[127]. Gilbert Cette and Jimmy Lopez, “ICT Demand Behavior: An International Comparison,” Economics of Innovation and New Technology 12 (2012): 397–410. Cette and Lopez calculated the elasticity for ICT demand for the United States over a 20-year period, showing that the price demand for ICT changes over time. The trend follows an inverted-U shape, increasing in elasticity for a peak in the 1990s before falling. To simplify our estimates, we chose a static elasticity of 1.3—which is about the middle of the elasticity range shown in the paper. This is to partially account for the difference in technological levels between the United States and developing nations, as well as the difference in technological levels between developing nations.
[128]. Cardona, Kretschmer, and Strobel, “ICT and Productivity.”
[129]. Author’s analysis from United Nations Comtrade Database, United Nations Main Aggregates Database, World Bank World Integrated Trade Solutions Database, and International Trade Center Trade Map Database.
[130]. Ibid.
[131]. Current ICT capital stocks are developed through a perpetual inventory method using a depreciation rate of 32.4 percent and GDP growth rates for each of the six countries, averaged between 2010 and 2014. First, we assume that annually, all our study countries invest in similar asset mixes of ICT goods (i.e., annually, each of our study countries invest 20 percent of all ICT investment in telecommunications equipment, 20 percent in IT equipment, and 60 percent in software). This asset mix is adapted from OECD’s Science, Technology and Industry Scoreboard 2015 and slightly adjusted to reflect a more likely asset mix for a developing country. Conference Board, Total Economy Database (key findings; accessed October 1, 2016), https://www.conference-board.org/data/economydatabase/.
[132]. Author’s analysis from United Nations Comtrade Database, United Nations Main Aggregates Database, World Bank World Integrated Trade Solutions Database, and International Trade Center Trade Map Database.
[133]. Stephen Ezell and John Wu, “How Joining the Information Technology Agreement Spurs Growth in Developing Nations” (Information Technology and Innovation Foundation, May 2017), https://www2.itif.org/2017-ita-spurs-growth-developing-nations.pdf; Bora and Liu, “Evaluating the Impact of the WTO Information Agreement”; Henn and Gnutzmann-Mkrtchyan, “The Layers of the IT Agreement’s Trade Impact.”
[134]. Niebel, “ICT and Economic Growth.”
[135]. Cardona, Kretschmer, and Strobel, “ICT and Productivity.”
[136]. Ibid.
[137]. Author’s calculations used OECD Global Revenue Statistics Database on Indicator 5123 (Customs and Import Duties), querying Tax Revenue as percentage of GDP and International Monetary Fund Government Finance Statistics Dataset for Pakistan data.
[138]. Ibid.
[139]. OECD, “Global Revenue Statistics Database” (accessed August 9, 2021), https://www.oecd.org/tax/tax-policy/global-revenue-statistics-database.htm.
[140]. Authors’ calculations on tariff rate and OECD Global Revenue Statistics Database.
[141]. Authors’ analysis from UN Comtrade Database, UN Main Aggregates Database, World Bank World Integrated Trade Solutions Database.
[142]. World Trade Organization, “WTO | Development - Who are the developing countries in the WTO?” https://www.wto.org/english/tratop_e/devel_e/d1who_e.htm.
[143]. Authors’ analysis from UN Comtrade Database, UN Main Aggregates Database, World Bank World Integrated Trade Solutions Database, and International Trade Center Trade Map Database.
[144]. Recreating the model’s methodology for full ITA benefits requires tracking import and tariff data for all six-digit HS codes in the original ITA, ITA-2, and the proposed ITA-3 for the group of four countries not in the ITA whatsoever. For the two countries having joined only the original ITA, ITIF tracked import and tariff data for all six-digit HS codes in the 2015 expansion and the proposed ITA-3.
[145]. Authors’ analysis from UN Comtrade Database, UN Main Aggregates Database, World Bank World Integrated Trade Solutions Database, and International Trade Center Trade Map Database.
[146]. United States International Trade Commission (ITC), “Economic Impact of Trade Agreements Implemented Under Trade Authorities Procedures, 2016 Report” (ITC, June 2016), 147–148, https://www.usitc.gov/publications/332/pub4614.pdf.
[147]. Authors’ analysis of UN Comtrade data.
[148]. U.S. International Trade Administration, “Commerce Department Celebrates World Trade Week,” press release, May 17, 2010, http://trade.gov/press/press-releases/2010/commerce-department-celebrates-world-trade-week-051710.asp.
[149]. Josh Bivens, “Updated employment multipliers for the U.S. economy” (Economic Policy Institute, January 2019), 5, https://files.epi.org/pdf/160282.pdf.
[150]. Statista, “Global market share of the information and communication technology (ICT) market from 2013 to 2021, by selected country,” https://www.statista.com/statistics/263801/global-market-share-held-by-selected-countries-in-the-ict-market/.
[151]. Ezell, “Boosting Exports, Jobs, and Economic Growth by Expanding the ITA,” 7.
[152]. Mihir Desai, C. Fritz Foley, and James R. Hines, Jr., “Foreign Direct Investment and Domestic Economic Activity” NBER Working Paper No. W11717 (2005) table 2, equation 4, https://papers.ssrn.com/sol3/papers.cfm?abstract_id=837160.
[153]. Katherine Linton, Alexander Hammer, and Jeremy Wise, China: Effects of Intellectual Property Infringement and Indigenous Innovation Policies on the U.S. Economy (Washington, D.C.: U.S. International Trade Commission, May 2011), 4–17, http://www.usitc.gov/publications/332/pub4226.pdf.
[154]. Bivens, “Updated employment multipliers for the U.S. economy,” 5.
[155]. Antonio Varas et al., “Strengthening the Global Semiconductor Supply Chain in an Uncertain Era” (Boston Consulting Group, April 2021), https://www.bcg.com/en-us/publications/2021/strengthening-the-global-semiconductor-supply-chain.
[156]. World Trade Organization, “Information Technology Agreement – Schedules of Concessions,” https://www.wto.org/english/tratop_e/inftec_e/itscheds_e.htm. (Note that, following publication of this report, Lao PDR joined the ITA and ITA-2 in 2022.)
[157]. Ezell and Wu, “How Joining the Information Technology Agreement Spurs Growth in Developing Nations.”
[158]. Authors’ econometric analysis on World Bank Open Data indicators.
[159]. HS2017 six-digit codes from United Nations Comtrade Database. ITA-3 codes are taken directly as HS2017 codes. ITA-1 and ITA-2 codes are converted to HS2017 codes from previous HS versions. Note, this means some HS codes may appear in more than one list, given that product code classifications change substantially between years. As a result, ITA-1 has a count of 149 product codes and ITA-2 has a count of 192 product codes, whereas their original counts from the HS version in the year such trade agreements were formed count 144 and 201, respectively.
