

Prices Aren’t Everything, Especially when Markets Fail: A Critique of the Mainstream’s Take on the Fed’s Bulletin on Family Finances ‘07-‘10
Introduction
The Encyclopedia Britannica, under its definition of the price system states that “Prices are an expression of the consensus on the values of different things.” Unfortunately, mainstream neoclassical economic analysis buys into this notion. The underlying belief is that prices tell us everything we need to know. As a result, the neoclassical economics myopic focus on price, blinds them to what is happening in the real economy and as such, leads policy makers to miss key things going on in the economy.
A case in point; most economist and policy makers were not able realize that the rapid run-up stock market values in the late 1990s (the so-called dot-com bubble) was in fact a bubble that they did not reflect underlying value. Likewise during the early and mid-2000s the run up in housing prices was seen by most economists as an underlying reflection of value, based upon supply and demand (which can never be wrong). This holds true on the downside as well. A prime example is the recent Federal Reserve’s bulletin: Changes in U.S. Family Finances from 2007 to 2010. If supposed real value went up in the bubble it had to come crashing down in the collapse. And this is why the report stated that "Americans saw wealth plummet 40 percent;" a statistic picked up over and over by the media.
But did American’s really see wealth plummet by 40 percent? There were more houses in 2010 than in 2007 and the future net present expected earnings of publically traded corporations was likely the same if not greater in 2010 than in 2007. But the overriding focus of neo-classical economics on prices as a true reflection of value leads to reports, like the one from Federal Reserve, that imply that Americans saw their wealth plummet by nearly 40 percent in just 3 years.
If only it were so easy. Prices are simply an outcome or reflection of underlying mechanisms; the real economic analysis can only be done once this is fully understood. Today, when a large number of important markets suffer from some sort of market failure (or a multitude of them), to rely solely upon price data to tell us about welfare (real wealth) is folly.

Many analysts and media outlets utilize neoclassical economic models as if they were representative of reality. Unfortunately, these models present markets like a perfectly placid pool, and thus by looking at the reflection (prices) in the water they claim that they are able to view the world with perfect clarity.
Unfortunately, when even a slight breeze disturbs the water (an assumption fails to be met), the image (price) of the world around us becomes distorted. Thus, we may be able to infer very little depending upon how many and what the magnitude of the disruptions are. This is where the problem lies; many believe that they are able to see clearly from the reflection amidst gale force winds.
As I outlined in my recent blog, the report shows that there were clear winners and losers, but to generalize that all Americans lost 40 percent of their wealth is an error that leads the public to believe something that is simply untrue. A critical underlying fact missed by nearly every media outlet is that there are life-cycle wealth accumulation patterns. These patterns play a key role in determining who the winners and losers are; or will be.
Life-Cycle Wealth Accumulation
The media has latched onto the idea American’s wealth has been destroyed, taking it back to levels not seen since the early 1990s. However, this misses the key fact. Real wealth did not disappear. For example, there were 23% more homes in 2010 than there were in 1990 while at the same time the average size of a new home grew over 16% from 1990 to 2009.
Clearly some people lost wealth at least in terms of the price for which they can sell their assets. However, some people will gain wealth because they were able to buy assets for a much lower price. As a case study, my wife and I are a prime example. We played it safe during the housing bubble, not entering when it was obvious that our potential high mortgage payment would put us in a precarious position. When mortgage payments were over double the local rental rates, it seemed ludicrous to buy. Rather, we saved our pennies (although as indicated by the Fed’s bulletin: not as many pennies as our parents had when they were our age after accounting for inflation.) However, when the housing market crashed, we were in prime shape to take advantage. We bought our first home in 2010 for 10% lower than the original sale price of 2002 and less than half the price in 2007. If we had had the money to buy we would have bought stock too. But now that I have a real job with a 401k I am buying stock too and able to buy it for less than if the collapse had not happened. Over the next 20 years the expected gains are substantial, not only in housing, but also in the stock market. We have been able to buy more shares in solid companies and funds than we would have ever been able during the market run-up of '04-'07. If “buy-low, sell-high” is the goal, then we potentially have done very well.
So, if individuals in my situation were actually winners who were the losers, and why? To answer the question, we need to step back and consider where different people in the U.S. stood prior to and then during the housing bubble.
A basic breakdown of an average worker’s wealth life-cycle needs to consider at least three different categories through which wealth accumulation can occur: Housing Assets, Investments (Stock), and Income (Discounted present value of all future income). The following tables break down the population into key subgroups that have been affected in dramatically different ways by the housing and stock market bubble and subsequent crash. Tied to lifetime wealth-accumulation patterns, the first group to consider are the Baby-Boomers and Retirees who have high accumulated wealth (Housing and Stock Market Assets), but very low income-based wealth (future earnings). The second are the Gen-Xers and younger (low accumulated wealth, with very high income-based wealth). Then within these two major groups, I further breakdown based upon decisions made during the housing and stock market bubbles of '04 to '07 and the ramifications for wealth in 2010 and beyond.
TABLE 1: Effect of the Housing Market Bubble on Wealth (Real vs. Book Wealth)
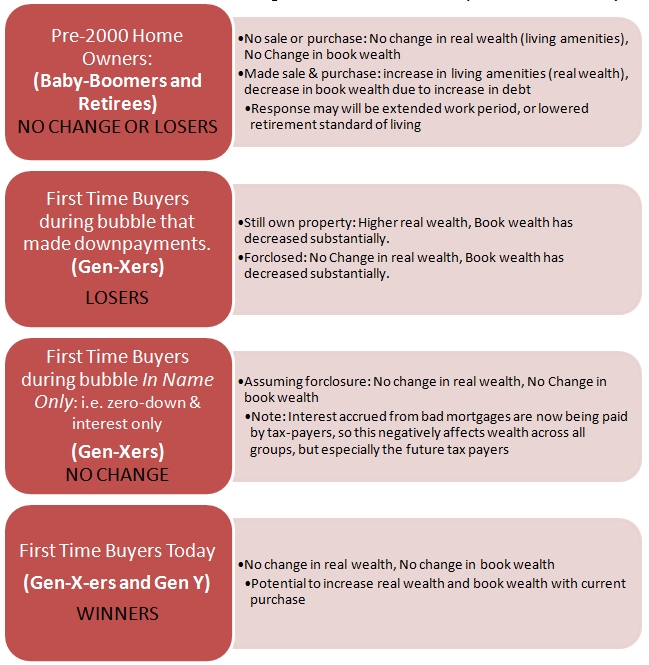
TABLE 2: Effect of the Stock Market Bubble
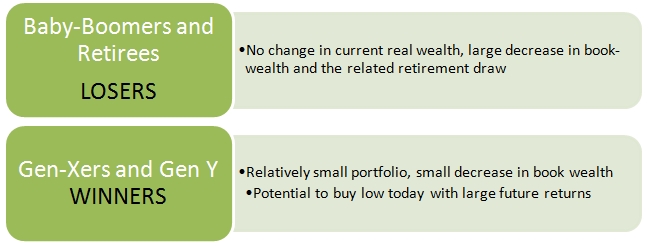
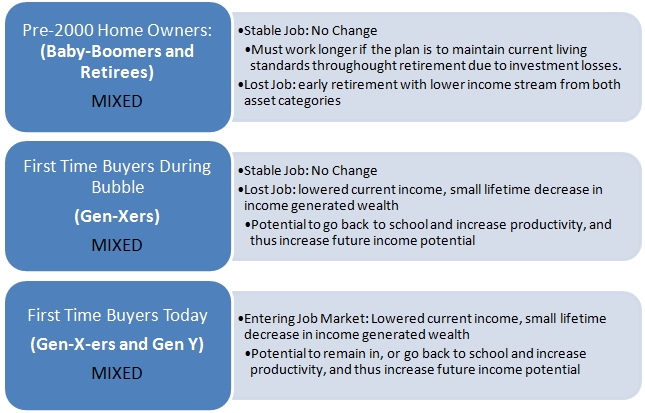
TABLE 3: Effect of the Job Market on Wealth (Current vs. Future Affects from Discounted future Income Flows)
It is clear that real wealth did not drop 40 percent. The biggest losers are those who were first time buyers between 2000 and 2007 and bought assets (housing and stocks) at inflated prices. People who owned most of their assets before that are actually in about the same position as they would have been absent the bubble and collapse. And young people or people who didn’t buy housing or a lot of stocks during the bubble years can now buy assets more cheaply are better off.
In other words, wealth was not destroyed, rather different people lost and gained and that related in part to generations. The idea that wealth is transferred from one generation to the next is not new (actively pursued through estate planning, and unintended in cases such as the Great Recession), and there has been a significant amount of recent work by academics who have noticed the trends over the last decade. Forgone earnings in one generation are often captured by those that overlap; as real wealth is not destroyed, rather transferred from one individual to another. Glover et al. (2011), using a 3 generation model find exactly what has been concluded thus far regarding the real winners and losers of the Great Recession:
"...we find that older households suffer large welfare losses from a severe, long-lasting recession. Young households, in contrast, lose less and might even benefit from an economic downturn. The key statistic determining these welfare consequences is the size of the equilibrium asset price decline, relative to the fall in wages and output. If households have a low intertemporal elasticity of substitution, then middle-aged households are keen to sell their assets in a downturn in order to smooth consumption, putting additional downward pressure on asset prices. This generates larger welfare losses for older households and potential welfare gains for households that become economically active during the recession and buy assets at re fire sale prices."
So, what is the take away? Of course current book-values of the Gen-Xers have been hit hard. The first asset most families purchase is a home, and then they slowly build up their portfolio over their careers. Therefore, their current book measure of “wealth” has been disproportionately hit. However, it is still the same house; and, future buyers of it are better off. So the lesson for policy makers is to not confuse prices with value. Sometimes they are the same, sometimes they are not. Economic policy would be on a stronger footing if it kept its eye on the real economy (e.g., the number of houses being produced) and not just the price-based economy.
